Article

Alterations in Yeast Species Composition of Uninoculated Wine Ferments by the Addition of Sulphur Dioxide

1
The Australian Wine Research Institute, PO Box 197, Glen Osmond SA 5064, Australia
2
School of Agriculture, Food & Wine, Faculty of Sciences, University of Adelaide, Adelaide SA 5005, Australia
3
School of Biological Sciences, University of Adelaide, Adelaide SA 5005, Australia
*
Author to whom correspondence should be addressed.
Contributed equally.
Submission received: 3 June 2020 / Revised: 18 June 2020 / Accepted: 19 June 2020 / Published: 23 June 2020
(This article belongs to the Special Issue Enological Repercussions of Non-Saccharomyces Species 2.0)

Abstract

:
Uninoculated wine fermentations are conducted by a consortium of wine yeast and bacteria that establish themselves either from the grape surface or from the winery environment. Of the additives that are commonly used by winemakers, sulphur dioxide (SO2) represents the main antimicrobial preservative and its use can have drastic effects on the microbial composition of the fermentation. To investigate the effect of SO2 on the resident yeast community of uninoculated ferments, Chardonnay grape juice from 2018 and 2019 was treated with a variety of SO2 concentrations ranging up to 100 mg/L and was then allowed to undergo fermentation, with the yeast community structure being assessed via high-throughput meta-barcoding (phylotyping). While the addition of SO2 was shown to select against the presence of many species of non-Saccharomyces yeasts, there was a clear and increasing selection for the species Hanseniaspora osmophila as concentrations of SO2 rose above 40 mg/L in fermentations from both vintages. Chemical analysis of the wines resulting from these treatments showed significant increases in acetate esters, and specifically the desirable aroma compound 2-phenylethyl acetate, that accompanied the increase in abundance of H. osmophila. The ability to modulate the yeast community structure of an uninoculated ferment and the resulting chemical composition of the final wine, as demonstrated in this study, represents an important tool for winemakers to begin to be able to influence the organoleptic profile of uninoculated wines.

1. Introduction

Wine is a complex beverage, produced through the interplay of grape and microbial metabolomes during the process of fermentation. While the majority of modern commercial wine fermentation is performed using inoculated commercial strains of the major wine yeast Saccharomyces cerevisiae, a significant proportion of commercial wine fermentations are now being performed using uninoculated grape must. In these situations, the fermentation is conducted by a consortium of wine yeast and bacteria that establish themselves either from the grape surface or from the winery via shared equipment or other vectors such as insects [1].
In the very early stages of fermentation, apiculate yeasts, and yeast-like fungi which reside on the surface of intact grape berries or winery equipment and include the genera Aureobasidium, Rhodotorula, Pichia, Candida, Hanseniaspora and Metschnikowia, represent the majority of the microbiota [2]. However, the majority of these yeasts succumb very early after fermentation commences. Mildly fermentative yeasts, such as Hanseniaspora uvarum, Candida stellata, Metschnikowia pulcherrima, Torulaspora delbrueckii and Lachancea thermotolerans have been shown to proliferate and survive well into the fermentation, but reduce in numbers as ethanol levels increase above 6% [3,4,5,6].
Vineyard geography, environment and management practices, and harvest, juice/must processing and fermentation conditions can all affect yeast population dynamics during wine fermentation [7,8,9,10,11,12,13]. Of those fermentation conditions that are readily modulated by winemakers, the addition of the antimicrobial sulphur dioxide (SO2) represents the most broadly available intervention practice. Previous microbiological studies have shown that species (and strains) of the major wine yeasts can respond differently to the application of SO2. Typically, commercial strains of S. cerevisiae display high tolerance to SO2, while “wild” yeasts display lower tolerances and are therefore thought to be broadly selected against through the application of moderate amounts of SO2 prior to the start of fermentation [14,15,16].
In order to explore the effect of SO2 addition on the yeast microbiota during uninoculated Chardonnay wine, meta-barcoding (phylotyping) analysis was used to assess the population dynamics of wine produced across two successive vintages using a range of pre-ferment SO2 levels.

2. Results

In order to evaluate the effect of SO2 addition on the yeast population structure, triplicate uninoculated fermentations were established in Chardonnay grape juice across two consecutive vintages. The effect of these different SO2 concentrations on wine volatile composition was also evaluated.

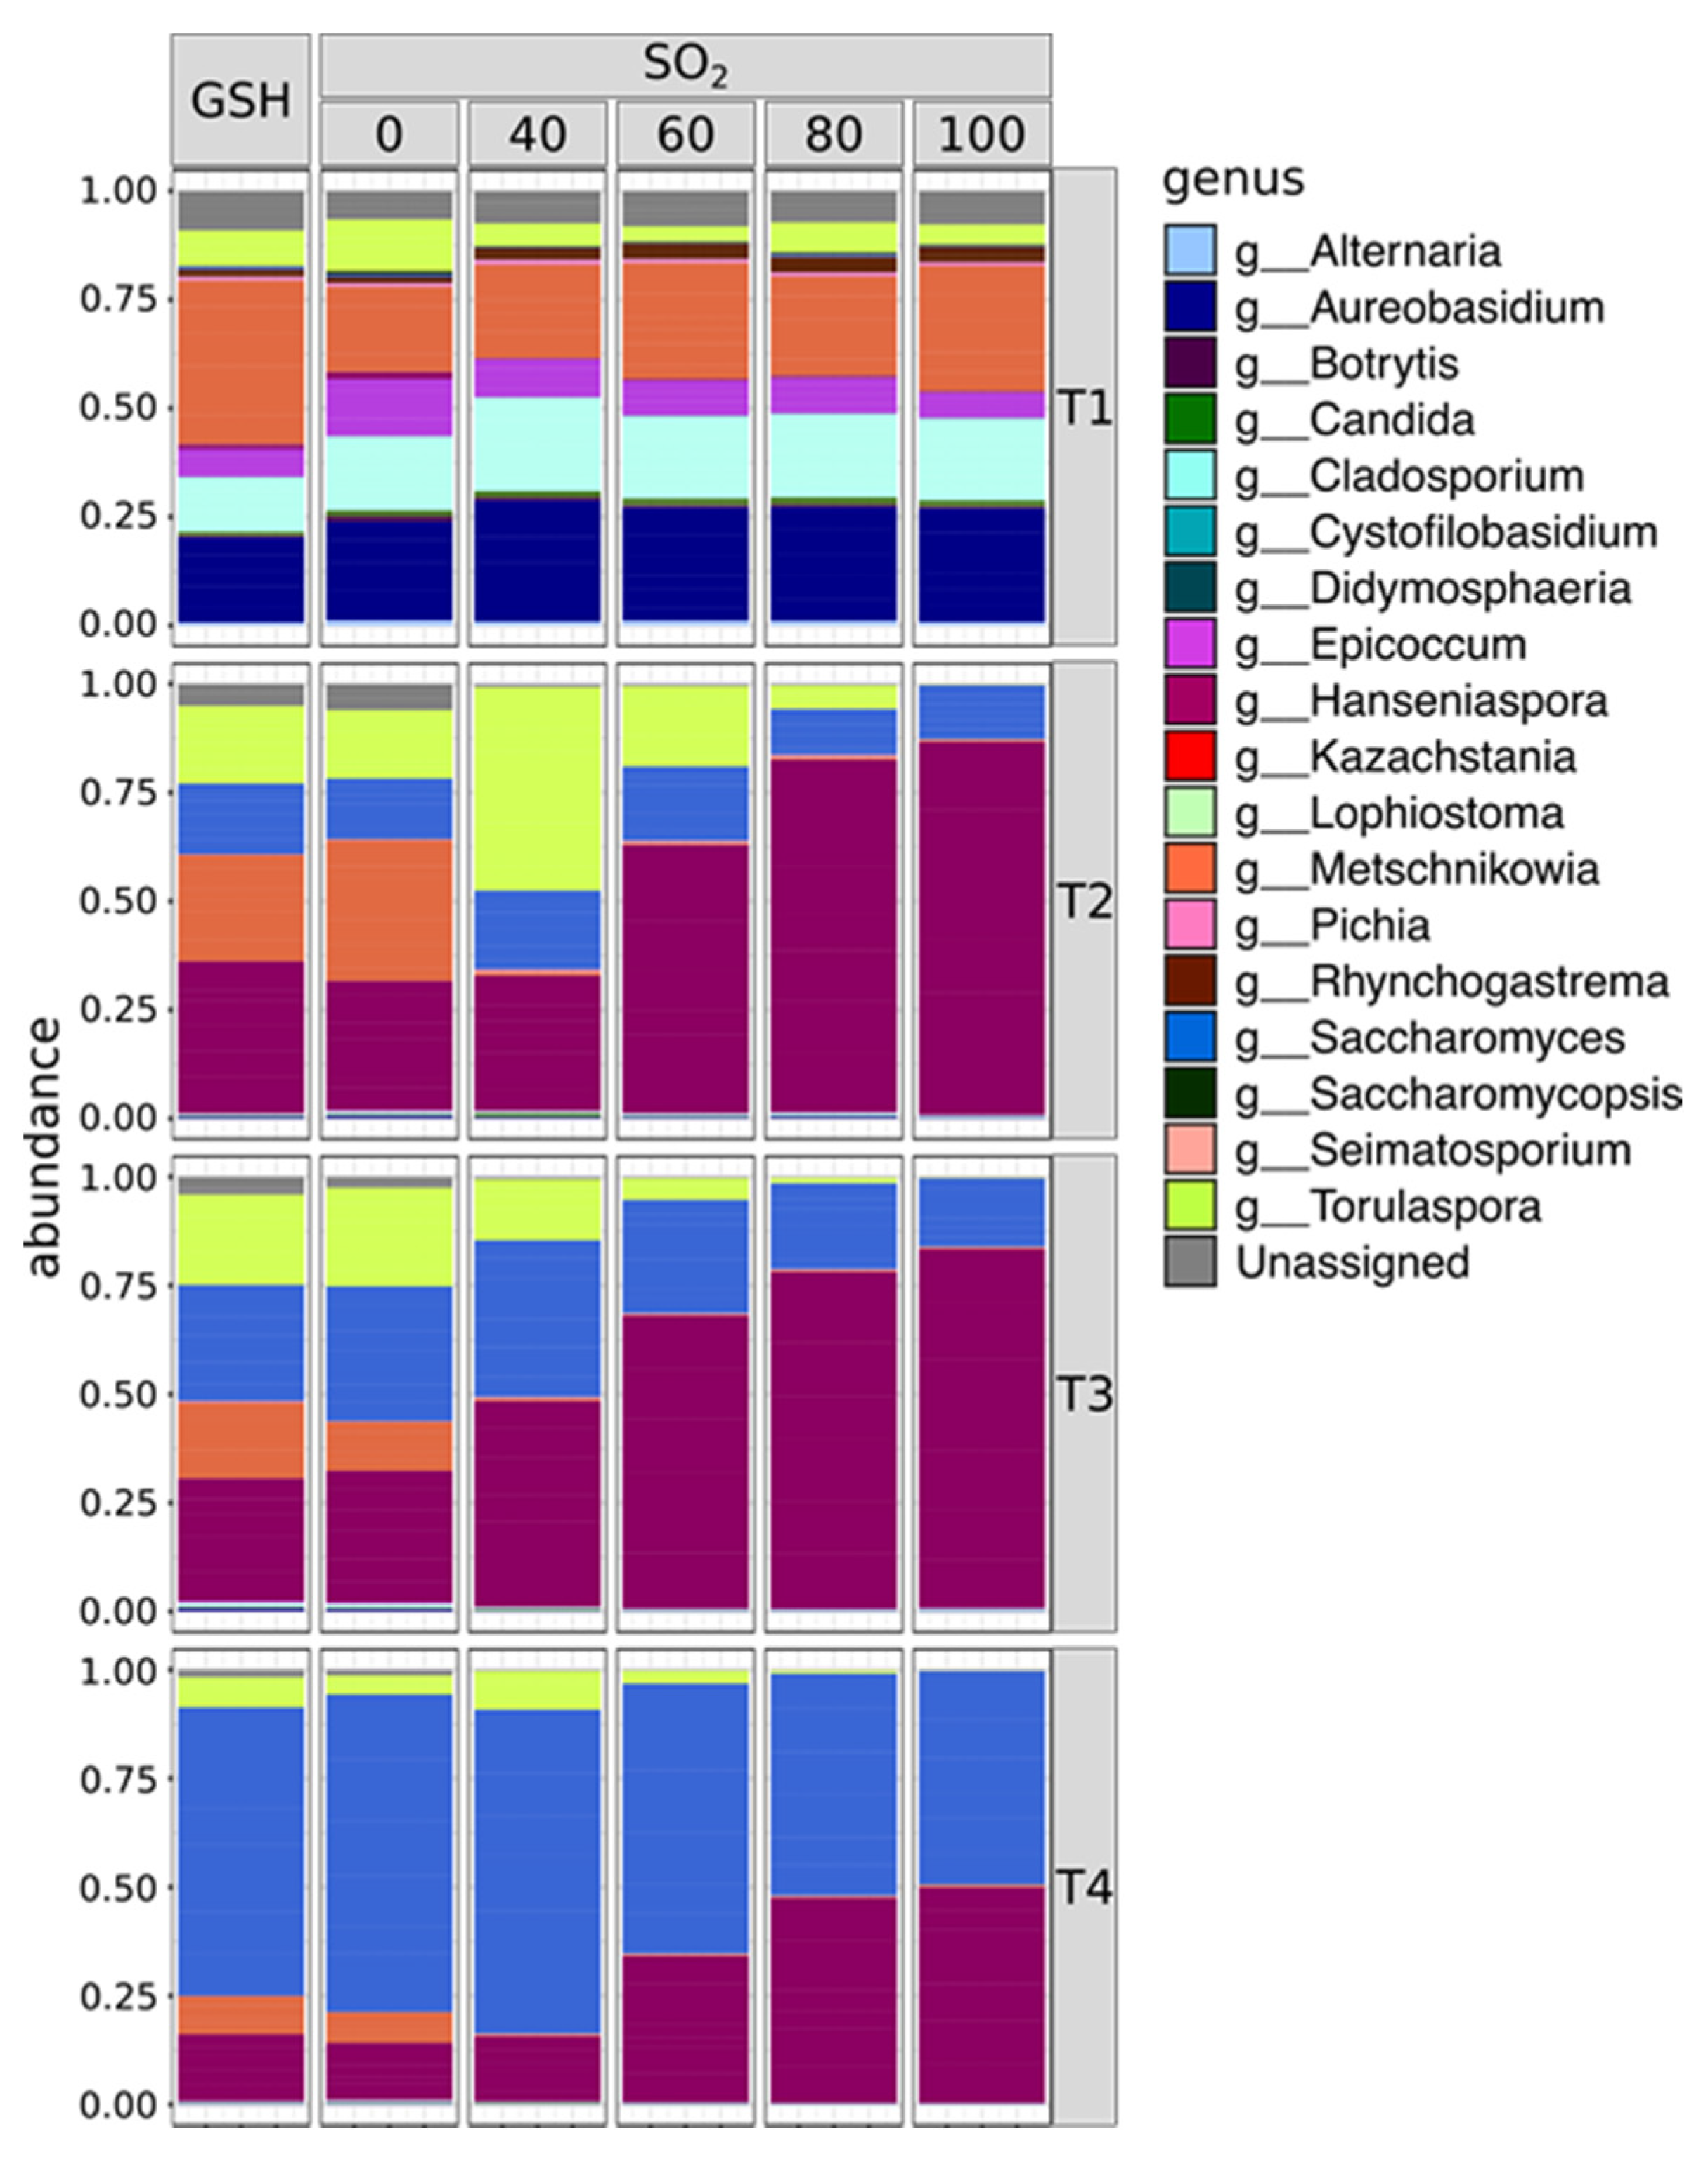
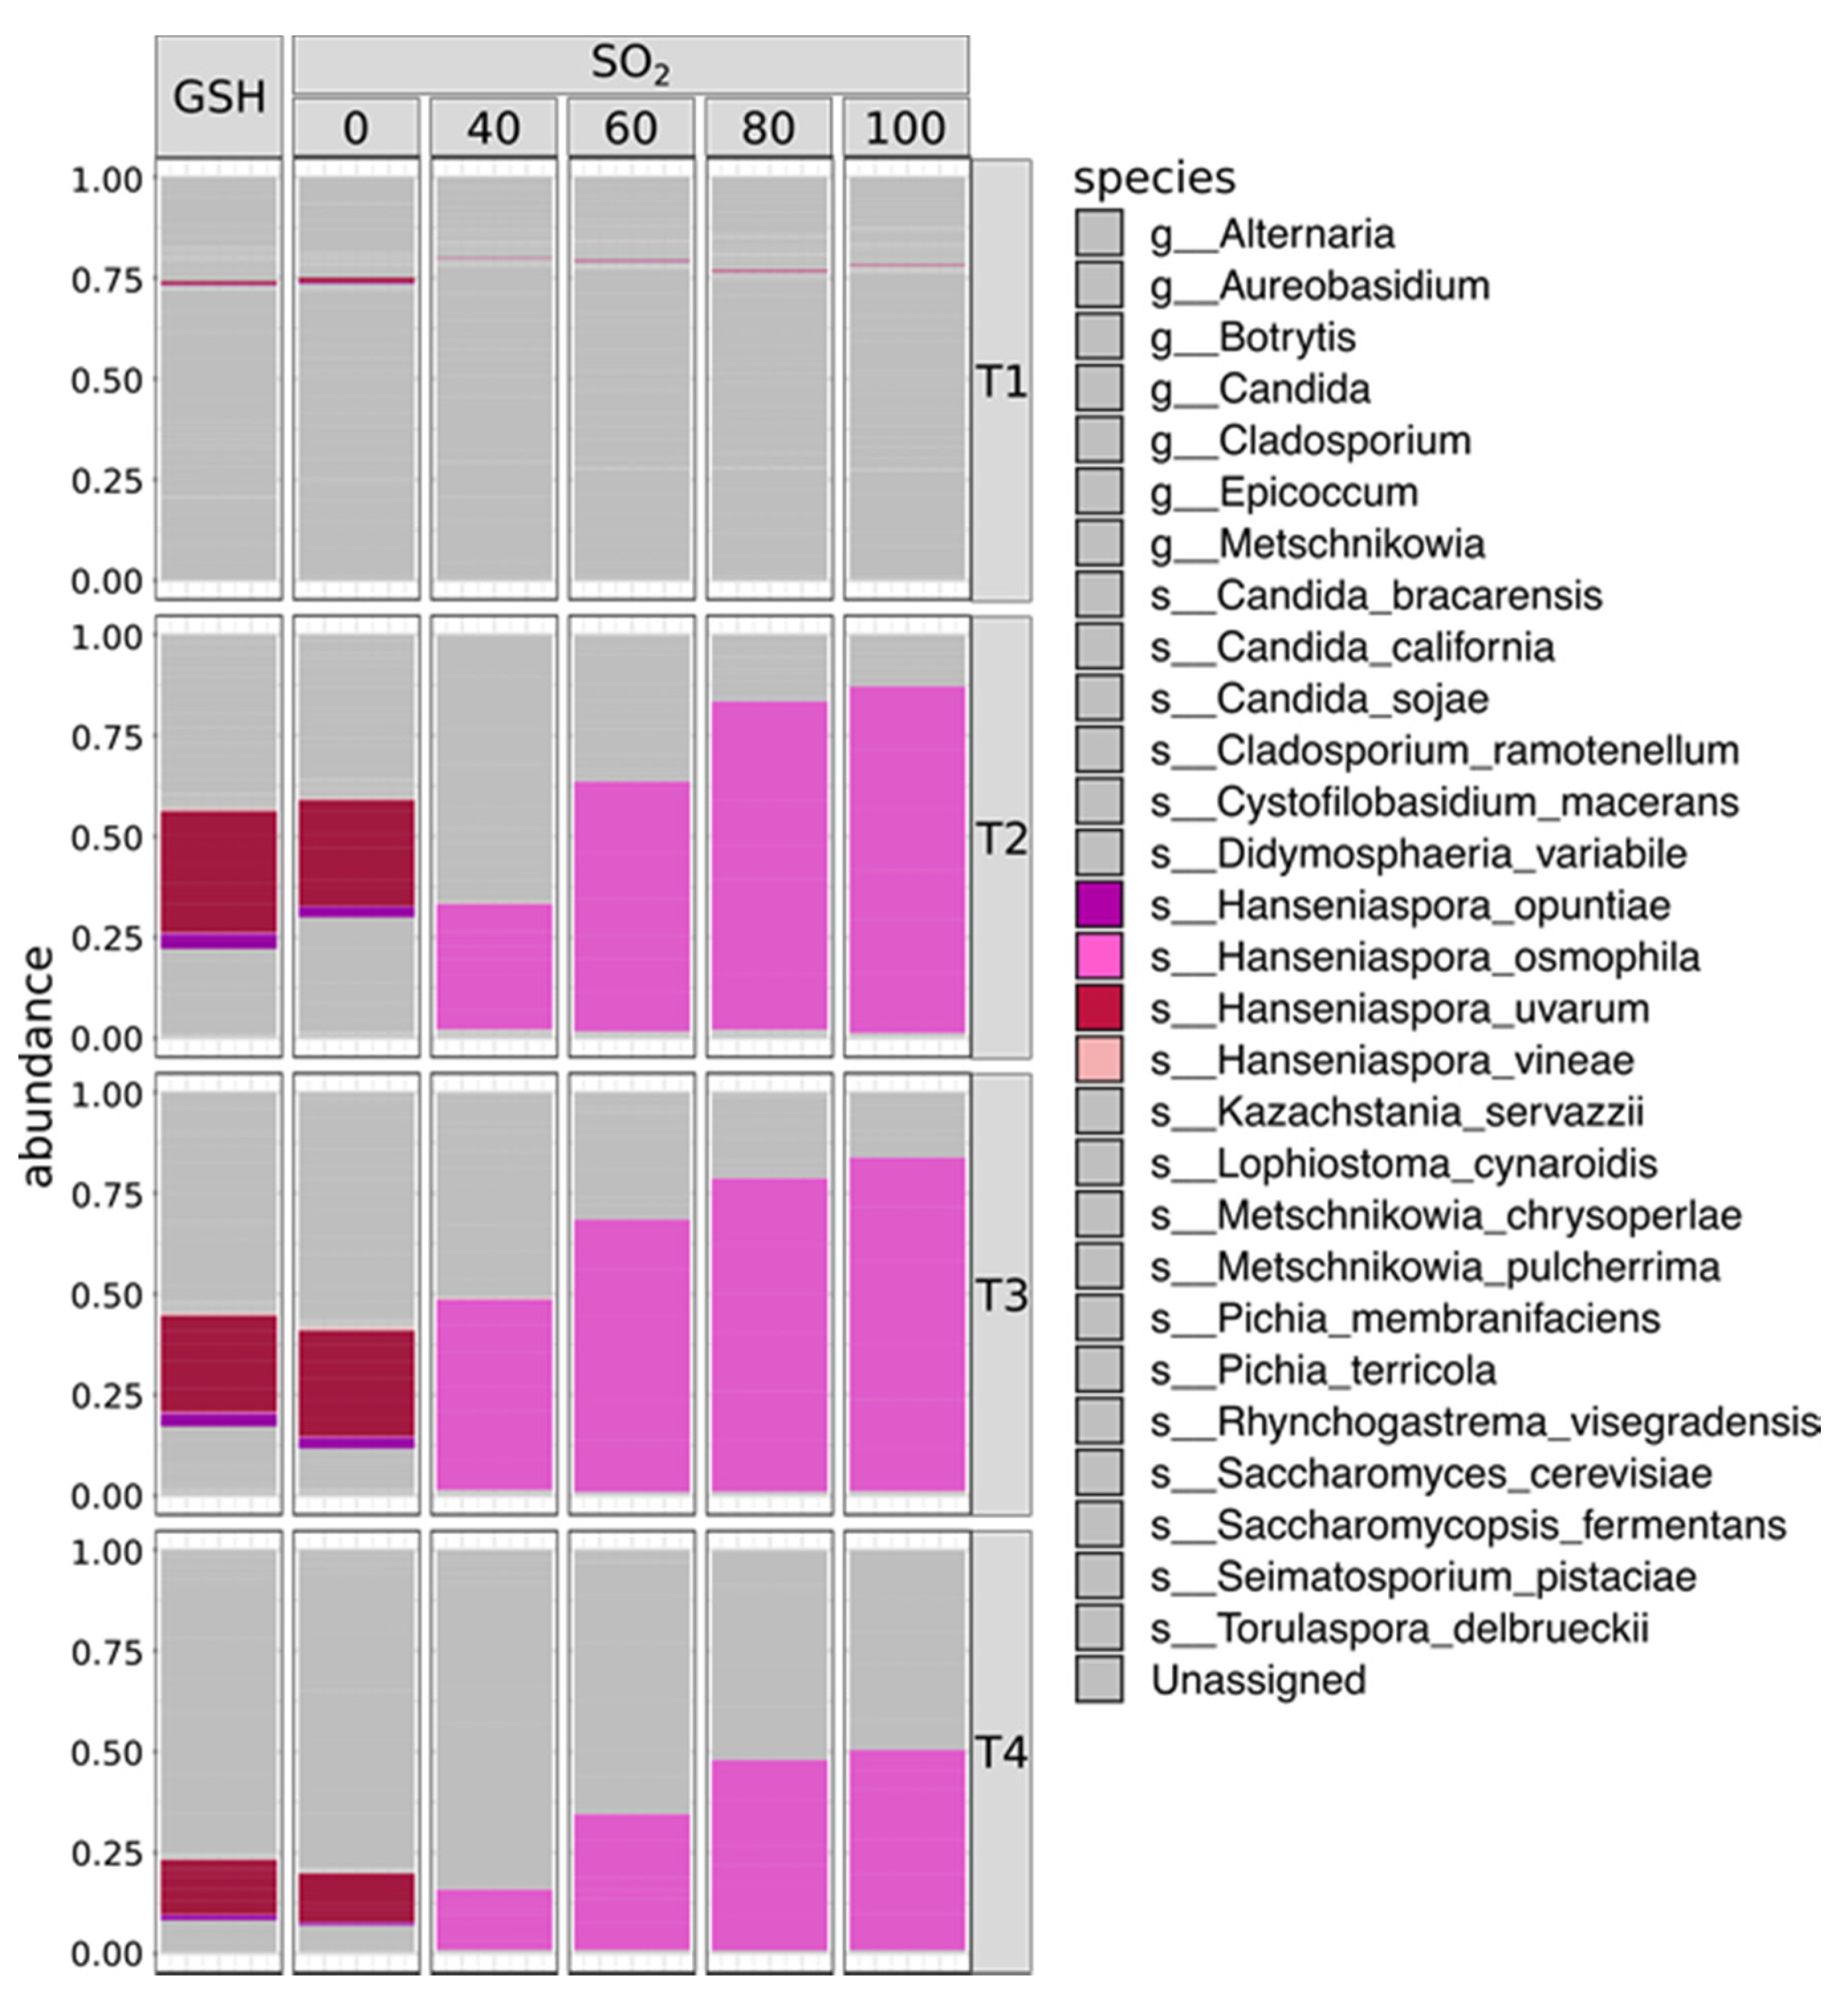
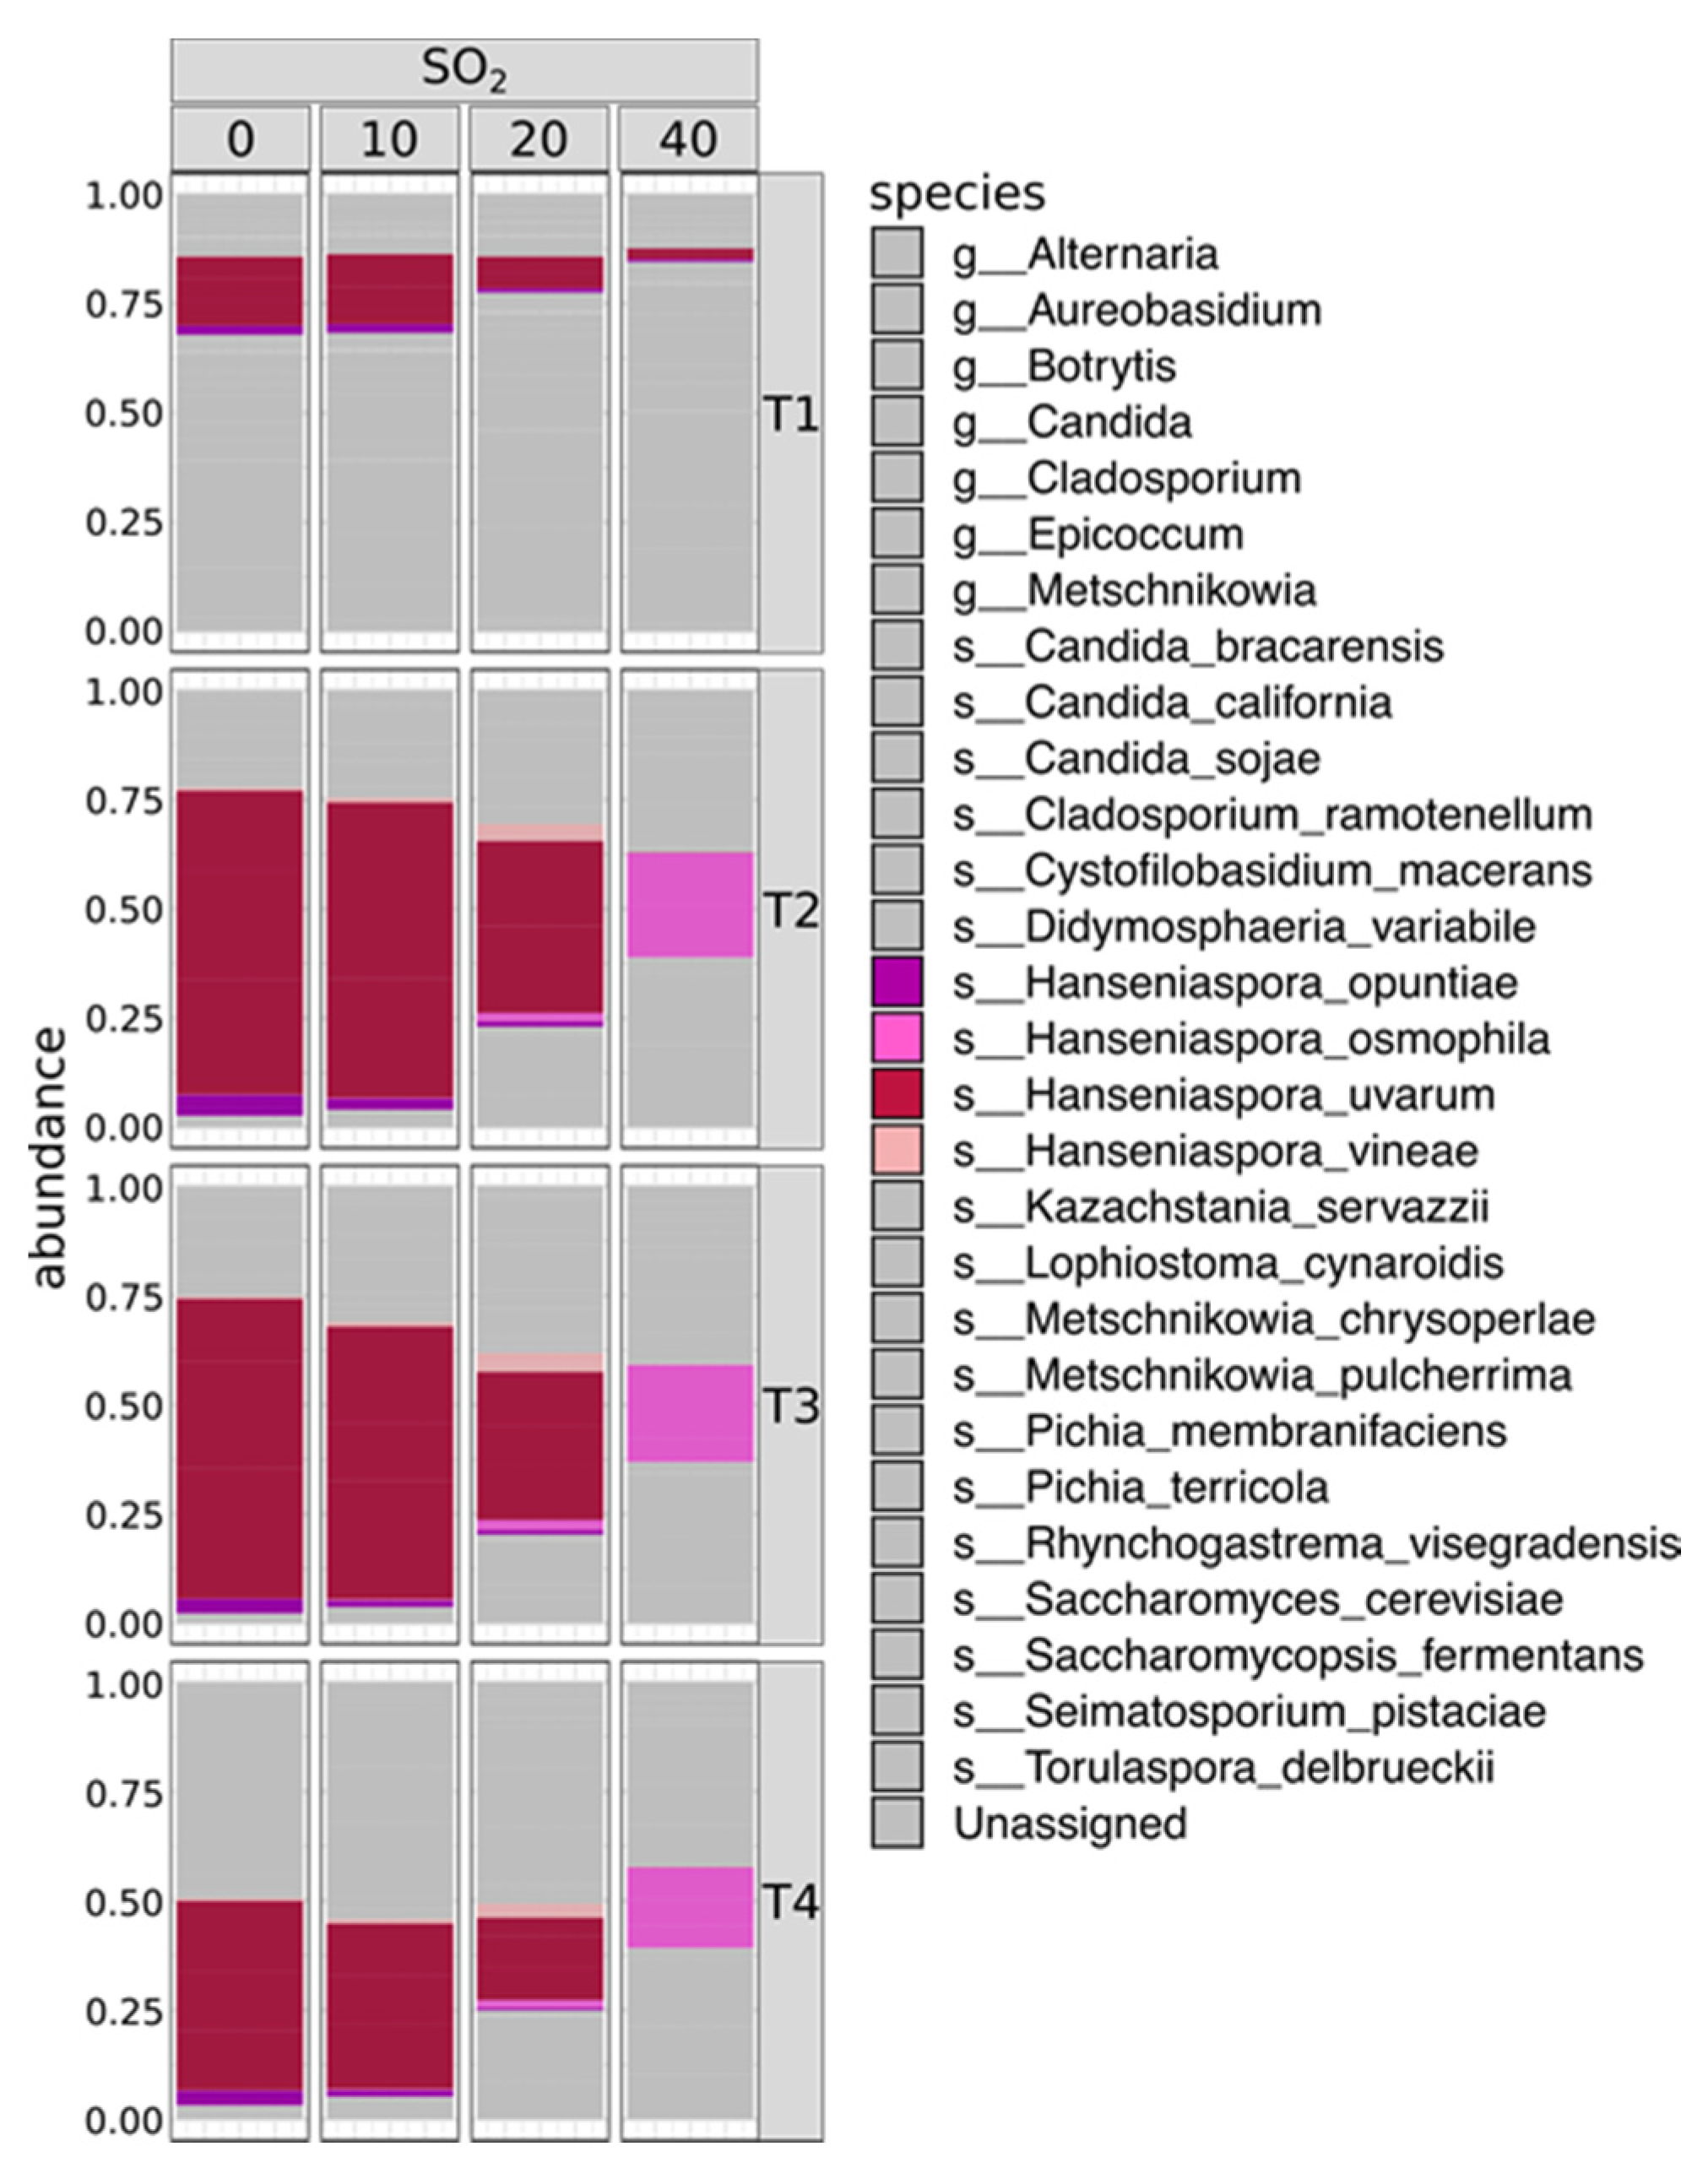
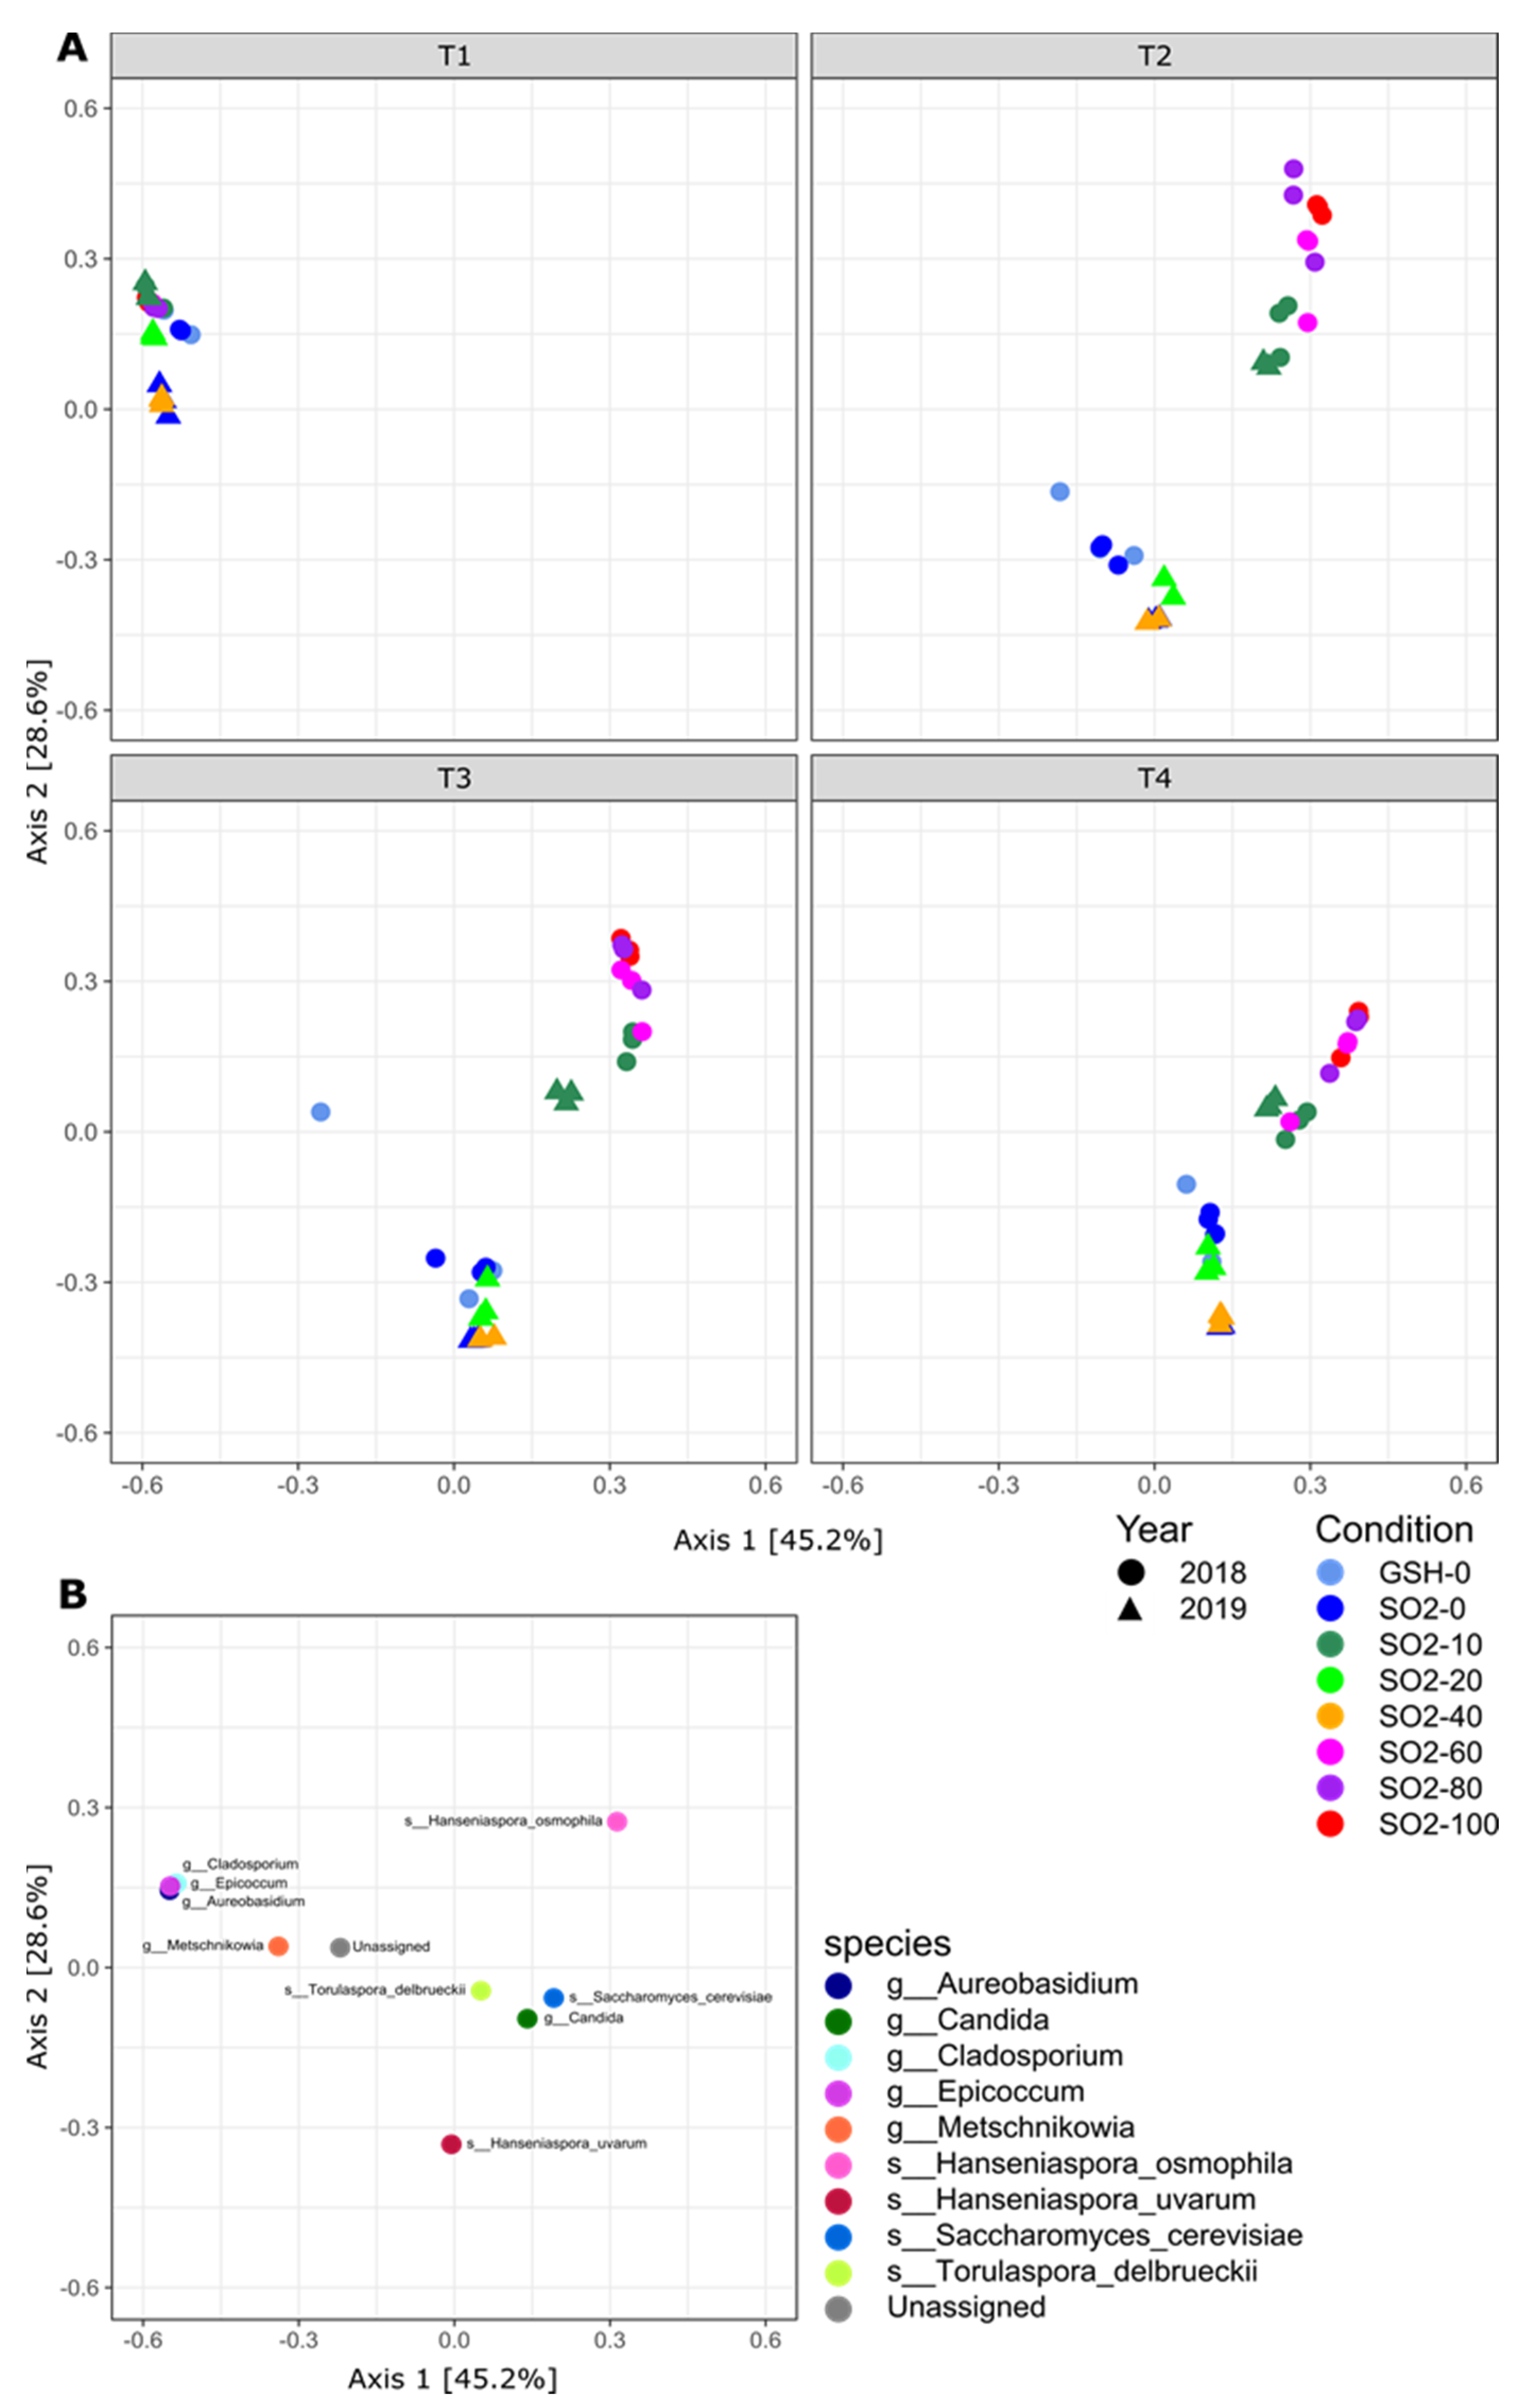
2.1. SO2 Addition Affects Yeast Population Structure

In vintage 2018, the grape juice was treated with one of five different concentrations of total SO2 (0, 40, 60, 80 and 100 mg/L). In addition to its antimicrobial effect, SO2 is also a powerful antioxidant [17]. To differentiate between the antimicrobial and antioxidant effects of the SO2 addition, an alternate antioxidant, glutathione (GSH, 250 mg/L), was also assessed for its effects on the yeast community structure.
The progress of each ferment was tracked via sugar consumption (Figure S1), with samples taken immediately after SO2 or GSH addition (T1), at 90% of sugar remaining (T2), 50% sugar remaining (T3) and 10% sugar remaining (T4), for meta-barcoding analysis using the fungal Internal Transcribed Spacer (ITS) region [18,19]. The addition of GSH did not affect the duration of fermentation, however, SO2 had a significant impact on the length of time required for the fermentation to reach completion, with two of the 100 mg/mL treatments requiring five to seven days longer than the control ferments (26 day fermentation) and one of the 100 mg/mL treatments becoming stuck with 13 g/L of residual sugar.
Across the 18 samples from 2018 (6 treatments in triplicate), Operational Taxonomic Units (OTUs) that could be assigned to a total of 26 fungal genera were detected that exceeded 0.01% of the total abundance in at least one sample (Figure 1; full results in Table S1). Triplicate samples were shown to be highly concordant for each combination of SO2 concentration and timepoint (Figure S2). The highest level of fungal diversity was observed at the T1 timepoint, while Hanseniaspora, Metschnikowia, Saccharomyces and Torulaspora dominated the fermentations from T2 through T4, accounting over 95% of the total ITS reads (Figure 1).
As seen for the fermentation kinetics, the GSH addition did not affect the overall population structure relative to the control samples, however, the addition of SO2 had a significant, but differential effect on the four main genera observed across the samples (Figure 1). Metschnikowia displayed the highest sensitivity to SO2, with 40 mg/L completely inhibiting the detection of this genus by the T2 timepoint. Torulaspora was shown to have a higher abundance at 40 mg/L relative to 0 mg/L, however, this genus was progressively inhibited by higher concentrations of SO2 in a gradient from 60 through to 100 mg/L, at which point it was completely inhibited at timepoint T2. Hanseniaspora and Saccharomyces were both shown to be tolerant across all the tested SO2 concentrations, with Hanseniaspora increasing in its total proportion relative to the other genera as the concentration of SO2 was increased.
As fungal ITS sequencing generally affords the ability to define OTUs to the species level, the genus level counts were partitioned into species-level units to determine the effect of SO2 concentration on the abundance of individual species. There were 29 species that exceeded 0.1% of the total abundance in any sample, with the genus Hanseniaspora displaying the highest number of individual species (n = 4). While the addition of SO2 was shown to increase the overall abundance of Hanseniaspora at the genus level, there was a far more complex response profile when species designations were taken into account (Figure 2). Rather than a general increase in all species of Hanseniaspora, two species, H. uvarum and H. opuntiae, were the dominant species when SO2 was absent (GSH and SO2 0 mg/L treatments). However, the addition of 40 mg/L of SO2 resulted in a drastic shift in the species composition such that H. osmophila was the sole representative of this genus at 40 mg/L of SO2. The relative abundance of this species increased substantially as SO2 levels were raised, producing the overall increase in Hanseniaspora that was observed at the genus level.
A second set of fermentations were established in the subsequent year (2019) using a finer set of SO2 treatment intervals (0, 10, 20 and 40 mg/L). Consistent with the observations from the 2018 vintage, the SO2 addition affected fermentation kinetics, particularly for the 40 mg/L treatments (Figure S1). The 2019 ferments displayed a different overall yeast diversity compared with the 2018 samples, with a lack of OTUs that could be assigned to Metschnikowia and prominent contributions from OTUs assigned to Candida spp., which increased over the range of SO2 concentration used, and Kazachstania spp. that were present at up to 20 mg/L of SO2 (Figure 3). However, when the species level contributions were investigated, there were clear similarities between the two vintages in the dynamics of the OTUs assigned to the genus Hanseniaspora (Figure 4). As also seen in 2018, Hanseniaspora was represented by the greatest number of species designations in 2019. The 2019 ferments also displayed a clear species shift that was associated with the use of SO2, with the proliferation of H. uvarum, H. opuntiae and H. vineae all being inhibited by SO2 in a concentration-dependent manner, while the proportion of H. osmophila was shown to be enhanced by the addition of 40 mg/L of SO2.
In order to compare the 2018 and 2019 data, the metabarcoding time course results were analyzed by Bray–Curtis dissimilarity analysis (Figure 5). The T1 samples from across both vintages were broadly similar, with the ferments characterized by the presence of non-fermentative genera such as Aureobasidium, Cladosporium and Epicoccum. As observed in the abundance plots, ferments progressed towards being dominated by S. cerevisiae (Axis 1), however, there was a clear division between samples with 40 mg/L or more of added SO2, which deviated along Axis 2 towards H. osmophila, while the samples with less than 40 mg/L were dominated by the signal from H. uvarum. Thus, despite differences in the overall microbial populations of the wild fermentations performed across the two vintages, both displayed consistent alterations in the microbial community due to the amount of SO2 addition.

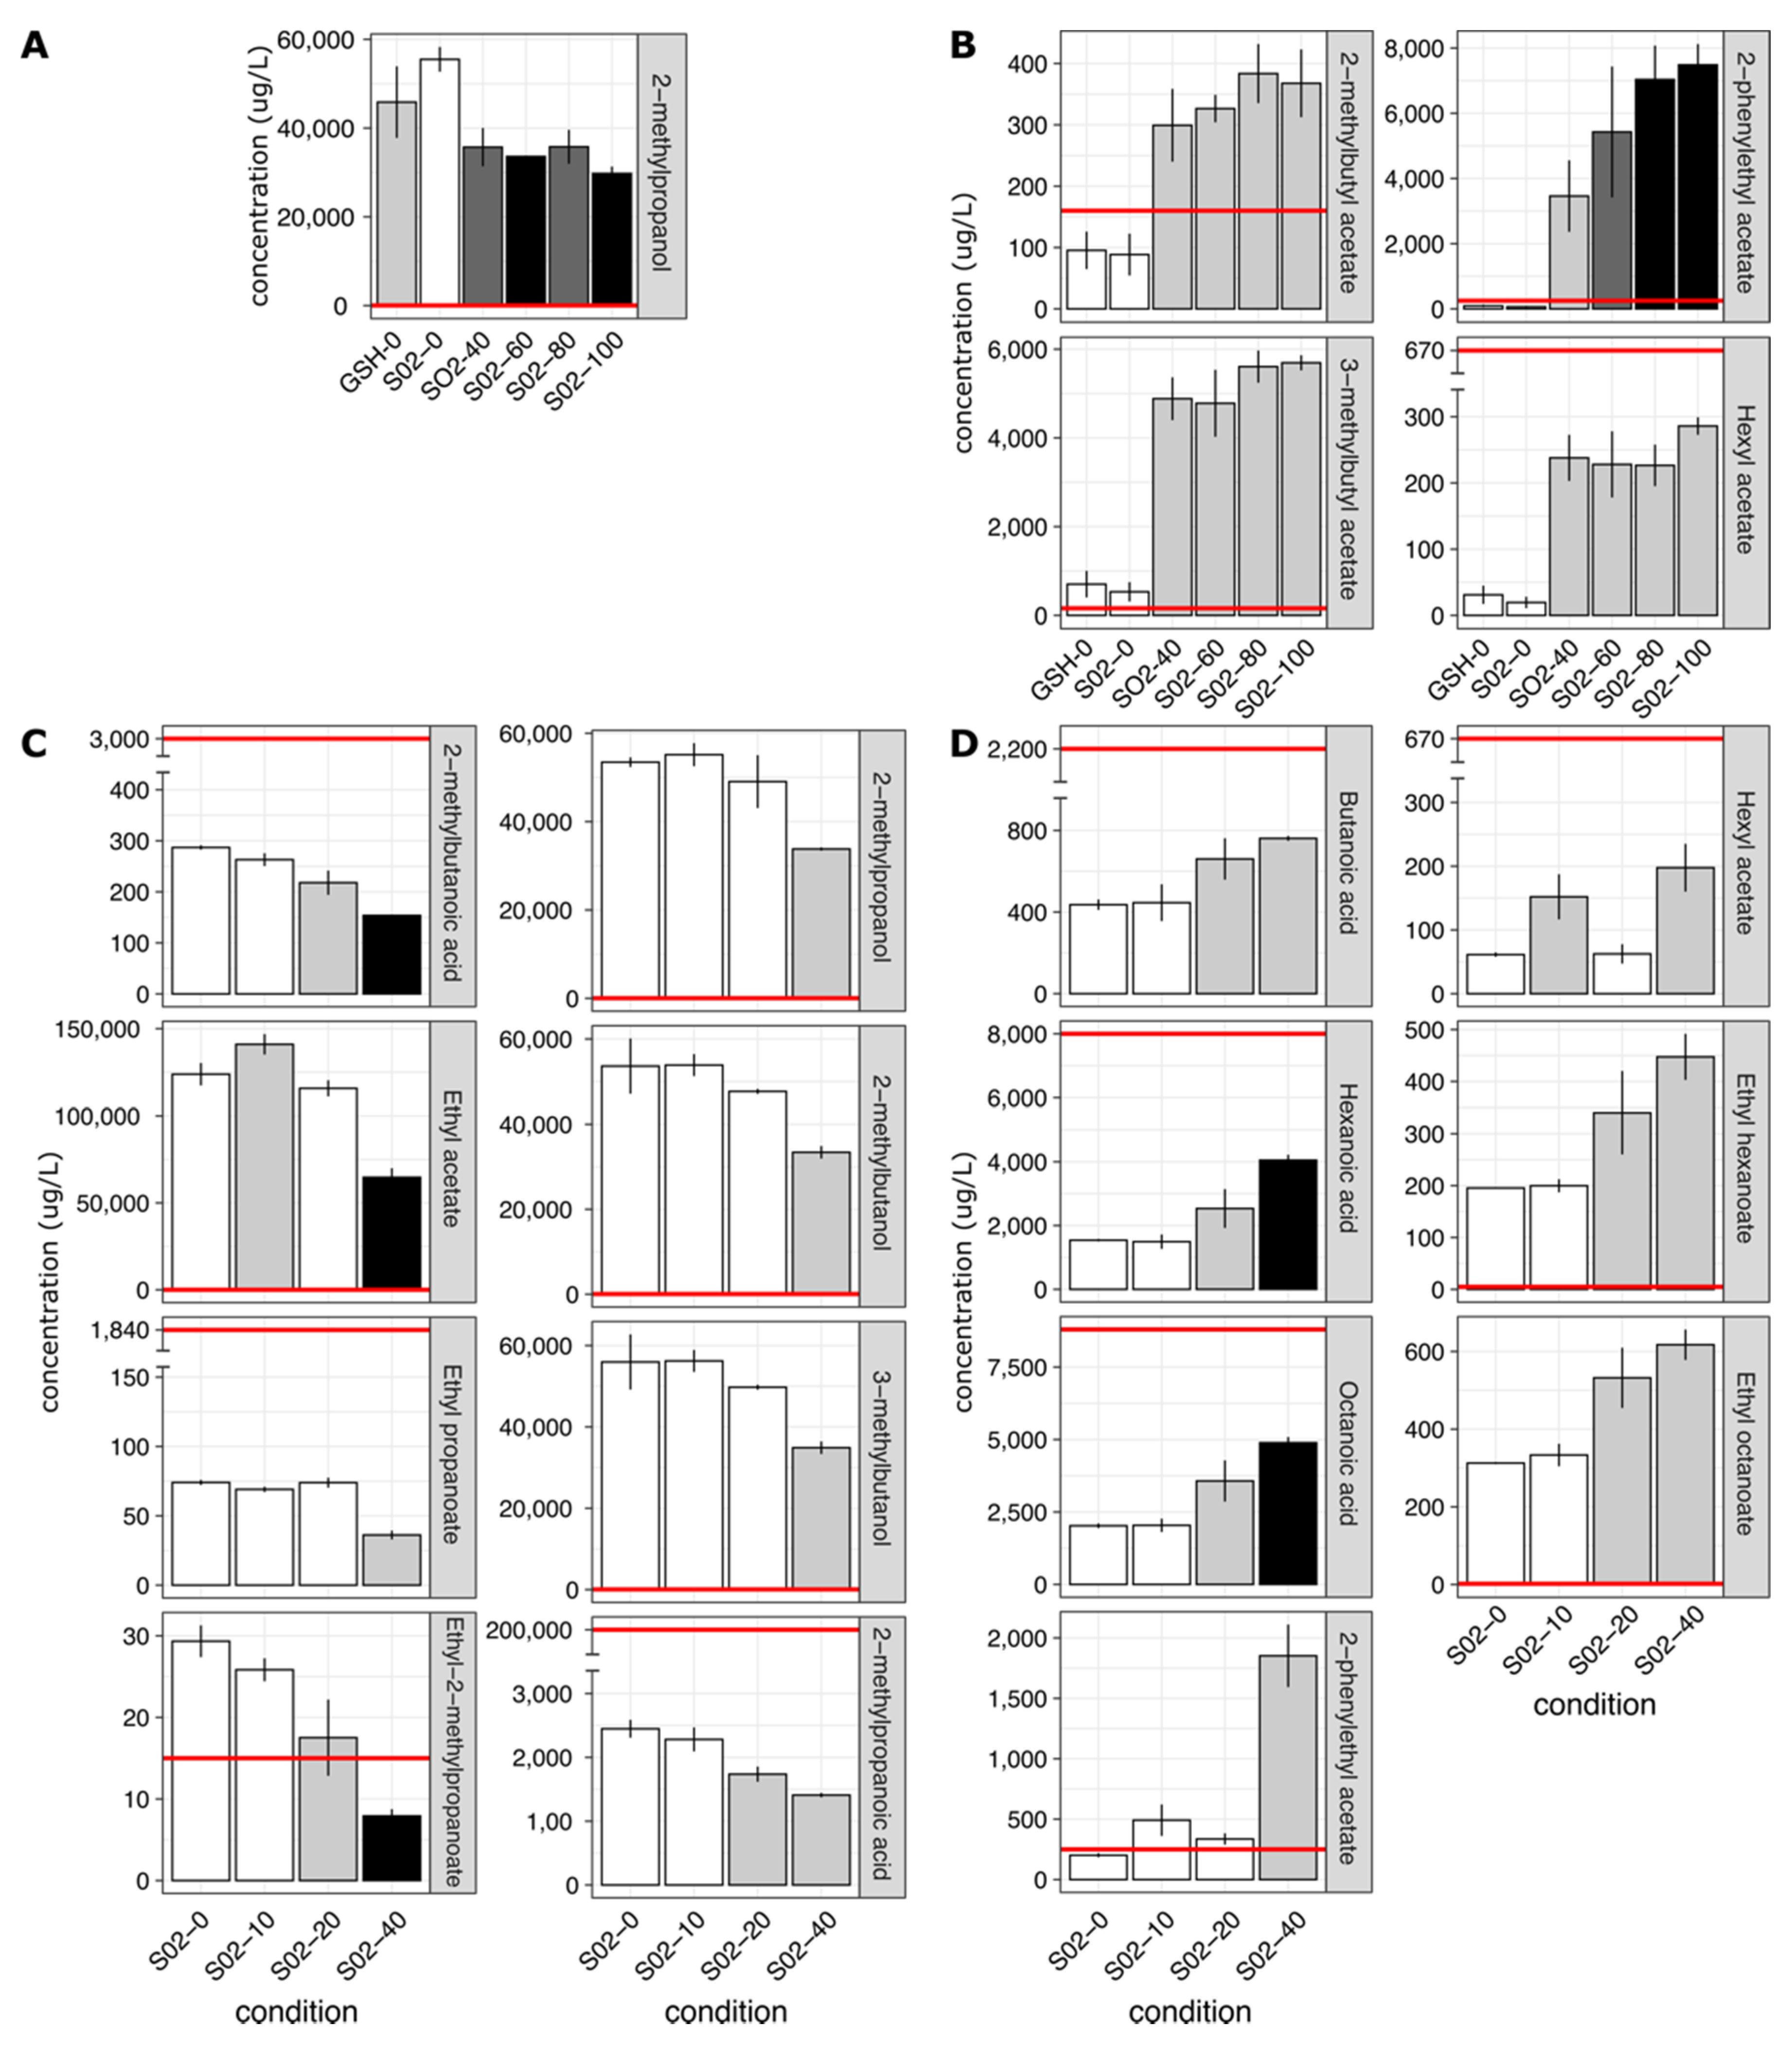
2.2. SO2 Addition Influences Wine Volatile Composition

Given the significant effect of SO2 addition on the microbial community structure, it was of interest to understand whether these different SO2 treatments were also associated with changes to the chemical composition of the wine. This was assessed through an analysis of the volatile yeast metabolites known to contribute to the aromatic profile of wine. Of the 39 aroma compounds analyzed, 18 displayed a significant difference (ANOVA, p ≤ 0.001) in concentration across one of the SO2 regimes in either 2018 or 2019 (Table S2). Of these, ten analytes displayed more than a 1.5-fold decrease in at least one of the SO2 treatments, while seven displayed an increase of the same magnitude (Figure 6). Three analytes, 2-methylpropanol (decreasing in response to SO2) and 2-phenylethyl acetate and hexyl acetate (increasing), displayed the same effect across the 2018 and 2019 vintages. In all cases, there was a significant effect at 40 mg/L SO2. Furthermore, in most situations in which a significant difference in analyte concentration was observed across multiple SO2 regimes, there was a correlation between SO2 concentration and the magnitude of change. The largest change in analyte concentration was observed for the desirable aroma compound 2-phenylethyl-acetate, with the 100 mg/L SO2 treatment in 2018 displaying over two orders of magnitude more of this metabolite than the control, and the 2019 40 mg/L SO2 treatment having over nine times as much 2-phenylethyl-acetate as the control (Table S2). More generally, higher SO2 concentrations resulted in decreases in short chain acetates and higher alcohols and increases in 6-carbon and 8-carbon esters and acids. There was no effect of SO2 concentration on low molecular weight volatile sulphur compound production.

3. Discussion

Winemakers are limited in their ability to influence the native microbial population of grape juice, with SO2 addition representing the main available intervention. Previous microbiological studies have shown that species (and strains) of the major wine yeasts can respond differently to the application of SO2, with commercial strains of S. cerevisiae displaying diverse but higher tolerance to SO2 [20], while “wild” yeasts display lower tolerances and are therefore thought to be broadly selected against through the application of moderate amounts of SO2 prior to the start of fermentation [14,15,16,21]. Through the application of ITS meta-barcoding, this study demonstrated that the addition of over 40 mg/L of total SO2 favored the presence of the non-Saccharomyces species H. osmophila at the expense of other genera such as Metschnikowia, Torulaspora and Kazachstania. H. osmophila has previously been shown to be resistant to SO2 concentrations of over 40 mg/L [22,23]. While previous research into the effects of SO2 on grape juice consortia did observe the antagonistic effect of SO2 against non-Saccharomyces yeasts, the presence of H. osmophila was not specifically reported, although Hanseniaspora yeasts were observed at levels of SO2 above 40 mg/L [16,24,25].
Much is known regarding the molecular basis of SO2 tolerance in S. cerevisiae, where the sulfite efflux pump SSU1 provides the main mode of resistance [26,27], but very little information is available on the main genetic determinants of SO2 resistance in non-Saccharomyces species, although SSU1 has been suggested to have a major role in Brettanomyces bruxellensis [28]. However, recent comparative genomic studies of Hanseniaspora spp. have shown that there is a clear differentiation of this genus into two well-defined phylogenetic clades, in which one of the differentiating factors is a homolog of SSU1, which is absent in the large clade containing H. uvarum, but present in the clade containing H. osmophila and H. vineae [29,30,31]. While this may explain the different response to SO2 of H. osmophila versus H. uvarum, there are likely many other factors that impact the response of a specific species, as T. delbrueckii, which also possesses an SSU1 homolog and displayed increased abundance at up to 40 mg/L SO2, and is less tolerant at higher SO2 concentrations than H. osmophila. Likewise, H. vineae, which was present at levels similar to H. osmophila in the control ferments and contains an SSU1 homolog, did not increase in abundance in response to increases in the concentrations of SO2.
Detailed chemical analysis showed that the addition of SO2 resulted in a significant increase in the concentration of key esters and particularly the aroma compound 2-phenylethyl-acetate, which increased over 9-fold, to levels well above the sensory threshold for this compound, even under modest SO2 additions (40 mg/L). Given the microbiological shift that was observed, it is likely that this change in ester production is due to the increasing prevalence of H. osmophila in these ferments with higher SO2 levels. This is supported by published data from fermentations established with purified non-Saccharomyces strains, in which mixtures of H. osmophila and S. cerevisiae (90:10 ratio) were shown to produce higher concentrations of acetate esters (with the exception of isoamyl acetate) and concentrations of 2-phenylethyl-acetate almost 10-fold greater than those observed using S. cerevisiae alone [32,33].
In summary, uninoculated fermentations can provide desirable complexity, however, the process lacks the ability to introduce specific fermentation characteristics through the use of commercial starter strains with distinct fermentation aroma and/or flavor profiles. The ability to modulate the yeast community structure of an uninoculated ferment, and the resulting chemical composition of the final wine, demonstrated in this study represents an important tool for winemakers to begin to be able to influence the organoleptic profile of uninoculated wines.

4. Materials and Methods

4.1. Fermentation

Commercial, high-solids Chardonnay juice (not pre-treated with SO2 during harvesting or processing) was obtained directly after destemming and crushing from Yalumba wineries during the 2018 and 2019 vintages (Table 1). The juice was transferred to 2 L Schott bottles and then treated with either potassium metabisulfite (ACE Chemical Company, Camden Park, Australia) to the appropriate final total SO2 concentration or 250 mg of reduced glutathione (GSH, Sigma-Aldrich Sydney, Australia) as indicated. Each experiment was performed in triplicate. Bottles were sealed with airlocks and incubated at 18 °C. Ferments were assessed at least every 24 h by refractometry and sugar analysis (see below), with samples taken for meta-barcoding at four approximate sugar levels (T1, directly after treatment; T2, 90% sugar remaining; T3, 50% sugar remaining; T4, 10% sugar remaining) from an in-built sampling port.

4.2. Meta-Barcoding

DNA was isolated using the DNeasy PowerFood Microbial DNA Isolation Kit (Qiagen Hilden, Germany) following the manufacturer’s instructions. Bead-beating was carried out using a combination of 0.1 mm and 0.5 mm zirconia/silica beads (BioSpec Products, Butlersville, Oklahoma) in a Precellys Evolution homogenizer (Bertin Instruments, Montigny-le-Bretonneux, France) at 8000 RPM for 4 × 60 s. In order to prepare amplicons for sequencing, a two-step PCR was performed using sequences designed to amplify the fungal ITS region, while adding experiment-specific inline barcodes and appropriate adaptors for the Illumina sequencing platform. Briefly, first-round amplification of the ITS region was performed using the fungal-specific primers BITS (ACCTGCGGARGGATCA) and B58S3 (GAGATCCRTTGYTRAAAGTT) [18] which were modified to include both an inline barcode and Illumina adaptor sequences [19]. Second-round amplification added sequences required for Illumina dual-indexed sequencing via overhang PCR. Sequencing was performed using 2 × 300 bp chemistry (Ramaciotti Centre for Functional Genomics, Sydney, Australia). Paired-end reads were quality trimmed (Trimmomatic v0.38 [34]), adaptor trimmed (cutadapt v1.16 [35]) and merged into single synthetic reads (FLASH2 v2.2.00 [36]). Merged reads were de-replicated (USEARCH v10.0.240 [37]) and clustered (Swarm v2.2.2 [38]) into operational taxonomic units (OTUs) as presented previously [19]. Taxonomic annotation was performed against the UNITE database (qiime_ver8_dynamic_02.02.2019) using a 98% similarity cut off (assign_taxonomy.py module of QIIME v1.9.1 [39]). All sequence reads have been lodged in the NCBI database under the Bioproject accession PRJNA634973.

4.3. Chemical Analysis

Titratable acidity and pH were determined using a TitraLab 840 (Radiometer) and the yeast assimilable nitrogen concentration was estimated by the NOPA + enzymatic ammonia method [40] on a Gallery Discrete Analyser (ThermoFischer, Waltham, USA) by AWRI Commercial Services (Australia).
During fermentation, [Glucose + Fructose] concentrations were determined spectrophotometrically using a Randox kit (Randox Laboratories Ltd., Crumlin, Antrim, UK) with adaptations for use in a 96-well microplate format [41]. Volatile acetates, esters and higher alcohol concentrations in the finished wines were determined using large-volume, stable-isotope dilution headspace–GC/MS analysis (Metabolomics Australia, Adelaide Australia) as adapted from [42] and as described by [43]. Volatile sulphur compounds contributing sulfidic off-aromas, were determined by gas chromatography with sulphur chemiluminescence detection (GC/SCD) [42,44]. Aroma thresholds were in wine estimated using data from Siebert et al., [42]
Free SO2 was measured in grape juice supplemented with freshly prepared PMS using the aspiration/titration method [45].

4.4. Statistical Analysis

An analysis of variance (ANOVA) was conducted using the formula aov (analyte ~ treatment) in R (version 3.6.3) to determine whether mean aroma-active compound concentrations (n = 3 for all treatments) differed with regard to SO2 treatment. If ANOVA p values were less than 0.05, a multiple comparison of the analyte concentration with respect to treatment was undertaken using the function HSD.test (agricolae) to determine the grouping of the treatments at alpha = 0.05. ANOVA F3,8 values, p values, treatment means, standard deviations and treatment group are reported in Table S2.

Supplementary Materials

The following are available online at https://0-www-mdpi-com.brum.beds.ac.uk/2311-5637/6/2/62/s1, Figure S1: Sugar-consumption kinetics, Figure S2: Replicate fermentation comparisons, Table S1: OTU abundance measurements, Table S2: Chemical analysis results.

Author Contributions

Conceptualization, A.B.; methodology, K.C., S.V.D.H., M.S., C.V.; investigation, K.C.; S.V.D.H.; M.R., M.S., C.V.; formal analysis, S.S., A.B.; writing—original draft preparation, A.B., S.S.; writing—review and editing, all authors. All authors have read and agreed to the published version of the manuscript.

Funding

The AWRI is supported by Australia’s grape growers and winemakers through their investment body Wine Australia with matching funds from the Australian Government.

Acknowledgments

Thank you to Caroline Bartel for performing SO2 analysis and Ross Sanders for performing the volatile sulphur compound analysis and Markus Herderich for critical review of the manuscript. The AWRI is a member of the Wine Innovation Cluster in Adelaide.

Conflicts of Interest

The authors declare that they have no conflict of interest.

References

  1. Varela, C.; Borneman, A.R. Yeasts found in vineyards and wineries. Yeast Chichester Engl. 2017, 34, 111–128. [Google Scholar] [CrossRef]
  2. Fleet, G.H. Wine yeasts for the future. FEMS Yeast Res. 2008, 8, 979–995. [Google Scholar] [CrossRef] [PubMed] [Green Version]
  3. Fleet, G.H.; Lafon-Lafourcade, S.; Ribéreau-Gayon, P. Evolution of yeasts and Lactic acid bacteria during fermentation and storage of Bordeaux wines. Appl. Environ. Microbiol. 1984, 48, 1034–1038. [Google Scholar] [CrossRef] [Green Version]
  4. Fleet, G.H. Growth of yeasts during wine fermentations. J. Wine Res. 1990, 1, 211–223. [Google Scholar] [CrossRef]
  5. Beltran, G.; Torija, M.J.; Novo, M.; Ferrer, N.; Poblet, M.; Guillamón, J.M.; Rozès, N.; Mas, A. Analysis of yeast populations during alcoholic fermentation: A six year follow-up study. Syst. Appl. Microbiol. 2002, 25, 287–293. [Google Scholar] [CrossRef] [PubMed]
  6. Combina, M.; Elía, A.; Mercado, L.; Catania, C.; Ganga, A.; Martinez, C. Dynamics of indigenous yeast populations during spontaneous fermentation of wines from Mendoza, Argentina. Int. J. Food Microbiol. 2005, 99, 237–243. [Google Scholar] [CrossRef] [PubMed]
  7. Epifanio, S.I.; Gutierrez, A.R.; Santamaría, M.P.; López, R. The influence of enological practices on the selection of wild Yeast strains in spontaneous fermentation. Am. J. Enol. Vitic. 1999, 50, 219–224. [Google Scholar]
  8. Torija, M.J.; Rozès, N.; Poblet, M.; Guillamón, J.M.; Mas, A. Yeast population dynamics in spontaneous fermentations: Comparison between two different wine-producing areas over a period of three years. Antonie Van Leeuwenhoek 2001, 79, 345–352. [Google Scholar] [CrossRef]
  9. Jemec, K.P.; Raspor, P. Initial Saccharomyces cerevisiae concentration in single or composite cultures dictates bioprocess kinetics. Food Microbiol. 2005, 22, 293–300. [Google Scholar] [CrossRef]
  10. Sturm, J.; Grossmann, M.; Schnell, S. Influence of grape treatment on the wine yeast populations isolated from spontaneous fermentations. J. Appl. Microbiol. 2006, 101, 1241–1248. [Google Scholar] [CrossRef]
  11. Albertin, W.; Miot-Sertier, C.; Bely, M.; Marullo, P.; Coulon, J.; Moine, V.; Colonna-Ceccaldi, B.; Masneuf-Pomarede, I. Oenological prefermentation practices strongly impact yeast population dynamics and alcoholic fermentation kinetics in Chardonnay grape must. Int. J. Food Microbiol. 2014, 178, 87–97. [Google Scholar] [CrossRef] [PubMed]
  12. Bokulich, N.A.; Thorngate, J.H.; Richardson, P.M.; Mills, D.A. Microbial biogeography of wine grapes is conditioned by cultivar, vintage, and climate. Proc. Natl. Acad. Sci. USA 2014, 111, E139–E148. [Google Scholar] [CrossRef] [PubMed] [Green Version]
  13. Maturano, Y.P.; Mestre, M.V.; Combina, M.; Toro, M.E.; Vazquez, F.; Esteve-Zarzoso, B. Culture-dependent and independent techniques to monitor yeast species during cold soak carried out at different temperatures in winemaking. Int. J. Food Microbiol. 2016, 237, 142–149. [Google Scholar] [CrossRef] [PubMed]
  14. Andorrà, I.; Landi, S.; Mas, A.; Guillamón, J.M.; Esteve-Zarzoso, B. Effect of oenological practices on microbial populations using culture-independent techniques. Food Microbiol. 2008, 25, 849–856. [Google Scholar] [CrossRef]
  15. Morgan, S.C.; Scholl, C.M.; Benson, N.L.; Stone, M.L.; Durall, D.M. Sulfur dioxide addition at crush alters Saccharomyces cerevisiae strain composition in spontaneous fermentations at two Canadian wineries. Int. J. Food Microbiol. 2017, 244, 96–102. [Google Scholar] [CrossRef]
  16. Morgan, S.C.; Tantikachornkiat, M.; Scholl, C.M.; Benson, N.L.; Cliff, M.A.; Durall, D.M. The effect of sulfur dioxide addition at crush on the fungal and bacterial communities and the sensory attributes of Pinot gris wines. Int. J. Food Microbiol. 2019, 290, 1–14. [Google Scholar] [CrossRef]
  17. Danilewicz, J.C.; Seccombe, J.T.; Whelan, J. Mechanism of interaction of polyphenols, oxygen, and sulfur dioxide in model wine and wine. Am. J. Enol. Vitic. 2008, 59, 128–136. [Google Scholar]
  18. Bokulich, N.A.; Mills, D.A. Improved selection of internal transcribed spacer-specific primers enables quantitative, ultra-high-throughput profiling of fungal communities. Appl. Environ. Microbiol. 2013, 79, 2519–2526. [Google Scholar] [CrossRef] [Green Version]
  19. Sternes, P.R.; Lee, D.; Kutyna, D.R.; Borneman, A.R. A combined meta-barcoding and shotgun metagenomic analysis of spontaneous wine fermentation. GigaScience 2017, 6, gix040. [Google Scholar] [CrossRef] [Green Version]
  20. Nardi, T.; Corich, V.; Giacomini, A.; Blondin, B. A sulphite-inducible form of the sulphite efflux gene SSU1 in a Saccharomyces cerevisiae wine yeast. Microbiol. Read. Engl. 2010, 156, 1686–1696. [Google Scholar] [CrossRef] [Green Version]
  21. Henick-Kling, T.; Edinger, W.; Daniel, P.; Monk, P. Selective effects of sulfur dioxide and yeast starter culture addition on indigenous yeast populations and sensory characteristics of wine. J. Appl. Microbiol. 1998, 84, 865–876. [Google Scholar] [CrossRef]
  22. Granchi, L.; Ganucci, D.; Messini, A.; Vincenzini, M. Oenological properties of and from wines produced by spontaneous fermentations of normal and dried grapes. FEMS Yeast Res. 2002, 2, 403–407. [Google Scholar] [CrossRef] [Green Version]
  23. Hierro, N.; Gonzalez, A.; Mas, A.; Guillamon, J.M. Diversity and evolution of non-Saccharomyces yeast populations during wine fermentation: Effect of grape ripeness and cold maceration. FEMS Yeast Res. 2006, 6, 102–111. [Google Scholar] [CrossRef] [PubMed] [Green Version]
  24. Bagheri, B.; Bauer, F.F.; Cardinali, G.; Setati, M.E. Ecological interactions are a primary driver of population dynamics in wine yeast microbiota during fermentation. Sci. Rep. 2020, 10, 1–12. [Google Scholar] [CrossRef] [PubMed] [Green Version]
  25. Bokulich, N.A.; Swadener, M.; Sakamoto, K.; Mills, D.A.; Bisson, L.F. Sulfur dioxide treatment alters wine microbial diversity and fermentation progression in a dose-dependent fashion. Am. J. Enol. Vitic. 2015, 66, 73–79. [Google Scholar] [CrossRef]
  26. Divol, B.; du Toit, M.; Duckitt, E. Surviving in the presence of sulphur dioxide: Strategies developed by wine yeasts. Appl. Microbiol. Biotechnol. 2012, 95, 601–613. [Google Scholar] [CrossRef]
  27. Park, H.; Bakalinsky, A.T. SSU1 mediates sulphite efflux in Saccharomyces cerevisiae. Yeast 2000, 16, 881–888. [Google Scholar] [CrossRef]
  28. Varela, C.; Bartel, C.; Roach, M.; Borneman, A.; Curtin, C. Brettanomyces bruxellensis SSU1 haplotypes confer different levels of sulfite tolerance when expressed in a Saccharomyces cerevisiae SSU1 null mutant. Appl. Environ. Microbiol. 2019, 85, e02429-18. [Google Scholar] [CrossRef] [Green Version]
  29. Sternes, P.R.; Lee, D.; Kutyna, D.R.; Borneman, A.R. Genome sequences of three species of Hanseniaspora isolated from spontaneous wine fermentations. Genome Announc. 2016, 4, e01287-16. [Google Scholar] [CrossRef] [Green Version]
  30. Seixas, I.; Barbosa, C.; Mendes-Faia, A.; Güldener, U.; Tenreiro, R.; Mendes-Ferreira, A.; Mira, N.P. Genome sequence of the non-conventional wine yeast Hanseniaspora guilliermondii UTAD222 unveils relevant traits of this species and of the Hanseniaspora genus in the context of wine fermentation. DNA Res. 2019, 26, 67–83. [Google Scholar] [CrossRef] [Green Version]
  31. Čadež, N.; Bellora, N.; Ulloa, R.; Hittinger, C.T.; Libkind, D. Genomic content of a novel yeast species Hanseniaspora gamundiae sp. nov. from fungal stromata (Cyttaria) associated with a unique fermented beverage in Andean Patagonia, Argentina. PLoS ONE 2019, 14, e0210792. [Google Scholar] [CrossRef]
  32. Viana, F.; Gil, J.V.; Genovés, S.; Vallés, S.; Manzanares, P. Rational selection of non-Saccharomyces wine yeasts for mixed starters based on ester formation and enological traits. Food Microbiol. 2008, 25, 778–785. [Google Scholar] [CrossRef] [PubMed]
  33. Viana, F.; Gil, J.V.; Vallés, S.; Manzanares, P. Increasing the levels of 2-phenylethyl acetate in wine through the use of a mixed culture of Hanseniaspora osmophila and Saccharomyces cerevisiae. Int. J. Food Microbiol. 2009, 135, 68–74. [Google Scholar] [CrossRef] [PubMed]
  34. Bolger, A.M.; Lohse, M.; Usadel, B. Trimmomatic: A flexible trimmer for Illumina sequence data. Bioinform. Oxf. Engl. 2014, 30, 2114–2120. [Google Scholar] [CrossRef] [PubMed] [Green Version]
  35. Martin, M. Cutadapt removes adapter sequences from high-throughput sequencing reads. EMB-Net. J. 2011, 17, 10–12. [Google Scholar] [CrossRef]
  36. Magoč, T.; Salzberg, S.L. FLASH: Fast length adjustment of short reads to improve genome assemblies. Bioinform. Oxf. Engl. 2011, 27, 2957–2963. [Google Scholar] [CrossRef] [PubMed]
  37. Edgar, R.C. Search and clustering orders of magnitude faster than BLAST. Bioinform. Oxf. Engl. 2010, 26, 2460–2461. [Google Scholar] [CrossRef] [PubMed] [Green Version]
  38. Mahé, F.; Rognes, T.; Quince, C.; de Vargas, C.; Dunthorn, M. Swarm: Robust and fast clustering method for amplicon-based studies. PeerJ 2014, 2, e593. [Google Scholar] [CrossRef] [Green Version]
  39. Caporaso, J.G.; Kuczynski, J.; Stombaugh, J.; Bittinger, K.; Bushman, F.D.; Costello, E.K.; Fierer, N.; Peña, A.G.; Goodrich, J.K.; Gordon, J.I.; et al. QIIME allows analysis of high-throughput community sequencing data. Nat. Methods 2010, 7, 335–336. [Google Scholar] [CrossRef] [Green Version]
  40. Gump, B.H.; Zoecklein, B.W.; Fugelsang, K.C.; Whiton, R.S. Comparison of analytical methods for prediction of prefermentation nutritional status of grape juice. Am. J. Enol. Vitic. 2002, 53, 325–329. [Google Scholar]
  41. Vermeir, S.; Nicolaï, B.M.; Jans, K.; Maes, G.; Lammertyn, J. High-throughput microplate enzymatic assays for fast sugar and acid quantification in Apple and Tomato. J. Agric. Food Chem. 2007, 55, 3240–3248. [Google Scholar] [CrossRef] [PubMed]
  42. Siebert, T.E.; Smyth, H.E.; Capone, D.L.; Neuwöhner, C.; Pardon, K.H.; Skouroumounis, G.K.; Herderich, M.J.; Sefton, M.A.; Pollnitz, A.P. Stable isotope dilution analysis of wine fermentation products by HS-SPME-GC-MS. Anal. Bioanal. Chem. 2005, 381, 937–947. [Google Scholar] [CrossRef] [PubMed]
  43. Holt, H.; Cozzolino, D.; McCarthy, J.; Abrahamse, C.; Holt, S.; Solomon, M.; Smith, P.; Chambers, P.J.; Curtin, C. Influence of yeast strain on Shiraz wine quality indicators. Int. J. Food Microbiol. 2013, 165, 302–311. [Google Scholar] [CrossRef] [PubMed]
  44. Bekker, M.Z.; Day, M.P.; Holt, H.; Wilkes, E.; Smith, P.A. Effect of oxygen exposure during fermentation on volatile sulfur compounds in Shiraz wine and a comparison of strategies for remediation of reductive character: Macro-oxygenation: Effect on sulfurous off-odours. Aust. J. Grape Wine Res. 2016, 22, 24–35. [Google Scholar] [CrossRef]
  45. Rankine, B.; Pocock, K. Alkalimetric determination of sulphur dioxide in wine. Aust. Wine Brew. Spirit Rev. 1970, 88, 40–44. [Google Scholar]
Figure 1. Genus-level metabarcoding analysis of community response to SO2 addition. Vintage 2018 Chardonnay juice was treated with increasing concentrations of total SO2 (mg/L) or glutathione (GSH, 250 mg/L) as an alternate antioxidant. Ferment samples were taken at four timepoints (T1, at crush; T2, 10% sugar utilization; T3, 50% sugar utilization; T4, 90% sugar utilization) and subjected to ITS metabarcoding. Only genera that exceeded 0.1% abundance in at least one sample are shown.
Fermentation 06 00062 g001
Figure 2. Species-level meta-barcoding analysis of community response to the SO2 addition. Vintage 2018 Chardonnay juice was treated with increasing concentrations of total SO2 (mg/L) or glutathione (GSH, 250 mg/L) as an alternate antioxidant. Ferment samples were taken at four timepoints (T1, at crush; T2, 10% sugar utilization; T3, 50% sugar utilization; T4, 90% sugar utilization) and subjected to ITS metabarcoding. Only species that exceeded 0.1% abundance in at least one sample are shown. For those OTU where a species-level designation was not possible, the genus-level taxonomic classification of the OTU was used. Only members of the genus Hanseniaspora are colored.
Fermentation 06 00062 g002
Figure 3. Genus-level meta-barcoding analysis of community response to the SO2 addition. Vintage 2019 Chardonnay juice was treated with increasing concentrations of total SO2 (mg/L). Ferment samples were taken at four timepoints (T1, at crush; T2, 10% sugar utilization; T3, 50% sugar utilization; T4, 90% sugar utilization) and subjected to ITS metabarcoding. Only genera that exceeded 0.1% abundance in at least one sample are shown.
Fermentation 06 00062 g003
Figure 4. Species-level metabarcoding analysis of community response to the SO2 addition. Vintage 2019 Chardonnay juice was treated with increasing concentrations of total SO2 (mg/L). Ferment samples were taken at four timepoints (T1, at crush; T2, 10% sugar utilization; T3, 50% sugar utilization; T4, 90% sugar utilization) and subjected to ITS metabarcoding. Only species that exceeded 0.1% abundance in at least one sample are shown. For those OTU where a species-level designation was not possible, the genus-level taxonomic classification of the OTU was used. Only members of the genus Hanseniaspora are colored.
Fermentation 06 00062 g004
Figure 5. Dissimilarity analysis of ITS-amplicon abundance from vintage 2018 and 2019 fermentations. (A) Triplicate samples from each time point were subjected to Bray–Curtis dissimilarity analysis (clustered by PCoA) based upon the top 10 most abundant species and are shaded by treatment condition. (B) The weightings of the top 10 most abundant species relative to the plots in part (A). Points are shaded by species. For those OTU where a species-level designation was not possible, the genus-level taxonomic classification of the OTU was used.
Fermentation 06 00062 g005
Figure 6. Concentration differences in aroma compounds due to the addition of SO2. (A) Analytes with significantly reduced (ANOVA, p ≤ 0.001) concentrations in 2018. (B) Analytes with significantly increased (ANOVA, p ≤ 0.001) concentrations in 2018. (C) Analytes with significantly decreased (ANOVA, p ≤ 0.001) concentrations in 2019. (D) Analytes with significantly increased (ANOVA, p ≤ 0.001) concentrations in 2019. Individual bars are shaded according to their significance group and the estimated aroma thresholds (see Materials and Methods) are indicated in red.
Fermentation 06 00062 g006
Table 1. Juice composition.
2018
pH3.32
Total soluble solids22.3°Brix
Yeast assimilable nitrogen249 mg/L
Ammonia87 mg/L
Alpha amino nitrogen177 mg/L
Titratable acidity pH 7.05.7 g/L
Titratable acidity pH 8.26.0 g/L
2019
pH3.41
[Glucose + Fructose]229.6 g/L
Yeast assimilable nitrogen412 mg/L
Ammonia147 mg/L
Alpha amino nitrogen291 mg/L
Titratable acidity pH 7.05.7 g/L
Titratable acidity pH 8.26.0 g/L

