Article

SSR-Marker Analysis—A Method for S. cerevisiae Strain Characterization and Its Application for Wineries

by
Friederike Rex
1,*,
Adeline Hirschler
1 and
Maren Scharfenberger-Schmeer
1,2
1
Institute for Viticulture and Oenology, Dienstleistungszentrum Ländlicher Raum (DLR) Rheinpfalz, Breitenweg 71, D-67435 Neustadt, Germany
2
Hochschule Kaiserslautern, Weincampus Neustadt, Breitenweg 71, D-67435 Neustadt, Germany
*
Author to whom correspondence should be addressed.
Submission received: 28 September 2020 / Revised: 23 October 2020 / Accepted: 24 October 2020 / Published: 26 October 2020

Abstract

:
Considering that many Saccharomyces cerevisiae strains exist and that they have different fermentation capacities, the challenge is to select the yeast strain that generates the most interesting wine character and wine flavor for the winemaker. A method based on simple sequence repeats (SSRs) markers, occurring in the yeast genome, was developed to differentiate the collected S. cerevisiae strains. For the amplification of the polymorphic SSR markers performed by polymerase chain reaction (PCR), two primer sets showing different size products for different S. cerevisiae strains were designed. The PCR-method with gel electrophoresis was validated using capillary sequencing and then used as a service for winegrowers combined with a sensory analysis via napping. This approach can be used for the preservation of the yeast diversity associated with given terroirs and as an option for an increased safety of fermentations. The application of S. cerevisiae strains collected in spontaneous fermentations and used for fermentation sustains the initial character of the wine and ensures a secure fermentation at the same time.

1. Introduction

Yeasts, eukaryotic unicellular microorganisms, have been used for thousands of years for the production of alcoholic beverages or food [1]. In the scientific classification, yeasts belong to the kingdom Fungi and are part of the Ascomycota phylum. In wine production, these organisms are essential for the fermentation process and for the character of each specific wine [2,3]. The most abundant yeasts in a vineyard are generally the yeasts of the genre Candida, Hanseniaspora, Pichia and Metschnikowia [4,5]. The specie S. cerevisiae is present in a smaller proportion. The freshly pressed, sugar-rich grape must offers optimal conditions to these microorganisms for their growth. During fermentation, the diversity of yeasts decreases, due to the production of ethanol, which is toxic to cells and leads to cell death [6,7]. The alcohol-tolerance limit varies depending on the genus and species of the yeast. The species S. cerevisiae tolerates the highest ethanol concentration [8]. Non-Saccharomyces yeasts die above an ethanol concentration of 4% (v/v), and S. cerevisiae becomes the dominant species [9]. To ensure a successful fermentation, the presence of S. cerevisiae is essential for winegrowers. For a reliable and predictable fermentation process, the must fermentation can be carried out by adding a sufficient amount of a pure culture of a selected commercially available S. cerevisiae yeast strain [10]. Consequently, this will prevent stuck fermentation and off-flavors that may be generated by other microorganisms naturally present on grapes [11]. In fact, by adding a commercially available wine yeast, other microorganisms present in a negligible quantity in the must will be suppressed. Contrary to such an induced fermentation, a spontaneous fermentation lets the must ferment exclusively with the yeasts and other microorganisms naturally occurring in the vineyards. These endogenic organisms live on the skin of the grapes or are part of the cellar flora. The implementation of a spontaneous fermentation allows the winegrowers to develop a unique terroir flavor and an individual wine character. In fact, the yeast flora differs from one vineyard to another, indicating that terroir-specific yeasts can contribute to the wine’s individuality [12]. The marketing strategy of such wines is to reach a consumer society that is striving for more natural and local products [13]. However, in spontaneous fermentation, risks of fermentation blockage or the presence of off-flavors due to harmful microorganisms exist [14,15]. An alternative strategy for winegrowers consists in propagating yeast that originates from their own vineyard in order to inoculate the must, conjugating unique sensory attributes with safe fermentations [16].
S. cerevisiae is widely used as a model organism in cell biology and genetics. In 1996, it was the first eukaryote for which one strain’s genome was sequenced [17]. Its nuclear genome, composed of 16 linear chromosomes, contains about 12 million base pairs and 6275 genes. In the genome, Simple Sequence Repeats (SSRs), also called microsatellites, are short DNA motifs (two to six bases) repeated continuously five to 50 times. Weller and Jeffreys first characterized SSR in 1984 [18] as a “polymorphic GGAT repeat” in the human myoglobin gene. The genetic transmission of these noncoding sequences follows Mendel’s laws of heredity. Their patterns are very abundant throughout the genome of most eukaryotes and prokaryotes [19]. The sequence lengths of SSRs are intra- and interspecific across species. Because SSRs suffer higher rates of mutation than the rest of the genome [20], polymorphic SSRs are a powerful biological tool for the genetic differentiation of S. cerevisiae strains as they can be used as molecular markers. Indeed, depending on the size of the SSR, it is possible to differentiate strains from each other. SSR markers were also used for genotyping the yeast Brettanomyces bruxellensis at the strain level [21] and for other organisms such as the potato, whose genotype is highly heterozygous for multiple SSR alleles [22]. SSR markers are highly informative and are useful for fingerprinting and linkage studies.
This work focuses on the development of a fast method for S. cerevisiae strain differentiation. Strain differentiation is already possible by sequencing the genome, but this is still a cost-intensive method. Other methods such as karyotyping or the restriction fragment length polymorphism (RFLP) analysis of mDNA or the SC1/SC2 marker are used for strain differentiation [23,24,25] but have limits because they are hardly applicable for a routine analysis or insufficiently discriminating at the strain level [26]. On the contrary, SSR analyses were already used for the characterization of S. cerevisiae strains [26,27] or for S. cerevisiae strain diversity studies [28]. Here, a polymerase chain reaction (PCR)-based SSR-marker method combined with microvinifications and a napping was applied as an alternative method to be used as a quick and low-budget service for winegrowers [26,29,30]. The developed method is based on the analysis of polymorphic SSRs in yeast genome. For the development, 15 primers were tested [28]. These primers were designed in order to amplify specific polymorphic SSR-regions of S. cerevisiae. Multiplex sets were realized by combining several primers. The length of the fragment was observed by agarose gel electrophoresis (Figure 1). The aim is a winery’s own yeast, which can be provided as a starter culture and applied in a winery in the Netherlands (Flevoland) following a detailed protocol (Figure 1).

2. Materials and Methods

2.1. Material

2.1.1. Commercially Available Saccharomyces Cerevisiae Strains

Nine commercially available S. cerevisiae yeasts were used. These dry yeasts, listed in Table 1, were rehydrated and used as indicated in the manufacturer’s instructions.

2.1.2. Wine Samples

The samples were collected in 2019 in five different spontaneous fermentations tanks of a winery. The winery was harvested in 2017 for the first time. The vineyard was isolated and located in Lelystad (Province of Flevoland) in the Netherlands. Only spontaneous fermentation were conducted in this winery.

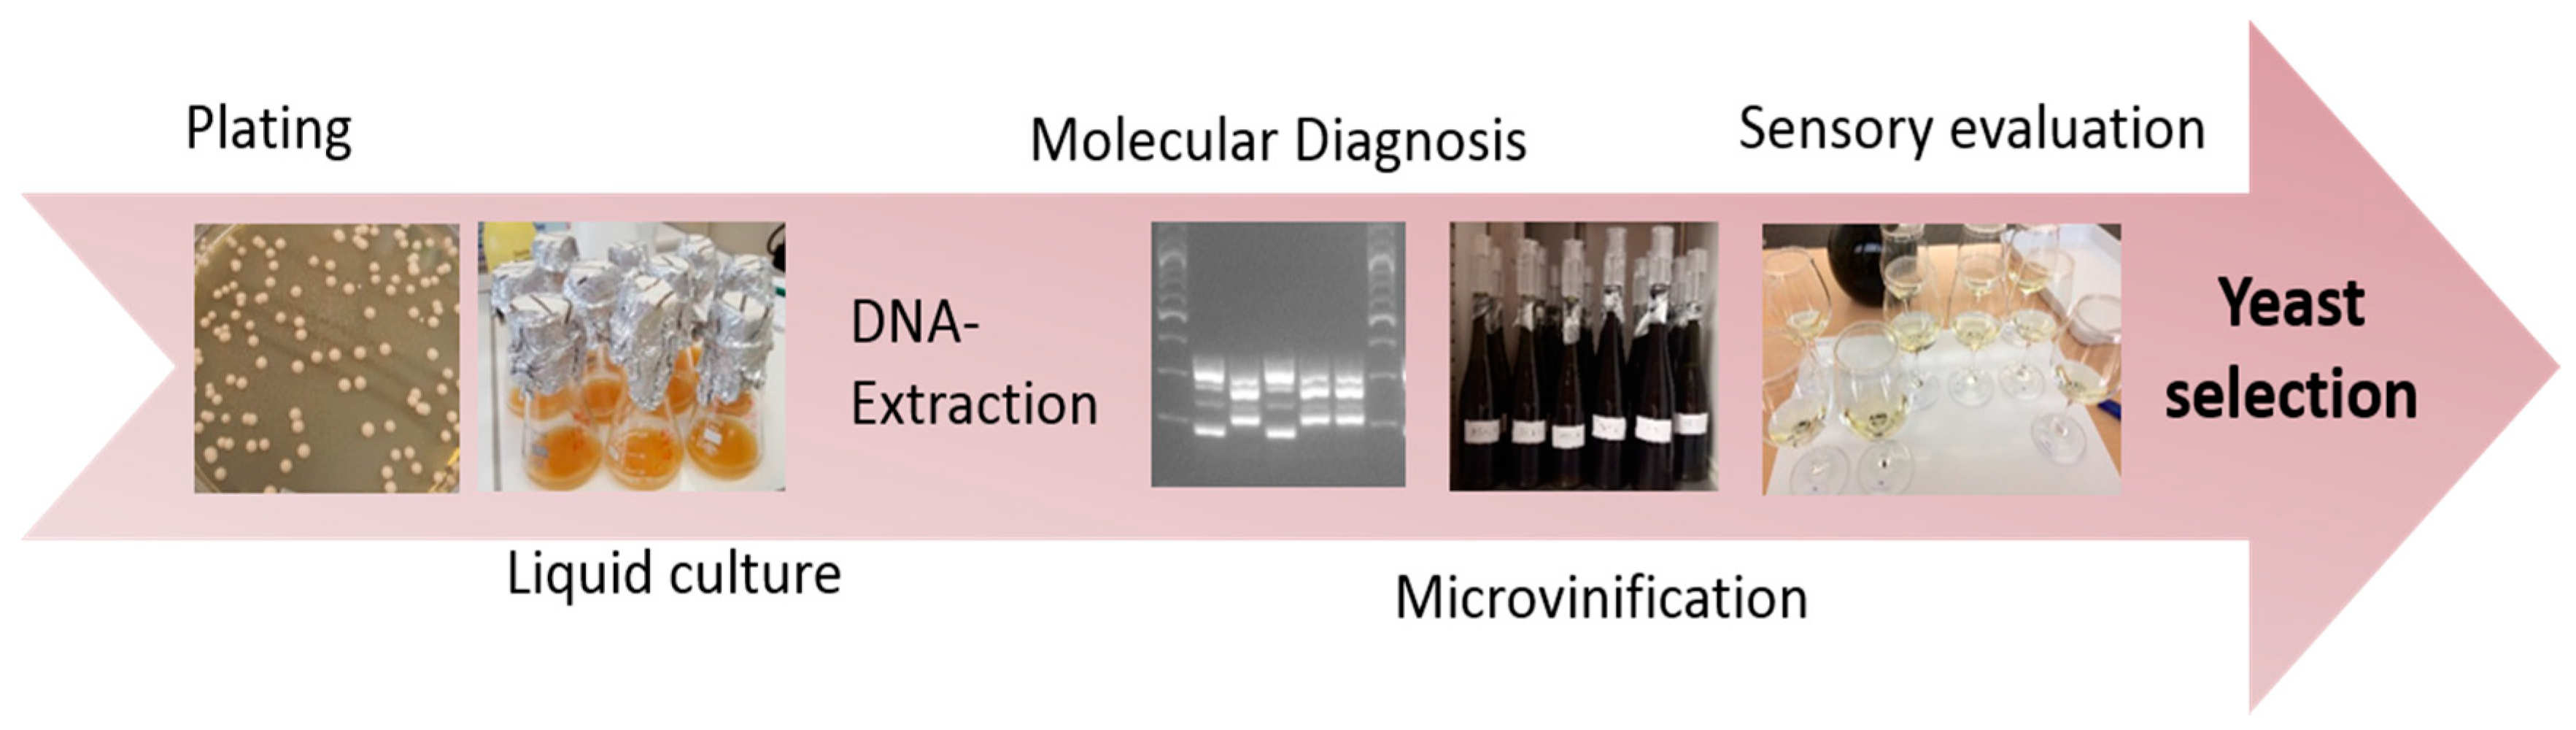
2.1.3. Yeast Isolation and Preservation

The samples were plated on YPD-Agar (Yeast Extract-Peptone-Dextrose, Carl Roth, Karlsruhe, Germany) culture medium. For an optimal isolation, these samples were diluted in 0.9% NaCl, with dilution factors ranging from 103 to 106. After three days, 10 colonies of S. cerevisiae from each sample were transferred into liquid YPD-Medium. For yeast conservation, 700 µL of glycerol (AppliChem, Darmstadt, Germany) and 300 µL of the three days-old liquid culture were put in a cryogenic tube. The tubes were homogenized and immersed in liquid nitrogen in order to shock-freeze the yeasts. 10 µL of the culture were also observed under the microscope before preservation in order to verify the absence of contamination. Ten randomly chosen S. cerevisiae yeast colonies of each sample, and therefore a total of 50 yeasts, were isolated and preserved.

2.2. Methods:

2.2.1. DNA Extraction

DNA-extraction was done with the Qiagen DNeasy Kit (Qiagen, Hilden, Germany) following the manufacturer’s instructions. Cell lysis was performed by the lyticase from Arthrobacter luteus (Sigma-Aldrich, Darmstadt, Germany). DNA extracted from cultures was quantified using a NanoDrop ND-1000 spectrophotometer (Thermo-Fisher Scientific Inc., Darmstadt, Germany).

2.2.2. SSR-PCR

Fifteen published primer pairs were tested [28] (Table 2). The primers were first checked in order to determine the size range of the PCR product. Primers generating product-length differences between the nine commercially available strains listed in Table 1 were selected for the multiplex combination.
For the PCR, the Qiagen Multiplex PCR Kit (Qiagen, Hilden, Germany) was used following the instructions suggested for the amplification of microsatellite loci (Table 2). The PCR settings were the following: Initiation (95 °C, 3 min); Denaturation (95 °C, 30 s); Annealing (60 °C, 30 s); Extension (72 °C, 1 min); and Final Extension (72 °C, 7 min). Thirty-five cycles were performed.

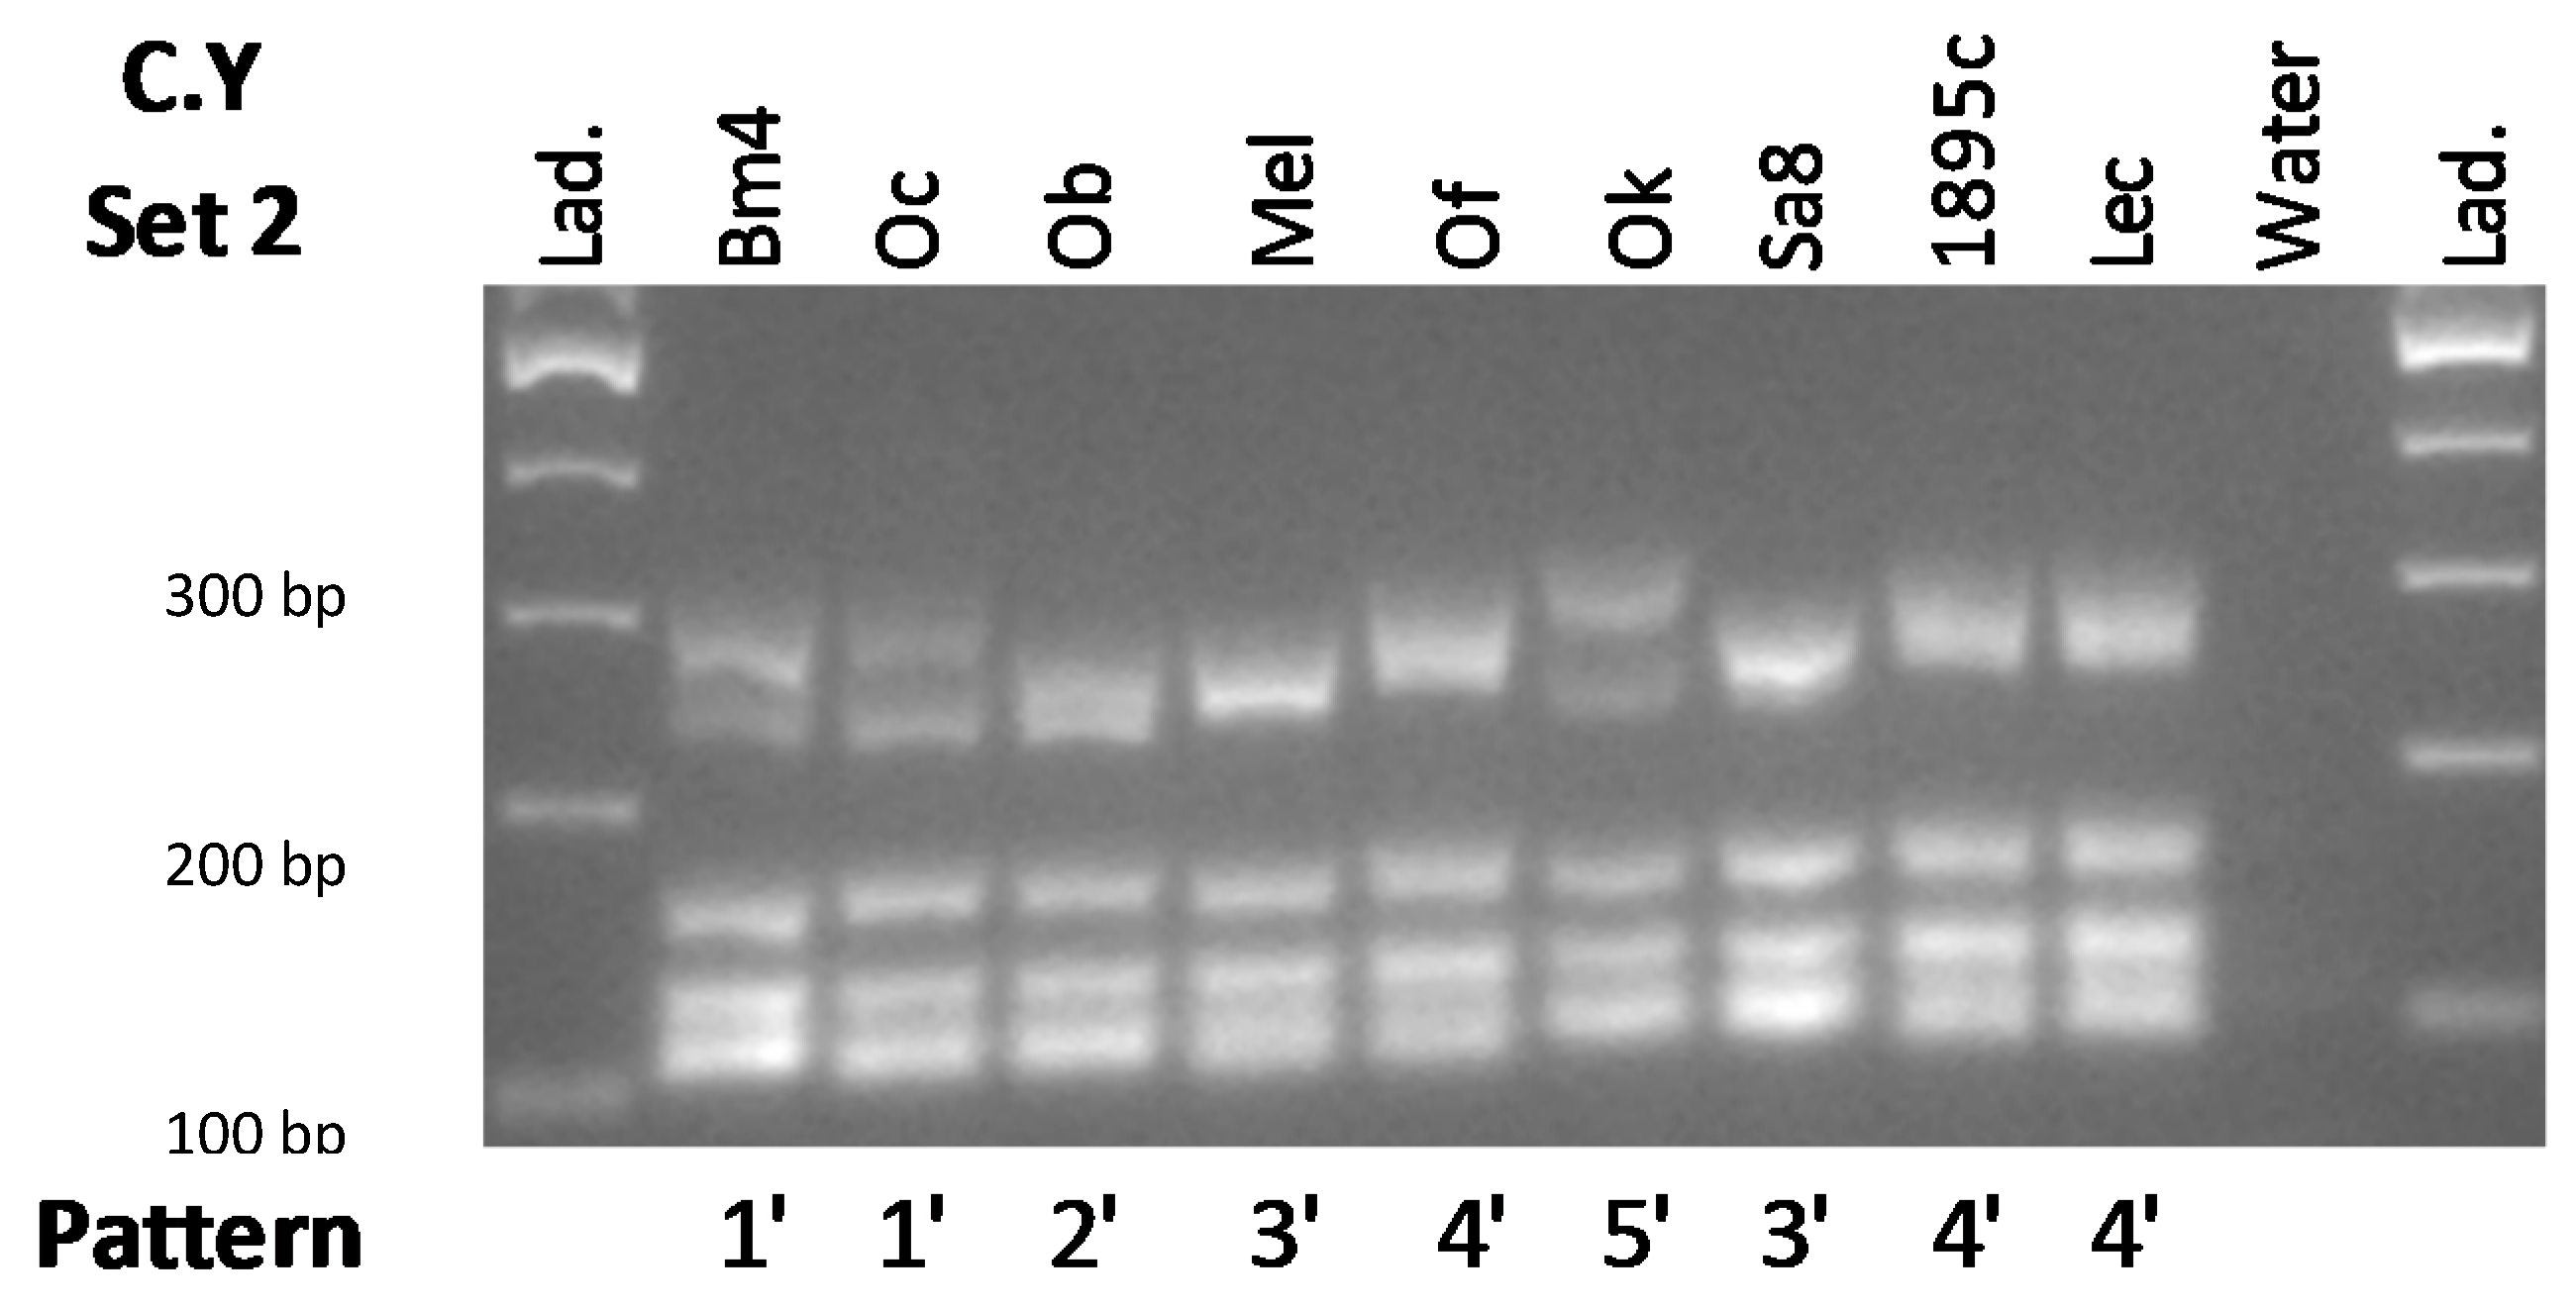
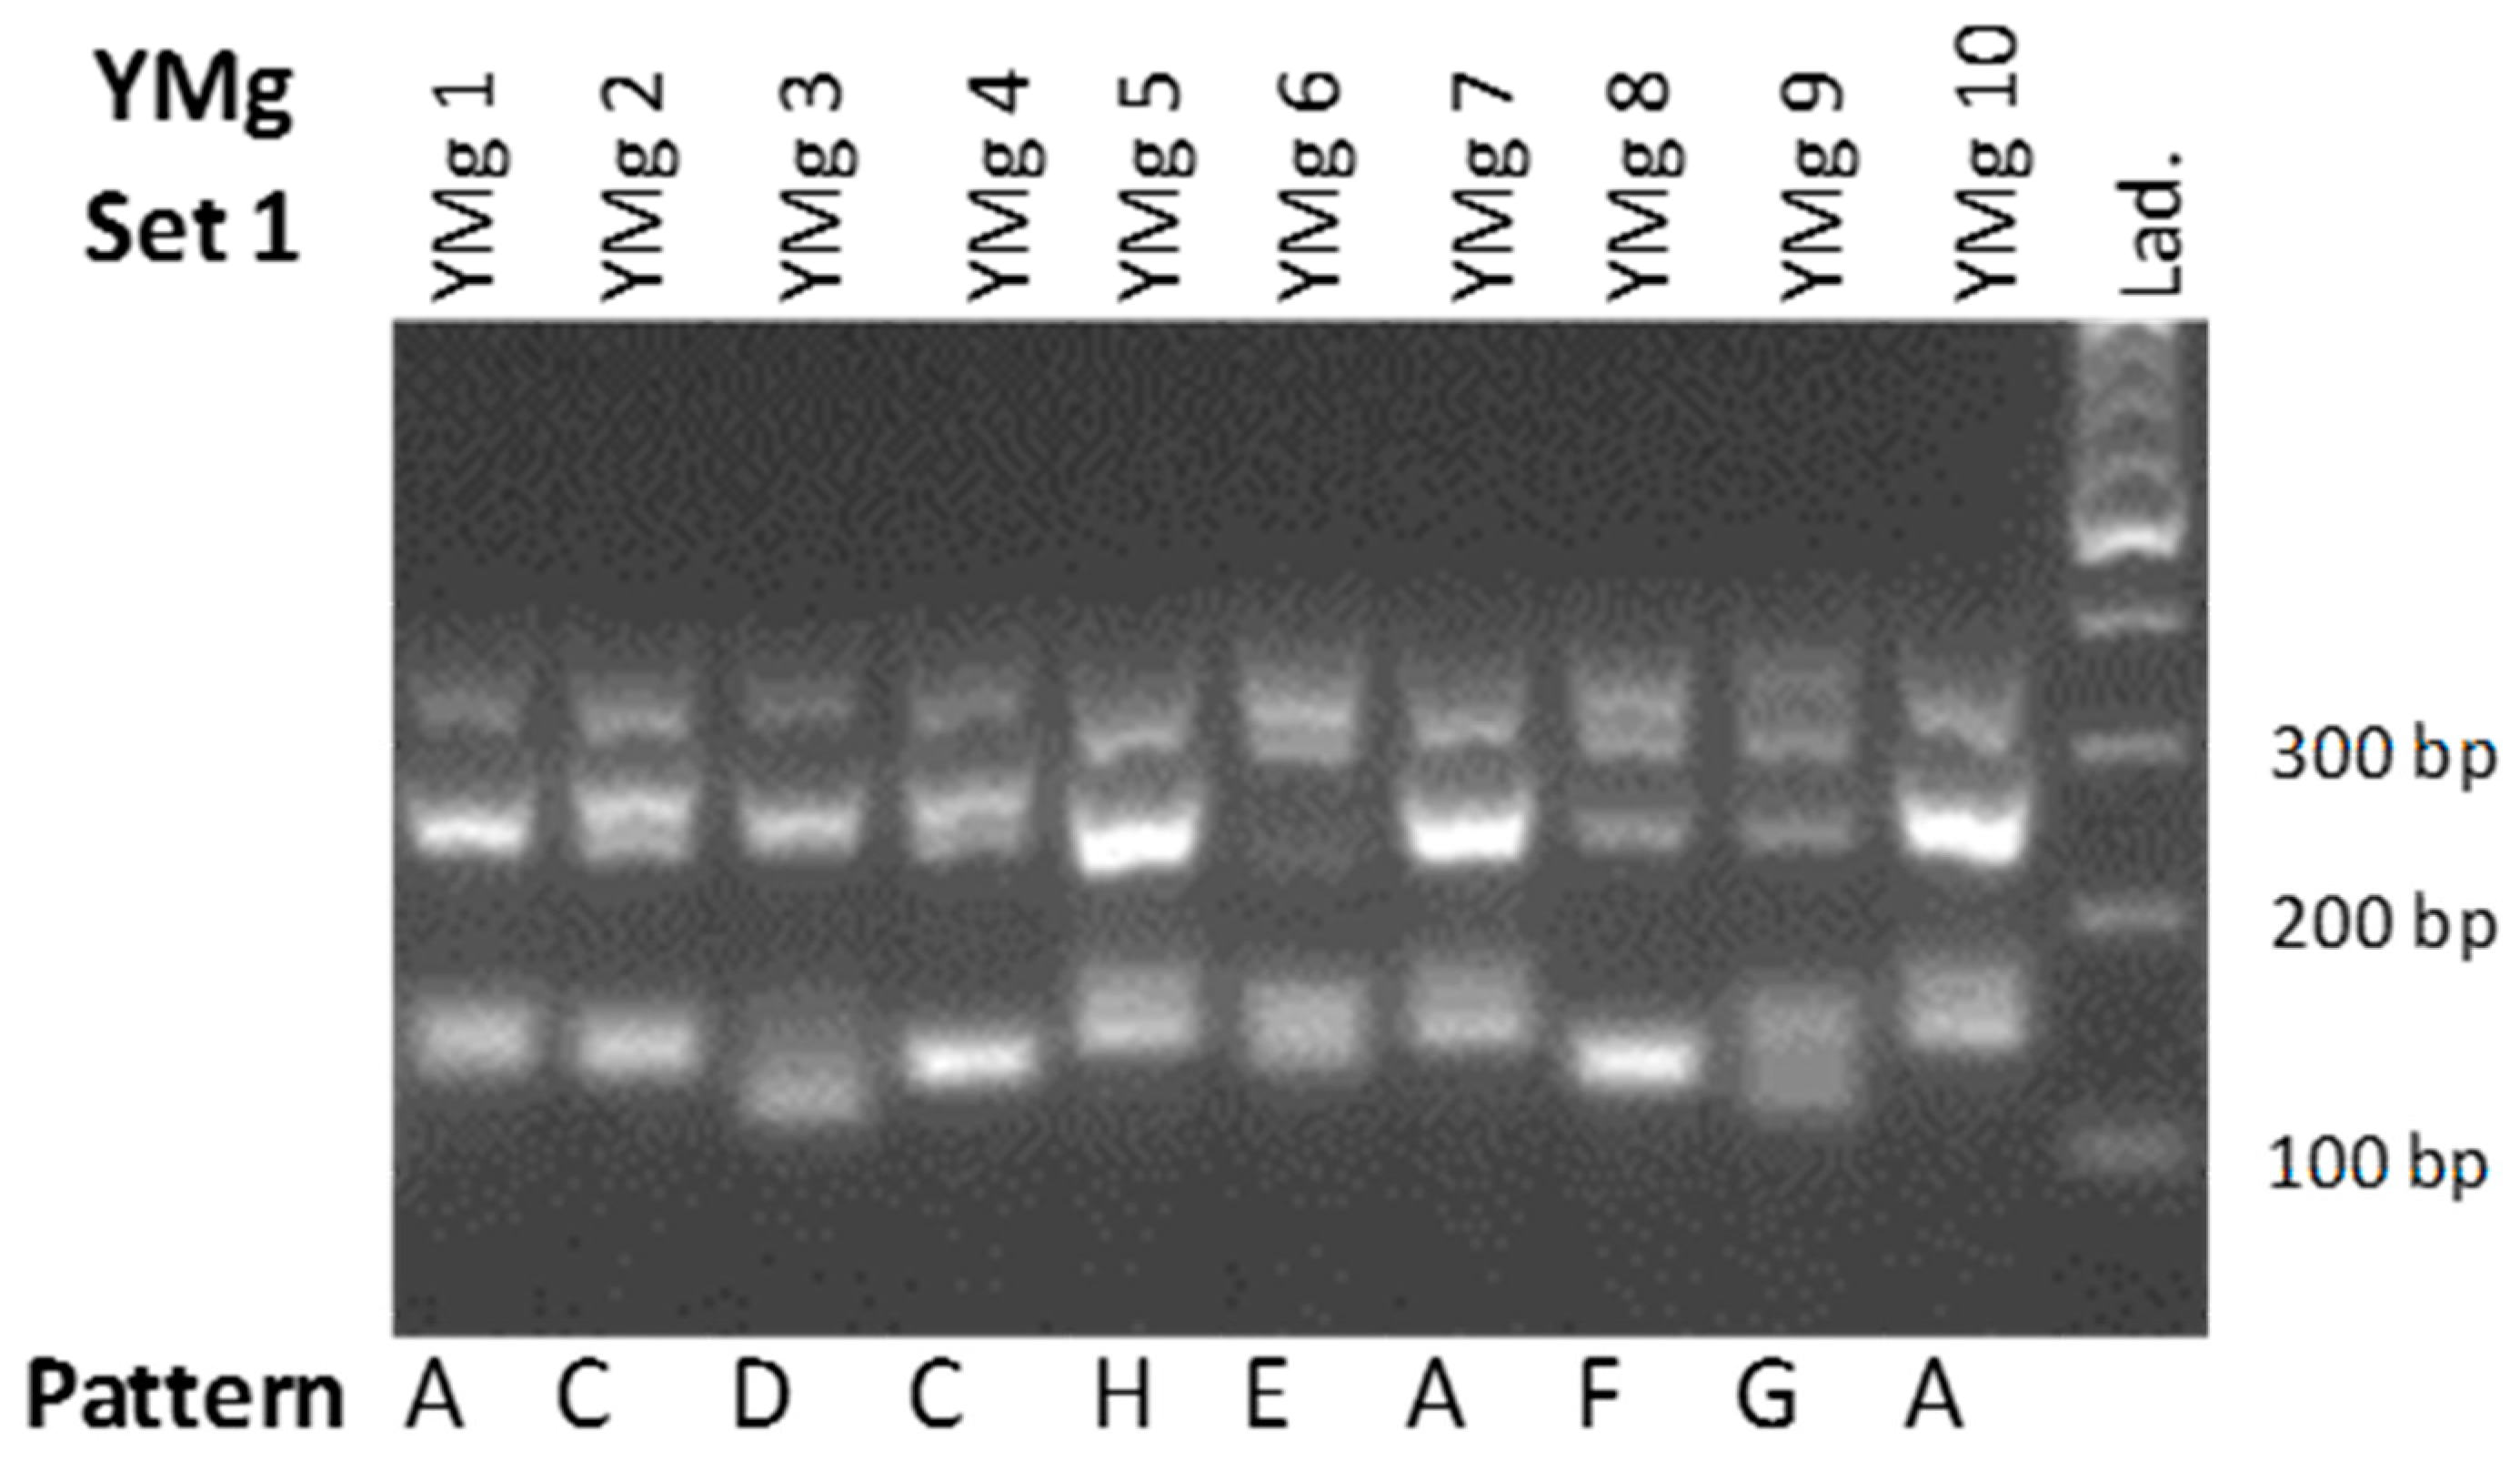
2.2.3. Fragment Length Determination by Agarose Gel Electrophoresis

The result of the PCR was visualized by gel electrophoresis using a 2% agarose gel. 100 mL TAE-Buffer (AppliChem GmbH, Darmstadt, Germany) and 2 g agarose (AppliChem GmbH, Darmstadt, Germany) were taken, as well as 10 µL of the fluorescent dye GelRed (GeneON, Ludwigshafen, Germany). The loaded samples were composed of 5 µL of PCR product added to 1 µL loading dye (Thermo Fisher Scientific, Waltham, MA, USA). An electric field (90 mA, 90 V, 8 W) was applied for 2 h.

2.2.4. Capillary Sequencing and Method Validation

For a better precision in order to validate the method of the agarose gel, the Capillary Sequencer ABI 3130xl Genetic Analyzer (Applied Biosystems, located within Geilweilerhof, Siebeldingen, Germany) was used. The PCR was carried out as described, but labeled primers were used for the detection in the sequencer. The electrophoresis profiles were captured by ABI 3130 xL Data Collection software. The reading of the size of the different amplified SSRs from the sequencer was performed using the GeneMapper v4.0 (Thermo Fisher Scientific, Waltham, MA, USA) software.

2.2.5. Fermentation and Sensory Tests

For each yeast strain, 750 mL Weißburgunder must was inoculated with 1.0 × 10⁸ yeast cells. The determination of the yeast concentration and viability was performed by the Oculyze Fermentation Wine (FW, Oculyze GmbH, Wildau Germany). 50 µL of yeast culture were added to 50 µL 0.01% alkaline methylene violet. After 5 min, 50 µL of the reaction were taken for the measurement. After inoculating the must, the fermentation was checked weekly with a density meter DM 35 Basic (Anton Paar, Ostfildern, Germany) for a few weeks, depending on the rate of each individual yeast fermentation. For the sensory perception, a panel of 17 people was taken for a napping sensory test [29,30)]. Graphic coordinates were attributed to each wine with the Fizz biosystems software, and the software FactoMineR [31] was used for the data analysis. The script was developed by Vestner 2019. The produced wines were also tasted by the owner of the winery who decided which of the identified yeasts were interesting enough for future wine-making.

3. Results

3.1. Primer Sets’ Composition and Method Validation

The size ranges of the commercially available yeast’s fragment length, obtained by agarose gel electrophoresis or sequencing, are shown in Table 3 for each primer set. Based on these results, two multiplex sets were created by combining primers of different size ranges. The first one combines the primers ScAAT2, ScAAt3, C5, SCYOR267c, C8 and C11. The second combines the primers YKL172w, C4, C9, ScAAT5, C6 and YPL009c. The molecular markers were combined while making sure to avoid overlapping fragment sizes and matching PCR conditions. The primers C3, ScAAT1 and YKR072c were not used for the primer set composition because they did not fulfill these preconditions.
The results of the gel electrophoresis for the commercially available yeasts after multiplex PCR are shown in Figure 2 and Figure 3. Six different fragment length patterns were obtained for Set 1 (A’ to F’) and five for Set 2 (1′ to 5′). Six pattern combinations for nine commercially available yeasts were obtained (A’1′, B’1′, C’2′, D’3′, E’4′ and F’5′).

3.2. Yeast Differentiation

The results of the different patterns obtained by gel electrophoresis for the winery’s own yeast after two multiplex SSR PCRs using sets 1 and 2 are summarized in Table 4. Ten different patterns (A to J) were present for the multiplex set 1, and eight different patterns (1 to 8) were present for the multiplex set 2. When combining the two sets, 21 different patterns could thus be obtained for the 50 yeasts. Examples of the patterns A and C–H are shown in Figure 4. The combination 1A shows the most recurrent combination, since it contains 18 of the 50 yeasts. Sixteen yeasts were single in their pattern category.

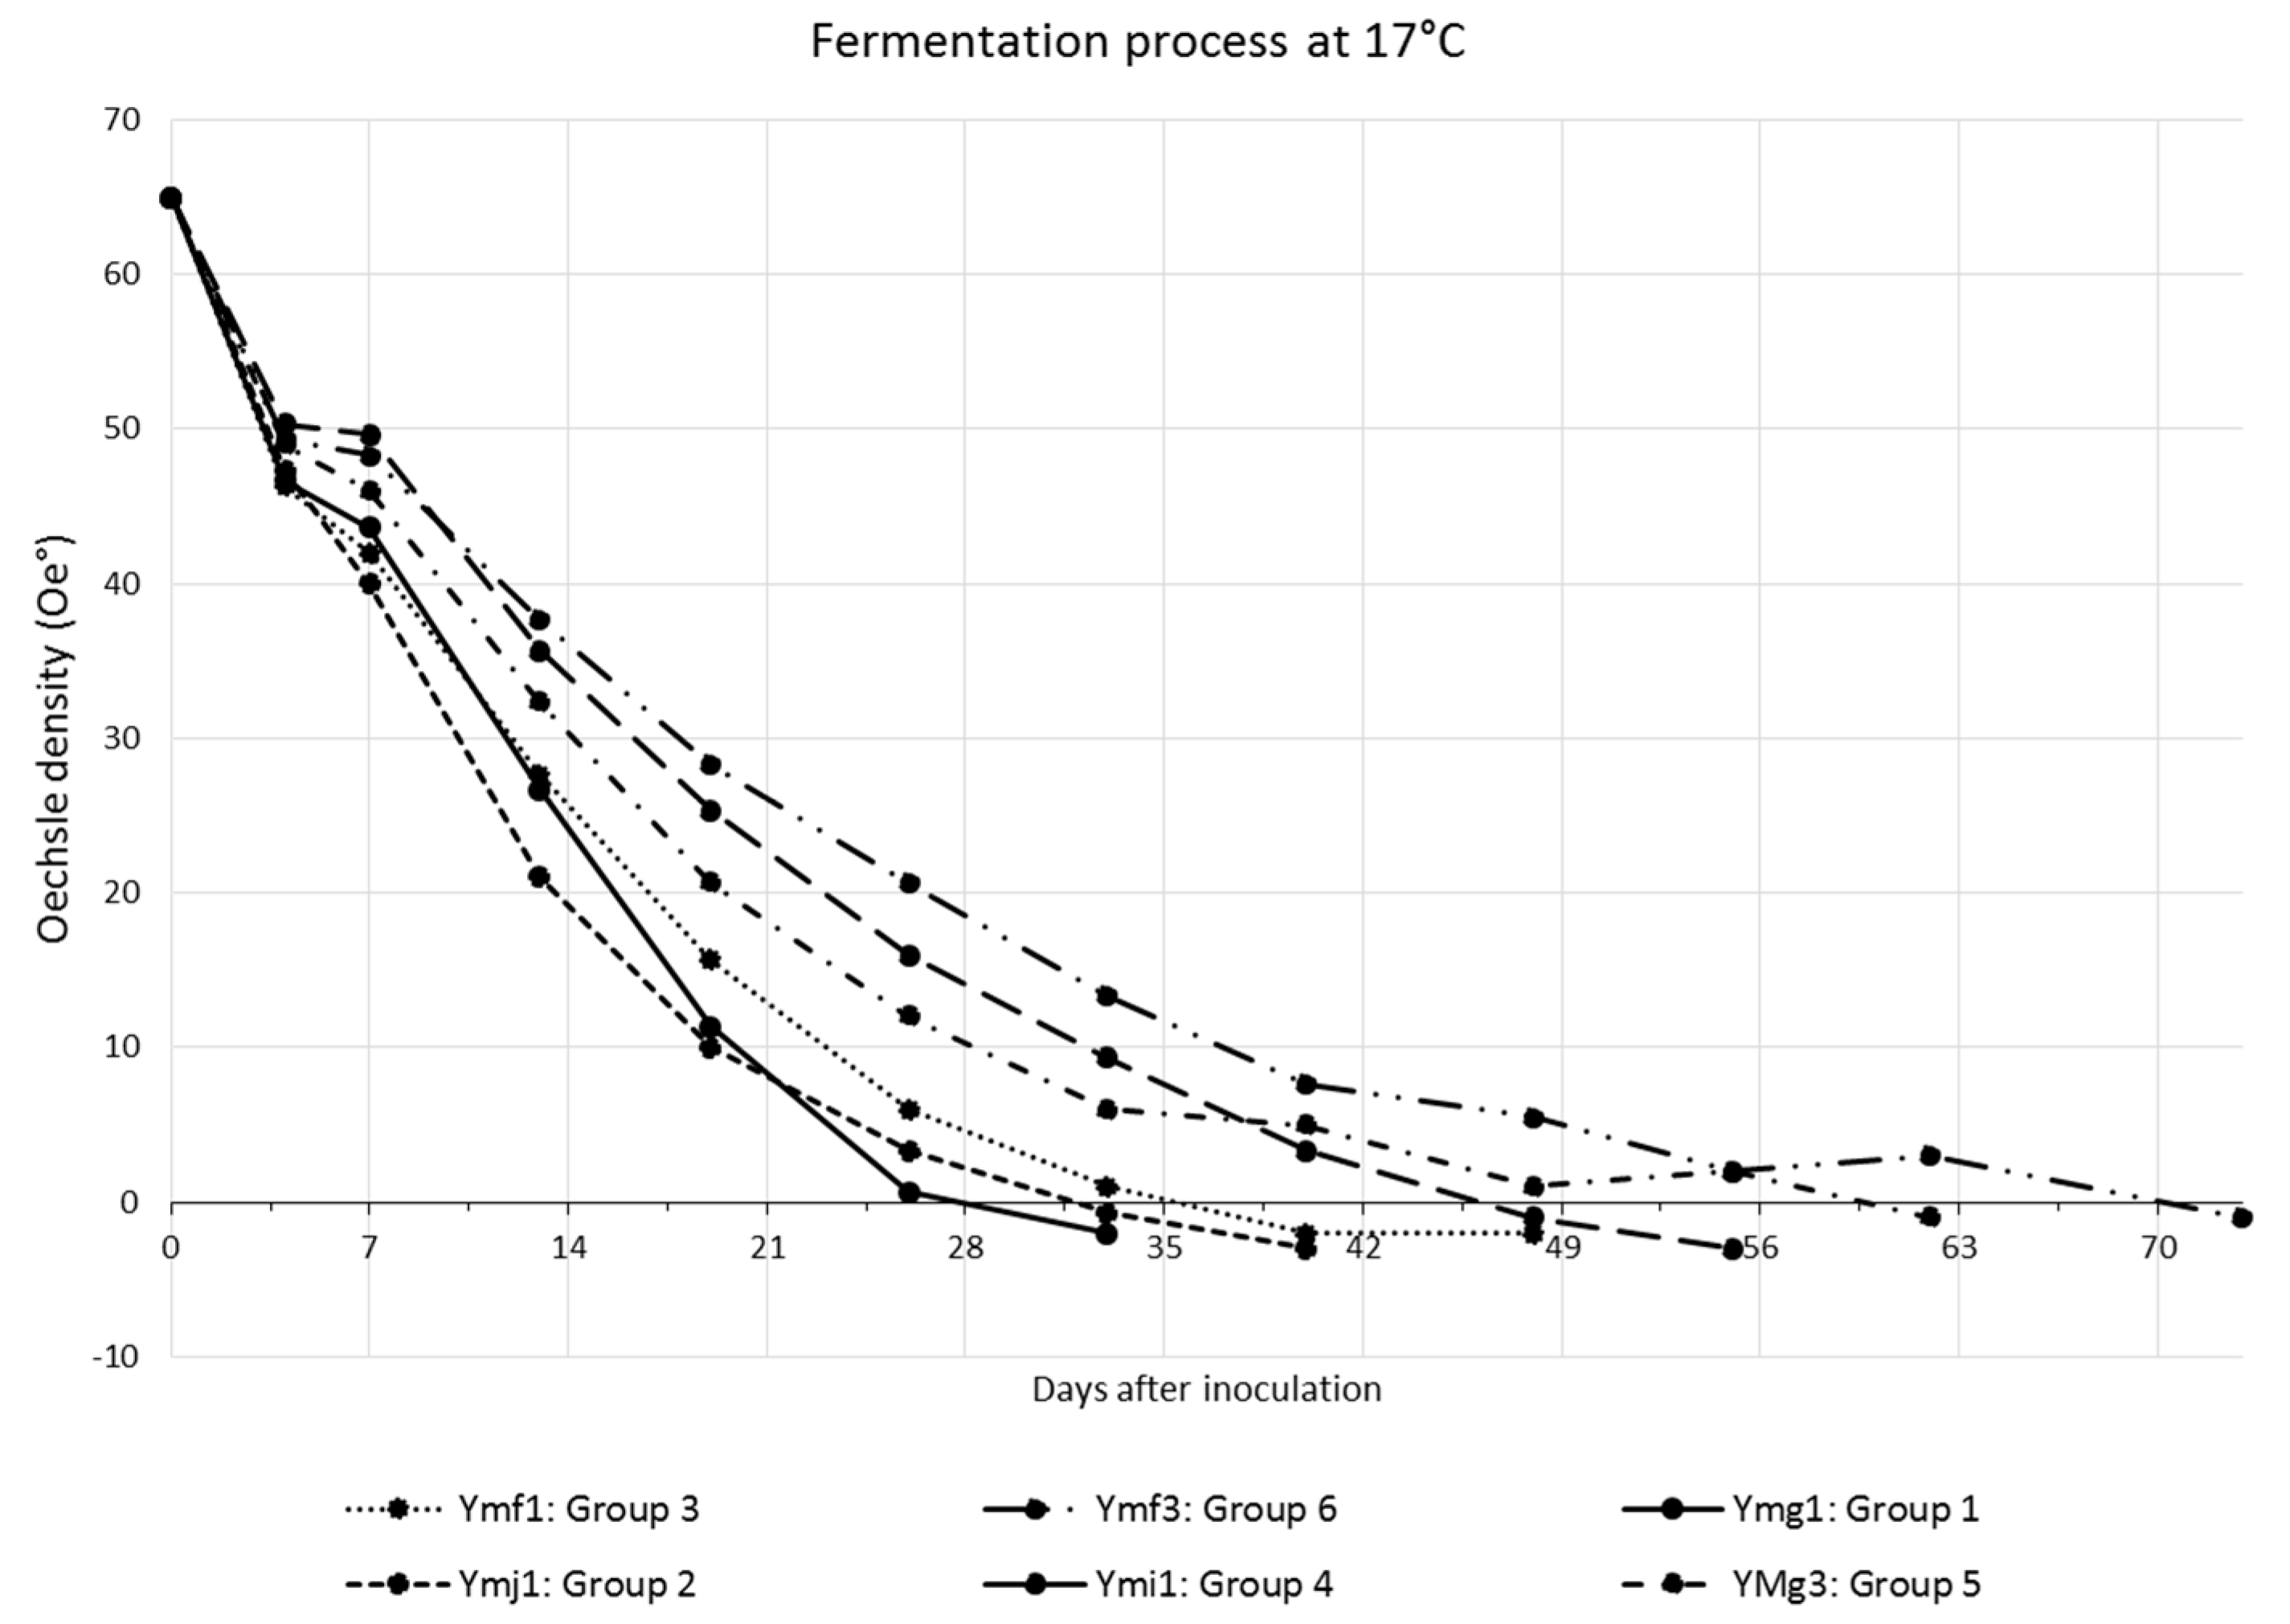
3.3. Fermentative Tests

Representative yeast strains were chosen for microvinification. Seventeen yeasts identified by SSR PCR were chosen: three yeasts of group 1A, one of 5A, one of 2B, one of 3C, one of 4C, two of 6C, one of 8C, one of 3D, one of 5E, one of 2F, one of 1G, one of 5H, one of 6H and one of 7I. These yeasts were chosen since they showed a different pattern in the SSR PCR and thus seemed to be different strains. Three yeasts from group 1A were taken in order to see if similarities could be observed as they were identical yeasts in terms of the pattern of the SSR PCR. After inoculation of sterile must with each yeast, the process of fermentation was monitored by a density meter. The fermentation process of one yeast of each group is presented in Figure 5, and the fermentation time is listed in Table 5. The initial must had a density of 65° Oe. The end of fermentation is characterized by a negative Oechsle degree. The fermentation time ranges from 33 to 73 days after inoculation, forming six groups with the same fermentation time.

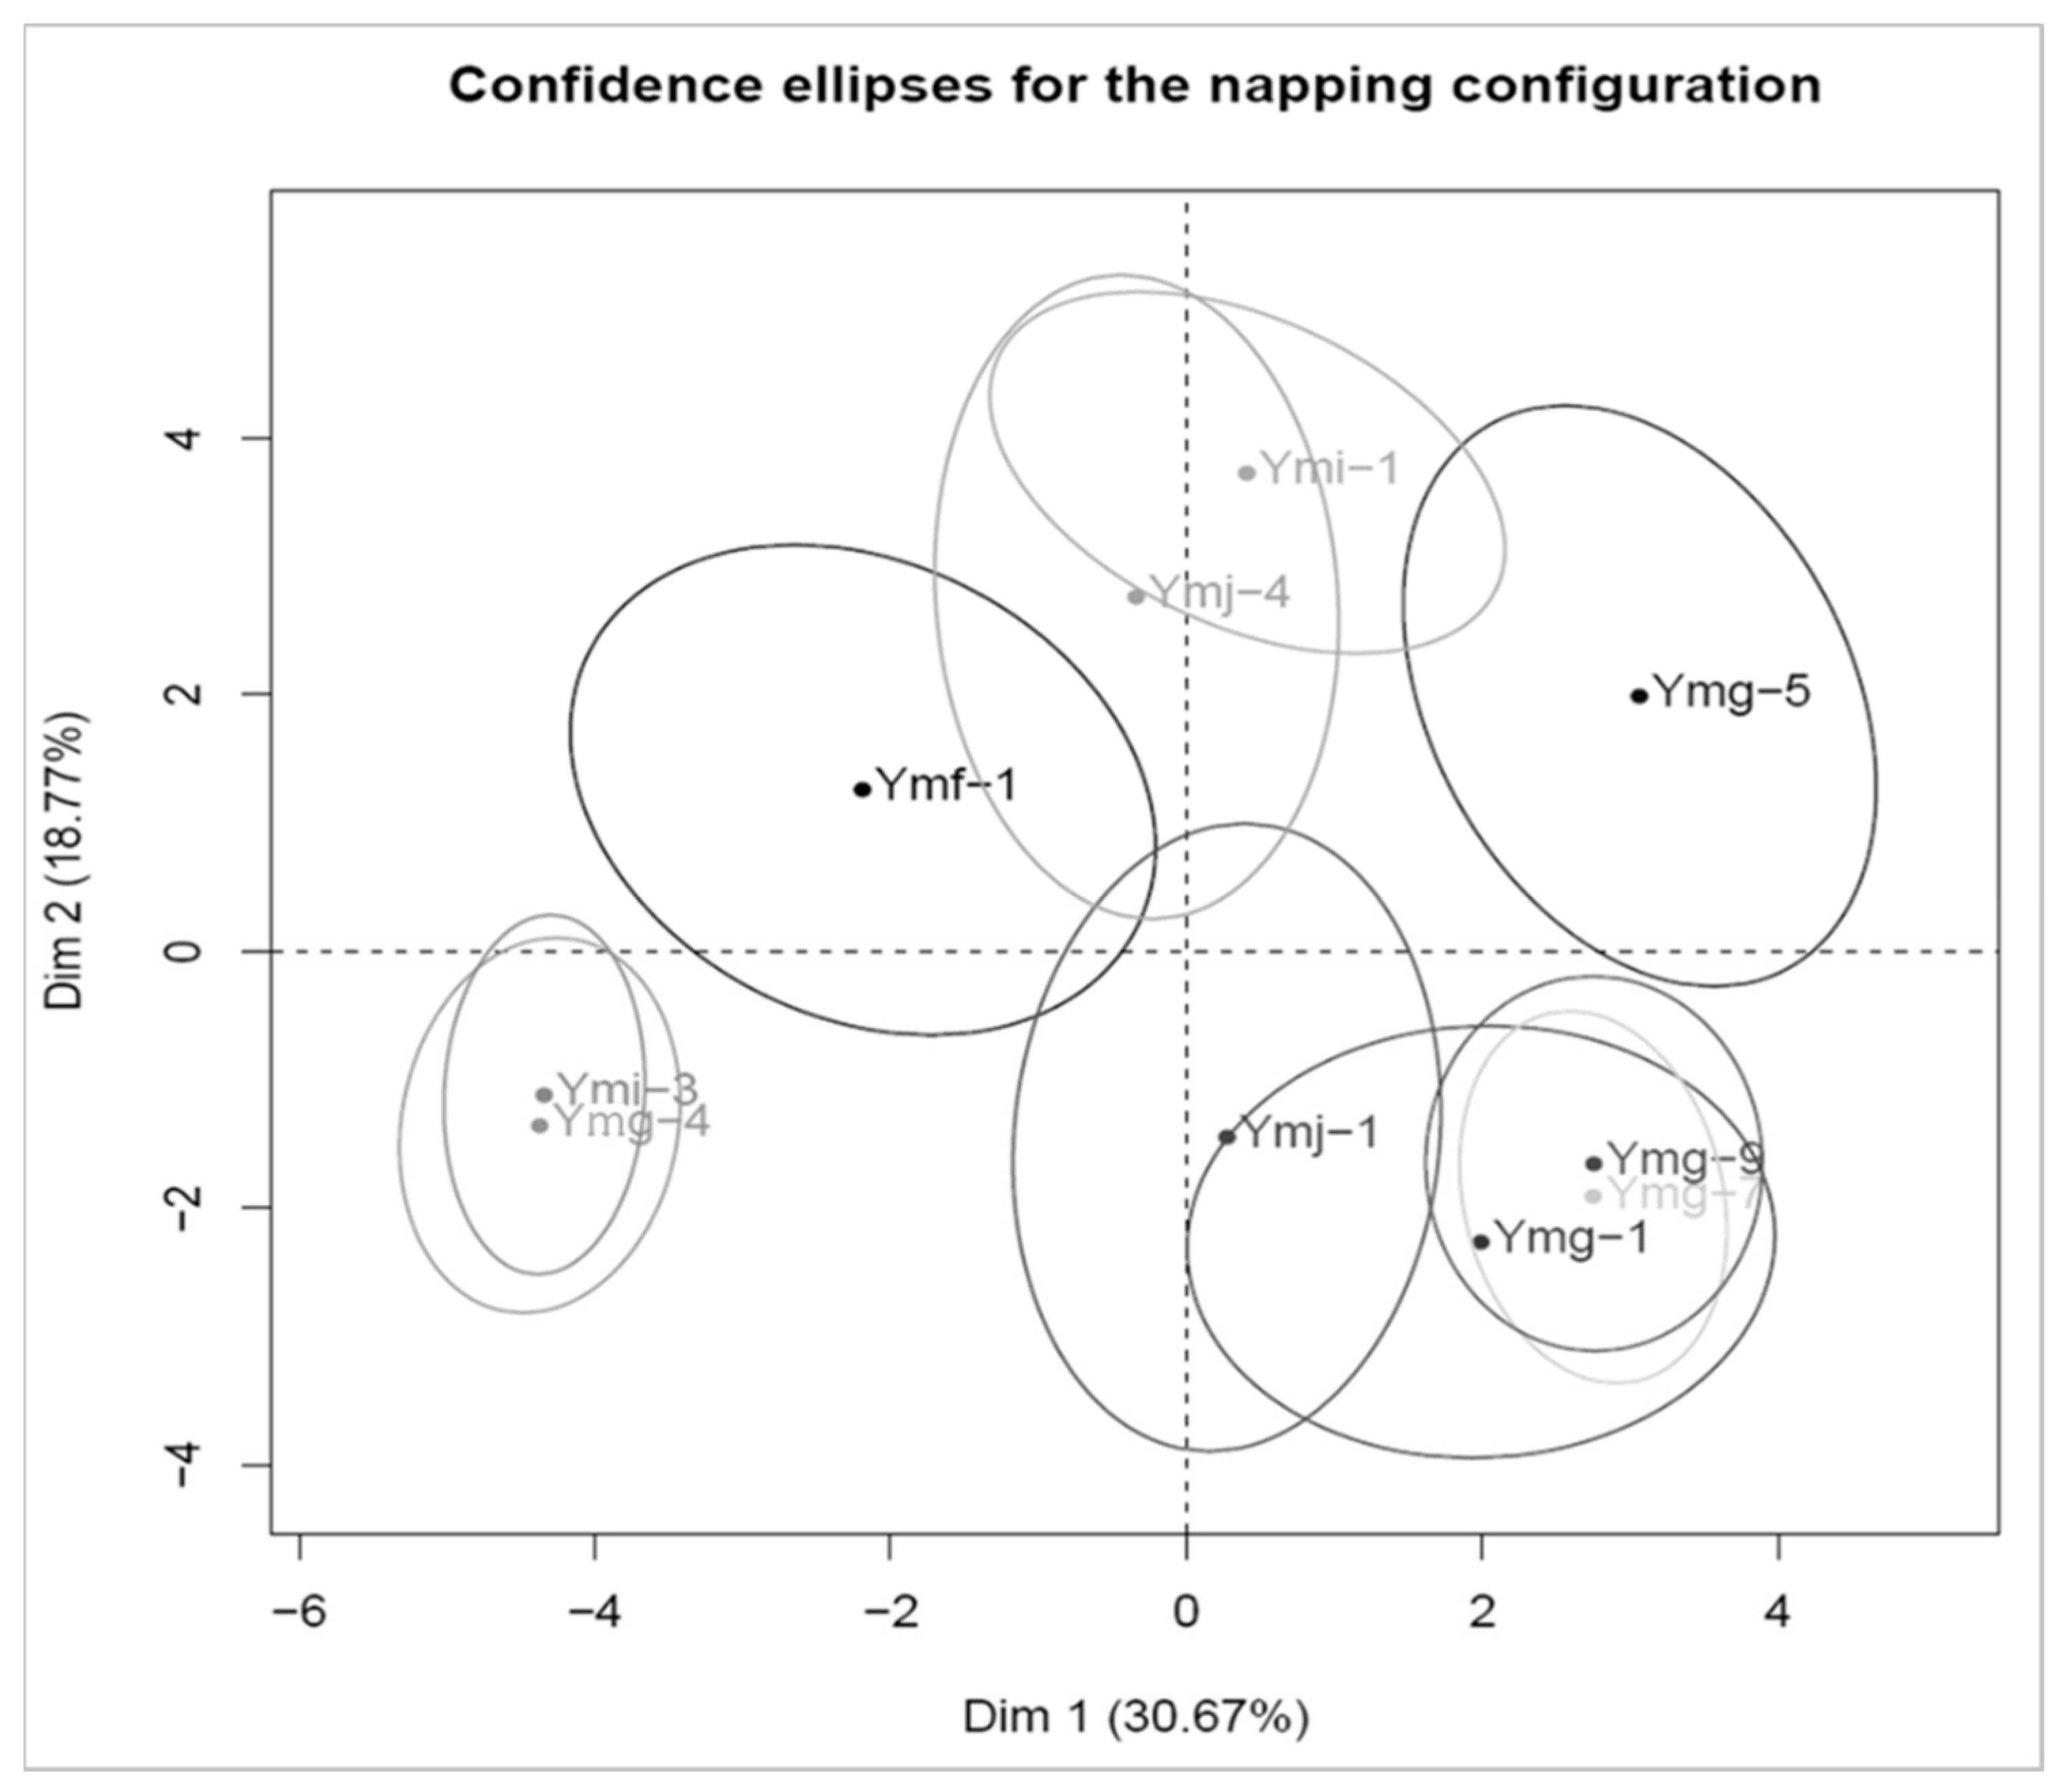
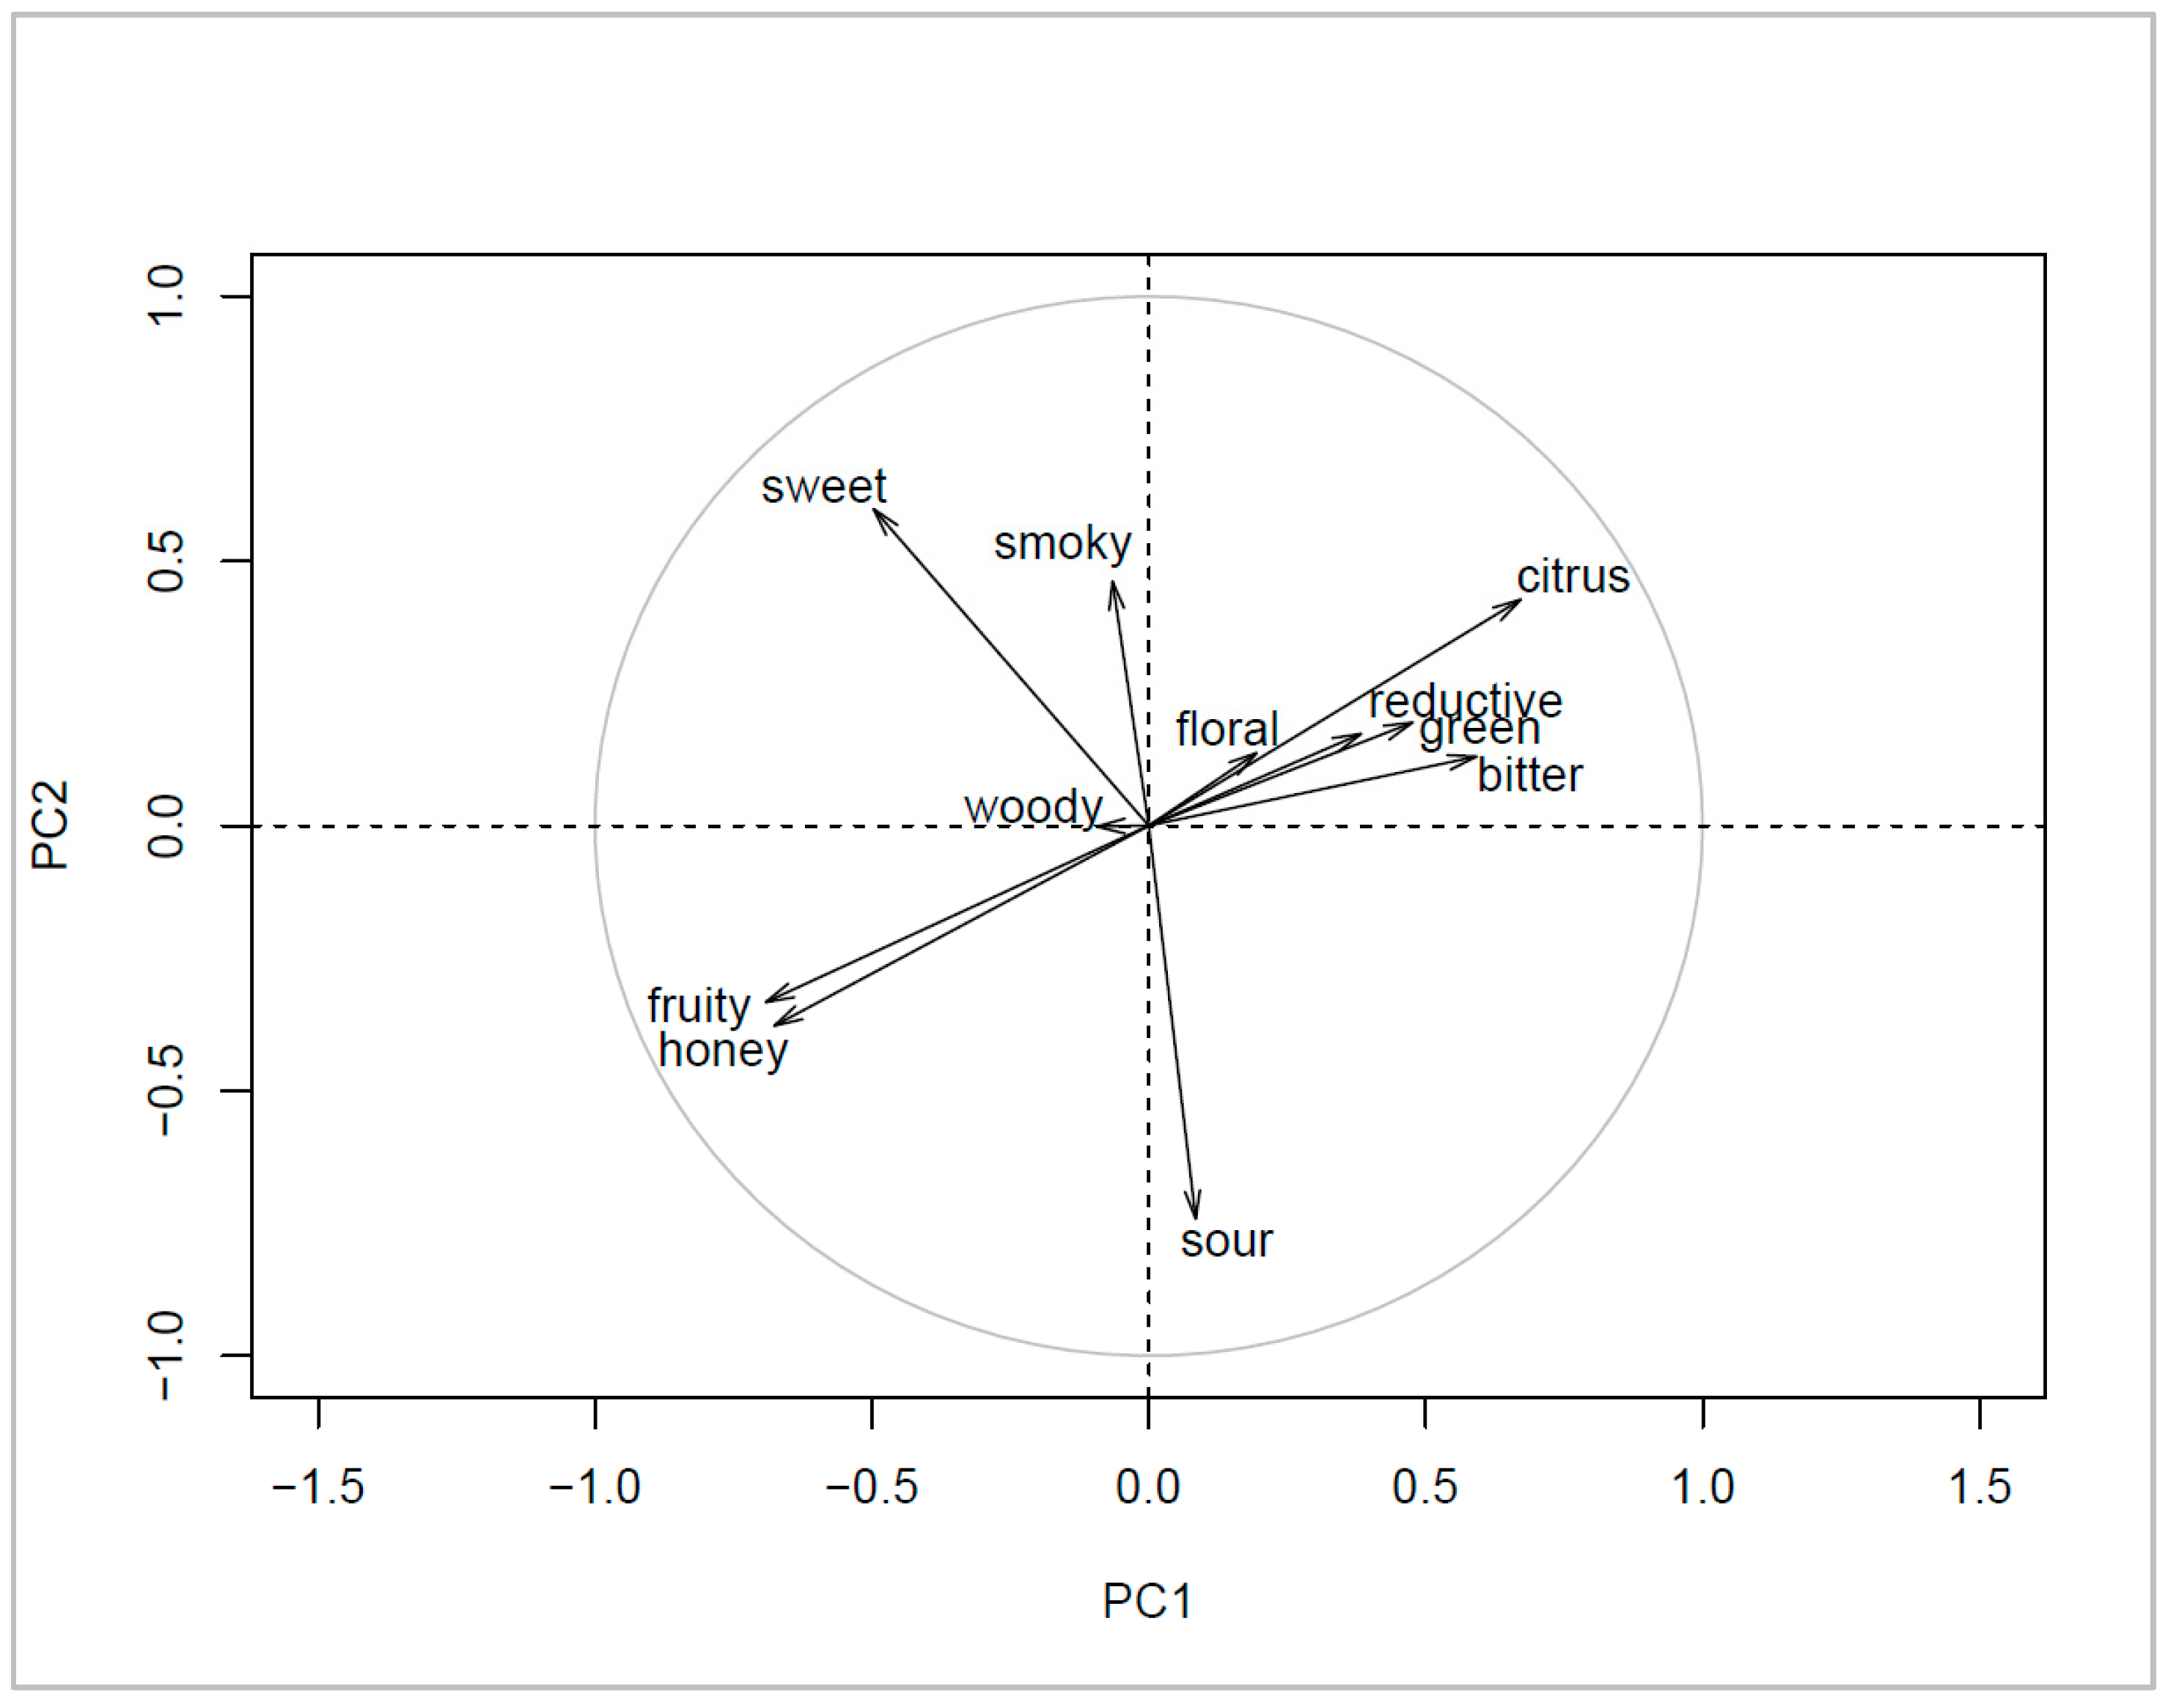
3.4. Sensory Differences

The ten yeasts showing the shortest fermentation time (Table 5) were taken for the sensory test. The results of the napping test are shown in Figure 6. This representation shows the sensory distance between the wines, as well as the 95% confidence ellipses. Figure 7 shows the descriptor correlations. Sensory differences as well as similarities can be observed. The wines Ymi-3 and Ymg-4 are close in taste, both exhibiting the descriptors fruity and honey, whereas the wines Ymj-1, Ymg-9, Ymg-7 and Ymg-1 all share the descriptor sour. The taste of wine Ymg-5 is quite different from other wines and corresponds to the citrus descriptor. Ymi-1 and Ymj-4 are linked as well and have a smoky taste. The wine Ymf-1 has its own sensory taste by being sweeter. The final choice was made by the vineyard owner who selected the yeast Ymf-1 because of its great harmonized taste of sweetness, fruitiness and sourness.

4. Discussion

4.1. Method Validation and Primer Set Composition

The fragment lengths obtained by the capillary sequencer and by the traditional agarose gel electrophoresis were compared. It can be stated that the results correlate, so that the SSR-PCR method with the agarose gel electrophoresis is validated. However, the capillary sequencer has a higher precision than the traditional agarose gel technique (1 bp versus 20 bp). Small differences could thus have been overseen using the agarose gel: a more precise instrumentation is required in this case. The use of a capillary sequencer allowed a differentiation between all nine commercially available yeasts. However, even if the traditional agarose gel method has a lower precision, it remains a good and useful tool for routine and low-budget equipment.
The fragment lengths obtained by the primers are in the same range as the values reported in the literature [10,26,27,32,33].
Concerning the PCR, the recommended primer annealing temperature was 57 °C [28]. However, after testing this PCR-condition, the results on the agarose gel were unreadable. When increasing the annealing temperature to 60 °C, the end products were optimal for all primers except for ScAAT1 and YKR072c. Since YKR072c was described as “slightly variable” in contrast to other primers [33], and since only two out of 15 primers did not work at 60 °C, this annealing temperature was kept for the subsequent PCR experiments.
Primers were combined depending on the product size obtained after PCR, according to the literature [28]. Primers showing products with different sizes were combined, while avoiding superpositions that could mask out the results. However, these primers were designed specifically for the amplification of polymorphic SSRs of S. cerevisiae strains [28]. Ultimately, it was important to determine different patterns of PCR products for the subsequent differentiation of S. cerevisiae strains. Six different combinations of patterns could be obtained for the nine commercially available yeasts.

4.2. Winery’s Own Yeast Differentiation

By combining the results of both multiplex sets, 21 different patterns could be obtained, which means that 21 different yeasts were isolated and differentiated by the developed method. However, it could happen that two different yeasts showing small (< 10 bp) fragment length differences were present in the same group due to the low precision of the agarose gel.
There are two possible reasons to explain why fewer than six bands were sometimes detected for the six primers of a set: on the one hand, some SSRs could have been absent in some yeasts or could have malfunctioned. On the other hand, the fragment length of a primer pair might have been too close to another primer pair, making them undistinguishable.
As the aim of the project was to provide winegrowers with a particular yeast from their own vineyard or cellar to affirm their own terroir character, it was important to verify that the isolated yeasts were not commercially available yeasts. In fact, the samples were collected during spontaneous fermentation, but the fermentation tank may have had leftovers from yeasts used for previous fermentation with commercially available yeasts or there may have been a nearby tank with commercially available yeast strains fermenting nearby. A comparison of the biomolecular results of the winery’s own yeast to the commercially available yeasts showed that only Set 2 presented some similarities between the two yeast categories. Therefore, by combining both sets, none of the Flevo yeasts showed a similar pattern to the nine commercially available yeasts. If the comparison would have been done with Set 2 only, similarities could have been found with commercially available yeasts. It was predictable that no commercially available yeasts would be identified, as the vineyard in Flevoland never employed such yeast strains, which confirms our results.
However, there are more than 200 commercially available S. cerevisiae yeast strains present on the market, making it a challenge to ensure that the yeast strains found by this method are not commercial ones, especially for wineries that use or have used commercially available yeasts, unlike the winery in Flevoland. It is possible that the patterns found are similar to other commercially available yeasts.

4.3. Fermentative Tests

A correlation was observed between yeast strains of the same group, which showed the same pattern after SSR-PCR and fermentation time. Groups 1A and 6C represent the categories with the largest amount of yeast strains. The three yeast strains of group 1A have a fermentation time of 33 to 48 days and belong to the fastest ten yeasts that completely fermented the must. Both yeast strains of group 6C have a fermentation time of 55 days, which shows a good correlation between the group and fermentation time. The density discrepancy between the three replicates can be explained by the fact that these experiments were realized with living organisms. Indeed, each yeast, even if it is the same strain, can evolve differently.
Fermentation tests were realized at 17 °C in order to create a stressful environment for the yeast strains and because they approximated the conditions found in a winery. The capability and the velocity rate of the fermentation in a stressful environment is indeed a significant factor [34]. Therefore, the choice of wines used for the sensory test was made on the basis of the fermentation rate. The first 10 finished wines were sensorily tested, since a fast fermentation is a prerequisite for strain selection.

4.4. Sensory Differences

The aim of the sensory test was to show organoleptic differences between the wines fermented with different yeast strains. The ten first yeast strains that fermented the must into wine were used, given that the winegrower’s interest focused on yeast strains that did not show overly high fermentation rates in order to avoid sluggish fermentations.
A good correlation was found between the placement of the wines chosen by the panelists during the napping procedure and the descriptors. Different descriptors were given for each wine, proving the differences occurring with the yeast strains. In a previous study [32], the evaluation of sensory characteristics between the wines produced using different Saccharomyces strains also identified differences resulting from the use of different strains [35]. However, some wines fermented with yeasts like Ymi-3 and Ymg-4 were close to each other and therefore had similar fermentation skills (both fermented the must with an interval of only eight days), even if they originated from different groups (8C and 4C, respectively). Wines fermented with the yeasts Ymg-9 and Ymg-7 were also sensorily similar: both fermented the must in 40 days, but their molecular patterns differed. Although the sensory results showed differences, the confidence ellipses were quite important, which rendered some differences insignificant.

5. Conclusions

Simple Sequence Repeats Markers are powerful biomolecular tools for the differentiation of yeast strains. S. cerevisiae strain differences were shown, confirming the relevance of the method for the wine industry. Since yeast sequencing is still an expensive technique, this PCR- and agarose-gel-based method is a good low-budget alternative, even if the precision is lower. Based on the comparison of SSR fragment lengths obtained after PCR, an effective differentiation could be obtained for the vineyard in Flevoland, as there were 21 different yeasts for a total of 50 isolated yeast strains. After fermentation and sensory tests, it was possible to provide a yeast strain with specific properties for the winery in Flevoland. The choice of a specific yeast to be used for further fermentations was based on the fermentation velocity and the sensory perception of the produced wine. Since the number of tested commercially available yeasts was low compared to the existing number of products (approx. 200), an improvement to the method would be to include more commercially available yeast strains. This method could also be useful for diversity and phylogenetic studies of worldwide S. cerevisiae strains.

Author Contributions

A.H. an F.R. carried out the experiments. F.R. wrote the manuscript with support from A.H. M.S.-S. conceived the original idea. F.R and M.S.-S. did the project administration and the funding acquisition. All authors have read and agreed to the published version of the manuscript.

Funding

This research was funded by the Europees Landbouwfonds voor Plattelandsontwikkeling (ELFPO) Programma voor Plattelandsontwikkelung 2014–2020 voor Nederland (POP3)–Sammenwerking duurzame innovaties landbouw Flevoland 2017–Project: Terroir voor de toekomst—Flevogist als USP, grant number 17717000004.

Acknowledgments

The authors thank Silvia Anthony, Chateau Neuf Projectonteikkeling v.o.f. for her contribution and support of the project. We also want to thank. Jochen Vestner (DLR Rheinpfalz) for analyzing the data of the napping. We acknowledge Oliver Trapp from the JKI, Institute for grapevine breeding and Geilweilerhof, Siebeldingen for the analyses on the capillary sequencer.

Conflicts of Interest

The authors declare no conflict of interest. The funders had no role in the design of the study; in the collection, analyses, or interpretation of data, in the writing of the manuscript, or in the decision to publish the results.

References

  1. Chambers, A.H.; Evans, S.A.; Folta, K.M. Methyl Anthranilate and Gamma-Decalactone Inhibit Strawberry Pathogen Growth and Achene Germination. J. Agric. Food Chem. 2013, 61, 12625–12633. [Google Scholar] [CrossRef] [PubMed]
  2. Nykänen, L. Formation and Occurrence of Flavor Compounds in Wine and Distilled Alcoholic Beverages. Am. J. Enol. Vitic. 1986, 37, 84–96. [Google Scholar]
  3. Lambrechts, M.G.; Pretorius, I.S. Yeast and its Importance to Wine Aroma—A Review. S. Afr. J. Enol. Vitic. 2019, 21, 97–129. [Google Scholar] [CrossRef] [Green Version]
  4. Fleet, G.H. Yeast interactions and wine flavour. Int. J. Food Microbiol. 2003, 86, 11–22. [Google Scholar] [CrossRef]
  5. Clemente-Jimenez, J.M.; Mingorance-Cazorla, L.; Martínez-Rodríguez, S.; Las Heras-Vázquez, F.J.; Rodríguez-Vico, F. Molecular characterization and oenological properties of wine yeasts isolated during spontaneous fermentation of six varieties of grape must. Food Microbiol. 2004, 21, 149–155. [Google Scholar] [CrossRef]
  6. van Uden, N. Chapter 2—Ethanol Toxicity and Ethanol Tolerance in Yeasts. In Annual Reports on Fermentation Processes; Tsao, G.T., Ed.; Elsevier: Munich, Germany, 1985; pp. 11–58. [Google Scholar]
  7. D’Amore, T.; Panchal, C.J.; Russell, I.; Stewart, G.G. A study of ethanol tolerance in yeast. Crit. Rev. Biotechnol. 1989, 9, 287–304. [Google Scholar] [CrossRef] [PubMed]
  8. Stanley, D.; Bandara, A.; Fraser, S.; Chambers, P.J.; Stanley, G.A. The ethanol stress response and ethanol tolerance of Saccharomyces cerevisiae. J. Appl. Microbiol. 2010, 109, 13–24. [Google Scholar] [CrossRef] [PubMed]
  9. Romano, P. Function of yeast species and strains in wine flavour. Int. J. Food Microbiol. 2003, 86, 169–180. [Google Scholar] [CrossRef]
  10. Techera, A.G.; Jubany, S.; Carrau, F.; Gaggero, C. Differentiation of industrial wine yeast strains using microsatellite markers. Lett. Appl. Microbiol. 2001, 33, 71–75. [Google Scholar] [CrossRef]
  11. Bartowsky, E.J.; Pretorius, I.S. Microbial formation and modification of flavor and off-flavor compounds in wine. In Biology of Microorganisms on Grapes, in Must and in Wine; Springer: Heidelberg, Germany, 2009; pp. 209–231. [Google Scholar]
  12. Alexandre, H. Wine Yeast Terroir: Separating the Wheat from the Chaff—for an Open Debate. Microorganisms 2020, 8, 787. [Google Scholar] [CrossRef]
  13. Merle, A.; Piotrowski, M. Consommer des produits alimentaires locaux—Comment et pourquoi? Décisions Mark. 2012, 67, 37–48. [Google Scholar] [CrossRef]
  14. Capozzi, V.; Fragasso, M.; Romaniello, R.; Berbegal, C.; Russo, P.; Spano, G. Spontaneous Food Fermentations and Potential Risks for Human Health. Fermentation 2017, 3, 49. [Google Scholar] [CrossRef]
  15. Erusso, P.; Ecapozzi, V.; Espano, G.; Ecorbo, M.R.; Esinigaglia, M.; Bevilacqua, A. Metabolites of Microbial Origin with an Impact on Health: Ochratoxin A and Biogenic Amines. Front. Microbiol. 2016, 7, 482. [Google Scholar] [CrossRef]
  16. Capozzi, V.; Fragasso, M.; Russo, P. Microbiological Safety and the Management of Microbial Resources in Artisanal Foods and Beverages: The Need for a Transdisciplinary Assessment to Conciliate Actual Trends and Risks Avoidance. Microorganisms 2020, 8, 306. [Google Scholar] [CrossRef] [Green Version]
  17. Goffeau, A.; Barrell, B.G.; Bussey, H.; Davis, R.W.; Dujon, B.; Feldmann, H.; Galibert, F.; Hoheisel, J.D.; Jacq, C.; Johnston, M.; et al. Life with 6000 Genes. Science 1996, 274, 546–567. [Google Scholar] [CrossRef] [PubMed] [Green Version]
  18. Weller, P.; Jeffreys, A.; Wilson, V.; Blanchetot, A. Organization of the human myoglobin gene. EMBO J. 1984, 3, 439–446. [Google Scholar] [CrossRef] [PubMed]
  19. Field, D.; Wills, C. Abundant microsatellite polymorphism in Saccharomyces cerevisiae, and the different distributions of microsatellites in eight prokaryotes and S. cerevisiae, result from strong mutation pressures and a variety of selective forces. Proc. Natl. Acad. Sci. USA 1998, 95, 1647–1652. [Google Scholar] [CrossRef] [Green Version]
  20. Jarne, P.; Lagoda, P.J. Microsatellites, from molecules to populations and back. Trends Ecol. Evol. 1996, 11, 424–429. [Google Scholar] [CrossRef]
  21. Albertin, W.; Panfili, A.; Miot-Sertier, C.; Goulielmakis, A.; Delcamp, A.; Salin, F.; Lonvaud-Funel, A.; Curtin, C.; Masneuf-Pomarede, I. Development of microsatellite markers for the rapid and reliable genotyping of Brettanomyces bruxellensis at strain level. Food Microbiol. 2014, 42, 188–195. [Google Scholar] [CrossRef]
  22. Ghislain, M.; Spooner, D.M.; Rodríguez, F.; Villamón, F.; Núñez, J.; Vásquez, C.; Waugh, R.; Bonierbale, M. Selection of highly informative and user-friendly microsatellites (SSRs) for genotyping of cultivated potato. Theor. Appl. Genet. 2003, 108, 881–890. [Google Scholar] [CrossRef]
  23. Garofalo, C.; Berbegal, C.; Grieco, F.; Tufariello, M.; Spano, G.; Capozzi, V. Selection of indigenous yeast strains for the production of sparkling wines from native Apulian grape varieties. Int. J. Food Microbiol. 2018, 285, 7–17. [Google Scholar] [CrossRef]
  24. Granchi, L.; Ganucci, D.; Buscioni, G.; Mangani, S.; Guerrini, S. The Biodiversity of Saccharomyces cerevisiae in Spontaneous Wine Fermentation: The Occurrence and Persistence of Winery-Strains. Fermentation 2019, 5, 86. [Google Scholar] [CrossRef] [Green Version]
  25. Tufariello, M.; Maiorano, G.; Rampino, P.; Spano, G.; Grieco, F.; Perrotta, C.; Capozzi, V. Selection of an autochthonous yeast starter culture for industrial production of Primitivo “Gioia del Colle” PDO/DOC in Apulia (Southern Italy). LWT 2019, 99, 188–196. [Google Scholar] [CrossRef]
  26. Vaudano, E.; Garcia-Moruno, E. Discrimination of Saccharomyces cerevisiae wine strains using microsatellite multiplex PCR and band pattern analysis. Food Microbiol. 2008, 25, 56–64. [Google Scholar] [CrossRef] [PubMed]
  27. Legras, J.-L.; Ruh, O.; Merdinoglu, D.; Karst, F. Selection of hypervariable microsatellite loci for the characterization of Saccharomyces cerevisiae strains. Int. J. Food Microbiol. 2005, 102, 73–83. [Google Scholar] [CrossRef] [PubMed]
  28. Börlin, M.; Venet, P.; Claisse, O.; Salin, F.; Legras, J.L.; Masneuf-Pomarede, I. Cellar-Associated Saccharomyces cerevisiae Population Structure Revealed High-Level Diversity and Perennial Persistence at Sauternes Wine Estates. Appl. Environ. Microbiol. 2016, 82, 2909–2918. [Google Scholar] [CrossRef] [Green Version]
  29. Pages, J. Recueil direct de distances sensorielles: Application à l’évaluation de dix vins blancs du Val-de-Loire. Sci. Aliment. 2003, 23, 679–688. [Google Scholar] [CrossRef]
  30. Pagès, J. Collection and analysis of perceived product inter-distances using multiple factor analysis: Application to the study of 10 white wines from the Loire Valley. Food Qual. Prefer. 2005, 16, 642–649. [Google Scholar] [CrossRef]
  31. Lê, S.; Josse, J.; Husson, F. FactoMineR: AnRPackage for Multivariate Analysis. J. Stat. Softw. 2008, 25, 1–18. [Google Scholar] [CrossRef] [Green Version]
  32. Hennequin, C.; Thierry, A.; Richard, G.F.; Lecointre, G.; Nguyen, H.V.; Gaillardin, C.; Dujon, B. Microsatellite Typing as a New Tool for Identification of Saccharomyces cerevisiae Strains. J. Clin. Microbiol. 2001, 39, 551–559. [Google Scholar] [CrossRef] [Green Version]
  33. Sihlhavy, K.; Berger, S.U.; Mandl, K.A.; Hack, R.O.; Regner, F.E. Microsatellite analysis of commercial wine yeast strains. Mitt. Klosterneubg. 2006, 56, 140–146. [Google Scholar]
  34. Torija, M.J. Effects of fermentation temperature on the strain population of Saccharomyces cerevisiae. Int. J. Food Microbiol. 2003, 80, 47–53. [Google Scholar] [CrossRef]
  35. Iranzo, J.U.; Magaña, F.G.; Viñas, M.G. Evaluation of the formation of volatiles and sensory characteristics in the industrial production of white wines using different commercial strains of the genus Saccharomyces. Food Control 2000, 11, 143–147. [Google Scholar] [CrossRef]
Figure 1. The progress of the yeast selection starting with the plating and ending with a yeast for a winery in order to ensure its spontaneous fermentation.
Fermentation 06 00101 g001
Figure 2. Results of the gel electrophoresis for the commercially available yeasts named above after multiplex PCR using Multiplex Set 1 with the nomenclature of the patterns A–F.
Fermentation 06 00101 g002
Figure 3. Results of the gel electrophoresis for the commercially available yeasts named above after multiplex PCR using Multiplex Set 2 with the patterns numbered from 1–5.
Fermentation 06 00101 g003
Figure 4. Example of an agarose gel showing the patterns A and C–H. The fragment lengths in base pairs (bp) for the yeast strains Ymg 1–10, amplified with the primer set 1, are shown.
Fermentation 06 00101 g004
Figure 5. Fermentation process for the microvinifications. One density measurement per group is presented here from 33 to 73 days.
Fermentation 06 00101 g005
Figure 6. The results of the napping procedure. The wines are named after the yeast strain used for the fermentation, and the wines with the brighter ellipses were grouped together by the panelists.
Fermentation 06 00101 g006
Figure 7. The figure shows the descriptors the panelists used for the wines and the correlations resulting from the arrangement of the wines.
Fermentation 06 00101 g007
Table 1. Commercially available yeast strains.
Commercial NameAbbreviationOrigin
Lalvin BM4*4Bm4Lallemand, Fredericia, Denmark
Oenoferm ColorOcErbslöh, Geisenheim, Germany
Oenoferm BouquetObErbslöh, Geisenheim, Germany
Oenoferm KlosterneuburgOkErbslöh, Geisenheim, Germany
Oenoferm FreddoOfErbslöh, Geisenheim, Germany
MelodyMelChr Hansen, Hoersholm, Denmark
Siha Activhefe 8Sa8Eaton Technologies, Langenlonsheim, Germany
1895c1895cSwiss Wineyeast GmbH, Meilen, Switzerland
Lalvin EC 1118LecLallemand, Fredericia, Denmark
Table 2. Primers’ origin and sequence with the motif and names of the SSR (simple sequence repeats).
PrimerMotif ORF CoordinatesSequences
ScAAT2TAAYBL084cFW:CAGTCTTATTGCCTTGAACGA
RV:GTCTCCATCCTCCAAACAGCC
ScAAt3TAAYDR160wFW:TGGGAGGAGGGAAATGGACAG
RV:TTCAGTTACCCGCACAATCTA
C5GTVI-210250/210414FW:TGACACAATAGCAATGGCCTTCA
RV:GCAAGCGACTAGAACAACAATCACA
C3CAAYGL139wFW:CTTTTTATTTACGAGCGGGCCAT
RV:AAATCTCATGCCTGTGAGGGGTAT
C8TAAYGL014wFW:CAGGTCGTTCTAACGTTGGTAAAATG
RV:GCTGTTGCTGTTGGTAGCATTACTGT
C11GTX-518870/519072FW:TTCCATCATAACCGTCTGGGATT
RV:TGCCTTTTTCTTAGATGGGCTTTC
YKR072cGACYKR072cFW:AGATACAGAAGATAAGAACGAAAA
RV:TTATTGATGCTTATCTATTATACC
SCYOR267cTGTYOR267cFW:TACTAACGTCAACACTGCTGCCAA
RV:GGATCTACTTGCAGTATACGGG
YKL172wGAAYKL172wFW:CAGGACGCTACCGAAGCTCAAAAG
RV:ACTTTTGGCCAATTTCTCAAGAT
ScAAT1TTAXIII-86902/87140FW:AAGCGTAAGCAATGGTGTAGATACTT
RV:CAAGCCTCTTCAAGCATGACCTTT
C4TAA + TAGXV-110701/110935FW:AGGAGAAAAATGCTGTTTATTCTGACC
RV:TTTTCCTCCGGGACGTGAAATA
C9TAAYOR156cFW:AAGGGTTCGTAAACATATAACTGGCA
RV:TATAAGGGAAAAGAGCACGATGGC
ScAAT5TAAXVI-897051/8970210FW:AGCATAATTGGAGGCAGTAAAGCA
RV:TCTCCGTCTTTTTTGTACTGCGTG
C6CAXVI-485898/485996FW:GTGGCATCATATCTGTCAATTTTATCAC
RV:CAATCAAGCAAAAGATCGGCCT
YPL009cCTTYPL009cFW:AACCCATTGACCTCGTTACTATCGT
RV:TTCGATGGCTCTGATAACTCCATTC
Table 3. The table shows the fragment lengths of the marker in base pairs (bp) resulting from the DNA of commercially available yeasts and the arrangement of the primer sets.
PrimerSize Range by Agarose gel (bp)Size Range by Capillary Sequencing (bp)Primer Set
ScAAT2310–390376–3851
ScAAt3260244–274
C5130–170/
SCYOR267c305–390305–325
C8150133–146
C11200–250/
YKL172w135120–1252
C4240–320248–260
C910090–100
ScAAT5160–180156–162
C6100–120100–102
YPL009c250–290276–311
Table 4. Number of patterns obtained by gel electrophoresis for the winery’s own yeast after SSR PCR using multiplex set 1 (1 to 8) and multiplex set 2 (A to J).
Pattern12345678
A18 0001000
B01000001
C40110703
D10100000
E00001000
F01000100
G20000000
H10001100
I00000011
J10000000
Table 5. Fermentation time in days for the yeast strains. The strains were arranged in six groups according to their fermentation time.
GroupFermentation Time (days)YeastsTotal Number of Yeast
Group 133Ymg11
Group 240Ymj1, Ymg4, Ymg7, Ymg9, Ymj45
Group 348Ymf1, Ymg5, Ymi33
Group 455Ymi1, Ymg2, Ymg8, Ymj24
Group 562Ymg3, Ymh42
Group 673Ymg6, Ymf32
Publisher’s Note: MDPI stays neutral with regard to jurisdictional claims in published maps and institutional affiliations.

