Article

Low-Cost Methods to Assess Beer Quality Using Artificial Intelligence Involving Robotics, an Electronic Nose, and Machine Learning

by
Claudia Gonzalez Viejo
* and
Sigfredo Fuentes
Digital Agriculture, Food and Wine Sciences Group, School of Agriculture and Food, Faculty of Veterinary and Agricultural Sciences, University of Melbourne, Melbourne VIC 3010, Australia
*
Author to whom correspondence should be addressed.
Submission received: 8 October 2020 / Revised: 26 October 2020 / Accepted: 30 October 2020 / Published: 31 October 2020
(This article belongs to the Special Issue Implementation of Digital Technologies on Beverage Fermentation)

Abstract

:
Beer quality is a difficult concept to describe and assess by physicochemical and sensory analysis due to the complexity of beer appreciation and acceptability by consumers, which can be dynamic and related to changes in climate affecting raw materials, consumer preference, and rising quality requirements. Artificial intelligence (AI) may offer unique capabilities based on the integration of sensor technology, robotics, and data analysis using machine learning (ML) to identify specific quality traits and process modifications to produce quality beers. This research presented the integration and implementation of AI technology based on low-cost sensor networks in the form of an electronic nose (e-nose), robotics, and ML. Results of ML showed high accuracy (97%) in the identification of fermentation type (Model 1) based on e-nose data; prediction of consumer acceptability from near-infrared (Model 2; R = 0.90) and e-nose data (Model 3; R = 0.95), and physicochemical and colorimetry of beers from e-nose data. The use of the RoboBEER coupled with the e-nose and AI could be used by brewers to assess the fermentation process, quality of beers, detection of faults, traceability, and authentication purposes in an affordable, user-friendly, and accurate manner.

1. Introduction

Beer quality is usually regarded as a subjective concept that can be described as more objectively based on beer quality traits through physicochemical analysis and/or sensory analysis of beers using either trained panels or consumer tests, the latter for perceived quality. However, by themselves, parameters and tests may not describe specific quality traits related to the overall liking of beer and the complexity of consumer perception.
Based on the latest research, beers’ physicochemical analysis has been mainly based on the bioactive compounds in craft beers [1], volatiles, and antioxidant properties when adding fruit using gas chromatography/mass-spectroscopy (GC-MS) and high-performance liquid chromatography (HPLC) [1,2,3]. Many other studies coupled these analyses of quality traits with sensory trials when analyzing processes to change beer characteristics, such as ultrasound-assisted thermal processing [4], antioxidant activity through natural additives [5,6,7], for sweet potato beers [8] and commercial beers [9]. In the case of traditional consumer sensory tests, they tend to be subjective, and require a laboratory with individual booths that meet specific requirements; it also involves the recruitment of a large number of participants, which often requires an incentive to participate, which leads to higher costs and time for conducting the sessions and analyzing the data [10,11,12]. Therefore, all these studies’ translational results are not easy to implement in the broad brewing industry to be used in every single batch since they require laboratory instrumentation, specialized personnel, and skills for operation, data acquisition, and analysis and may be time-consuming and costly.
Many non-invasive technologies have been proposed for the analysis of beer quality traits, such as the implementation of robotics coupled with sensors and computer vision capabilities like the RoboBEER [13], with a similar approach applied for sparkling wines analysis though the FIZZEyeRobot [14] constructed with more ubiquitous components, making them more applicable to bigger brewing companies than to craft beer enterprises. Other non-invasive technologies based on near-infrared spectroscopy (NIR) have also been applied within the beer production process from fermentation analysis [15] and coupled with artificial intelligence (AI) to predict relative protein content of commercial beers [16], beer quality assessment [17], the effect of sonication on beer quality [18] and many other applications within AI [19]. More recently, an integrated gas sensor technology application has resulted in the development of a low-cost electronic nose (e-nose) that can be attached to robotics (i.e., RoboBEER) to assess aroma profiles [20] also implementing AI [21].
The implementation of e-noses for beer research is not new in the food science field as they have been used to assess aromas in products such as coffee acidity [22], and roasting level prediction [23], tea quality grading [24,25,26], classification of strawberry juices [24], assessment of wine smoke taint [27] and alcohol content [28], beer quality classification and aging [29,30,31], beer aroma prediction [20], meat quality and shelf life [32,33], olive oil origin and quality [33,34], milk spoilage [35], and rice infestation [36], among others. However, most of the e-noses used in those studies are expensive and need to be installed in a laboratory as they have a similar system to a gas chromatograph (GC), and/or are considered as low-cost compared to a GC, but still, cost ≥ USD 30,000 and require maintenance [37,38,39]. There have been some works using them for classification of beers using data-mining methods [40,41,42,43], to evaluate the water use in the brewing process [44], aroma discrimination [45], alcohol content [46], comparison of volatile compounds against gas chromatography methods [43]. However, there has not been an integration of these e-noses with low-cost robotic systems to uniform pouring conditions or comparing results with sensory analysis using machine-learning methods. This paper proposed an integrated low-cost AI system integrating robotics (RoboBEER), NIR spectroscopy, a newly developed e-nose, and sensory analysis to assess automatically the type of fermentation of beers (Model 1) based on e-nose data, sensory perception of beers based on NIR data (Model 2) and e-nose data (Model 3) and beer foamability parameters based on e-nose data (Model 4). All models presented high accuracy (R > 0.90) in the prediction of beer targets before they were mentioned.
The integrated AI system proposed would offer brewers critical information based on robotics and e-nose data related to the type of fermentation of beers that will help traceability and identification, analysis of consumer acceptance, and bubble and physical foam properties of beers. All this information would be possible with low-cost robotics and instrumentation, which could be affordable even to small brewing companies that may give them reliable and critical information to tailor their beers according to specific consumer expectations. Furthermore, the proposed e-nose and AI system offers the advantage of being versatile and may be adapted to be used for different purposes, such as the assessment of smoke taint in wines and berries [27].

2. Materials and Methods

2.1. Sample Description

A total of 20 different beer samples from the three types of fermentation (seven top, six bottom, and seven spontaneous) were analyzed in triplicates (three bottles of each; n = 60). The top fermentation samples consisted of beers from the abbey ale, porter, kölsch, red ale, steam ale, aged ale, and sparkling ale styles. The bottom fermentation samples involved beer styles such as pale lager, Vienna lager, and German pilsner. On the other hand, spontaneous fermentation samples consisted of different lambic flavors and a wild Saison style. More details on the specific samples are shown as supplementary material (Table S1).

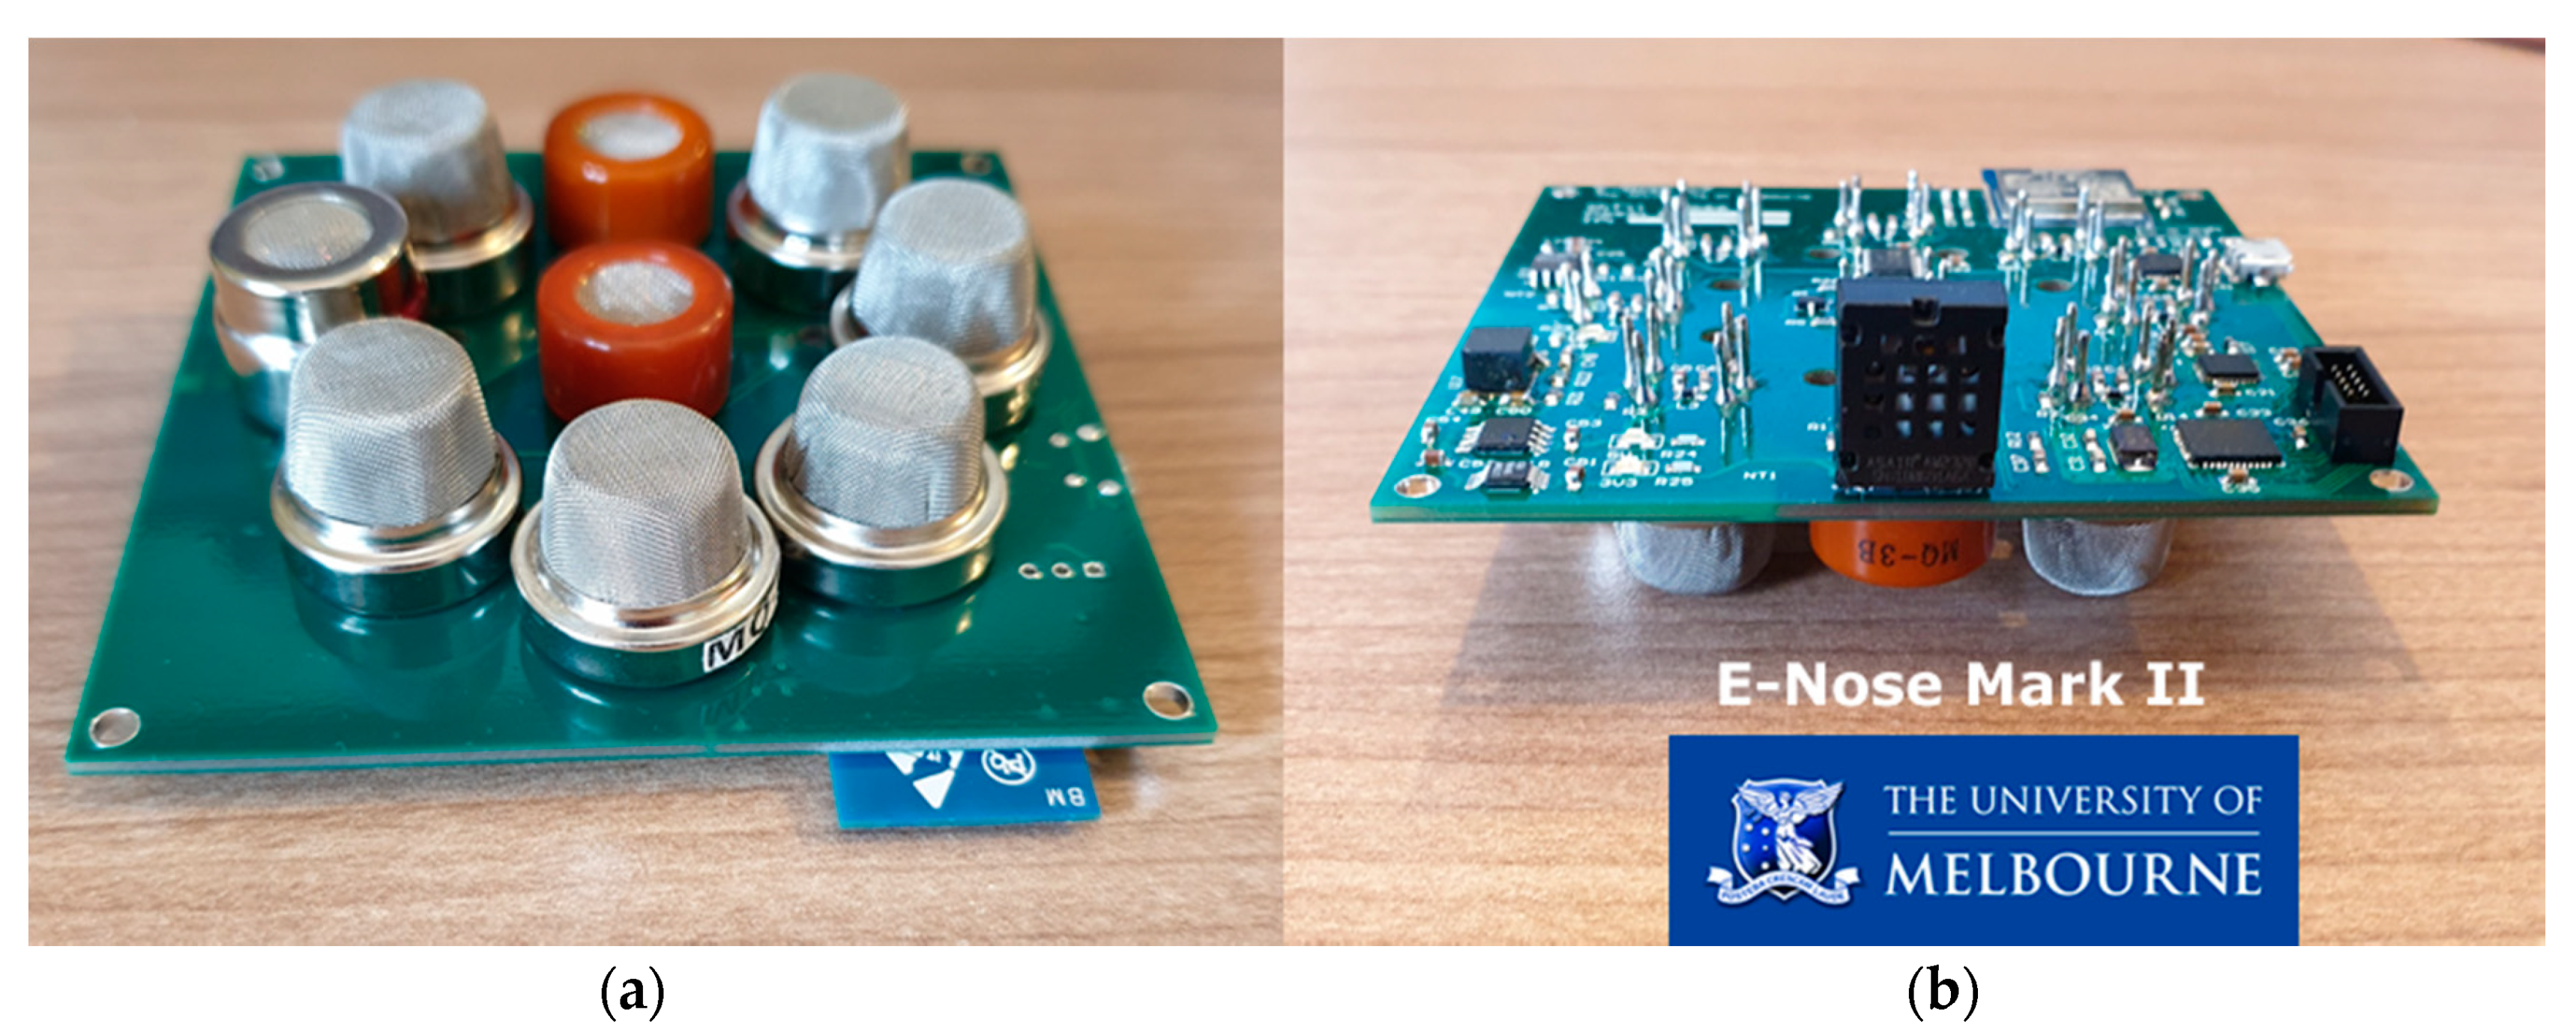
2.2. Electronic Nose (E-Nose)

A low-cost and portable electronic nose (e-nose; Figure 1) developed by the Digital Agriculture Food and Wine (DAFW) Group from the Faculty of Veterinary and Agricultural Sciences (FVAS) of the University of Melbourne (UoM) was used. This e-nose, which is composed of nine different gas sensors (Table 1), is sensitive to different gases related to volatile aromatic compounds. It measures the signal from all sensors in volts to obtain all outputs in the same scale The readings were performed by placing the e-nose on a 500 mL beaker with each bottle’s entire content; the e-nose started recording during the pouring of the sample and was placed on top of the beaker to collect readings for 3 min [20,27]. The e-nose was calibrated for 1–2 min between samples to ensure no carryover effects. All samples were measured at refrigeration temperature (4 °C), which is the consumption temperature and the same as used for sensory and physicochemical analysis.

2.3. Sensory: Consumer Acceptance Test

A sensory session was conducted with frequent beer consumers (n = 31) recruited from the staff and students at UoM, Australia. According to the Power analysis performed using SAS® v. 9.4 (SAS Institute, Cary, NC, USA), the number of participants was enough to find significant differences (1–β > 0.99). Participants were asked to sign a consent form approved by the FVAS–UoM Human Ethics Advisory Group (Ethics ID: 1545786.2). The session was conducted in individual sensory booths at the sensory laboratory of the FVAS–UoM. The samples were served at refrigeration temperature (4 °C) in standard wine-tasting glasses. Samples were served in a semi-randomized order (two groups of beers). Participants were provided with water and water crackers to cleanse their palates and were asked to rest for a few minutes between samples to avoid fatigue. The questionnaire was displayed in the BioSensory Application (University of Melbourne, Parkville, Victoria, Australia, [47]). The sensory attributes evaluated for acceptability and the scale used are shown in Table 2.

2.4. Near-Infrared Spectroscopy

Samples were analyzed using a NIR spectroscopy handheld device MicroPHAZIR™ RX Analyzer (Thermo Fisher Scientific, Waltham, MA, USA) able to read spectra from 1596–2396 nm. Gonzalez Viejo et al. [29] described a filter paper soaked with the beer sample and measured using the NIR device. The dry filter paper absorbance values were subtracted from the filter soaked in beer readings to obtain only the liquid’s absorbance values.

2.5. Physical Parameters

The beer samples were analyzed using the robotic pourer RoboBEER (The University of Melbourne, Parkville, Vic, Australia), as Gonzalez Viejo et al. [10] described. Each beer bottle was poured using the pourer to record 5-min videos and further analyzed using computer vision algorithms in Matlab® R2020b (Mathworks, Inc., Natick, MA, USA) to obtain the physical parameters related to foam and color (Table 3).

2.6. Statistical Analysis and Machine-Learning Modeling

A multivariate data analysis based on principal component analysis (PCA) was conducted using a code written in Matlab® R2020a to find relationships between the data obtained from the e-nose, RoboBEER, and the consumer test responses. Furthermore, a correlation matrix was developed using Matlab® R2020b to assess only the significant correlations (p < 0.05) between all parameters.
For machine-learning Model 1, pattern recognition, artificial neural networks (ANN) were used. This model consisted of the use of the maximum (Max), mean, and area under the curve (AUC) values of each sensor’s outputs from the e-nose to classify the samples into the three types of fermentation (top, bottom, and spontaneous; Figure 2a). A total of 17 different training algorithms were tested in a loop using a code written in Matlab® R2020a to find the best model based on the lack of under- or overfitting, highest accuracy, and best performance (Levenberg–Marquardt). Data were divided randomly as 60% for training, 20% for validation with a mean squared error (MSE) performance algorithm, and 20% for training. A neuron trimming test was conducted using 3, 5, 7, and 10 neurons, with the latter resulting in the best performance with no signs of under- or overfitting.
Models 2–4 were developed using a regression ANN, similar to Model 1; 17 different training algorithms were tested, with Levenberg–Marquardt resulting in the best performance and accuracy for the three models. Model 2 was developed using the NIR absorbance values from the whole spectra (1596–2396 nm) as inputs, while Model 3 was created using the Max, mean, and AUC values of each sensor’s outputs from the e-nose as inputs. For both models, the consumer test responses for the five attributes shown in Table 2 were used as targets (Figure 2b). On the other hand, Model 4 used the same e-nose inputs as Model 3, but with the RoboBEER outputs (Table 3) as targets (Figure 2c). A random data division was used as 60% for training, 20% for validation with an MSE performance algorithm, and 20% for testing. For these models, a trimming exercise was also performed using 3, 5, 7, and 10 neurons, with the latter resulting in the best performance with no signs of under- or over-fitting.

3. Results

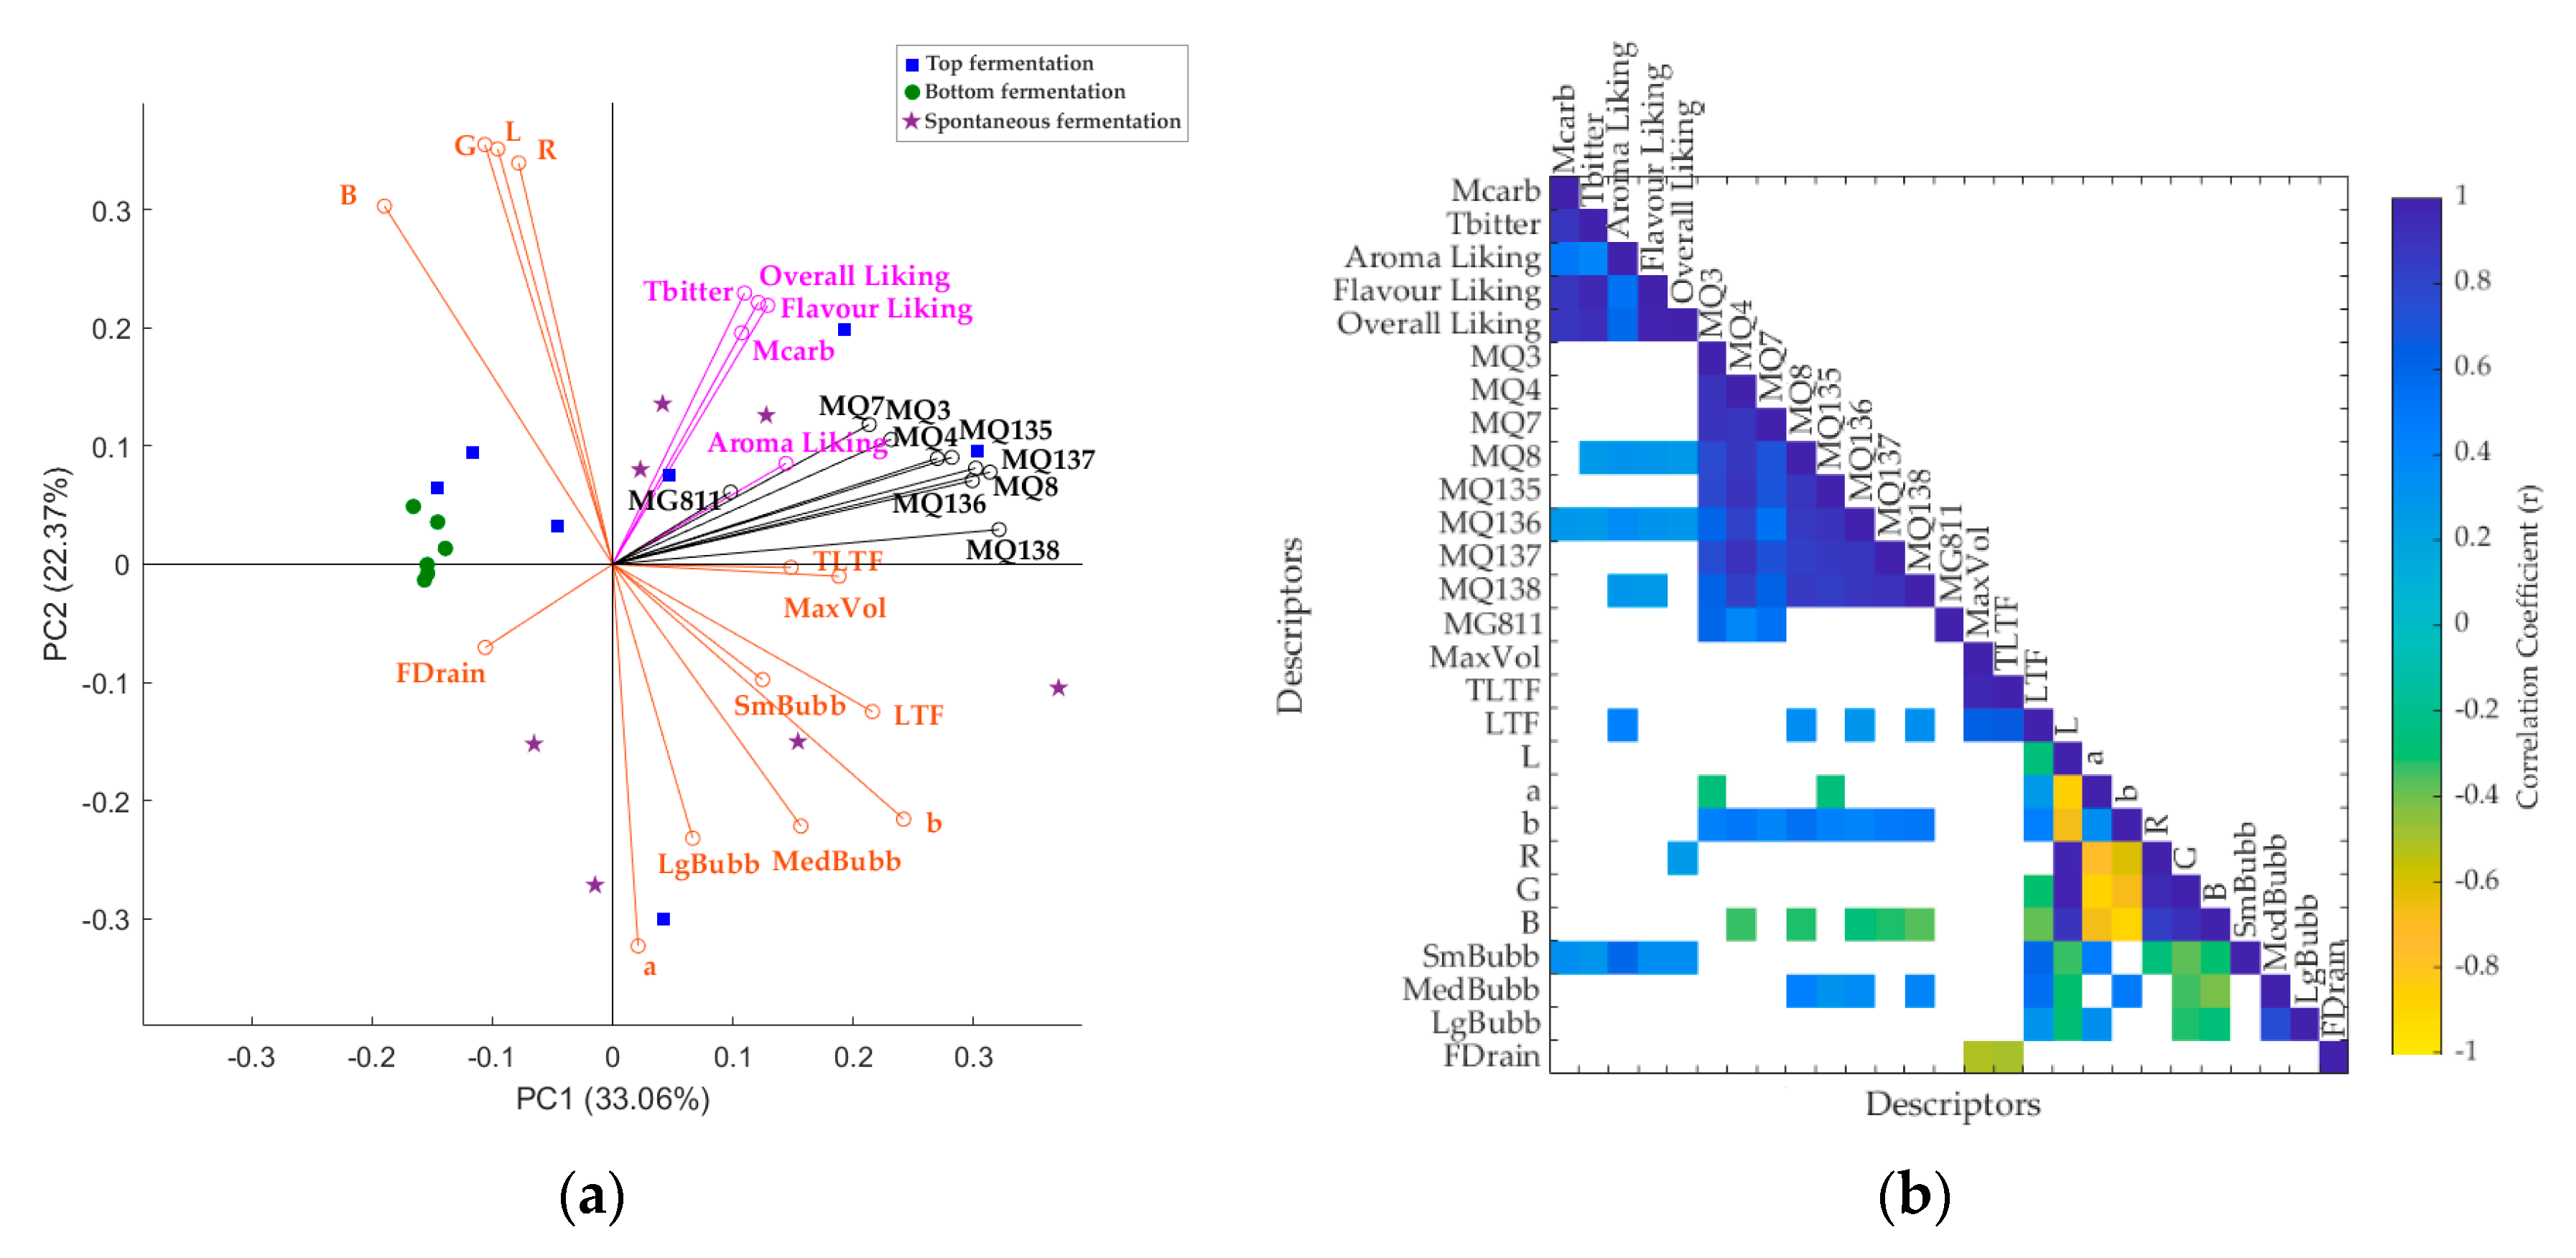
3.1. Multivariate Data Analysis

As shown in Figure 3a, the PCA principal component one (PC1) explained 33.06% of total data variability, while PC2 accounted for 22.37% (total PC = 55.43%), which is close to the cut-off point of 60% [48]. According to the factor loadings (FL), the PC1 was mainly represented by the e-nose sensors MQ138 (FL = 0.32), MQ8 (FL = 0.31), and MQ137 (FL = 0.30) on the positive side of the axis, and by B (FL = −0.19) from RGB color scale on the negative side. On the other hand, PC2 was mainly represented by G (FL = 0.36) and R (FL = 0.34) from the RGB color scale, and L (FL = 0.35) from the CIELab color scale on the positive side of the axis, and by ‘a’ (FL = −0.32) from the CIELab color scale, and medium (FL = −0.22) and large (FL = −0.23) bubbles on the negative side. Positive relationships were observed between the e-nose sensors and physical parameters such as total lifetime of foam (TLTF) and MaxVol as well as liking of all sensory attributes, especially aroma. By contrast, the e-nose sensors had a negative correlation with foam drainage (FDrain). Samples from bottom fermentation were associated with lower voltage from the e-nose and with FDrain. In comparison, most top fermentation and three spontaneous fermentation beers were associated with higher voltage from the e-nose and the sensory attributes’ liking. The other four spontaneous fermentation beers were more associated with the physical parameters such as bubble size and lifetime of foam (LTF) and ‘a’ and ‘b’ from the CIELab color scale.
Figure 3b shows the correlation matrix with all physical, sensory, and e-nose parameters. Positive and significant correlations (p < 0.05) were found between the sensory attributes’ liking and e-nose sensors MQ8, MQ136, and MQ138. Furthermore, positive and significant correlations were found between physical parameters such as LTF, color (‘a’, ‘b’, and B), MedBubb, and the e-nose data. As expected, beer foam drainage (FDrain) was inversely correlated to maximum volume (MaxVol) and the total lifetime of foam (TLTF).

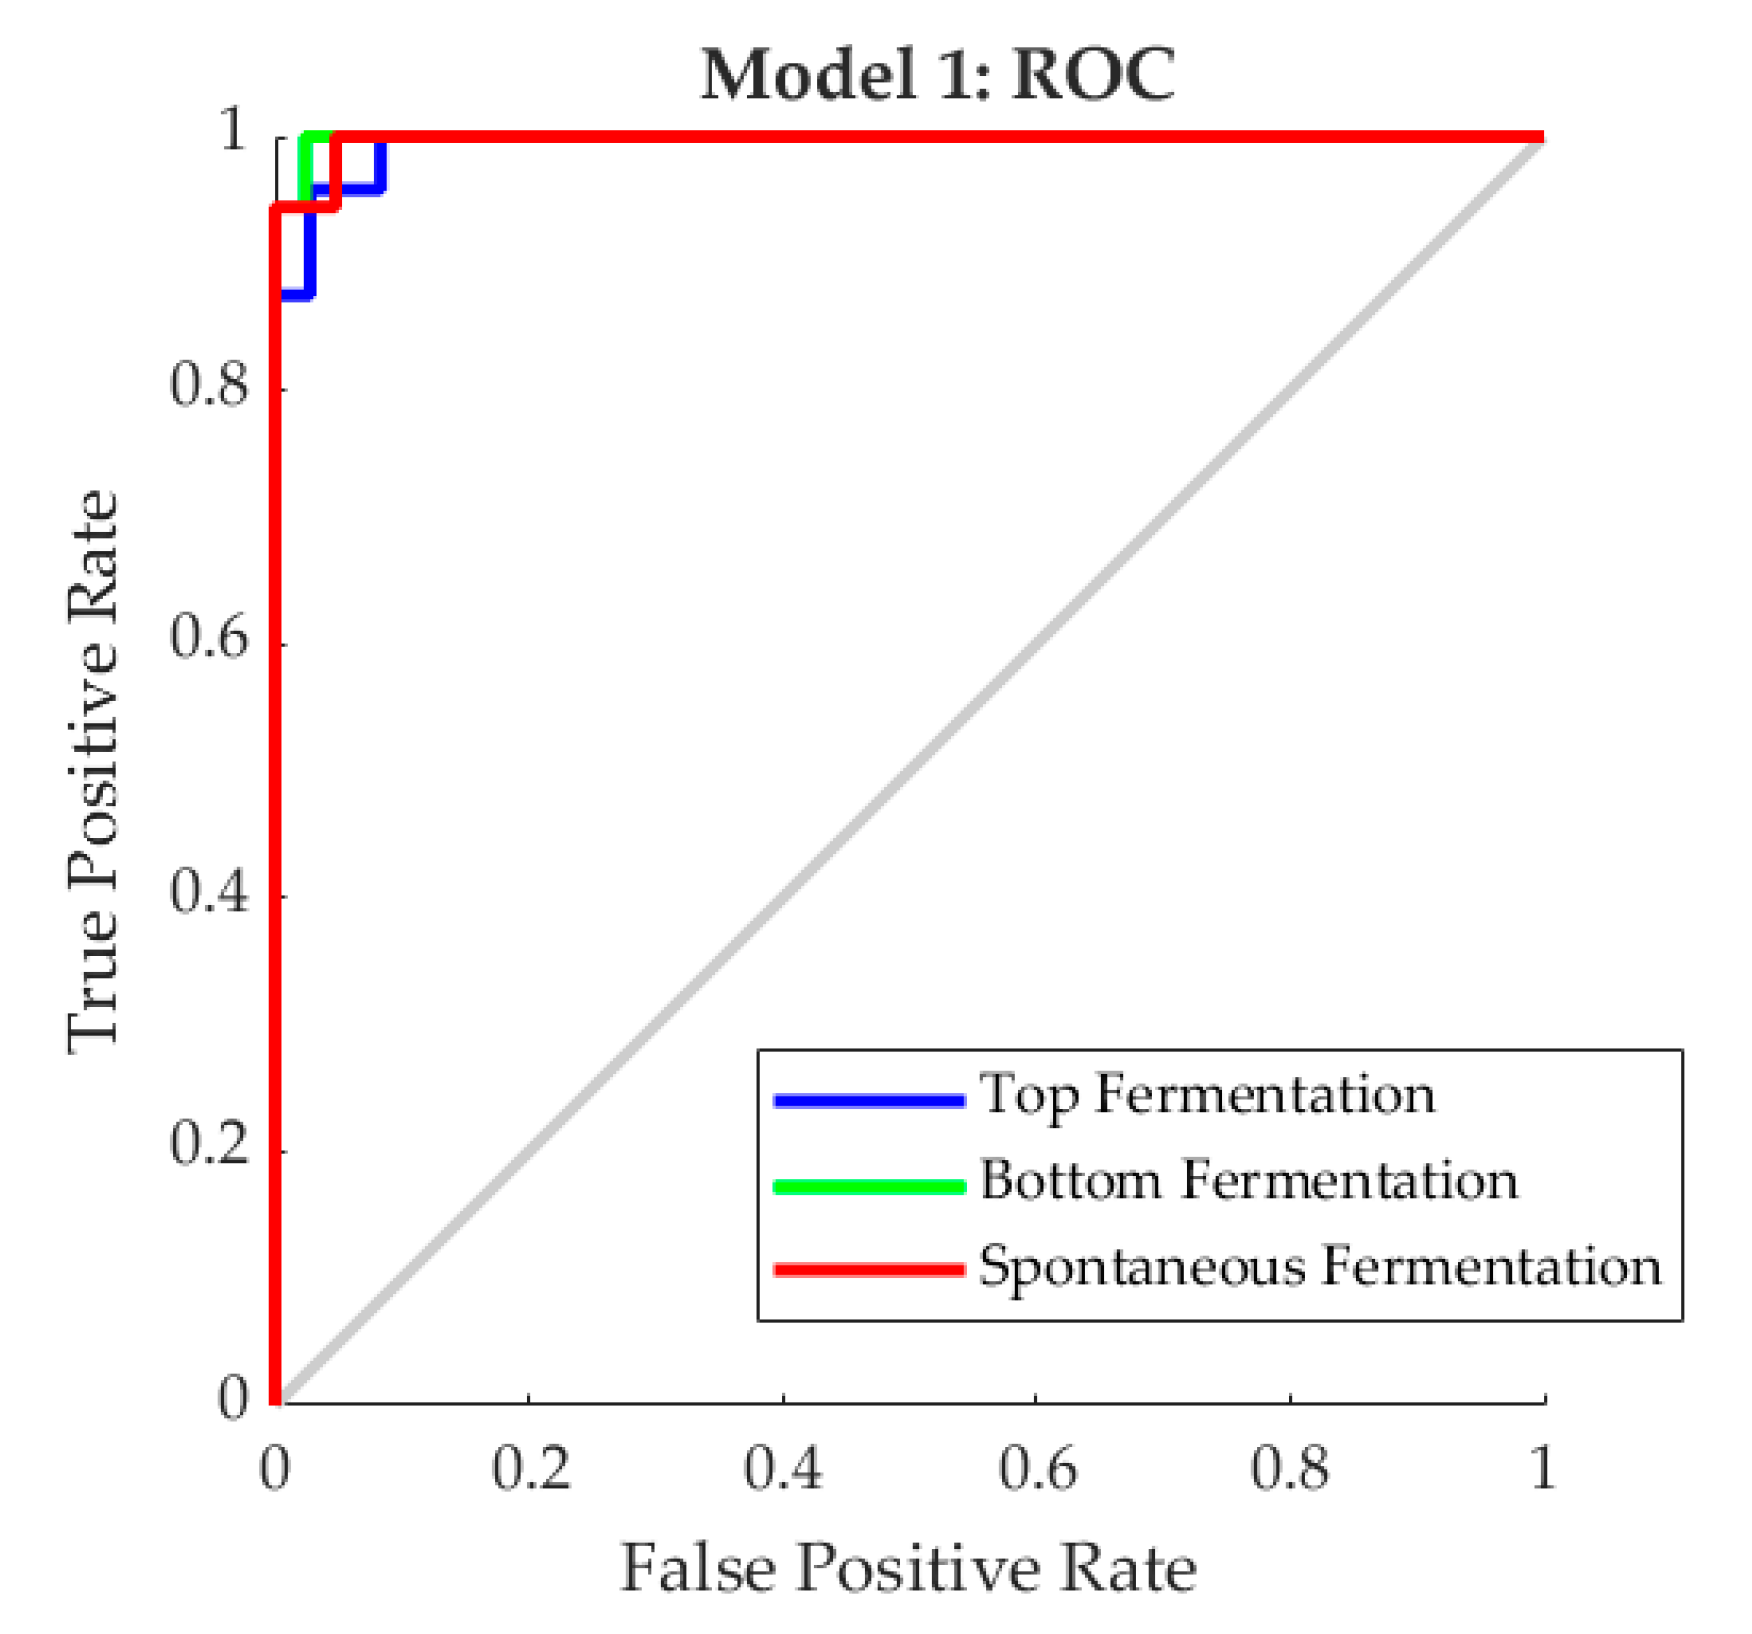
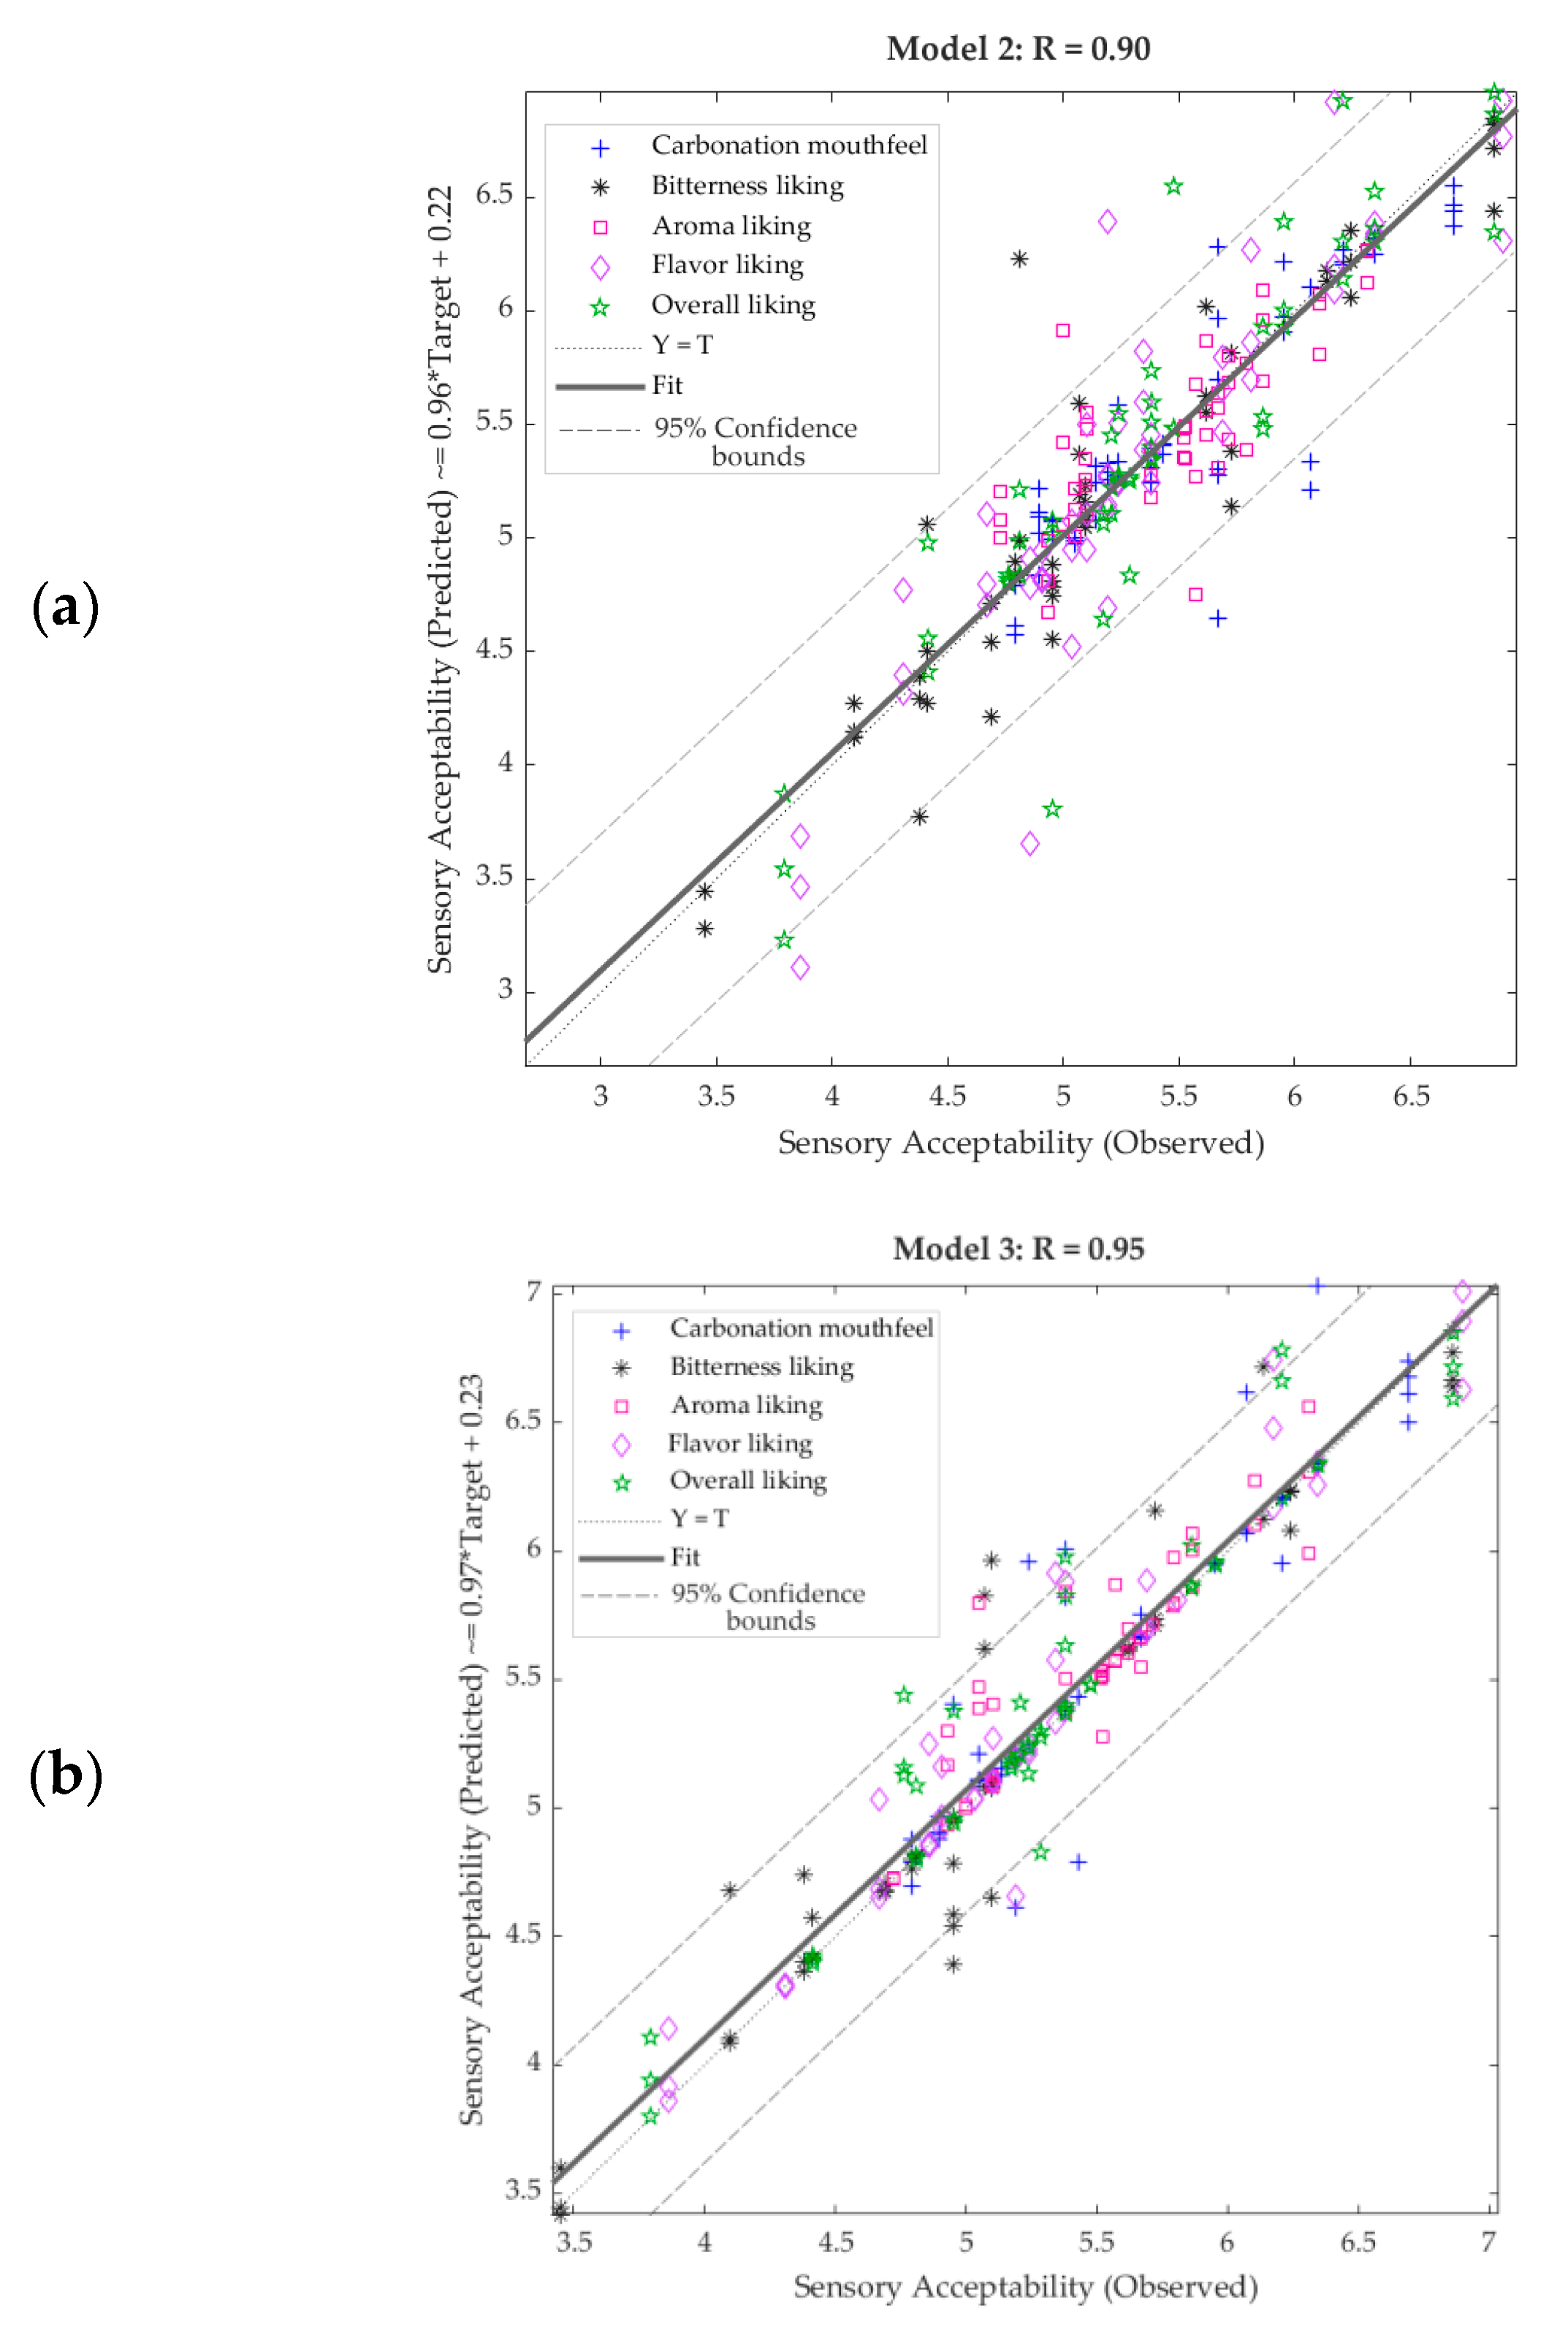
3.2. Machine-Learning Modeling

In Table 4, it can be observed that there was a high overall accuracy (97%) in predicting the type of beer fermentation using the Max, mean, and AUC data from the e-nose outputs as inputs. Furthermore, all stages had an accuracy of >90%. Compared to the validation and testing, the lower MSE value of the training stage and the latter two being the same, are indicators of no under- or overfitting. Figure 4 shows the receiver operating characteristic (ROC) curve depicting the true-positive (sensitivity) and false-positive (specificity) rates; as can be observed, the three categories had a sensitivity > 0.90.
Table 5 shows the statistical data from the regression models. It can be observed that Model 2 had a high overall correlation coefficient (r = 0.90) and a high slope (>0.85) for all the stages. The training MSE value (MSE = 0.02) was lower than the validation and testing, which is a sign of no under- or overfitting; however, the validation (MSE = 0.12) and training (MSE = 0.30) were not as close, which may indicate some overfitting. Model 3, developed using the e-nose outputs to predict sensory descriptors’ liking, had a higher overall correlation coefficient (R = 0.95) than Model 2, which was constructed using NIR inputs to predict the same sensory descriptors. Furthermore, Model 3 had high slope values for all stages. The training performance MSE value was lower than the validation and testing, and these two were close (validation MSE = 0.15; training MSE = 0.13); therefore, there were no signs of under- or overfitting. On the other hand, Model 3, developed using the e-nose outputs as inputs to predict the physical parameters obtained using RoboBEER, also had high overall accuracy (r = 0.93) with moderate-high slope values. This model had close MSE values for validation (MSE = 0.10) and testing (MSE = 0.20) and with the training stage having a lower value (MSE = 0.02), therefore, no signs of under- or over-fitting.
Figure 5 shows the overall regression models with their respective R values and regression equation. According to the 95% confidence bounds, Model 2 had 5% (15 out of 300 observations) of outliers, while Model 3 had 7% (21 out of 300 observations). On the other hand, Model 4 presented 5.3% (41 out of 780 observations) of outliers. It can be observed that in Model 2, flavor liking and carbonation mouthfeel were the attributes with the highest number of outliers (4 out of 60 each), while bitterness and aroma had the lowest (2 out of 60 each). In Model 3, bitterness was the highest in outliers (8 out of 60), while aroma was the lowest (1 out of 60). Conversely, in Model 4, ‘a’ and FDrain had the highest number of outliers (7 out of 60 each), while SmBubb did not present any outlier, and MedBubb only had 1 outlier out of 60.

4. Discussion

4.1. Relationships between E-Nose and Physicochemical Analysis

Most of the bottom fermentation beers were clustered close to vectors related to foam drainage (FDrain) of beers and color red, green and blue (RGB) and L; the latter may be explained due to the lighter color that these beers tend to have [49] compared to those form top and spontaneous fermentation. Furthermore, the spontaneous beers were grouped mostly close to bubble formation with the distribution of bubbles between small, medium, and large size (SmBubb, MedBubb, and LgBubb) contributing to a higher lifetime of foam (LTF), similar results have been previously reported for both physicochemical and sensory data [10,13,50,51]. On the other hand, top fermentation beers clustered mostly closer to all the gas sensors’ sensitivity with a variation of foamability and bitterness which mainly influenced overall aroma, and flavor liking along with higher beer carbonation mouthfeel (Mcarb) (Figure 3a). The reason for top fermentation beers to be spread along the PCA may be mainly due to the variability in the bitterness and flavor due to the addition of different types and amounts of hops, which is greater than that in the bottom, and spontaneous fermentation beers [10,52,53].
Most of the gas sensors from the e-nose were related to each other as expected. Still, more importantly, there were statistically significant and positive correlations between sensors from the e-nose and carbonation sensation and bitterness, which can be directly related to the CO2 release from beers in the pouring and aromas related to hops giving bitterness taste on beers [13,54] (Figure 2a and Figure 3b), which directly influenced the flavor and overall liking from the sensory analysis. Furthermore, there were also significant and positive correlations between the e-nose sensors and the lifetime of foam and blue to yellow colors (b) from CIELab and blue (B) from the RGB color scales (Figure 2b). The latter may be explained since volatile compounds such as hydrogen sulfide (MQ136) are present in the malt and hops, which are responsible for beer color [49,55]. Furthermore, hydrogen sulfide (MQ136), alcohol (MQ3, MQ135, MQ138), and hydrogen are produced during fermentation in which a drop in pH is caused, provoking a change in color intensity [49,56,57].
There are significant correlations between small bubbles (SmBubb) and liking, which were directly related to the lifetime of foam (LTF) and retention of foam of beers, hence decreasing the release of gases after pouring, which can explain the absence of correlation between small bubbles and the e-nose gas sensors. Furthermore, correlations between LTF and SmBubb with ‘a’ from CIELab scale were found; this may be explained with the findings in other studies showing that beers and berries with more red color had higher sugar content [50,58], and at the same time sugars act as surfactant substances, which are responsible for increasing beer’s viscosity and, therefore, increasing foam stability and reducing bubble size [13,17,59].

4.2. Artificial Intelligence Applied to Beer Quality Assessment

The machine learning-based Model 1 was able to classify all the beers studied into the top, bottom, and spontaneous fermentation with very high accuracy (97%) using data from the e-nose. The latter is consistent with the data from multivariate data analysis presented here (Figure 2a,b) and previous research using data from the RoboBEER as inputs to classify beers into the three types of fermentation with similarly reported accuracies of 92.4% [13]. These results are important since, for this specific type of application related to beer classification, data analysis is based on the signal analysis in the case of the e-nose compared to more complex implementation of computer vision algorithms in the case of RoboBEER. Furthermore, the e-nose could offer additional gas classification capabilities and identification of the specific gases that every sensor is sensitive to and aroma profiles from beers [20,27,29,31,60]. Further applications could be focused on identifying faults and proteins in beers [16] and traceability using new and emerging sensor technologies [61].
The use of the e-nose could also be more efficient, cost-effective, and user-friendly than NIR spectroscopy methods, as per the results shown here to assess consumer sensory perception and acceptability of beers, which resulted in Model 3 having higher accuracy (e-nose) compared to Model 2 (NIR). Finally, Model 4, based on e-nose inputs, was shown to be highly accurate at detecting physical parameters of foam formation, drainage, size, and distribution of bubbles and colorimetric assessment of beers compared to the RoboBEER. These results are very encouraging when aligned to Model 1 since this makes it possible for the RoboBEER to act just like a precise pouring device to be attached to the e-nose to obtain all the required physicochemical, colorimetric, and sensory perception by consumer parameters for a more accurate, objective, cost-effective and user-friendly beer quality assessment system. Furthermore, the e-nose may be installed as a stand-alone device at different stages of the production line to assess beer quality and detect any faults in real-time to take corrective actions in the processing line before the final product. These parameters obtained from the new system proposed here can be used as an integrative system coupled with blockchain for traceability and authentication of beers [62,63].

5. Conclusions

A novel system based on artificial intelligence (AI) has been proposed using robotics, electronic sensors (e-nose), and machine learning to assess beer quality more objectively. The system proposed here offers high accuracy in identifying beer fermentation, consumer preference, and acceptance, as well as physicochemical and colorimetric analysis. Furthermore, it potentially could be used for authentication and traceability coupled with blockchain technology for higher transparency within the brewing chain from raw materials, brewing, quality assurance, and sensory analysis, to commercialization. Finally, the integration of low-cost technology with AI makes it possible to apply these new and emerging technologies to the broad spectrum of brewing processes and brewing companies, from craft beer enterprises to the biggest brewers.

Supplementary Materials

The following are available online at https://0-www-mdpi-com.brum.beds.ac.uk/2311-5637/6/4/104/s1, Table S1. Style of the beer samples used for the study including their country of origin, fermentation type and alcohol content

Author Contributions

Conceptualization, C.G.V. and S.F.; methodology, C.G.V. and S.F.; validation, C.G.V. and S.F.; formal analysis, C.G.V.; investigation, C.G.V. and S.F.; data curation, C.G.V. and S.F.; writing—original draft preparation, C.G.V. and S.F.; writing—review and editing, C.G.V. and S.F.; software, C.G.V. and S.F.; visualization, C.G.V. and S.F.; supervision, S.F.; project administration, C.G.V. All authors have read and agreed to the published version of the manuscript.

Funding

This research received no external funding.

Acknowledgments

The authors would like to acknowledge Ranjith R. Unnithan, Bryce Widdicombe, Mimi Sun, and Jorge Gonzalez from the School of Engineering, Department of Electrical and Electronic Engineering of The University of Melbourne for their collaboration in the electronic nose development.

Conflicts of Interest

The authors declare no conflict of interest.

References

  1. Gasiński, A.; Kawa-Rygielska, J.; Szumny, A.; Czubaszek, A.; Gąsior, J.; Pietrzak, W. Volatile Compounds Content, Physicochemical Parameters, and Antioxidant Activity of Beers with Addition of Mango Fruit (Mangifera Indica). Molecules 2020, 25, 3033. [Google Scholar] [CrossRef]
  2. Gasiński, A.; Kawa-Rygielska, J.; Szumny, A.; Gąsior, J.; Głowacki, A. Assessment of Volatiles and Polyphenol Content, Physicochemical Parameters and Antioxidant Activity in Beers with Dotted Hawthorn (Crataegus punctata). Foods 2020, 9, 775. [Google Scholar] [CrossRef]
  3. Kawa-Rygielska, J.; Adamenko, K.; Kucharska, A.Z.; Prorok, P.; Piórecki, N. Physicochemical and antioxidative properties of Cornelian cherry beer. Food Chem. 2019, 281, 147–153. [Google Scholar] [CrossRef]
  4. Deng, Y.; Bi, H.; Yin, H.; Yu, J.; Dong, J.; Yang, M.; Ma, Y. Influence of ultrasound assisted thermal processing on the physicochemical and sensorial properties of beer. Ultrason. Sonochem. 2018, 40, 166–173. [Google Scholar] [CrossRef]
  5. Pereira, I.M.C.; Neto, J.D.M.; Figueiredo, R.W.; Carvalho, J.D.G.; Figueiredo, E.A.T.D.; Menezes, N.V.S.D.; Gaban, S.V.F. Physicochemical characterization, antioxidant activity, and sensory analysis of beers brewed with cashew peduncle (Anacardium occidentale) and orange peel (Citrus sinensis). Food Sci. Technol. 2020. [Google Scholar] [CrossRef] [Green Version]
  6. Prestes, D.N.; Spessato, A.; Talhamento, A.; Gularte, M.A.; Schirmer, M.A.; Vanier, N.L.; Rombaldi, C.V. The addition of defatted rice bran to malted rice improves the quality of rice beer. LWT 2019, 112, 108262. [Google Scholar] [CrossRef]
  7. Martínez, A.; Vegara, S.; Martí, N.; Valero, M.; Saura, D. Physicochemical characterization of special persimmon fruit beers using bohemian pilsner malt as a base. J. Inst. Brew. 2017, 123, 319–327. [Google Scholar] [CrossRef] [Green Version]
  8. Humia, B.V.; Santos, K.S.; Schneider, J.K.; Leal, I.L.; de Abreu Barreto, G.; Batista, T.; Machado, B.A.S.; Druzian, J.I.; Krause, L.C.; da Costa Mendonça, M. Physicochemical and sensory profile of Beauregard sweet potato beer. Food Chem. 2020, 312, 126087. [Google Scholar] [CrossRef]
  9. Sung, S.-A.; Lee, S.-J. Physicochemical and sensory characteristics of commercial top-fermented beers. Korean J. Food Sci. Technol. 2017, 49, 35–43. [Google Scholar] [CrossRef] [Green Version]
  10. Viejo, C.G.; Fuentes, S.; Howell, K.; Torrico, D.; Dunshea, F. Integration of non-invasive biometrics with sensory analysis techniques to assess acceptability of beer by consumers. Physiol. Behav. 2019, 200, 139–147. [Google Scholar] [CrossRef]
  11. Stone, H.; Bleibaum, R.; Thomas, H.A. Sensory Evaluation Practices; Elsevier/Academic Press: San Diego, CA, USA, 2012. [Google Scholar]
  12. Kemp, S.; Hollowood, T.; Hort, J. Sensory Evaluation: A Practical Handbook; Wiley: Oxford, UK, 2011. [Google Scholar]
  13. Viejo, C.G.; Fuentes, S.; Li, G.; Collmann, R.; Condé, B.; Torrico, D. Development of a robotic pourer constructed with ubiquitous materials, open hardware and sensors to assess beer foam quality using computer vision and pattern recognition algorithms: RoboBEER. Food Res. Int. 2016, 89, 504–513. [Google Scholar] [CrossRef] [PubMed]
  14. Condé, B.C.; Fuentes, S.; Caron, M.; Xiao, D.; Collmann, R.; Howell, K.S. Development of a robotic and computer vision method to assess foam quality in sparkling wines. Food Control 2017, 71, 383–392. [Google Scholar] [CrossRef]
  15. Vann, L.; Layfield, J.B.; Sheppard, J.D. The application of near-infrared spectroscopy in beer fermentation for online monitoring of critical process parameters and their integration into a novel feedforward control strategy. J. Inst. Brew. 2017, 123, 347–360. [Google Scholar] [CrossRef] [Green Version]
  16. Viejo, C.G.; Caboche, C.H.; Kerr, E.D.; Pegg, C.L.; Schulz, B.L.; Howell, K.; Fuentes, S. Development of a Rapid Method to Assess Beer Foamability Based on Relative Protein Content Using RoboBEER and Machine Learning Modeling. Beverages 2020, 6, 28. [Google Scholar] [CrossRef]
  17. Viejo, C.G.; Fuentes, S.; Torrico, D.; Howell, K.; Dunshea, F.R. Assessment of beer quality based on foamability and chemical composition using computer vision algorithms, near infrared spectroscopy and machine learning algorithms. J. Sci. Food Agric. 2018, 98, 618–627. [Google Scholar] [CrossRef]
  18. Viejo, C.G.; Fuentes, S. A Digital Approach to Model Quality and Sensory Traits of Beers Fermented under Sonication Based on Chemical Fingerprinting. Fermentation 2020, 6, 73. [Google Scholar] [CrossRef]
  19. Gonzalez Viejo, C.; Torrico, D.D.; Dunshea, F.R.; Fuentes, S. Emerging Technologies Based on Artificial Intelligence to Assess the Quality and Consumer Preference of Beverages. Beverages 2019, 5, 62. [Google Scholar] [CrossRef] [Green Version]
  20. Viejo, C.G.; Fuentes, S.; Godbole, A.; Widdicombe, B.; Unnithan, R.R. Development of a low-cost e-nose to assess aroma profiles: An artificial intelligence application to assess beer quality. Sens. Actuators B Chem. 2020, 127688. [Google Scholar] [CrossRef]
  21. Viejo, C.G.; Fuentes, S. Beer Aroma and Quality Traits Assessment Using Artificial Intelligence. Fermentation 2020, 6, 56. [Google Scholar] [CrossRef]
  22. Thazin, Y.; Pobkrut, T.; Kerdcharoen, T. Prediction of acidity levels of fresh roasted coffees using e-nose and artificial neural network. In Proceedings of the 2018 10th International Conference on Knowledge and Smart Technology (KST), Chiangmai, Thailand, 31 January–3 February 2018; pp. 210–215. [Google Scholar]
  23. Romani, S.; Cevoli, C.; Fabbri, A.; Alessandrini, L.; Rosa, M.D. Evaluation of coffee roasting degree by using electronic nose and artificial neural network for off-line quality control. J. Food Sci. 2012, 77, C960–C965. [Google Scholar] [CrossRef]
  24. Qiu, S.; Gao, L.; Wang, J. Classification and regression of ELM, LVQ and SVM for E-nose data of strawberry juice. J. Food Eng. 2015, 144, 77–85. [Google Scholar] [CrossRef]
  25. Chen, Q.; Zhao, J.; Chen, Z.; Lin, H.; Zhao, D.-A. Discrimination of green tea quality using the electronic nose technique and the human panel test, comparison of linear and nonlinear classification tools. Sens. Actuators B Chem. 2011, 159, 294–300. [Google Scholar] [CrossRef]
  26. Dutta, R.; Hines, E.; Gardner, J.; Kashwan, K.; Bhuyan, M. Tea quality prediction using a tin oxide-based electronic nose: An artificial intelligence approach. Sens. Actuators B Chem. 2003, 94, 228–237. [Google Scholar] [CrossRef]
  27. Fuentes, S.; Summerson, V.; Viejo, C.G.; Tongson, E.; Lipovetzky, N.; Wilkinson, K.L.; Szeto, C.; Unnithan, R.R. Assessment of Smoke Contamination in Grapevine Berries and Taint in Wines Due to Bushfires Using a Low-Cost E-Nose and an Artificial Intelligence Approach. Sensors 2020, 20, 5108. [Google Scholar] [CrossRef]
  28. Macías, M.; Agudo, J.; Manso, A.; Orellana, C.; Velasco, H.; Caballero, R. A compact and low cost electronic nose for aroma detection. Sensors 2013, 13, 5528–5541. [Google Scholar] [CrossRef] [Green Version]
  29. Men, H.; Shi, Y.; Fu, S.; Jiao, Y.; Qiao, Y.; Liu, J. Mining Feature of Data Fusion in the Classification of Beer Flavor Information Using E-Tongue and E-Nose. Sensors 2017, 17, 1656. [Google Scholar]
  30. Ghasemi-Varnamkhasti, M.; Mohtasebi, S.S.; Siadat, M.; Lozano, J.; Ahmadi, H.; Razavi, S.H.; Dicko, A. Aging fingerprint characterization of beer using electronic nose. Sens. Actuators B Chem. 2011, 159, 51–59. [Google Scholar] [CrossRef]
  31. Pornpanomchai, C.; Suthamsmai, N. Beer classification by electronic nose. In Proceedings of the 2008 International Conference on Wavelet Analysis and Pattern Recognition, Hong Kong, China, 30–31 August 2008; pp. 333–338. [Google Scholar]
  32. Wojnowski, W.; Majchrzak, T.; Dymerski, T.; Gębicki, J.; Namieśnik, J. Electronic noses: Powerful tools in meat quality assessment. Meat Sci. 2017, 131, 119–131. [Google Scholar] [CrossRef]
  33. Wojnowski, W.; Majchrzak, T.; Dymerski, T.; Gębicki, J.; Namieśnik, J. Portable electronic nose based on electrochemical sensors for food quality assessment. Sensors 2017, 17, 2715. [Google Scholar] [CrossRef] [Green Version]
  34. Deisingh, A.K.; Stone, D.C.; Thompson, M. Applications of electronic noses and tongues in food analysis. Int. J. Food Sci. Technol. 2004, 39, 587–604. [Google Scholar] [CrossRef]
  35. Loutfi, A.; Coradeschi, S.; Mani, G.K.; Shankar, P.; Rayappan, J.B.B. Electronic noses for food quality: A review. J. Food Eng. 2015, 144, 103–111. [Google Scholar] [CrossRef]
  36. Zhou, B.; Wang, J. Use of electronic nose technology for identifying rice infestation by Nilaparvata lugens. Sens. Actuators B Chem. 2011, 160, 15–21. [Google Scholar] [CrossRef]
  37. Yang, W.; Yu, J.; Pei, F.; Mariga, A.M.; Ma, N.; Fang, Y.; Hu, Q. Effect of hot air drying on volatile compounds of Flammulina velutipes detected by HS-SPME–GC–MS and electronic nose. Food Chem. 2016, 196, 860–866. [Google Scholar] [CrossRef]
  38. Di Rosa, A.R.; Leone, F.; Cheli, F.; Chiofalo, V. Fusion of electronic nose, electronic tongue and computer vision for animal source food authentication and quality assessment—A review. J. Food Eng. 2017, 210, 62–75. [Google Scholar] [CrossRef]
  39. Zeiger, K. zNose Series. Available online: https://www.cbrnetechindex.com/Print/4362/electronic-sensor-technology-inc/znose-series (accessed on 26 October 2020).
  40. Men, H.; Shi, Y.; Jiao, Y.; Gong, F.; Liu, J. Electronic nose sensors data feature mining: A synergetic strategy for the classification of beer. Anal. Methods 2018, 10, 2016–2025. [Google Scholar] [CrossRef]
  41. Shi, Y.; Gong, F.; Wang, M.; Liu, J.; Wu, Y.; Men, H. A deep feature mining method of electronic nose sensor data for identifying beer olfactory information. J. Food Eng. 2019, 263, 437–445. [Google Scholar] [CrossRef]
  42. Nimsuk, N. Improvement of accuracy in beer classification using transient features for electronic nose technology. J. Food Meas. Charact. 2019, 13, 656–662. [Google Scholar] [CrossRef]
  43. Abdi, M.; Adebiyi, A.; Fasoli, A.; Mannari, A.; Labby, R.; Bozano, L. Model Comparison of Beer data classification using an electronic nose. In Proceedings of the Eighth International Conference on Learning Representations, Virtual Conference, Addis Ababa, Ethiopia, 26 April–1 May 2020. [Google Scholar]
  44. Quarto, A.; Soldo, D.; Di Lecce, F.; Giove, A.; Di Lecce, V.; Castronovo, A. Electronic nose for evaluating water use in beer production. In Proceedings of the 2017 ISOCS/IEEE International Symposium on Olfaction and Electronic Nose (ISOEN), Montreal, QC, Canada, 28–31 May 2017; pp. 1–3. [Google Scholar]
  45. Sànchez, C.; Lozano, J.; PedroSantos, J.; Azabal, A.; Ruiz-Valdepeñas, S. Discrimination of aromas in beer with electronic nose. In Proceedings of the 2018 Spanish Conference on Electron Devices (CDE), Salamanca, Spain, 14–16 November 2018; pp. 1–4. [Google Scholar]
  46. Voss, H.G.J.; Mendes Júnior, J.J.A.; Farinelli, M.E.; Stevan, S.L. A Prototype to Detect the Alcohol Content of Beers Based on an Electronic Nose. Sensors 2019, 19, 2646. [Google Scholar] [CrossRef] [Green Version]
  47. Fuentes, S.; Gonzalez Viejo, C.; Torrico, D.; Dunshea, F. Development of a biosensory computer application to assess physiological and emotional responses from sensory panelists. Sensors 2018, 18, 2958. [Google Scholar] [CrossRef] [Green Version]
  48. Deep, K.; Jain, M.; Salhi, S. Logistics, Supply Chain and Financial Predictive Analytics: Theory and Practices; Springer: Berlin/Heidelberg, Germany, 2018. [Google Scholar]
  49. Delcour, J.A.; Hoseney, R.C. Principles of Cereal Science and Technology; AACC International: Eagan, MN, USA, 2010. [Google Scholar]
  50. Viejo, C.G.; Fuentes, S.; Torrico, D.; Howell, K.; Dunshea, F. Assessment of Beer Quality Based on a Robotic Pourer, Computer Vision, and Machine Learning Algorithms Using Commercial Beers. J. Food Sci. 2018, 83, 1381–1388. [Google Scholar] [CrossRef]
  51. Viejo, C.G.; Fuentes, S.; Howell, K.; Torrico, D.; Dunshea, F.R. Robotics and computer vision techniques combined with non-invasive consumer biometrics to assess quality traits from beer foamability using machine learning: A potential for artificial intelligence applications. Food Control 2018, 92, 72–79. [Google Scholar] [CrossRef]
  52. Perozzi, C.; Beaune, H. The Naked Brewer: Fearless Homebrewing Tips, Tricks & Rule-breaking Recipes; Penguin Publishing Group: New York, NY, USA, 2012. [Google Scholar]
  53. Perozzi, C.; Beaune, H. The Naked Pint: An Unadulterated Guide to Craft Beer; Penguin Publishing Group: New York, NY, USA, 2012. [Google Scholar]
  54. De Keukeleire, D. Fundamentals of beer and hop chemistry. Quim. Nova 2000, 23, 108–112. [Google Scholar] [CrossRef]
  55. Anderson, R.; Howard, G. The production of hydrogen sulphide by yeast and by Zymomonas anaerobia. J. Inst. Brew. 1974, 80, 245–251. [Google Scholar] [CrossRef]
  56. Bokulich, N.A.; Bamforth, C.W. The microbiology of malting and brewing. Microbiol. Mol. Biol. Rev. 2013, 77, 157–172. [Google Scholar] [CrossRef] [PubMed] [Green Version]
  57. Stewart, G.G. The production of secondary metabolites with flavour potential during brewing and distilling wort fermentations. Fermentation 2017, 3, 63. [Google Scholar] [CrossRef] [Green Version]
  58. Abeytilakarathna, P.; Fonseka, R.; Eswara, J.; Wijethunga, K. Relationship between total solid content and red, green and blue colour intensity of strawberry (Fragaria x ananassa Duch.) fruits. J. Agric. Sci. 2013, 8, 82–90. [Google Scholar] [CrossRef] [Green Version]
  59. Badui, S. Química de los Alimentos; Pearson Education: Naucalpan de Juarez, México, 2006. [Google Scholar]
  60. Yu, H.; Wang, J.; Yao, C.; Zhang, H.; Yu, Y. Quality grade identification of green tea using E-nose by CA and ANN. LWT-Food Sci. Technol. 2008, 41, 1268–1273. [Google Scholar] [CrossRef]
  61. Violino, S.; Figorilli, S.; Costa, C.; Pallottino, F. Internet of Beer: A Review on Smart Technologies from Mash to Pint. Foods 2020, 9, 950. [Google Scholar] [CrossRef]
  62. Patelli, N.; Mandrioli, M. Blockchain technology and traceability in the agrifood industry. J. Food Sci. 2020. [Google Scholar] [CrossRef]
  63. Kamiloglu, S. Authenticity and traceability in beverages. Food Chem. 2019, 277, 12–24. [Google Scholar] [CrossRef]
Figure 1. Electronic nose showing (a) the front side with the nine gas sensors attached to the printed circuit board (PCB) and the mini security digital (SD) card to store data, and (b) the back/side of the PCB.
Fermentation 06 00104 g001
Figure 2. Diagrams of the two-layer feedforward artificial neural networks showing (a) pattern recognition Model 1 with a tan-sigmoid function in the hidden layer and Softmax neurons in the output layer, (b,c) regression Models 2–4 with a tan-sigmoid function in the hidden layer and a linear transfer function in the output layer.
Fermentation 06 00104 g002
Figure 3. Multivariate data analysis results showing (a) the biplot from the principal components analysis (PCA) and (b) the correlation matrix depicting only the significant correlations (p < 0.05) of the data obtained from the electronic nose, RoboBEER physical parameters, and consumer sensory responses. Abbreviations are shown in Table 1, Table 2 and Table 3.
Fermentation 06 00104 g003
Figure 4. Receiver operating characteristics (ROC) curve depicting the true positive (y-axis) and false positive (x-axis) rates of Model 1 constructed to predict the type of fermentation of beers using the electronic nose outputs as inputs.
Fermentation 06 00104 g004
Figure 5. Overall regression models for (a) Model 2 to predict the consumer sensory responses using the near-infrared absorbance values as inputs, (b) Model 3 to predict the consumer sensory responses using the electronic nose outputs as inputs, and (c) Model 4 to predict the physical parameters measured with the RoboBEER using the electronic nose outputs as inputs.
Fermentation 06 00104 g005aFermentation 06 00104 g005b
Table 1. Sensors integrated into the electronic nose.
Sensor (Gas) *Label/ModelSensitivity
AlcoholMQ30.5–10 mg L−1
MethaneMQ4200–10,000 ppm
Carbon monoxideMQ720–2000 ppm
HydrogenMQ8100–10,000 ppm
Ammonia/Alcohol/BenzeneMQ13510–300 ppm/10–300 ppm/10–1000 ppm
Hydrogen SulfideMQ1361–100 ppm
AmmoniaMQ1375–200 ppm
Benzene/Alcohol/AmmoniaMQ13810–1000 ppm/10–1000 ppm/10–3000 ppm
Carbon dioxideMG811350–10,000 ppm
* All sensors are from Henan Hanwei Electronics Co., Ltd., Henan, China.
Table 2. Sensory attributes evaluated in the beer consumer test.
AttributeLabelScale
Carbonation MouthfeelMcarb9-point hedonic
BitternessTbitter9-point hedonic
AromaAroma Liking9-point hedonic
FlavorFlavor Liking9-point hedonic
Overall LikingOverall Liking9-point hedonic
Table 3. Physical parameters analyzed using the RoboBEER.
ParameterLabel
Maximum volume of foamMaxVol
Total lifetime of foamTLTF
Lifetime of foamLTF
Foam drainageFDrain
Color lab scaleL, a and b
Color RGB scaleR, G, and B
Small bubblesSmBubb
Medium bubblesMedBubb
Large bubblesLgBubb
Table 4. Statistical data from the pattern recognition artificial neural network Model 1 classify beers into the type of fermentation (top, bottom, and spontaneous) using the electronic nose outputs as inputs. The performance was based on means squared error (MSE).
StageSamplesAccuracyErrorPerformance (MSE)
Training36100%0%<0.01
Validation1292%8%0.10
Testing1292%8%0.10
Overall6097%3%N/A
N/A: Not applicable.
Table 5. Statistical data from the regression artificial neural network Models 2–5. Performance was based on means squared error (MSE). Abbreviations: R: correlation coefficient.
StageSamplesObservationsRSlopePerformance (MSE)
Model 2 (Near-infrared inputs/Sensory targets)
Training361800.980.960.02
Validation12600.870.850.12
Testing12600.801.000.30
Overall603000.900.96N/A
Model 3 (Electronic nose inputs/Sensory targets)
Training361800.991.00<0.01
Validation12600.950.940.15
Testing12600.850.940.13
Overall603000.950.97N/A
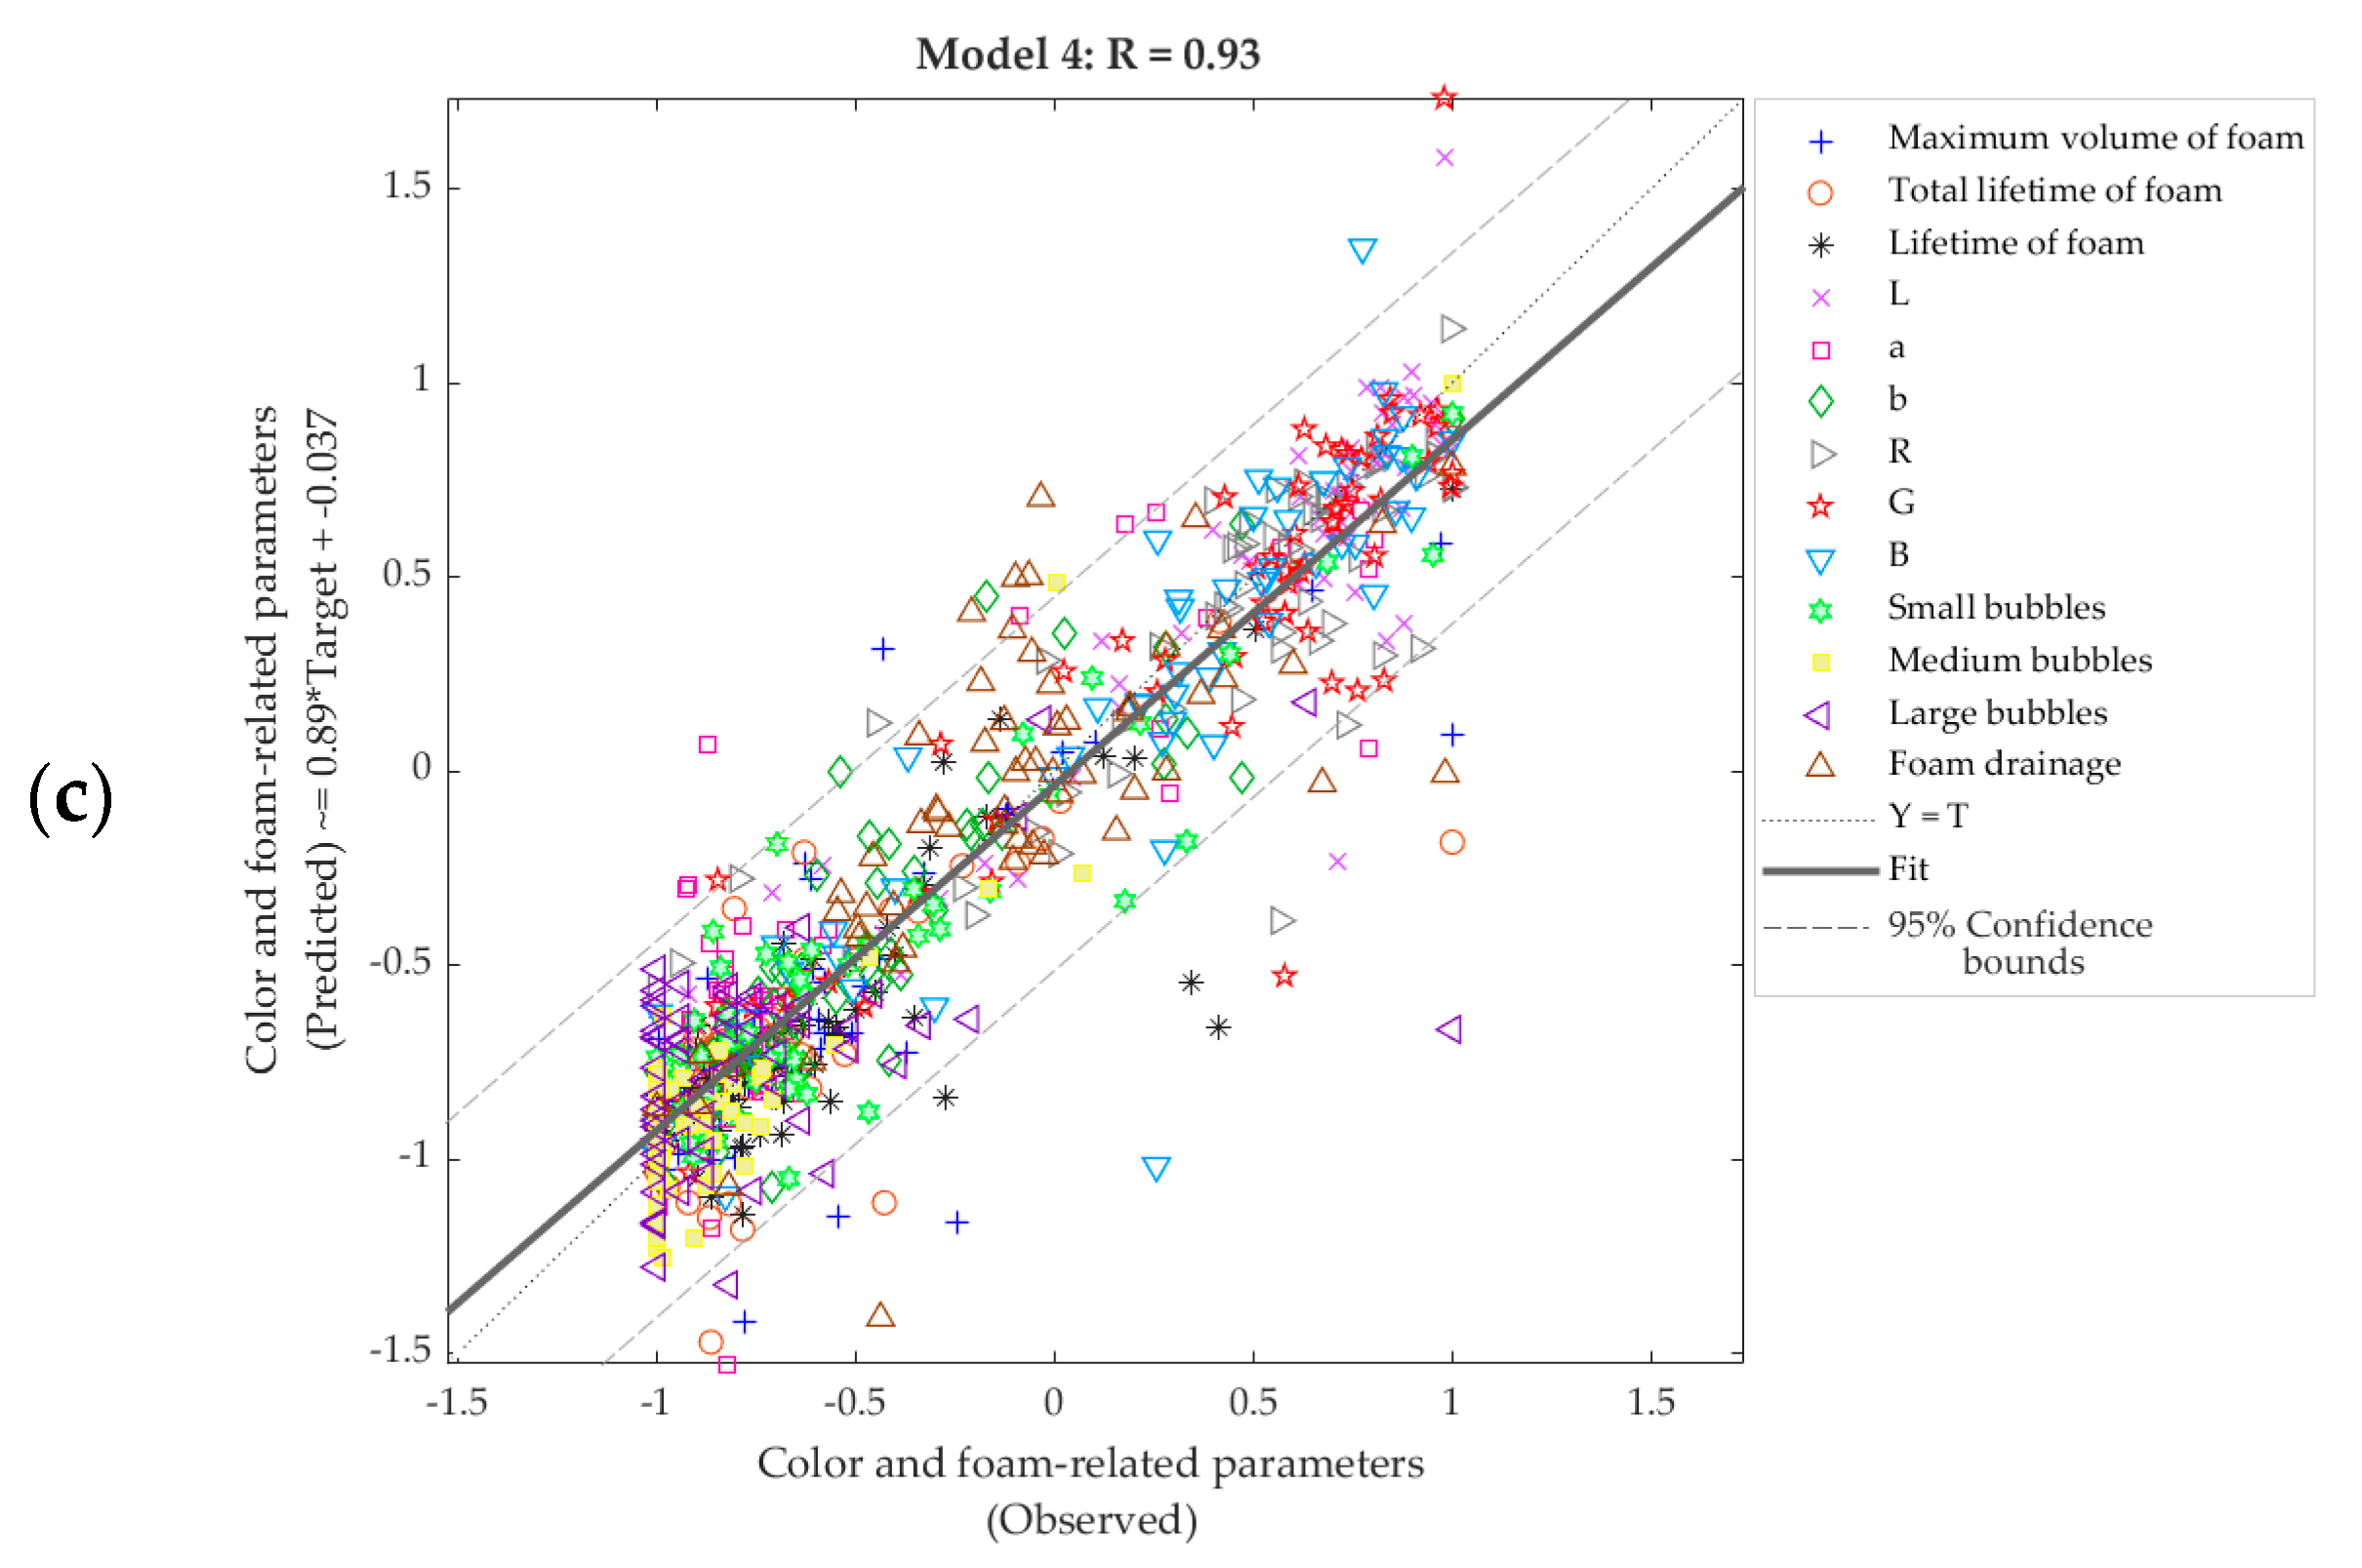
Model 3 (Electronic nose inputs/RoboBEER targets)
Training364680.980.930.02
Validation121560.900.800.10
Testing121560.820.870.20
Overall607800.930.89N/A
N/A: Not applicable.
Publisher’s Note: MDPI stays neutral with regard to jurisdictional claims in published maps and institutional affiliations.

