Article

Dynamic Co-Cultivation Process of Corynebacterium glutamicum Strains for the Fermentative Production of Riboflavin

1
Department of Chemical Engineering, Faculty of Natural Sciences, Norges Teknisk-Naturvitenskapelige Universitet (NTNU), NO-7491 Trondheim, Norway
2
Genetics of Prokaryotes, Faculty of Biology & Center for Biotechnology (CeBiTec), Bielefeld University, 33617 Bielefeld, Germany
*
Author to whom correspondence should be addressed.
Submission received: 2 December 2020 / Revised: 31 December 2020 / Accepted: 9 January 2021 / Published: 12 January 2021
(This article belongs to the Special Issue Biorefineries)

Abstract

:
Residual streams from lignocellulosic processes contain sugar mixtures of glucose, xylose, and mannose. Here, the industrial workhorse Corynebacterium glutamicum was explored as a research platform for the rational utilization of a multiple sugar substrate. The endogenous manA gene was overexpressed to enhance mannose utilization. The overexpression of the xylA gene from Xanthomonas campestris in combination with the endogenous xylB gene enabled xylose consumption by C. glutamicum. Furthermore, riboflavin production was triggered by overexpressing the sigH gene from C. glutamicum. The resulting strains were studied during batch fermentations in flasks and 2 L lab-scale bioreactors separately using glucose, mannose, xylose, and a mixture of these three sugars as a carbon source. The production of riboflavin and consumption of sugars were improved during fed-batch fermentation thanks to a dynamic inoculation strategy of manA overexpressing strain and xylAB overexpressing strain. The final riboflavin titer, yield, and volumetric productivity from the sugar mixture were 27 mg L−1, 0.52 mg g−1, and 0.25 mg L−1 h−1, respectively. It reached a 56% higher volumetric productivity with 45% less by-product formation compared with an equivalent process inoculated with a single strain overexpressing the genes xylAB and manA combined. The results indicate the advantages of dynamic multi strains processes for the conversion of sugar mixtures.

1. Introduction

The manufacture of cellulosic pulp consists of the separation of cellulose fibers composed mainly of lignin using physical or chemical methods [1,2]. Classical pulping processes include soda, Kraft, sulfite, alcohol-based, and organic acid-based methods [1,3,4]. In particular, the sulfite process is a chemical pulping method of converting wood chips into paper pulp by cooking the lignocellulosic material with a solution of bisulfite and sulfur dioxide [1]. Spent sulfite liquors (SSLs) are the main by-product of the sulfite process reaching a world production of around 1.8 million tons per year [5]. SSLs have a high content of fermentable sugars (20–25%), mainly glucose, xylose, and mannose. SSLs may also contain organic acids like acetic acid and formic acid, alcohols like methanol and ethanol, free and combined SO2, salts of SO4−2, growth inhibitors like furfural and 5-hydroxymethylfurural, lignosulfonates, and ashes [6,7]. Although the composition of SSLs varies depending on the initial raw material composition [6,7,8], SSLs are generally incinerated to produce energy [9] or converted into the low value bioethanol (Sustainability Report of 2018 from Borregaard, accessed in March 2020). The aim of the circular economy is to make the best possible use of society’s resources for as long as possible. The efficient utilization of side streams while creating new value chains is a cornerstone of circular economy and white biotechnology. However, the microbial cell factories that are commonly used in industrial production processes cannot efficiently consume sugars present in waste streams since these bacteria lack the necessary metabolic pathways [10,11]. In addition, the composition of typical residual sugar streams changes depending on the initial raw material and may change between batches and seasons [6,7,8]. Hence, in order to effectively exploit these streams, the fermentation processes require a complex control and strategy.
To strengthen the biorefinery concept and to replace fossil resources, the implementation of novel added value chains from waste streams is of great interest [12]. Some compounds have gained special interest recently in the feed industry, as it is the case for the vitamin riboflavin. Riboflavin, also known as vitamin B2, is an essential nutrient for humans and higher animals that needs to be obtained from the diet with eggs, green vegetables, and grain products being common sources. Vitamin B2 can also be incorporated in the diet through supplements [13]. The nutritional status of riboflavin impacts directly on lipid metabolism, energy metabolism, redox balance, and metabolizing drugs and xenobiotic substances [14,15]. The global market of riboflavin peaked at 7790 million USD in 2019 with Germany (BASF SE, Ludwigshafen, Germany) and China (Hubei Guangji Pharmaceutical Co., Wuxue, China) as its major manufacturers. To ensure a good supply, riboflavin is produced in large-scale fermentations as food and feed additive. The bacterium Bacillus subtilis and the filamentous fungus Ashbya gossypii are currently the main bio-platforms to produce riboflavin [15,16,17]. Those microorganisms have been greatly engineered to develop genetically improved strains. Modifications like the overexpression of the riboflavin genetic operon, enhancing supply of precursors, and the optimization of the central carbon metabolism are common strategies applied to B. subtilis and A. gossypii [17]. Currently, those industrial processes rely on glucose as a carbon source. However, due to the competing uses of glucose in the food and feed industries, the use of alternative and renewable carbon sources is in focus.
The bacterium Corynebacterium glutamicum, a workhorse in industrial biotechnology [18,19], has proven to be a robust platform for the development of cell-factories. C. glutamicum is traditionally used for the industrial production of l-lysine and l-glutamate at a level of 6 million tons per year [19,20]. However, production of many and diverse added-value compounds have been established in C. glutamicum during decades becoming a crucial pillar of white biotechnology [19,21,22]. C. glutamicum has been extensively engineered for the consumption of non-native carbon sources like xylose [23,24]. New C. glutamicum strains are mostly tested using single sugars as sole carbon sources and as monocultures (only one strain per culture). Synthetic consortia with C. glutamicum have been designed [25], but strains contained modifications to ensure interdependence, which limits product yields. In the same direction, C. glutamicum/C. glutamicum consortia have been established, but only tested at the lab-on-chip microscale using single sugars and avoiding physical contact between strains. In such consortia, the l-lysine-producing C. glutamicum strain DM1800 interacted with a l-lysine auxotrophic variant (C. glutamicumlysA) [26]. However, a thorough understanding about the uses of multiple sugars within co-cultures (more than one strain) is lacking nowadays.
In this study, the overexpression of the endogenous sigma factor sigH from C. glutamicum was used to trigger production of riboflavin [27]. Riboflavin was produced from each of the single sugars glucose, mannose, and xylose, and a mixture of the three sugars. C. glutamicum was engineered for growth on xylose by overexpression of the xylose isomerase gene xylA from Xanthomonas campestris in combination with overexpression of the endogenous xylulokinase gene xylB [23]. Mannose consumption was boosted by the overexpression of the mannose-6-phosphate isomerase gene manA from C. glutamicum [28]. Four different riboflavin producing strains were established: RiboGlu, RiboMan, RiboXyl, and RiboSSL (Table 1). The strains were tested during batch fermentations as monocultures and during fed-batch fermentation as dynamic co-cultures.
We aimed to demonstrate the exploitation of sugar mixtures by establishing a controlled co-cultivation process in bioreactors to increase the efficiency of microbial fermentation with cell-factories able to produce riboflavin. As the carbon source, we used a mixture of glucose, mannose, and xylose called synthetic SSL (synSSL), which contains the main fermentable sugars and none of the growth inhibitors of real SSLs.

2. Materials and Methods

2.1. Bacterial Strains, Plasmids and Growth Conditions

The C. glutamicum strains and plasmids used in this work are listed in Table 1. E. coli DH5α was routinely cultivated in LB medium or on LB agar plates at 37 °C. C. glutamicum strains were routinely pre-cultivated in 2xYT (16 g L−1 Tryptone, 10 g L−1 Yeast Extract, 5 g L−1 NaCl) plates or liquid medium overnight at 30 °C. For C. glutamicum main cultures CGXII minimal medium [32] was inoculated to an optical density (OD600) of 1. Optical densities were measured at 600 nm via the spectrophotometer Genesys 10 s UV-Vis (Thermo Scientific, Waltham, MA, USA). Biomass calculations were done according to the correlation 1 g L−1 = 0.3634 OD600. As the carbon source, the sugars glucose, mannose or xylose were added at the concentration of 5, 10, 20, 50, or 100 g L−1. Synthetic Spent Sulfite Liquor or SynSSL referred to the mixture of glucose, mannose, and xylose. The synSSL used during growth experiments in flasks contained a mixture of 5, 10, 20, 50 or 100 g L−1 per each sugar. The synSSL used during bioreactor experiments contained a mixture 20 g L−1 per each sugar. For the determination of the sugars, organic acids, amino acids, and riboflavin, samples were withdrawn from the cultures, centrifuged at 13,000 rpm and 4 °C to remove the cells, and stored at −20 °C until utilization. Antibiotics, vitamins, and carbon sources were sterilized by filtration while the rest of the components were sterilized by autoclavation (121 °C for 20 min). When needed, kanamycin, and spectinomycin were used at a concentration of 25 and 100 μg mL−1 respectively. To induce riboflavin production, 10 µM of IPTG was used.

2.2. Molecular Genetic Techniques and Strains Construction

Standard molecular genetic techniques were performed as described [33]. E. coli DH5α cells were transformed by heat shock according to the RbCl method [33] and C. glutamicum cells by electroporation [32] at 2.5 kV, 200 Ω and 25 µF. Phusion High-Fidelity DNA polymerase (New England Biolabs, Hitchin, UK) was used for PCR amplification. The genes xylA from Xanthomonas campestris and xylB from C. glutamicum were amplified from pVWEx1-xylAB [23] with the primers xylAB-fw and xylAB-rv (Table 2), manA was amplified from C. glutamicum genomic DNA with the primers manA-fw and manA-rv for construction of pSH1-manA or xyl-manA-fw and xyl-manA-rv for construction of pSH1-xylAB-manA. The plasmids pSH1 [30] and pSH1-xylAB were restricted with BamHI and KpnI, respectively, and were used together with the amplified products in Gibson Assembly [34] to yield the plasmids listed in Table 1.

2.3. Analytical Procedures

For the quantification of extracellular sugars, organic acids, amino acids, and riboflavin a high-pressure liquid chromatography (HPLC) system was used (UltiMate3000 series, Thermo Scientific, Waltham, MA, USA). The cell cultures were diluted (1:10) and filtered by the NUMERA system (Securecells, Urdorf, Switzerland) and the supernatants were used for analysis or stored at −20 °C.
The quantification of sugars was done using a 300 × 7.8 mm NUCLEOGEL®SUGAR 810 Pb column (Macherey-Nagel, Düren, Germany) pre warm at 80 °C and detected by a refractive index detector (RefractoMax 520, Thermo Scientific, USA). As a mobile phase, deionized water was used at 0.4 mL min−1. The quantification of organic acids was done using a 150 × 3.0 mm Acclaim™ Organic Acid 3 µm column (Thermo Scientific, Waltham, MA, USA) pre warm at 30 °C and detected by a refractive index detector (RefractoMax 520, Thermo Scientific, Waltham, MA, USA). As a mobile phase, deionized water was used at 0.6 mL min−1. The quantification of amino acids and riboflavin was done using a 125 × 4.6 mm NUCLEODUR C8 Gravity 5 µm column (Macherey-Nagel, Düren, Germany) prewarm at 50 °C and detected by a fluorescence detector (UltiMate™ 3000 Fluorescence Detector, Thermo Scientific, Waltham, MA, USA). Riboflavin was detected with the excitation and emission wavelengths of 450 and 535 nm, respectively. Amino acids were detected with the excitation and emission wavelengths of 340 and 450 nm, respectively. O-phthalaldehyde (OPA) pre column derivatization of the samples was used in a ratio 1:1 of OPA reagent/sample for the detection of amino acids. As the mobile phase, the buffers sodium acetate 0.1 mM pH 7.2 (buffer A) and sodium acetate 0.1 mM pH 7.2 plus methanol and acetonitrile (ratio 1:2:2) (buffer B) were used following the gradient: 0 min, buffer A 100%, 0.45 mL min−1; 18 min, buffer A 40%, 0.45 mL min−1; 24 min, buffer A 0%, 0.8 mL min−1; 28 min, buffer A 100%, 0.45 mL min−1. A set of HPLC standards were prepared for each of the compounds analyzed. HPLC-grade water was used as solvent. The concentrations for each set of standards were 20, 10, 5, 2.5, 1.25, and 0.6125 mM for sugars and organic acids and 2, 1, 0.5, 0.25, 0.125, and 0.06125 mM for amino acids.

2.4. Bioreactor Conditions

A baffled bioreactor (Labfors5) with a total volume of 3.6 L was used (Infors HT, Bottmingen, Switzerland). Two six-bladed Rushton impellers were placed in the stirrer axis with a distance from the bottom of the reactor of 6 cm and 12 cm. Automatic control of the stirrer speed kept the relative dissolved oxygen saturation at 30%. A pH of 7.0 was established and controlled by automatic addition of phosphoric acid (10% (w/w)) and potassium hydroxide (4 M). The temperature was maintained constant at 30 °C. A constant 2.0 NL min−1 of air was applied from the bottom of the bioreactor. Antifoam (Antifoam 204, Sigma-Aldrich Norway AS, Oslo, Norway) was added manually when needed. The initial working volume of 1 L was inoculated to an OD600 of 1 aprox. from an overnight 200 mL shake flask pre-culture in complex medium 2YT (16 g of tryptone 10 g yeast extract and 5 g of NaCl per liter). The samples were collected by the NUMERA (Securecells, Urdorf, Switzerland) autosampler and cooled down to 4 °C until use. Dilution of the samples (1:10) and/or filtration were performed by the NUMERA system when needed automatically. Planning, control and monitoring of the data were done with the software EVE (Infors HT, Bottmingen, Switzerland). Per liter of medium (CGXII) it contained: 10 g (NH4)2SO4, 5 g Urea, 0.26 g KH2PO4, 0.53 g K2HPO4, 0.01325 g CaCl2 × 2H2O, 0.25 g MgSO4 × 7H2O, 0.2 mg biotin, 1 mg FeSO4 × 7H2O, 1 mg MnSO4 × H2O, 0.1 mg ZnSO4 × 7H2O, 0.02 mg CuSO4, 0.002 mg NiCl2 × 6H2O, 0.1 g spectinomycin, 0.025 g kanamycin, 0.0024 g IPTG. The batch medium contained 20 g L−1 of glucose, mannose, xylose or 60 g L−1 synSSL depending on the experimental set-up while 300 g L−1 of synSSL was added to the feeding phase. SynSSL is the mixture of glucose, mannose and xylose in the same ratio, meaning that 300 g L−1 synSSL contains 100 g L−1 of glucose, 100 g L−1 of mannose, and 100 g L−1 of xylose. During fed-batch fermentations, a linear feeding rate of 0.4 mL min−1 was manually initiated when glucose was depleted according to HPLC measurements. The processes were finished when the pO2 value raised from 30% to 50% for the first time.

3. Results

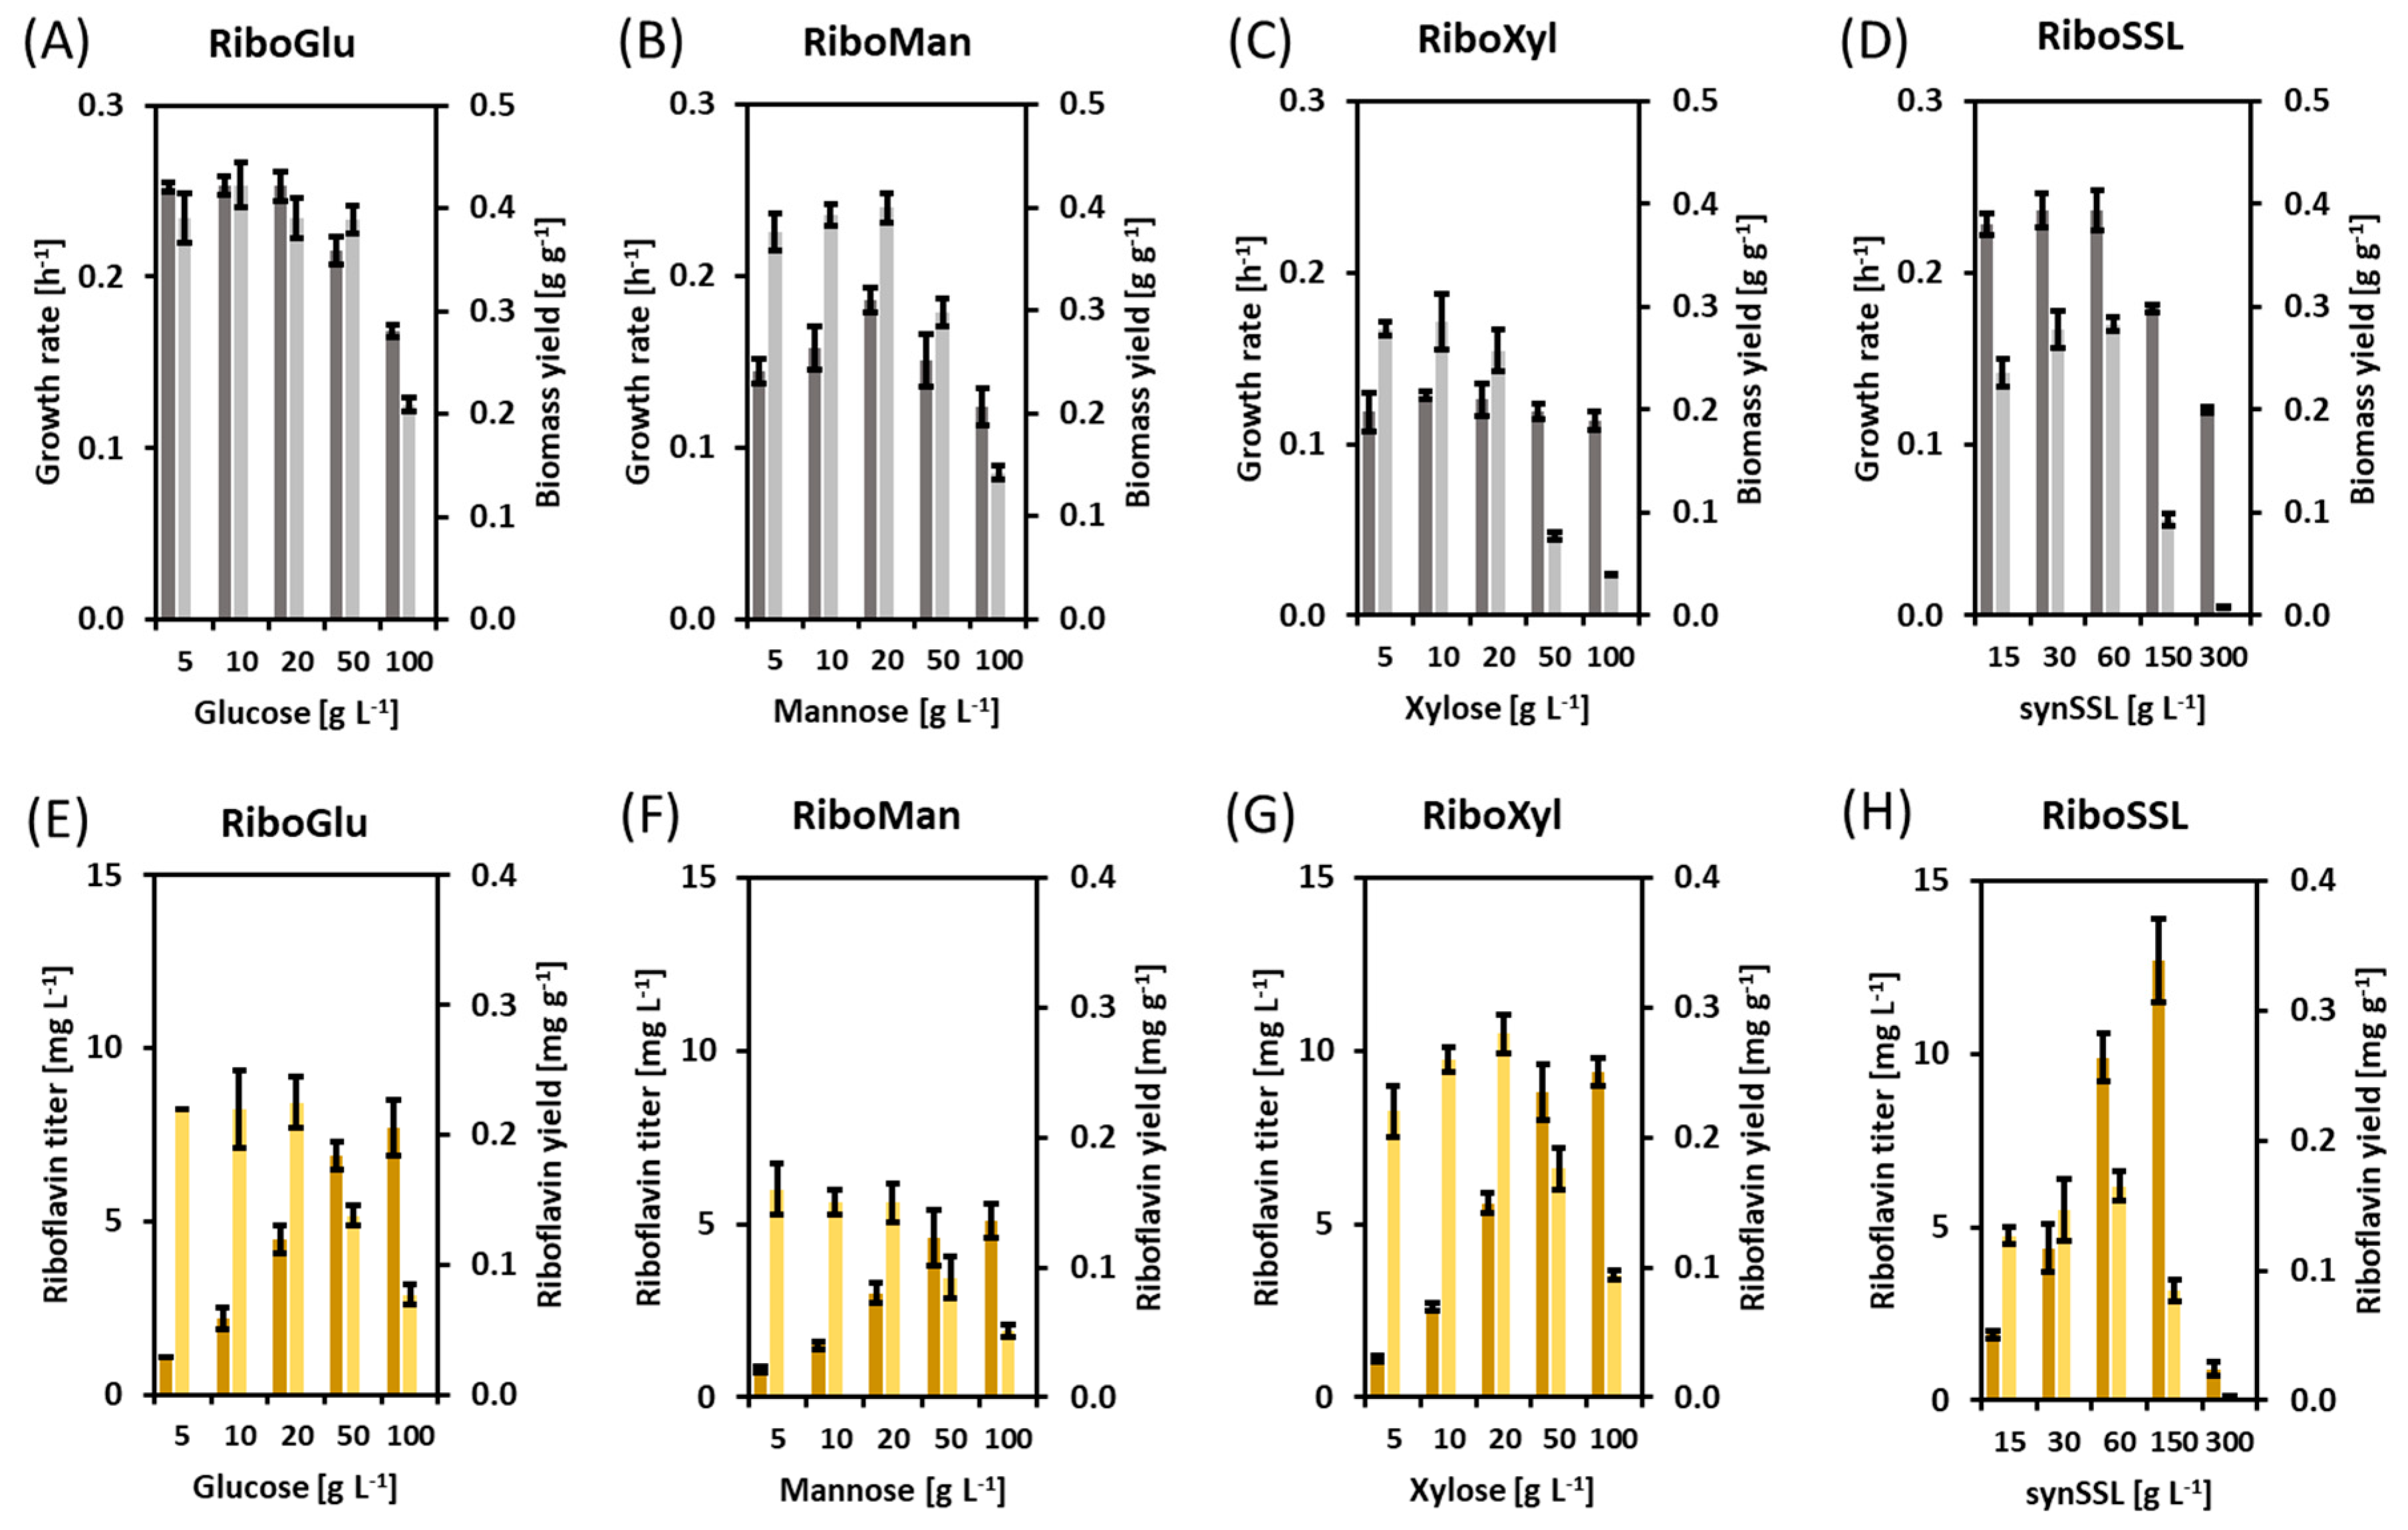
3.1. Riboflavin Production in Flask Fermentations with Different Carbon Sources and Concentrations

The production of riboflavin with C. glutamicum from glucose as sole carbon source was achieved previously by overexpressing the endogenous sigma factor sigH [27]. The strain C. glutamicum (pEKEx3-sigH) was used as the initial platform for the construction of the RiboGlu, RiboMan, RiboXyl, and RiboSSL riboflavin producer strains (Table 1). The strain C. glutamicum (pEKEx3-sigH) (pSH1-manA), named here RiboMan, produces riboflavin and shows enhanced mannose utilization [35]. The strain C. glutamicum (pEKEx3-sigH) (pSH1-xylAB), named here RiboXyl, produces riboflavin and can consume xylose [23]. The strain C. glutamicum (pEKEx3-sigH) (pSH1-manA-xylAB), named here RiboSSL, produces riboflavin, has enhanced mannose utilization, and is able to utilize xylose. Finally, the strain C. glutamicum (pEKEx3-sigH) (pSH1), named here RiboGlu, produces riboflavin and can utilize native substrates at wild-type rates. The strains RiboGlu, RiboMan, RiboXyl, and RiboSSL were grown in minimal medium supplemented with glucose, mannose, xylose, or the mixture of the three sugars as the carbon source. The concentration of sugars ranked from 5 to 100 g L−1. The mixture of glucose, mannose, and xylose, named synSSL, contained the three sugars in the ratio 1:1:1, therefore, 30 g L−1 of synSSL equals 10 g L−1 of glucose, 10 g L−1 of mannose, and 10 g L−1 of xylose. The RiboGlu strain grown on glucose as sole carbon source was considered the control under the conditions tested here. Data regarding growth rate, final biomass, riboflavin titer, and riboflavin yield was collected.
In the RiboGlu strain growing with glucose as sole carbon source, the average values for growth rate and biomass yield resulting from the glucose concentrations of 5, 10 and 20 g L−1 were 0.25 ± 0.01 h−1 and 0.40 ± 0.02 g g−1, respectively. Under these conditions, the average of the riboflavin yield with RiboGlu growing on 5, 10 and 20 g L−1 of glucose was 0.22 ± 0.02 mg g−1. RiboGlu growing on 50 and 100 g L−1 glucose showed lower growth rates and riboflavin yields (Figure 1). The RiboMan strain growing with mannose as sole carbon source showed the highest growth rate of 0.19 ± 0.01 h−1 with 20 g L−1 of mannose, meaning 25% lower growth rate compared to RiboGlu growing with 20 g L−1 of glucose. Biomass and riboflavin yields were 0.40 ± 0.1 g g−1 and 0.15 ± 0.02 mg g−1 respectively. Concentrations of 50 and 100 g L−1 of mannose showed a negative impact on growth rate, biomass yield and riboflavin yield of RiboMan as it was observed with RiboGlu and the glucose concentrations of 50 and 100 g L−1 (Figure 1). The RiboXyl strain growing with xylose as sole carbon source showed comparable growth rates of 0.12 ± 0.01 h−1 independent from the xylose concentration. When using 5, 10, and 20 g L−1 of xylose the biomass yields remained similar with values of 0.27 ± 0.02 g g−1. At 20 g L−1 of xylose, RiboXyl peaked to its maximum riboflavin yield of 0.28 ± 0.01 mg g−1, being 22% higher riboflavin yield as compared to RiboGlu growing with 20 g L−1 of glucose (Figure 1).
The RiboSSL strain growing with synSSL as the carbon source showed similar behavior as RiboGlu, although reaching lower biomass and riboflavin yields. At 300 g L−1 of synSSL, the strain RiboSSL grew and produced very poorly (Figure 1). RiboSSL showed growth rates of 0.23 ± 0.01 h−1 under 15, 30 and 60 g L−1 of synSSL. The highest biomass and riboflavin yields were obtained at 60 g L−1 of sugar (as summary of this block: Table 3). Hence, further growth and production characterization in a bioreactor was performed by using 20 g L−1 glucose, 20 g L−1 mannose, 20 g L−1 xylose, or 60 g L−1 synSSL as the carbon source.

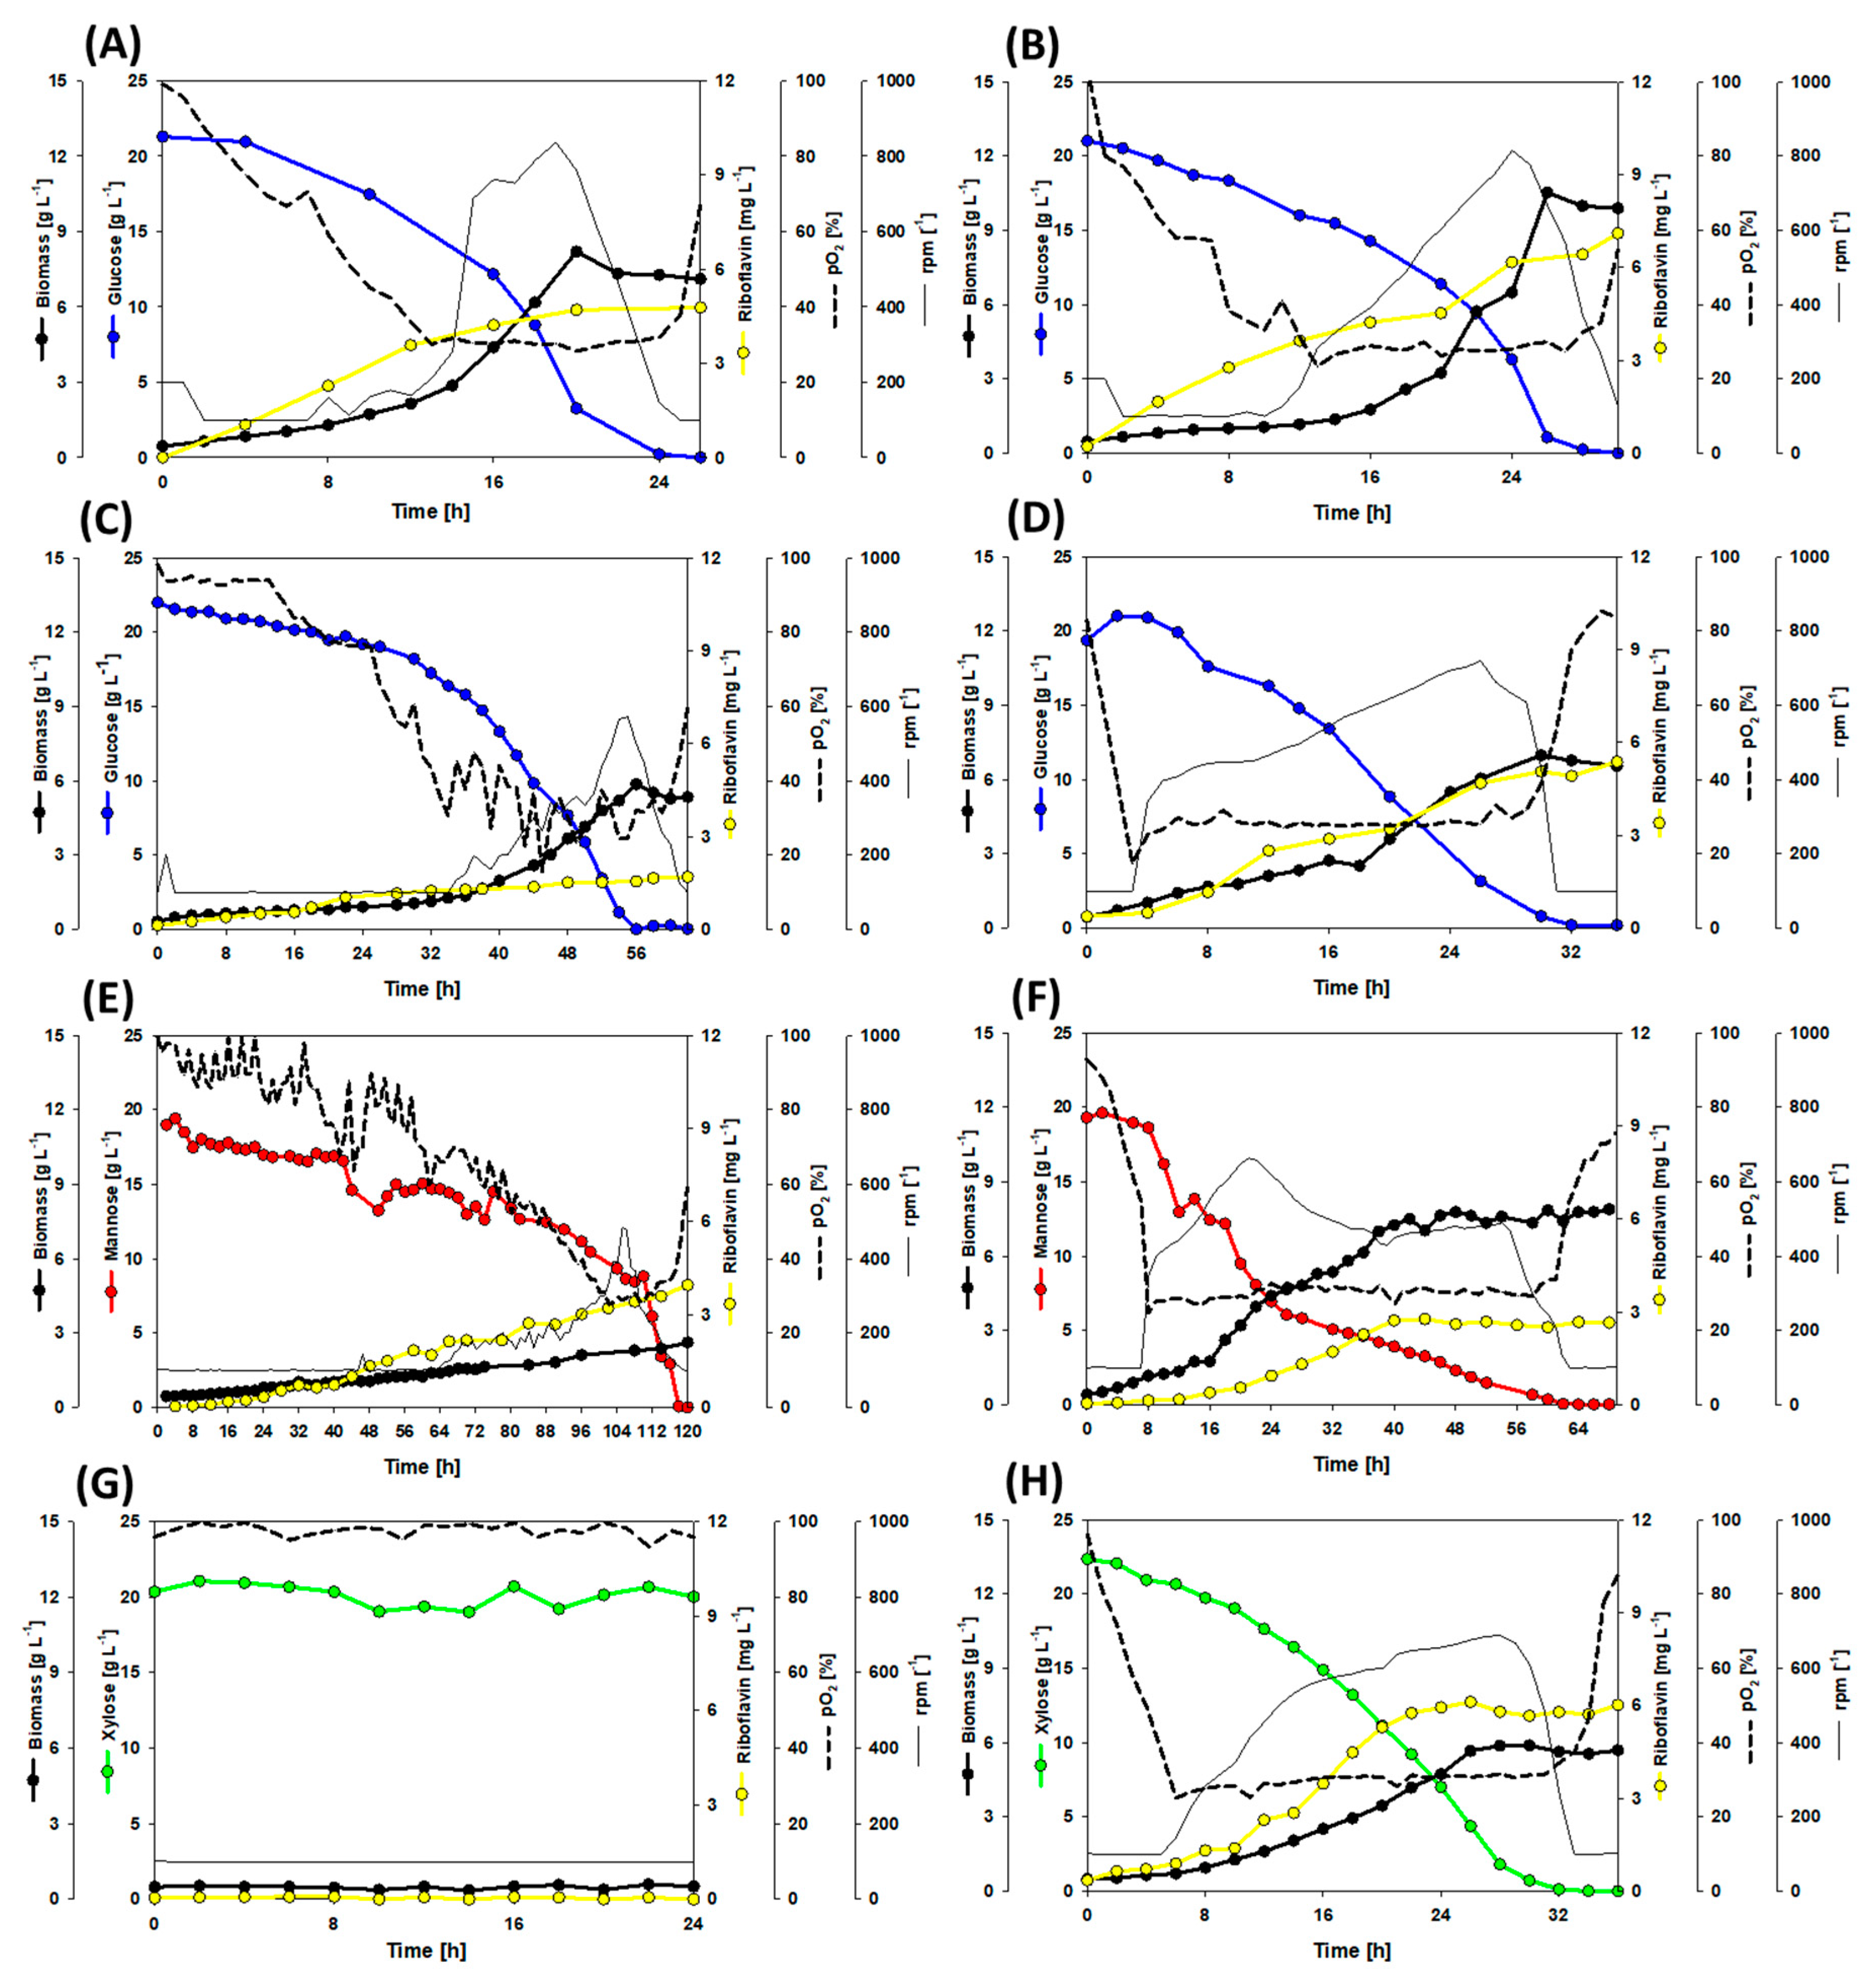
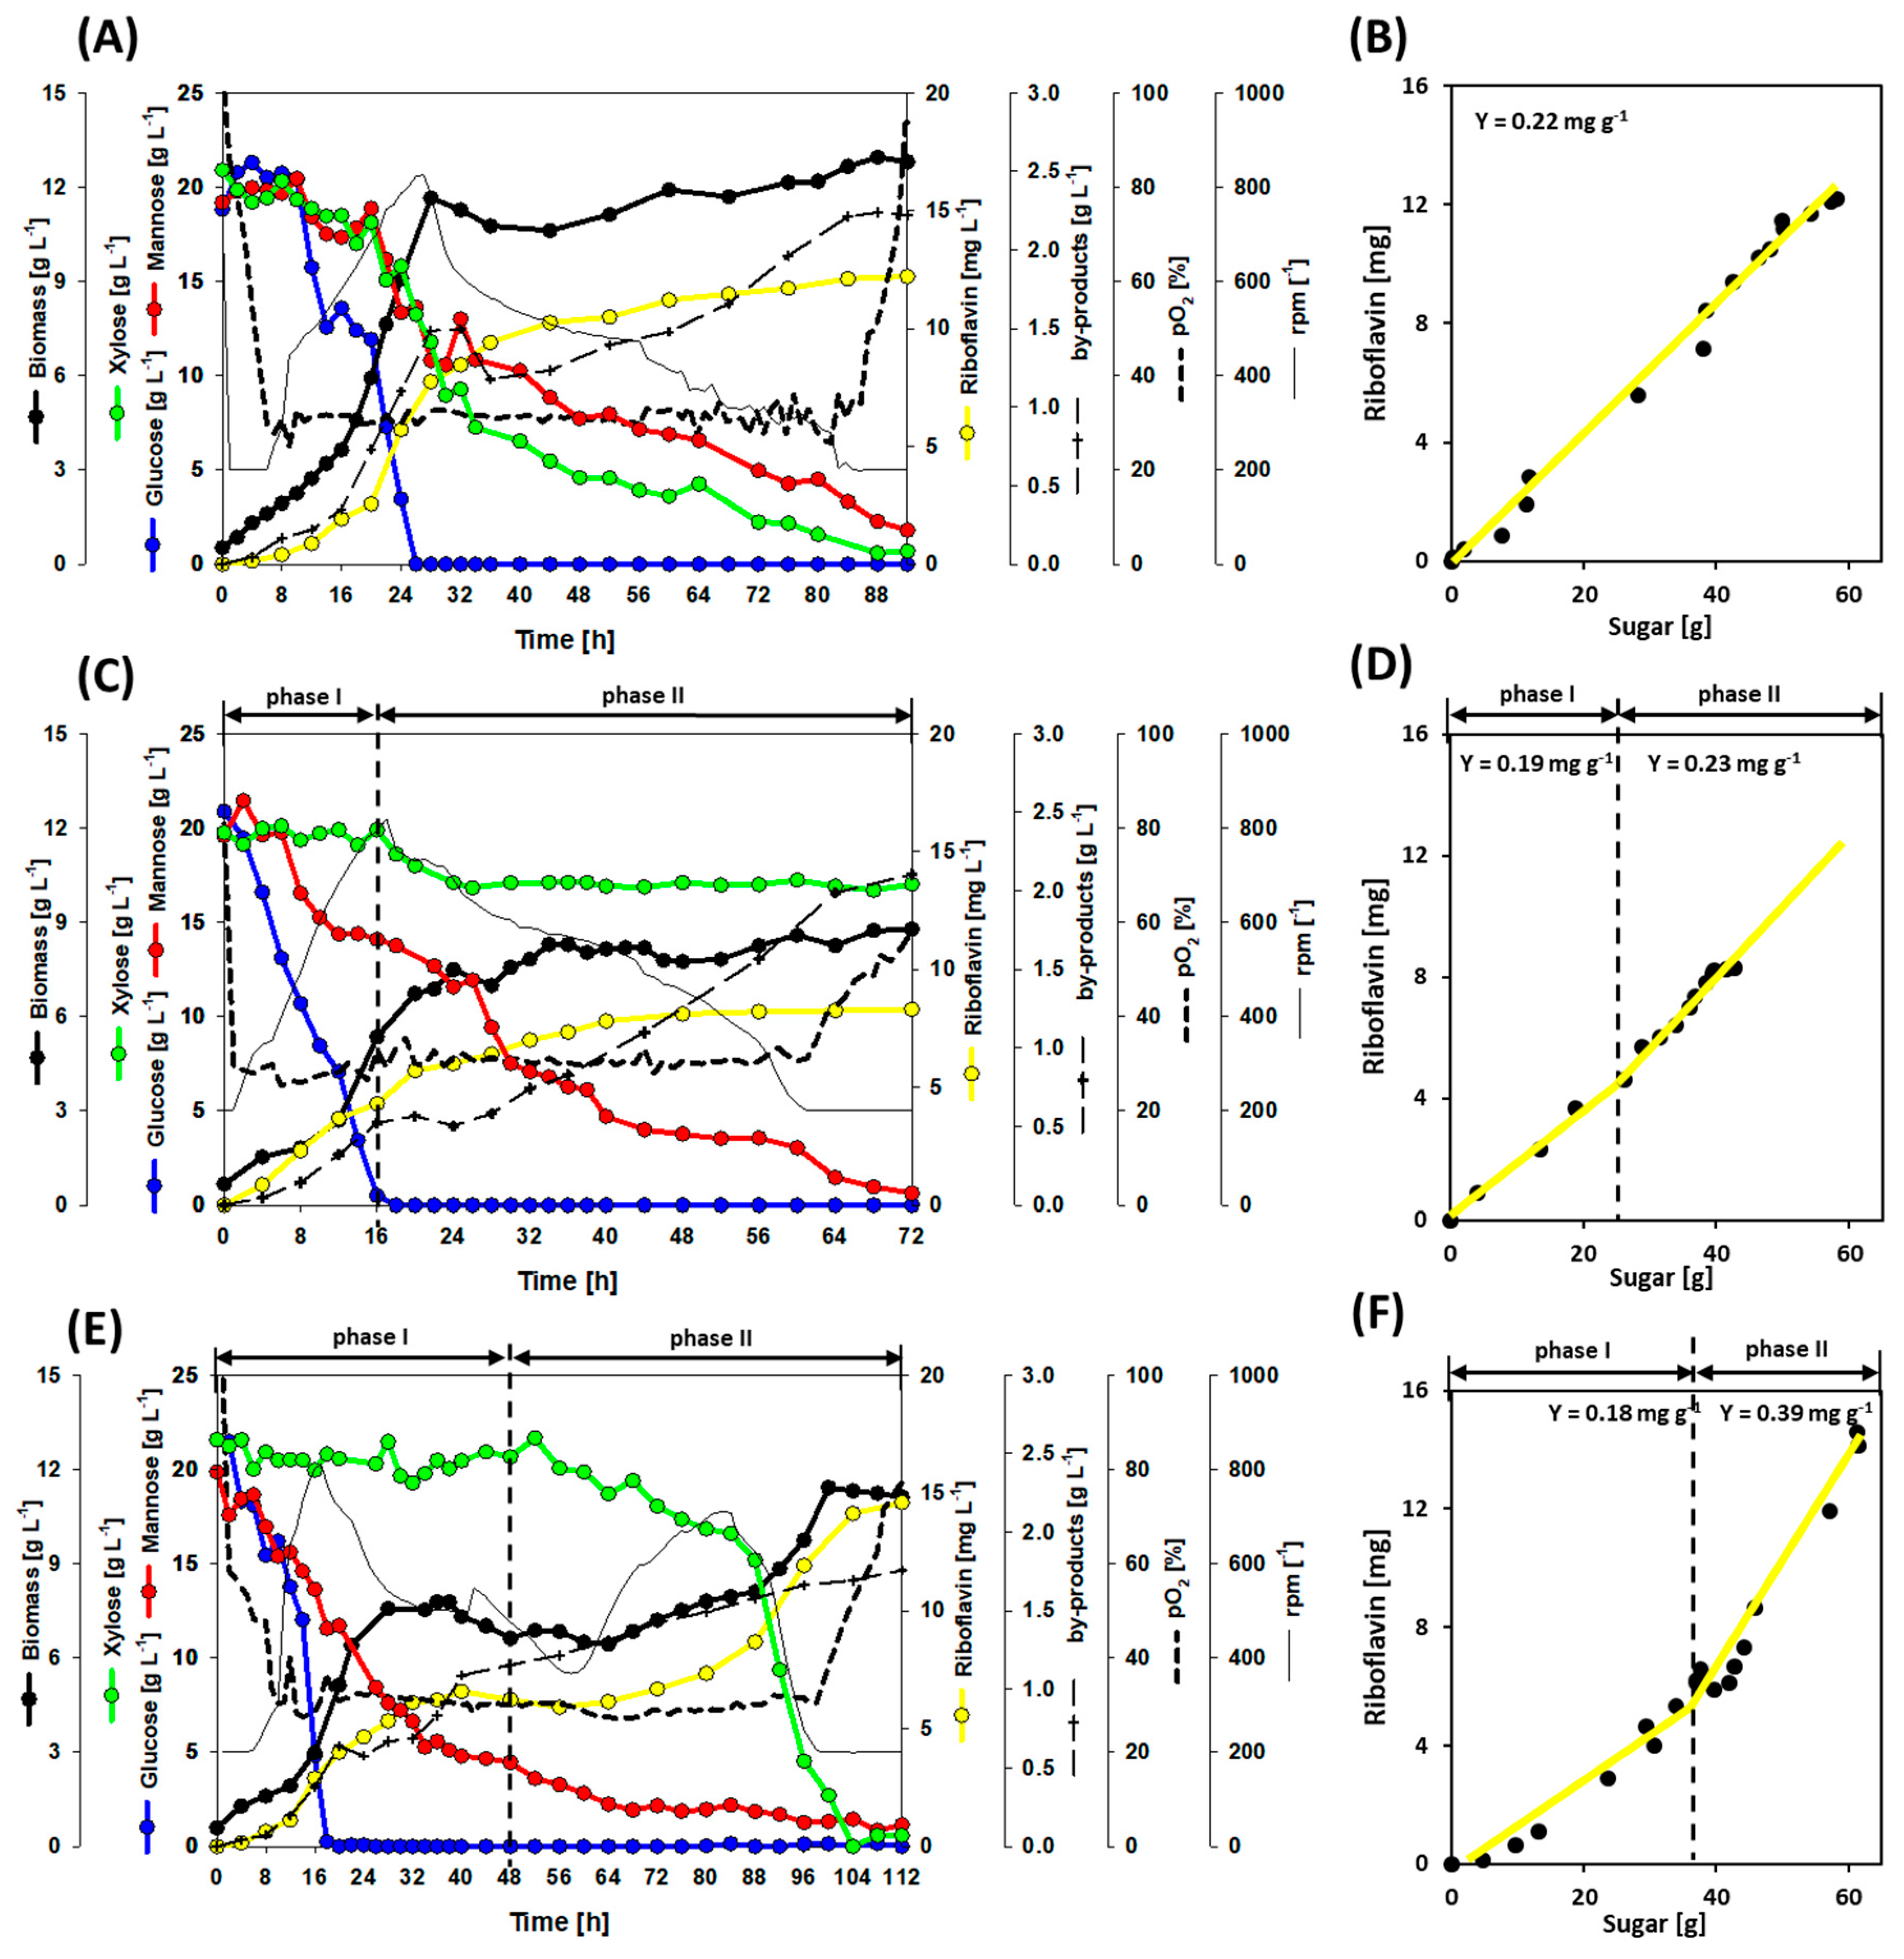
3.2. Growth and Production Behavior of the Riboflavin Producing Strains in Lab-Scale Bioreactor Fermentations

Here, the performance of the constructed riboflavin producing strains was evaluated in lab-scale bioreactors. One liter working volume of sugar-based minimal medium was used as the standard condition for all the fermentation vessels. The initial inoculated OD600 was 1.
The strains RiboGlu, RiboMan, RiboXyl, and RiboSSL were cultivated with 20 g L−1 glucose as sole carbon source (Figure 2A–D). RiboGlu and RiboMan showed a similar behavior in terms of growth. RiboXyl grew slower, exhibiting one linear phase and one exponential phase for glucose consumption and biomass formation, depleting glucose after 56 h. RiboSSL had depleted glucose after 32 h, in comparison with 24 h of RiboGlu and 28 h of RiboMan. Under these conditions, the riboflavin titers peaked at 4.8 mg L−1, 7.1 mg L−1, 1.7 mg L−1, and 5.3 mg L−1 for RiboGlu, RiboMan, RiboXyl, and RiboSSL respectively.
Mannose, as native carbon source for C. glutamicum, was tested with RiboGlu and RiboMan strains. RiboGlu was able to deplete 20 g L−1 mannose after 118 h, while the overexpression of manA within RiboMan decreased the time to 60 h. The final biomass formed was also affected with 7.9 g L−1 for RiboMan and 2.6 g L−1 for RiboGlu. The final riboflavin titers obtained with RiboGlu and RiboMan were 3.9 mg L−1 and 2.6 mg L−1 respectively (Figure 2E,F). RiboGlu was also tested with 20 g L−1 xylose as control. RiboGlu did not show any xylose consumption or uptake (Figure 2G). In contrast, RiboXyl could utilize xylose as sole carbon source (Figure 2F). RiboXyl depleted 20 g L−1 of xylose after 32 h reaching the final riboflavin titer of 6.0 mg L−1.
In a similar approach, RiboGlu, RiboMan, RiboXyl, and RiboSSL were tested with 60 g L−1 synSSL, i.e., a mixture of 20 g L−1 glucose, 20 g L−1 mannose, and 20 g L−1 xylose (see Materials and Methods). As expected, RiboGlu and RiboMan did not utilize xylose (Figure 3A,B). When manA was overexpressed (Figure 3B,D) the fermentations were finished after 66 and 68 h, while the strains with the native expression of manA took 92 and 84 h (Figure 3A,C). Glucose was always the first sugar to be depleted within the time range of 18 to 28 h (Figure 3A–D). RiboGlu, RiboMan, and RiboSSL produced 6.8, 6.5, and 7.3 mg L−1 of riboflavin, respectively. RiboXyl stood out over the other strains with a riboflavin production of 11.7 mg L−1 (Figure 3C). Regarding biomass, RiboGlu and RiboMan reached biomass yields of 0.14 and 0.15 g g−1, while RiboXyl and RiboSSL reached biomass yields of 0.20 and 0.21 g g−1 (Figure 3A–D) (as summary of this block: Table 4).
The by-products l-lactate, pyruvate, l-glutamate, l-alanine, and l-valine were monitored during the batch fermentations in bioreactors since they can be considered overflow metabolites in C. glutamicum [36,37,38]. When l-lactate, and pyruvate were observed, they were produced during the late exponential phase and were consumed during the stationary phase. The production of l-lactate and pyruvate were especially remarkable with the strains RiboXyl and RiboSSL growing on synSSL. RiboXyl accumulated up to 0.9 g L−1 of l-lactate. Regarding pyruvate, RiboXyl and RiboSSL accumulated up to 0.2 g L−1 (Figure 4K,L). When l-glutamate, l-alanine, and l-valine were produced they accumulated in the supernatant until the end of the processes. RiboGlu grown on mannose excreted overall 3.3 g L−1 of the three amino acids (Figure 4E). l-Glutamate was also a relevant by-product for the strains RiboMan and RiboSSL growing on synSSL, with titers of 1.0 and 1.1 g L−1, respectively. The amino acid l-alanine was mainly observed when growing the strains on synSSL, reaching values of 0.8, 1.0, 1.5, and 1.3 g L−1 (Figure 4I–L). Finally, the amino acid l-valine was generally produced during the stationary phase, and its highest titers were observed during growth in synSSL (Figure 4I–L). Production of l-valine was also prominent for the strain RiboMan grown in mannose (Figure 4F).
Based on the results above, the riboflavin production values obtained in the bioreactor experiments confirmed our shake flask experiments, overexpression of xylAB was mandatory for the consumption of xylose by C. glutamicum; RiboXyl growing on 60 g L−1 of synSSL as the carbon source achieved better production values than RiboSSL under the same conditions; the overexpression of manA was needed for a faster process; and the consumption of the three sugars together enhanced by-product formation.

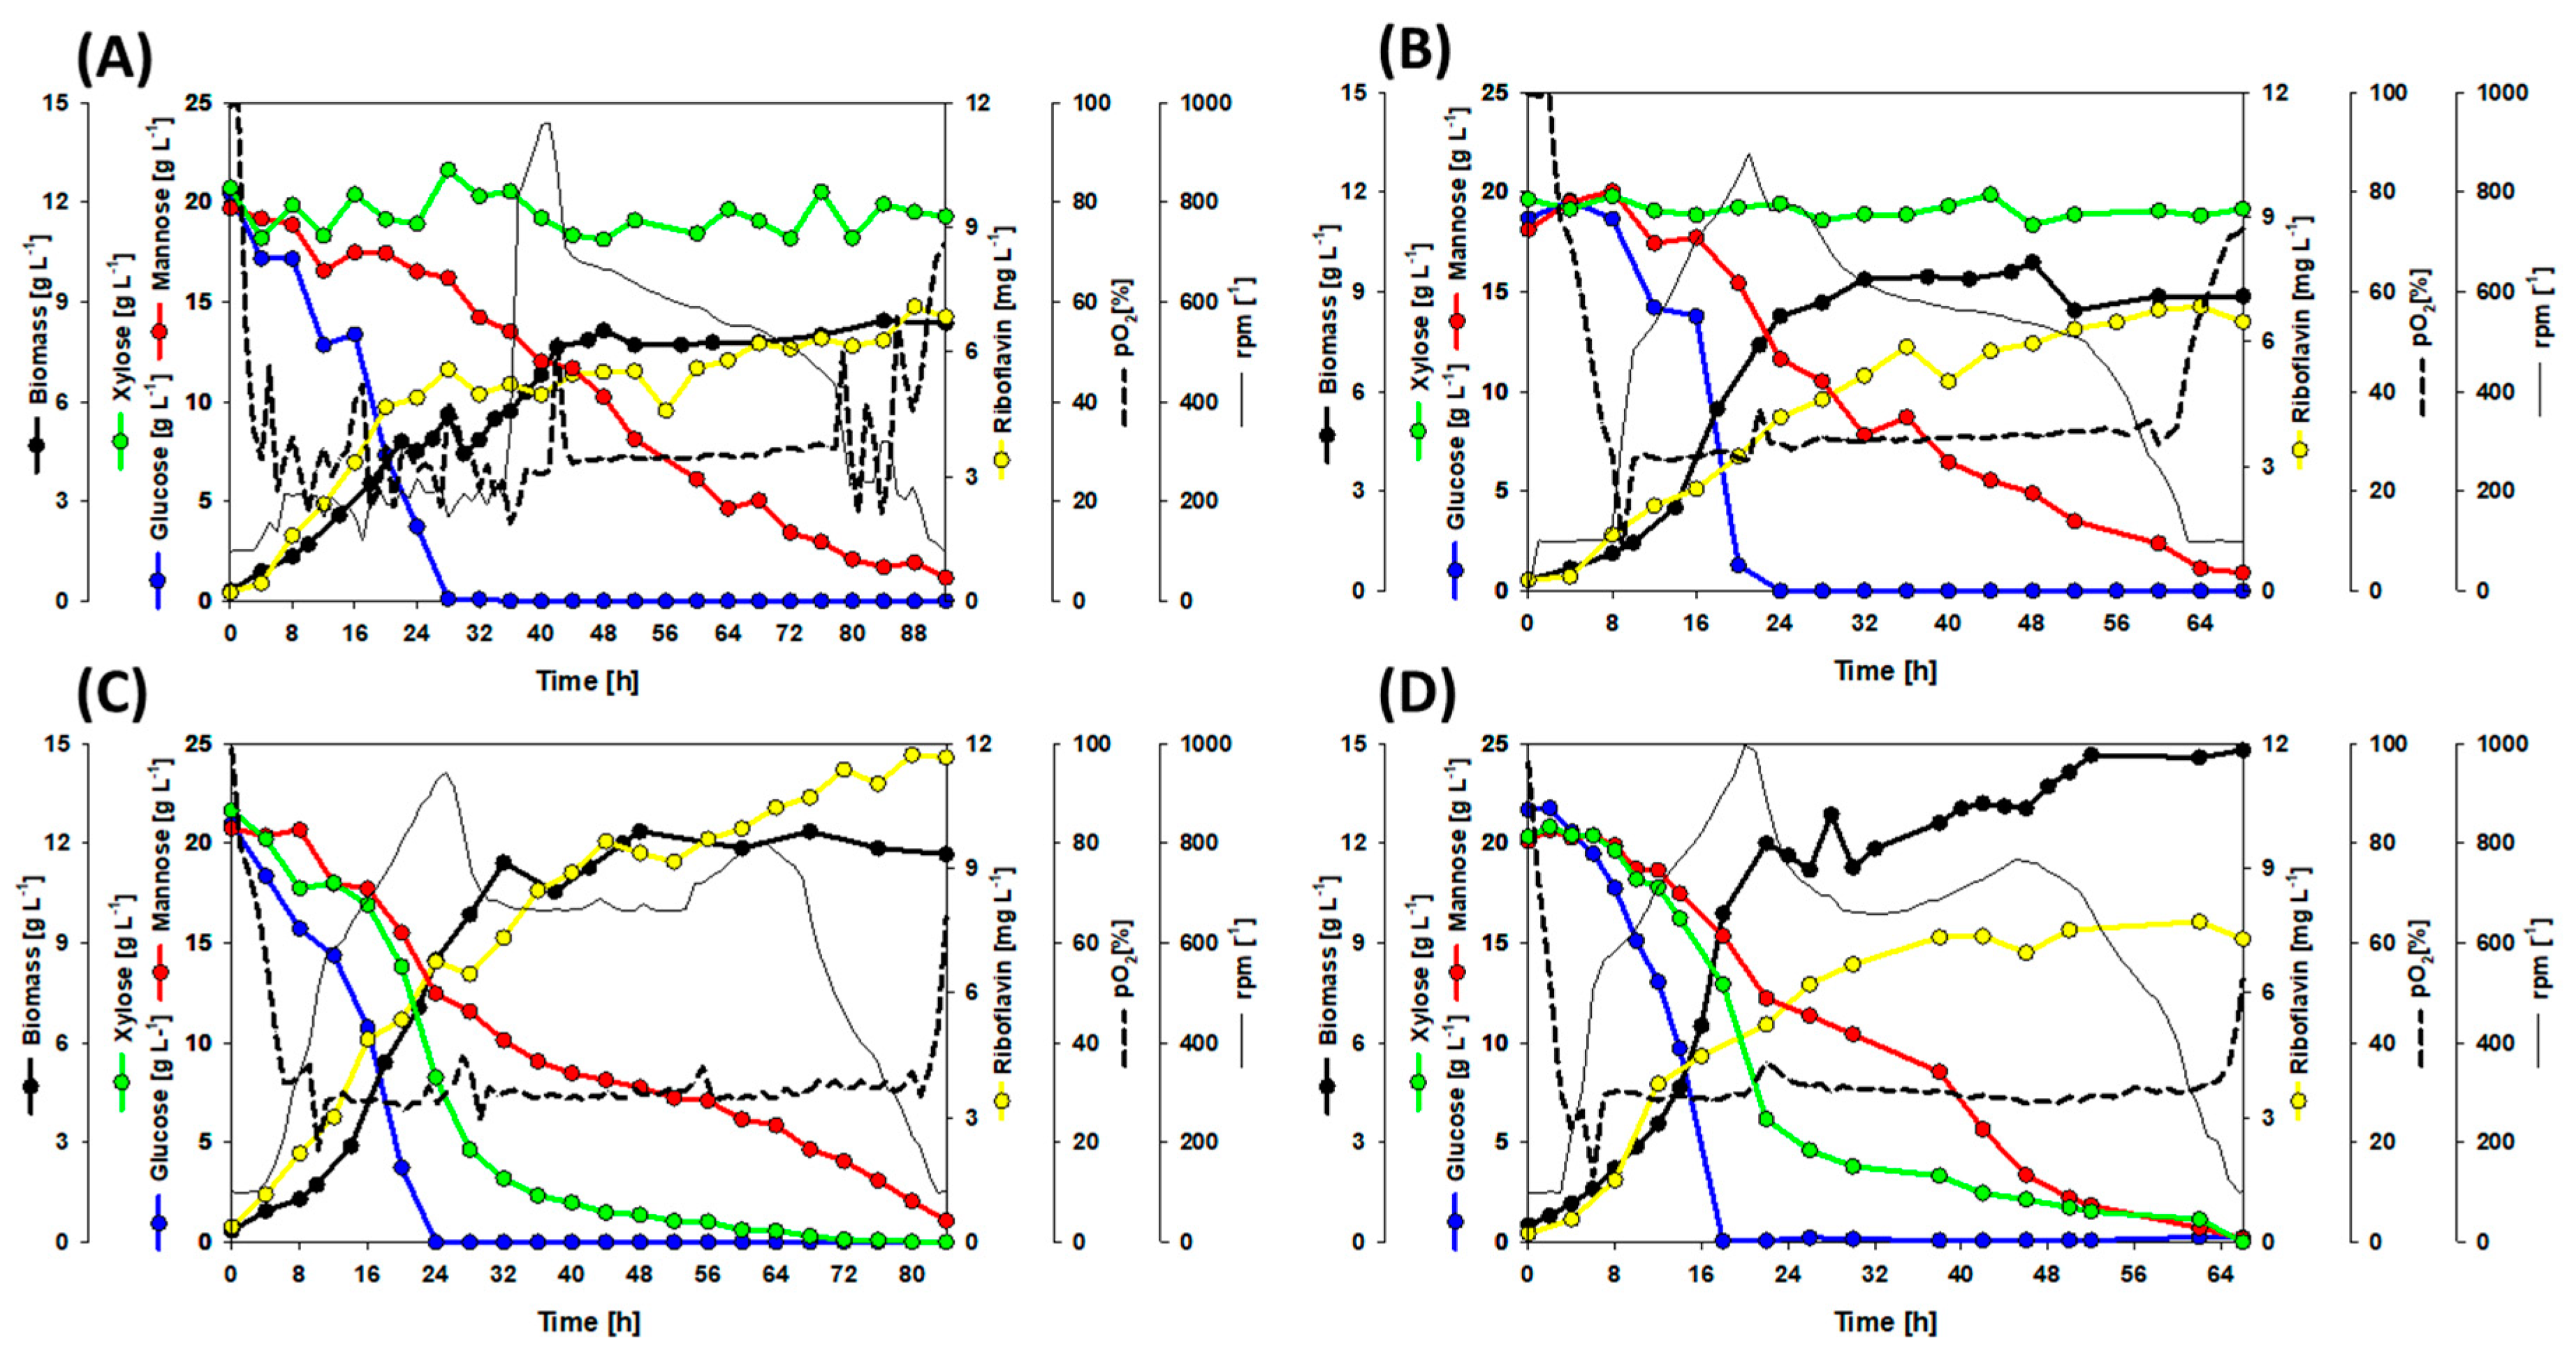
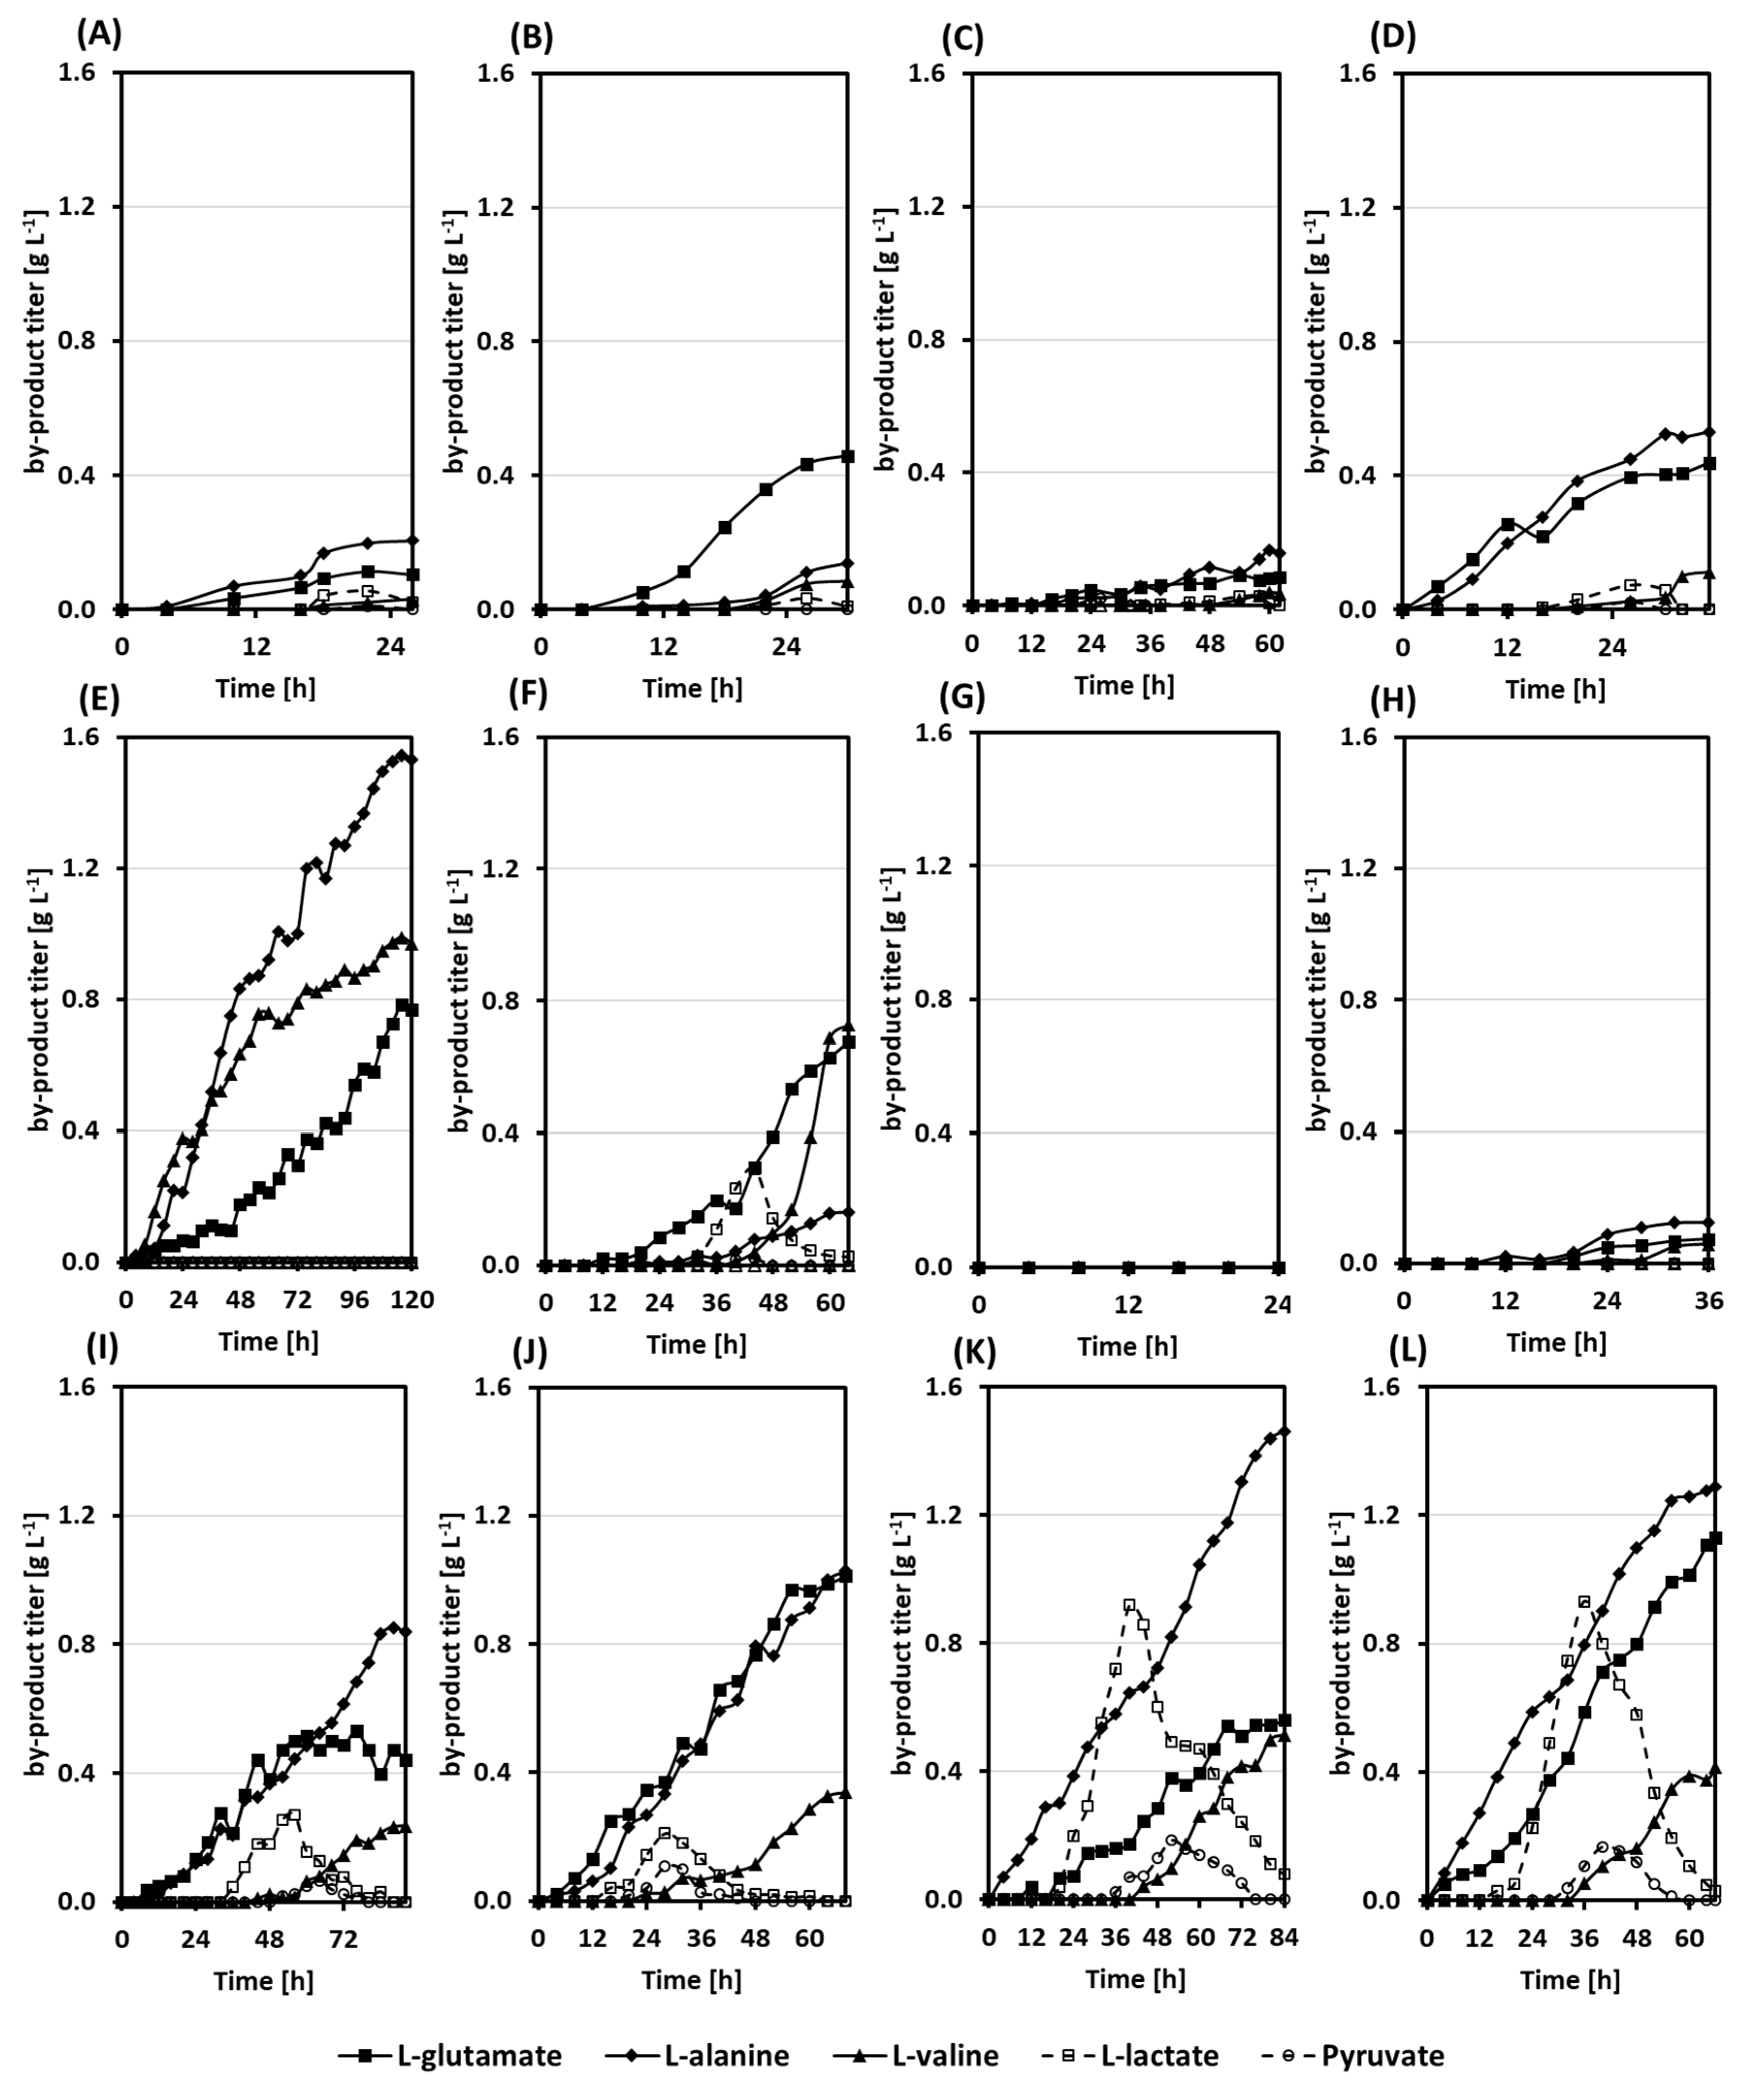
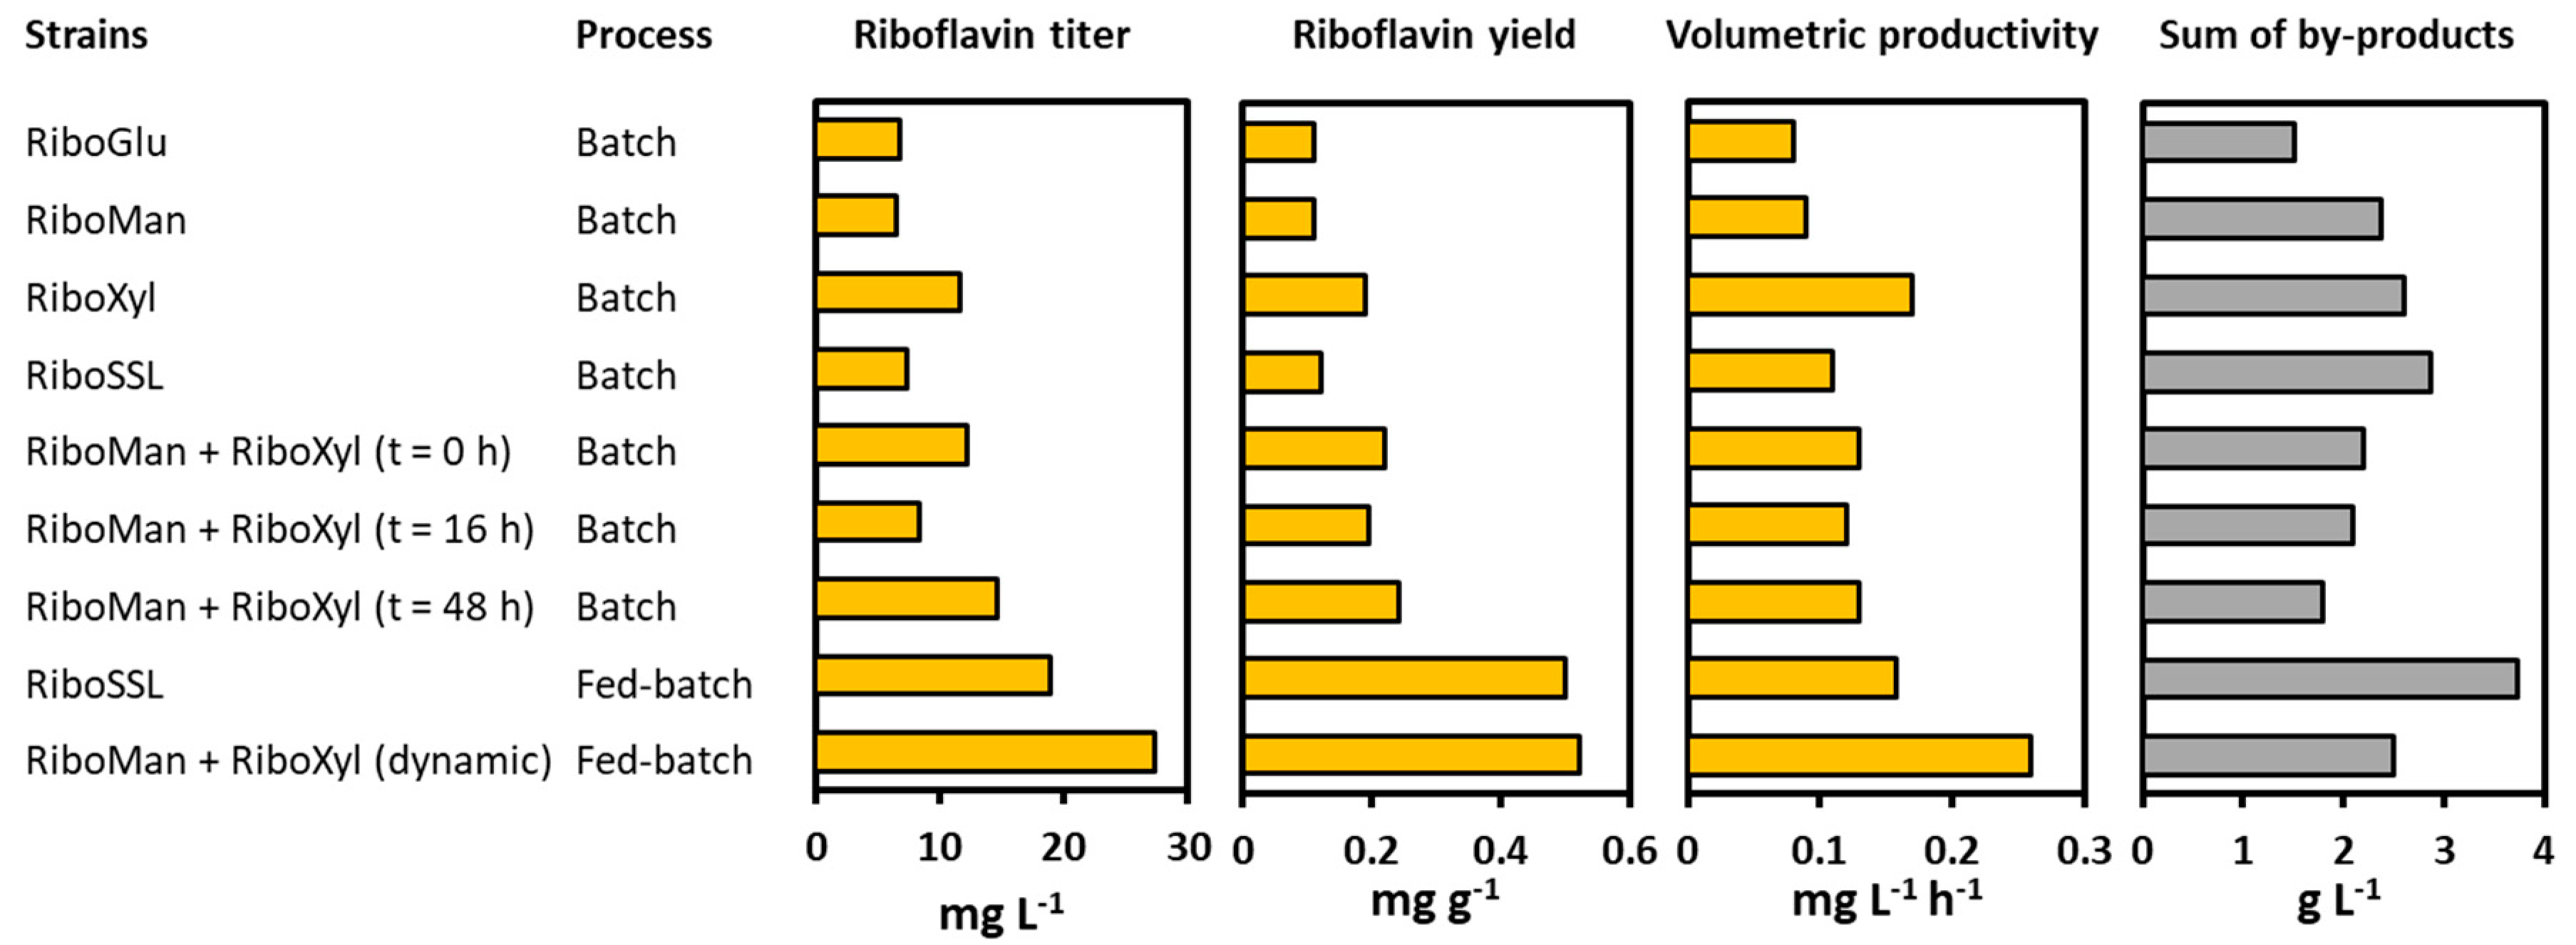
3.3. A Co-Cultivation Strategy of C. glutamicum Strains Improved Fermentation Performance

The strain RiboMan showed better production performance than RiboGlu using glucose as the carbon source. Next, it was shown that the overexpression of manA decreased the duration of the process when using synSSL. Furthermore, the strain RiboSSL achieved lower production values than RiboXyl in the presence of synSSL. Therefore, the strains RiboMan and RiboXyl were selected for co-cultured batch fermentations in bioreactor. 60 g L−1 of SynSSL was used as the carbon source. The strain RiboMan was inoculated to an OD600 of 1 at the beginning of the processes. The strain RiboXyl was inoculated to an OD600 of 1 at three different time points in 3 independent fermentations. These time points were the beginning of the process (t = 0 h), during the exponential phase of RiboMan (t = 16 h), and during the stationary phase of RiboMan (t = 48 h) (Figure 5A,C,E). The sugars’ consumption, growth behavior, riboflavin production, and by-product formation were monitored during the processes.
The utilization of xylose was observed throughout the complete fermentation period when RiboMan and RiboXyl were inoculated at the same time. However, when RiboXyl was inoculated during the exponential phase of a RiboMan culture, the concentration of xylose only decreased from 19.9 g L−1 to 17.1 g L−1 within 8 h, remaining constant afterwards. On the other hand, when RiboXyl was inoculated during the stationary phase of a RiboMan culture, xylose was completely depleted and biphasic growth was observed (Figure 5A,C,E). As in our previous fermentation processes, glucose was depleted first, whereas mannose was the last to be depleted, even during the fermentation co-inoculated at time 0 h. The sum of l-alanine, l-valine, and l-glutamate as main by-products remaining in the supernatants yielded 2.2, 2.1, and 1.8 g L−1 for the processes co-inoculated at 0, 16, and 48 h, respectively (Figure 5A,C,E and Figure 6). When RiboXyl was inoculated after 16 and 48 h the riboflavin yield displayed two different phases (Figure 5D,F). The mean for the riboflavin yields during the phases I was 0.19 ± 0.02 mg g−1. The riboflavin yield after inoculating RiboXyl during the exponential phase of RiboMan was 0.23 mg g−1, a 19% higher yield. The riboflavin yield after inoculating RiboXyl during the stationary phase of RiboMan was 0.39 mg g−1, a 100% higher value. The final product titer of riboflavin was 12.2 mg L−1 in the process inoculated with RiboXyl at time 0 h (Figure 5A), 8.3 mg L−1 when inoculating at 16 h (Figure 5C), and 14.5 mg L−1 when inoculating at 48 h (Figure 5E). This implies that a 20% higher titer (12.2/14.5 mg L−1) is obtained by consuming the same amount of carbon source. As a negative effect, when inoculating RiboXyl after 48 h the fermentation lasted an additional 64 h with a total duration of 112 h, hence, reducing the volumetric productivity. The final values of the volumetric productivities were 0.13, 0.12, and 0.13 mg L−1h−1 for the processes co-inoculated at 0, 16, and 48 h, respectively, therefore no significant differences were observed here (Figure 5). However, the process co-inoculated during the exponential phase of RiboMan left unused 17 g L−1 of xylose (Figure 5C). Hence, the potential of the process can be further exploited by co-inoculating RiboXyl multiple times during the growth phase of RiboMan.

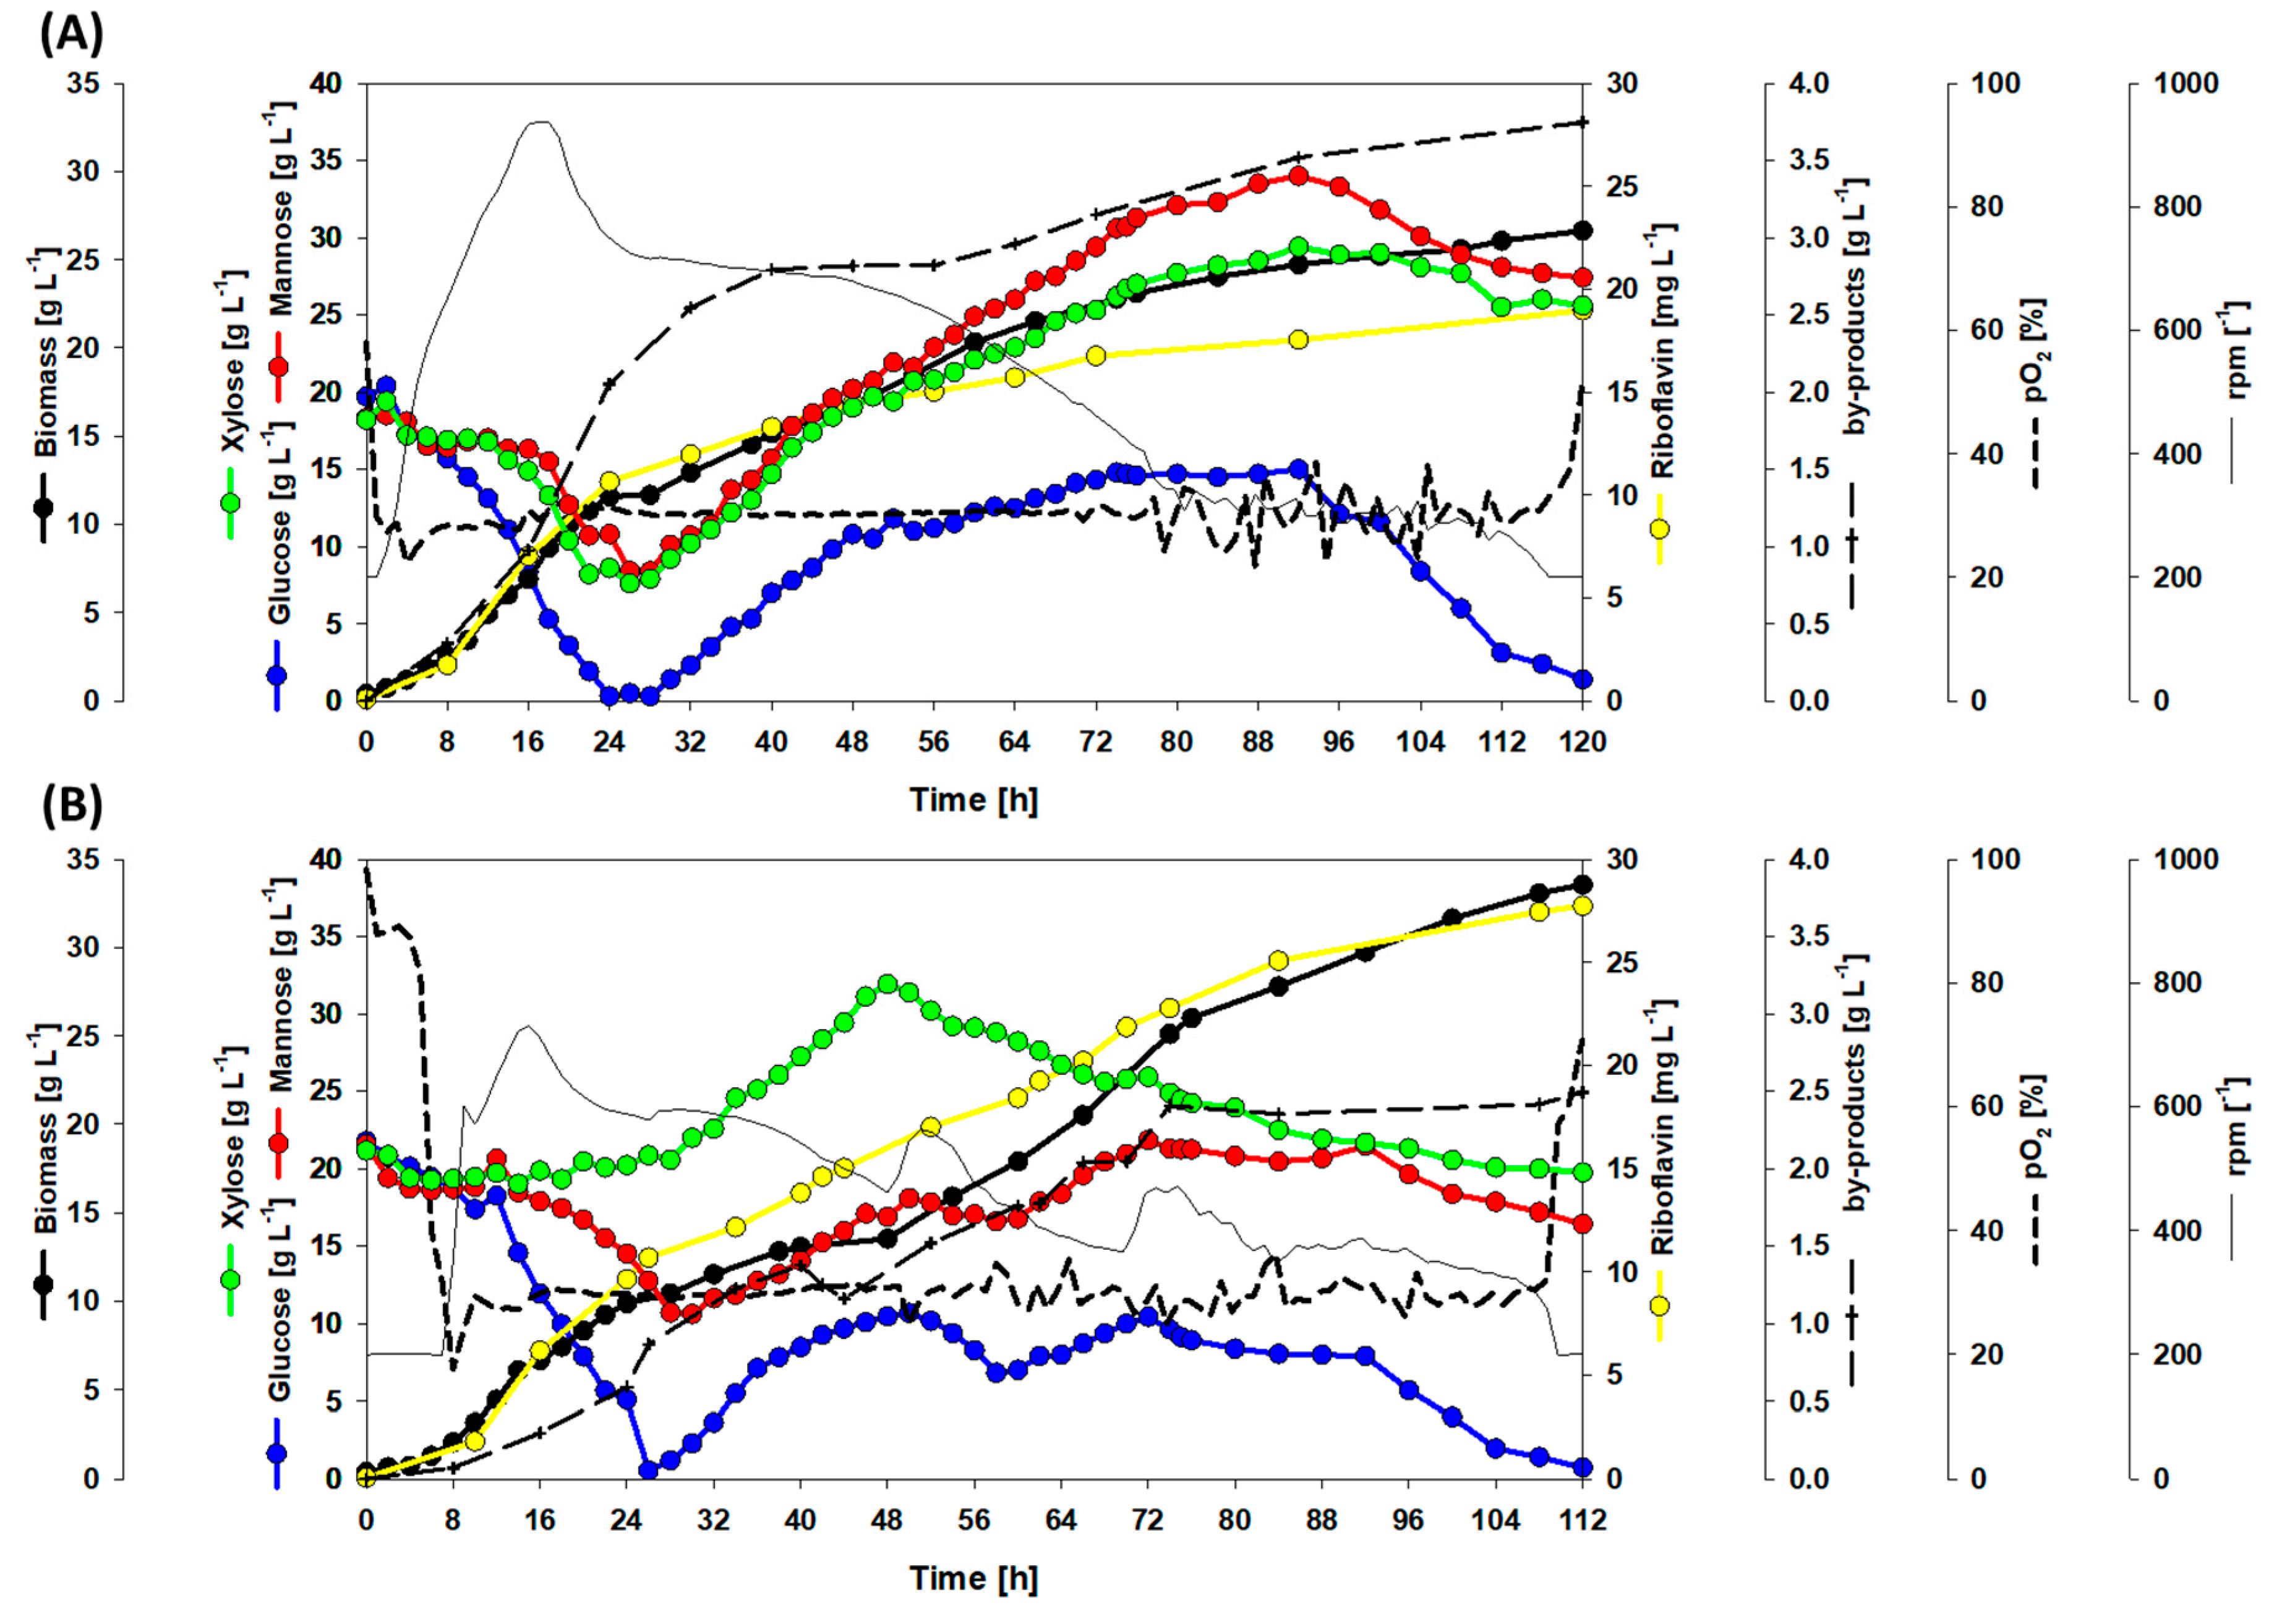
3.4. Dynamic Co-Inoculation Fed-Batch Process Enhanced Productivity

Considering the previously shown data, it was hypothesized that a tight monitoring of the sugar composition and resultant controlled adjustments of the co-culture will increase the efficiency of the process as compared with the non-controlled operation process presented previously. To test that hypothesis, a semi-automatic process was operated, in which measurements of sugars were taken every 2 h in parallel to the process and the co-culture was adjusted based on the sugar composition.
Two independent fed-batch operations were carried out. One process was performed with the strain RiboSSL in monoculture while the other process was performed with the combination of RiboMan and RiboXyl in co-culture. 60 g L−1 SynSSL-based minimal medium was used during the batch phase while 300 g L−1 SynSSL-based minimal medium was used during the feeding phase. RiboMan and RiboSSL strains were inoculated to an OD600 of 1 at the beginning of the processes. RiboXyl was inoculated multiple times, to an OD600 of 1 during the feeding phase of the fermentation harboring RiboMan. The reason for the inoculation of RiboXyl during the feeding phase was to avoid the stationary phase of RiboMan strain. The initial inoculation of RiboXyl was performed after 48 h when biomass formation of RiboMan was observed during the feeding phase. The following inoculations of RiboXyl were performed when a decrease in the xylose consumption rate was observed. Hence, sugar and biomass concentrations needed to be monitored at-line continuously during the process via HPLC and spectrometry, respectively. The feeding profile was manually initiated when glucose was depleted. A linear feeding rate of 0.4 mL min−1 was kept for 65 h.
By the end of the process with strain RiboSSL, the values for riboflavin titer, yield, and volumetric productivity of 19.0 mg L−1, 0.50 mg g−1, and 0.16 mg L−1 h−1, respectively, were reached (Figure 7A). The final titer of the amino acids l-glutamate, l-alanine, and l-valine were 1.5, 1.6, and 0.6 g L−1. Up to 1.2 g L−1 of l-lactate and 0.2 g L−1 of pyruvate were observed, although they were consumed almost entirely through the fermentation (Figure 7A and Figure 8). The total yield of by-products on substrate was 0.10 g g−1. A maximal biomass concentration of 26.6 g L−1 was reached. Although glucose was fully depleted, 27.4 g L−1 of mannose and 25.6 g L−1 of xylose remained in the supernatant. However, the process was already finished since pO2 exceeded 50% (Figure 6A).
The co-cultivation operation with RiboMan and RiboXyl showed improved production values. After the fermentation was concluded, 27.3 mg L−1 of riboflavin were accumulated within 112 h, which is equivalent to a productivity of 0.25 mg L−1 h−1 (Figure 7B). The riboflavin yield of 0.52 mg g−1 was slightly higher during this co-cultivation process as compared to the monoculture. By-product accumulated to 2.5 g L−1 at the end of the fermentation, of which 1.2 g L−1 were l-glutamate, 0.9 g L−1 l-alanine, and 0.4 g L−1 l-valine. Pyruvate was not observed, while l-lactate accumulated to a titer of approx. 0.1 g L−1 before being consumed. The total by-products yield was 0.05 g g−1 (Figure 7B and Figure 8), and the final biomass was 33.6 g L−1. The co-cultivation of RiboMan with RiboXyl was able to consume all glucose, but 16.4 g L−1 of mannose and 19.7 g L−1 of xylose remained in the broth (Figure 7B).
Therefore, the co-cultivation of RiboMan and RiboXyl enhanced titer and productivity by 43% and 56%, respectively, as compared to the monoculture. Moreover, 67% more mannose (11.0 g L−1) and 30% more xylose (5.6 g L−1) were consumed, and the biomass formed increased by 26% compared to the process with RiboSSL, whereas the by-products yield was decreased by 50%. Moreover, the dynamic co-cultivation process achieved the best production values of this work when using synSSL as the carbon source (Figure 9).

4. Discussion

Biotechnological processes related to the production of added value chemicals typically rely on glucose as the carbon source. However, the competing uses of sugars in food and feed industries have boosted the search for alternative substrates. Carbon sources that are the result of industrial processes and are considered waste products within such processes are of special interest. For instance, glycerol is a stoichiometric by-product of the biodiesel process [39,40], which can be used as a source of carbon for microorganisms like E. coli and B. subtilis [41,42]. Another example can be found in the fish industry, where in shrimp production the shells make up 75% of chitin rich waste [43]. Chitin is among the most abundant polysaccharides in nature [44]. It is a polymer of N-acetyl-D-glucosamine, which can be used as a carbon supply, for example, by B. subtilis [45] and engineered C. glutamicum [43]. In the same direction, spent sulfite liquor or SSL is a by-product from the process of manufacturing dissolving lignocellulosic pulp by the acid sulfite method [7]. Fermentable sugars such as glucose, mannose, xylose, arabinose, and galactose can be found in SSL in varying concentrations and proportions [6,7,8]. Classic workhorses in biotechnology like E. coli, B. subtilis, C. glutamicum or baker’s yeast have different native substrate spectra [24], although most of them require metabolic engineering to effectively utilize a multi sugar substrate like SSL. C. glutamicum can utilize glucose and mannose as carbon sources, however, the growth on mannose as sole carbon source is slow [35]. C. glutamicum imports and phosphorylates the hexose mannose via the glucose and fructose-specific phosphotransferase systems [35]. Once inside of the cell, mannose-6-phosphate can be used in the cell wall synthesis pathway or can be isomerized to the intermediate of glycolysis fructose-6-phosphate (F6P) by the phosphomannose isomerase ManA [35]. The manA gene is essential in C. glutamicum for the utilization of mannose, while the disruption of manA does not affect glucose consumption [35]. F6P can be also isomerized to glucose-6-phosphate (G6P) by the glucose-6-phosphate isomerase. Afterwards, G6P can enter the PPP to generate NADPH [46]. Therefore, there is an internal metabolic distribution between energy/biomass production and cell wall synthesis, which may explain the lower growth rates obtained when using mannose as sole carbon source compared to glucose (Figure 1, Table 2). The pentose xylose is a non-native substrate for C. glutamicum. Xylose utilization by C. glutamicum had been established by using the oxidoreductase and Weimberg pathways [23,47]. In this work, the oxidoreductase pathway was used through the heterologous expression of the genes encoding xylose isomerase (xylA) from X. campestris and xylulokinase (xylB) from C. glutamicum [23]. Following this pathway, xylose is converted to xylulose, which is phosphorylated to xylulose-5-phosphate, both being metabolites of the endogenous pentose phosphate pathway (PPP) [32]. The main role of the PPP is to supply anabolic reducing power and precursors for biosynthesis of building blocks [48]. Although the PPP is interconnected with glycolysis, the rates of energy and biomass obtained from the PPP are lower as compared to glycolysis. Such an effect was observed when using xylose as sole carbon sources since growth rates and final biomasses did not reach the values of those from glucose (Figure 1, Table 2). Additionally, using glucose as the carbon source with RiboXyl strain showed low glucose consumption rate (Figure 2C). It seems that the overexpression of xylAB may drag metabolites from the glycolysis. On the other hand, RiboXyl using glucose, mannose and xylose together showed faster glucose consumption (Figure 3C). In this case, glucose and mannose feed the glycolysis while xylose feeds the PPP, avoiding metabolic burden and reaching the riboflavin titer of 11.7 mg L−1, the highest titer up to this point of this work (Figure 3C). Ribulose-5-phosphate is a metabolite of the PPP [49], but also it is the initial precursor for riboflavin biosynthesis [50]. When using the oxidoreductase pathway for xylose consumption, the organism generates xylulose-5-phosphate. Ribulose-5-phosphate and xylulose-5-phosphate are metabolically interconnected by the ribulose-5-phosphate epimerase [49]. Hence, when avoiding metabolic burden, xylose is a promising substrate for riboflavin biosynthesis.
It is plausible that high sugar concentrations exert hyperosmotic stress. C. glutamicum can withstand higher hyperosmotic conditions to a certain extent, however, this requires uptake or biosynthesis of compatible solutes that accumulate intracellularly and compensate for high osmotic pressure due to high e.g., mannose concentrations [51]. In addition, metabolic imbalance, e.g., regarding redox cofactors, at these high substrate concentrations may play a role in C. glutamicum [52]. Notably, these burdens not only decreased growth rates, but negatively affect biomass and product yields (Figure 1) because part of the substrate must be catabolized to either produce compatible solutes, to maintain redox cofactor homeostasis or provide energy equivalents for transport processes such as the concentrative uptake of compatible solutes.
A direct effect of overfeeding C. glutamicum is the situation of overflow metabolism. Such an effect is also observed in E. coli for the production of acetate [53] or for the production of ethanol under aerobic and glucose excess conditions with yeast [54]. Common overflow metabolites observed in C. glutamicum under different conditions are l-lactate, l-alanine, l-valine, pyruvate, dihydroxyacetone, and glycerol [36,37,38,55,56]. Most of these metabolites were observed in this work during the bioreactor fermentations, especially when using synSSL as the carbon source (Figure 4, Figure 6 and Figure 8). For instance, the presence of l-lactate in the broth under aerobic conditions indicated that the capacities of the central carbon metabolism of C. glutamicum have been exceeded. It had been shown previously that an enhancement of the glucose uptake rate increased the formation of l-lactate [38]. l-Lactate is typically formed during the late exponential phase of C. glutamicum [57,58]. In addition, the presence of pyruvate in the supernatants was observed in parallel with the highest formations of l-lactate (Figure 4I–L). C. glutamicum can consume l-lactate [55,59], which can trigger the overflow of pyruvate [55]. Other pyruvate-derived compounds like l-alanine and l-valine were observed, for which their accumulation can increase with an increase in carbon flux into glycolysis [60]. The amino acid l-alanine is a common by-product within C. glutamicum processes [37,61,62,63]. Here, the production of l-alanine was significant when using synSSL as the carbon source (Figure 4I–L). When production of l-valine occurred, it did when the biomass formation slowed down and when using synSSL as the carbon source (Figure 4I–L). Growth-decoupled l-valine production was reported before [64,65]. Another metabolite quantified in the supernatants was the TCA-derived amino acid l-glutamate. C. glutamicum is a natural producer of l-glutamate and it can be found as a by-product [61,66,67]. When feeding RiboGlu with mannose the biomass reached was the lowest (2.6 g L−1), instead a significant distribution of carbon towards by-products (l-alanine, l-valine, and l-glutamate) was observed (Figure 4E).
The highest riboflavin volumetric productivity observed in this work was 0.25 mg L−1 h−1, which was achieved during fed-batch fermentation inoculated dynamically (Figure 7B). C. glutamicum co-cultures have been established previously. Synthetic microbial commensal consortia E. coli/C. glutamicum have been designed to produce industrially relevant chemicals from starch [68]. The l-lysine auxotrophic E. coli strain EcLYS1 (pVWEx1-gfpUV) (pAmy) degraded starch releasing glucose. In co-culture, this glucose was used by different C. glutamicum strains able to produce l-lysine and l-lysine-derived compounds [68]. C. glutamicum/C. glutamicum consortia have been tested at microscale using single sugars [26]. In such study, the l-lysine auxotrophic strain C. glutamicumΔlysA was co-cultivated with the l-lysine-producing strain C. glutamicum DM1800 while having spatial separation of the bacterial strains. In these examples, strains contained modifications to ensure interdependence, which limited product yields [68]. However, such synthetic interdependency forces the strains to co-exist in the same culture, but it has not been elaborated how a specific ratio can be adjusted during the process. The riboflavin producers of this work can grow independently since all of them can get access to, at least, two of the sugars tested. When cultivating RiboXyl together with RiboMan the effect of RiboXyl differed with the inoculation time point. The consumption of xylose was observed during the complete process when RiboXyl was inoculated at the same time as RiboMan (Figure 5A). Here, RiboXyl grew faster than RiboMan since it can consume all sugars, hence, RiboXyl surpassed RiboMan which died or was outcompeted by the other strain in the process. When RiboXyl was inoculated during the exponential phase of RiboMan, the consumption of xylose was temporal. In this case, RiboXyl was able to endure the culture for a few hours, but at some point, the fast growth and metabolism of RiboMan avoided the full development of RiboXyl in the culture (Figure 5C). Finally, during the stationary phase of RiboMan the strain RiboXyl took over the culture since the most abundant sugar was xylose and RiboMan was, metabolically talking, less active than during the exponential phase (Figure 5E). Taking advantage of these facts, we developed a fed-batch strategy with dynamic inoculations. The feed guaranteed to keep RiboMan metabolism active. Parallel inoculation of xylose guaranteed better production of riboflavin and more efficient use of the sugars (Figure 7B). However, by the end of the fed-batch processes the sugars xylose and mannose were not fully depleted. We can only assume that either the cells were metabolically exhausted due to the long fermentation process and/or that the medium used is not optimal for the tested conditions and, therefore, some essential nutrients could have been consumed.
In this work, riboflavin production was achieved by overexpression of the sigma factor H gene (sigH) from C. glutamicum. A differential gene expression analysis revealed that the overexpression of sigH upregulates the riboflavin biosynthesis genes ribH, ribA, and ribC and the PPP genes zwf and opcA [27]. Modern commercial production of riboflavin is based on microbial fermentation. Classically, the organisms E. coli, B. subtilis, and Ashbya gossypii are used as platforms for production of riboflavin [17]. Common strategies applied to increase riboflavin productivity include the overexpression of the riboflavin synthesis pathway [16,69,70] and/or optimization of the central carbon metabolism, specially increasing the flux towards the PPP [70,71]. The highest riboflavin titer of 27.3 mg L−1 achieved in this work (Figure 7B) is 4-fold higher than the previous reported titer of 7 mg L−1 achieved by C. glutamicum strains using glucose as sole carbon source [27]. As comparison, expression of site-directed mutated zwf and gnd genes from the PPP of C. glutamicum in B. subtilis led to 15.7 g L−1 of riboflavin [71]. In E. coli, the overexpression of the endogenous ribABDEC operon yielded 0.2 g L−1 of riboflavin while further modifications in the central metabolism improved production by 2.5-folds [70]. Likewise, the filamentous fungus A. gossypii has been widely engineered targeting, among others, the riboflavin, purine and glycine synthesis pathways [17]. A. gossypii industrial riboflavin producers can accumulate more than 15 g L−1 of riboflavin [17]. The titer obtained in this work is comparable with the one reached with a modified Lactococcus lactis strain [72], but still cannot compete against the most advanced riboflavin producers. Nevertheless, the knowledge and tools are available for further strain development in this regard.

5. Conclusions

To conclude, we have shown the production of riboflavin from the native carbon sources glucose and mannose, from the non-native carbon source xylose, as well as from the mixture of all these sugars by C. glutamicum. The production of riboflavin from these sugars by C. glutamicum was achieved for the first time in bioreactor cultivations. We have proven and applied a new concept of dynamic co-cultivation for an efficient multi substrate consumption process. Cell-factories could be further genetically improved, for instance, to exclusively consume one sugar per strain, reducing the competence between strains. This technology could be further applied with real SSL to exploit a residual sugar stream while creating new value chains. In the future, we plan to address sugar consumption in the presence of growth inhibitors that can be considered the most important difference between SSL and synSSL. Inhibitors in SSL are, for example, acetic acid, furfural, and 5-hydroxymethylfurfural [7]. Naturally, C. glutamicum can utilize acetic acid for growth and production [73]. Under oxygen-deprivation conditions, C. glutamicum has a better recalcitrance towards furfural and 5-hydroxymethylfurfural than E. coli and S. cerevisiae [74], but aerobic growth, as studied here, is negatively affected. These limitations can be overcome in upcoming projects via adaptive laboratory evolution as shown in C. glutamicum for methanol or indole [49,75] or by genetic engineering as shown for by furfural detoxification by protein FudC [76]. We believe this work is important for application of real SSL, but not within the scope of the study presented here.

Author Contributions

Conceptualization, F.P.-G. and N.B.; Investigation, F.P.-G., A.B. and D.R.K.; Methodology, F.P.-G.; Project administration, F.P.-G., V.F.W. and N.B.; Supervision, F.P.-G. and N.B.; Writing—original draft, F.P.-G., A.B., V.F.W. and N.B.; Writing—review & editing, F.P.-G., V.F.W. and N.B. All authors have read and agreed to the published version of the manuscript.

Funding

F.P.-G. was funded by the project iFermenter (H2020-EU.3.2.6.1; Grant agreement ID: 790507).

Informed Consent Statement

Not applicable

Data Availability Statement

The data presented in this study are available in Dynamic Co-Cultivation Process of Corynebacterium glutamicum Strains for the Fermentative Production of Riboflavin

Acknowledgments

We thank the Christopher Sørmo for the kind assistance with the laboratory activities. The authors Fernando Pérez-García and Dina R. Kallman wish to thank the Haakon Eng Holck for the fruitful discussions and support.

Conflicts of Interest

The authors declare no conflict of interest.

References

  1. Fahmy, Y.; Fahmy, T.Y.A.; Mobarak, F.; El-Sakhawy, M.; Fadl, M. Agricultural Residues (Wastes) for Manufacture of Paper, Board, and Miscellaneous Products: Background Overview and Future Prospects; Social Science Research Network: Rochester, NY, USA, 2017. [Google Scholar]
  2. Bajpai, P. Brief description of the pulp and papermaking process. In Biotechnology for Pulp and Paper Processing; Bajpai, P., Ed.; Springer: Singapore, 2018; pp. 9–26. ISBN 978-981-10-7853-8. [Google Scholar]
  3. Jiménez, L.; Pérez, I.; García, J.C.; Rodríguez, A.; Ferrer, J.L. Influence of ethanol pulping of wheat straw on the resulting paper sheets. Process Biochem. 2002, 37, 665–672. [Google Scholar] [CrossRef]
  4. Rodríguez, A.; Espinosa, E.; Domínguez-Robles, J.; Sánchez, R.; Bascón, I.; Rosal, A. Different solvents for organosolv pulping. In Pulp and Paper Processing; Books on Demand: Norderstedt, Germany, 2018. [Google Scholar] [CrossRef] [Green Version]
  5. Aro, T.; Fatehi, P. Production and application of lignosulfonates and sulfonated lignin. ChemSusChem 2017, 10, 1861–1877. [Google Scholar] [CrossRef] [PubMed]
  6. Petersen, A.M.; Haigh, K.; Görgens, J.F. Techno-economics of integrating bioethanol production from spent sulfite liquor for reduction of greenhouse gas emissions from sulfite pulping mills. Biotechnol. Biofuels 2014, 7, 169. [Google Scholar] [CrossRef] [PubMed] [Green Version]
  7. Rueda, C.; Calvo, P.A.; Moncalián, G.; Ruiz, G.; Coz, A. Biorefinery options to valorize the spent liquor from sulfite pulping. J. Chem. Technol. Biotechnol. 2015, 90, 2218–2226. [Google Scholar] [CrossRef]
  8. Rødsrud, G.; Lersch, M.; Sjöde, A. History and future of world’s most advanced biorefinery in operation. Biomass Bioenergy 2012, 46, 46–59. [Google Scholar] [CrossRef]
  9. Humpert, D.; Ebrahimi, M.; Czermak, P. Membrane technology for the recovery of lignin: A review. Membranes 2016, 6, 42. [Google Scholar] [CrossRef]
  10. Lawford, H.G.; Rousseau, J.D. Production of ethanol from pulp mill hardwood and softwood spent sulfite liquors by genetically engineered E. coli. Appl. Biochem. Biotechnol. 1993, 39–40, 667–685. [Google Scholar] [CrossRef]
  11. Novy, V.; Krahulec, S.; Longus, K.; Klimacek, M.; Nidetzky, B. Co-fermentation of hexose and pentose sugars in a spent sulfite liquor matrix with genetically modified Saccharomyces cerevisiae. Bioresour. Technol. 2013, 130, 439–448. [Google Scholar] [CrossRef]
  12. Alexandri, M.; Venus, J. Feedstock flexibility in sustainable chemistry: Bridging sectors still not sufficiently familiar with each other—Sshowcases of ongoing and emerging initiatives. Curr. Opin. Green Sustain. Chem. 2017, 8, 24–29. [Google Scholar] [CrossRef]
  13. Bates, C.J. Riboflavin. In Encyclopedia of Human Nutrition, 3rd ed.; Caballero, B., Ed.; Academic Press: Waltham, MA, USA, 2013; pp. 158–165. ISBN 978-0-12-384885-7. [Google Scholar]
  14. Pinto, J.T.; Zempleni, J. Riboflavin. Adv. Nutr. 2016, 7, 973–975. [Google Scholar] [CrossRef] [Green Version]
  15. Revuelta, J.L.; Ledesma-Amaro, R.; Lozano-Martinez, P.; Díaz-Fernández, D.; Buey, R.M.; Jiménez, A. Bioproduction of riboflavin: A bright yellow history. J. Ind. Microbiol. Biotechnol. 2017, 44, 659–665. [Google Scholar] [CrossRef]
  16. Ledesma-Amaro, R.; Serrano-Amatriain, C.; Jiménez, A.; Revuelta, J.L. Metabolic engineering of riboflavin production in Ashbya gossypii through pathway optimization. Microb. Cell Factories 2015, 14, 163. [Google Scholar] [CrossRef] [PubMed] [Green Version]
  17. Liu, S.; Hu, W.; Wang, Z.; Chen, T. Production of riboflavin and related cofactors by biotechnological processes. Microb. Cell Factories 2020, 19, 31. [Google Scholar] [CrossRef] [PubMed]
  18. Wendisch, V.F. Microbial production of amino acid-related compounds. Adv. Biochem. Eng. Biotechnol. 2017, 159, 255–269. [Google Scholar] [CrossRef] [PubMed]
  19. Becker, J.; Rohles, C.M.; Wittmann, C. Metabolically engineered Corynebacterium glutamicum for bio-based production of chemicals, fuels, materials, and healthcare products. Metab. Eng. 2018, 50, 122–141. [Google Scholar] [CrossRef]
  20. Wendisch, V.F. Metabolic engineering advances and prospects for amino acid production. Metab. Eng. 2020, 58, 17–34. [Google Scholar] [CrossRef]
  21. Kogure, T.; Inui, M. Recent advances in metabolic engineering of Corynebacterium glutamicum for bioproduction of value-added aromatic chemicals and natural products. Appl. Microbiol. Biotechnol. 2018, 102, 8685–8705. [Google Scholar] [CrossRef]
  22. Pérez-García, F.; Wendisch, V.F. Transport and metabolic engineering of the cell factory Corynebacterium glutamicum. FEMS Microbiol. Lett. 2018, 365, fny166. [Google Scholar] [CrossRef] [Green Version]
  23. Meiswinkel, T.M.; Gopinath, V.; Lindner, S.N.; Nampoothiri, K.M.; Wendisch, V.F. Accelerated pentose utilization by Corynebacterium glutamicum for accelerated production of lysine, glutamate, ornithine and putrescine. Microb. Biotechnol. 2013, 6, 131–140. [Google Scholar] [CrossRef]
  24. Wendisch, V.F.; Brito, L.F.; Gil Lopez, M.; Hennig, G.; Pfeifenschneider, J.; Sgobba, E.; Veldmann, K.H. The flexible feedstock concept in industrial biotechnology: Metabolic engineering of Escherichia coli, Corynebacterium glutamicum, Pseudomonas, Bacillus and yeast strains for access to alternative carbon sources. J. Biotechnol. 2016, 234, 139–157. [Google Scholar] [CrossRef]
  25. Sgobba, E.; Wendisch, V.F. Synthetic microbial consortia for small molecule production. Curr. Opin. Biotechnol. 2019, 62, 72–79. [Google Scholar] [CrossRef]
  26. Burmeister, A.; Hilgers, F.; Langner, A.; Westerwalbesloh, C.; Kerkhoff, Y.; Tenhaef, N.; Drepper, T.; Kohlheyer, D.; von Lieres, E.; Noack, S.; et al. A microfluidic co-cultivation platform to investigate microbial interactions at defined microenvironments. Lab Chip 2018, 19, 98–110. [Google Scholar] [CrossRef] [PubMed]
  27. Taniguchi, H.; Wendisch, V.F. Exploring the role of sigma factor gene expression on production by Corynebacterium glutamicum: Sigma factor H and FMN as example. Front. Microbiol. 2015, 6, 740. [Google Scholar] [CrossRef] [PubMed] [Green Version]
  28. Chin, Y.-W.; Park, J.-B.; Park, Y.-C.; Kim, K.H.; Seo, J.-H. Metabolic engineering of Corynebacterium glutamicum to produce GDP-L-fucose from glucose and mannose. Bioprocess Biosyst. Eng. 2013, 36, 749–756. [Google Scholar] [CrossRef] [PubMed]
  29. Abe, S.; Takayama, K.-I.; Kinoshita, S. Taxonomical studies on glutamic acid-producing bacteria. J. Gen. Appl. Microbiol. 1967, 13, 279–301. [Google Scholar] [CrossRef]
  30. Henke, N.A.; Heider, S.A.E.; Peters-Wendisch, P.; Wendisch, V.F. Production of the marine carotenoid astaxanthin by metabolically engineered Corynebacterium glutamicum. Mar. Drugs 2016, 14, 124. [Google Scholar] [CrossRef]
  31. Stansen, C.; Uy, D.; Delaunay, S.; Eggeling, L.; Goergen, J.-L.; Wendisch, V.F. Characterization of a Corynebacterium glutamicum lactate utilization operon induced during temperature-triggered glutamate production. Appl. Environ. Microbiol. 2005, 71, 5920–5928. [Google Scholar] [CrossRef] [Green Version]
  32. Eggeling, L.; Bott, M.; Bott, M. Handbook of Corynebacterium Glutamicum; CRC Press: Boca Raton, FL, USA, 2005; ISBN 978-0-429-12905-6. [Google Scholar]
  33. Green, M.R.; Sambrook, J. Molecular Cloning: A Laboratory Manual; Cold Spring Harbor Laboratory Press: Cold Spring Harbor, NY, USA, 2012; ISBN 978-1-936113-41-5. [Google Scholar]
  34. Gibson, D.G.; Young, L.; Chuang, R.-Y.; Venter, J.C.; Hutchison, C.A.; Smith, H.O. Enzymatic assembly of DNA molecules up to several hundred kilobases. Nat. Methods 2009, 6, 343–345. [Google Scholar] [CrossRef]
  35. Sasaki, M.; Teramoto, H.; Inui, M.; Yukawa, H. Identification of mannose uptake and catabolism genes in Corynebacterium glutamicum and genetic engineering for simultaneous utilization of mannose and glucose. Appl. Microbiol. Biotechnol. 2011, 89, 1905–1916. [Google Scholar] [CrossRef]
  36. Kiefer, P.; Heinzle, E.; Zelder, O.; Wittmann, C. Comparative metabolic flux analysis of lysine-producing Corynebacterium glutamicum cultured on glucose or fructose. Appl. Environ. Microbiol. 2004, 70, 229–239. [Google Scholar] [CrossRef] [Green Version]
  37. Paczia, N.; Nilgen, A.; Lehmann, T.; Gätgens, J.; Wiechert, W.; Noack, S. Extensive exometabolome analysis reveals extended overflow metabolism in various microorganisms. Microb. Cell Factories 2012, 11, 122. [Google Scholar] [CrossRef] [PubMed] [Green Version]
  38. Pérez-García, F.; Peters-Wendisch, P.; Wendisch, V.F. Engineering Corynebacterium glutamicum for fast production of L-lysine and L-pipecolic acid. Appl. Microbiol. Biotechnol. 2016, 100, 8075–8090. [Google Scholar] [CrossRef] [PubMed]
  39. Wendisch, V.F.; Lindner, S.N.; Meiswinkel, T.M. Use of glycerol in biotechnological applications. Biodiesel—Quality, Emissions and By-Products; InTechOpen: London, UK, 2011. [Google Scholar] [CrossRef] [Green Version]
  40. Khanna, S.; Goyal, A.; Moholkar, V.S. Microbial conversion of glycerol: Present status and future prospects. Crit. Rev. Biotechnol. 2012, 32, 235–262. [Google Scholar] [CrossRef] [PubMed]
  41. Holmberg, C.; Beijer, L.; Rutberg, B.; Rutberg, L. Glycerol catabolism in Bacillus subtilis: Nucleotide sequence of the genes encoding glycerol kinase (glpK) and glycerol-3-phosphate dehydrogenase (glpD). J. Gen. Microbiol. 1990, 136, 2367–2375. [Google Scholar] [CrossRef] [PubMed] [Green Version]
  42. Chen, L.; Ren, S.; Ye, X.P. Lactic acid production from glycerol using CaO as solid base catalyst. Fuel Process. Technol. 2014, 120, 40–47. [Google Scholar] [CrossRef]
  43. Matano, C.; Uhde, A.; Youn, J.-W.; Maeda, T.; Clermont, L.; Marin, K.; Krämer, R.; Wendisch, V.F.; Seibold, G.M. Engineering of Corynebacterium glutamicum for growth and L-lysine and lycopene production from N-acetyl-glucosamine. Appl. Microbiol. Biotechnol. 2014, 98, 5633–5643. [Google Scholar] [CrossRef] [PubMed]
  44. Chen, J.-K.; Shen, C.-R.; Liu, C.-L. N-acetylglucosamine: Production and applications. Mar. Drugs 2010, 8, 2493–2516. [Google Scholar] [CrossRef] [Green Version]
  45. Bertram, R.; Rigali, S.; Wood, N.; Lulko, A.T.; Kuipers, O.P.; Titgemeyer, F. Regulon of the N-acetylglucosamine utilization regulator NagR in Bacillus subtilis. J. Bacteriol. 2011, 193, 3525–3536. [Google Scholar] [CrossRef] [Green Version]
  46. Marx, A.; Hans, S.; Möckel, B.; Bathe, B.; de Graaf, A.A.; McCormack, A.C.; Stapleton, C.; Burke, K.; O’Donohue, M.; Dunican, L.K. Metabolic phenotype of phosphoglucose isomerase mutants of Corynebacterium glutamicum. J. Biotechnol. 2003, 104, 185–197. [Google Scholar] [CrossRef]
  47. Brüsseler, C.; Späth, A.; Sokolowsky, S.; Marienhagen, J. Alone at last!—Heterologous expression of a single gene is sufficient for establishing the five-step Weimberg pathway in Corynebacterium glutamicum. Metab. Eng. Commun. 2019, 9, e00090. [Google Scholar] [CrossRef]
  48. Kamada, N.; Yasuhara, A.; Ikeda, M. Significance of the non-oxidative route of the pentose phosphate pathway for supplying carbon to the purine-nucleotide pathway in Corynebacterium ammoniagenes. J. Ind. Microbiol. Biotechnol. 2003, 30, 129–132. [Google Scholar] [CrossRef] [PubMed]
  49. Hennig, G.; Haupka, C.; Brito, L.F.; Rückert, C.; Cahoreau, E.; Heux, S.; Wendisch, V.F. Methanol-essential growth of Corynebacterium glutamicum: Adaptive laboratory evolution overcomes limitation due to methanethiol assimilation pathway. Int. J. Mol. Sci. 2020, 21, 3617. [Google Scholar] [CrossRef]
  50. Kundu, B.; Sarkar, D.; Ray, N.; Talukdar, A. Understanding the riboflavin biosynthesis pathway for the development of antimicrobial agents. Med. Res. Rev. 2019, 39, 1338–1371. [Google Scholar] [CrossRef] [PubMed]
  51. Pérez-García, F.; Brito, L.F.; Wendisch, V.F. Function of L-pipecolic acid as compatible solute in Corynebacterium glutamicum as basis for its production under hyperosmolar conditions. Front. Microbiol. 2019, 10, 340. [Google Scholar] [CrossRef] [PubMed]
  52. Xu, J.-Z.; Ruan, H.-Z.; Chen, X.-L.; Zhang, F.; Zhang, W. Equilibrium of the intracellular redox state for improving cell growth and L-lysine yield of Corynebacterium glutamicum by optimal cofactor swapping. Microb. Cell Factories 2019, 18, 65. [Google Scholar] [CrossRef] [Green Version]
  53. Valgepea, K.; Adamberg, K.; Nahku, R.; Lahtvee, P.-J.; Arike, L.; Vilu, R. Systems biology approach reveals that overflow metabolism of acetate in Escherichia coli is triggered by carbon catabolite repression of acetyl-CoA synthetase. BMC Syst. Biol. 2010, 4, 166. [Google Scholar] [CrossRef] [Green Version]
  54. Pronk, J.T.; Yde Steensma, H.; van Dijken, J.P. Pyruvate metabolism in Saccharomyces cerevisiae. Yeast 1996, 12, 1607–1633. [Google Scholar] [CrossRef]
  55. Cocaign-Bousquet, M.; Lindley, N.D. Pyruvate overflow and carbon flux within the central metabolic pathways of Corynebacterium glutamicum during growth on lactate. Enzyme Microb. Technol. 1995, 17, 260–267. [Google Scholar] [CrossRef]
  56. Wieschalka, S.; Blombach, B.; Eikmanns, B.J. Engineering Corynebacterium glutamicum for the production of pyruvate. Appl. Microbiol. Biotechnol. 2012, 94, 449–459. [Google Scholar] [CrossRef]
  57. Khuat, H.B.T.; Kaboré, A.K.; Olmos, E.; Fick, M.; Boudrant, J.; Goergen, J.-L.; Delaunay, S.; Guedon, E. Lactate production as representative of the fermentation potential of Corynebacterium glutamicum 2262 in a one-step process. Biosci. Biotechnol. Biochem. 2014, 78, 343–349. [Google Scholar] [CrossRef] [Green Version]
  58. Veldmann, K.H.; Dachwitz, S.; Risse, J.M.; Lee, J.-H.; Sewald, N.; Wendisch, V.F. Bromination of L-tryptophan in a fermentative process with Corynebacterium glutamicum. Front. Bioeng. Biotechnol. 2019, 7. [Google Scholar] [CrossRef] [PubMed]
  59. Georgi, T.; Rittmann, D.; Wendisch, V.F. Lysine and glutamate production by Corynebacterium glutamicum on glucose, fructose and sucrose: Roles of malic enzyme and fructose-1,6-bisphosphatase. Metab. Eng. 2005, 7, 291–301. [Google Scholar] [CrossRef] [PubMed]
  60. Murai, K.; Sasaki, D.; Kobayashi, S.; Yamaguchi, A.; Uchikura, H.; Shirai, T.; Sasaki, K.; Kondo, A.; Tsuge, Y. Optimal ratio of carbon flux between glycolysis and the pentose phosphate pathway for amino acid accumulation in Corynebacterium glutamicum. ACS Synth. Biol. 2020, 9, 1615–1622. [Google Scholar] [CrossRef] [PubMed]
  61. Pérez-García, F.; Risse, M.J.; Friehs, K.; Wendisch, V.F. Fermentative production of L-pipecolic acid from glucose and alternative carbon sources. Biotechnol. J. 2017, 12. [Google Scholar] [CrossRef]
  62. Zhang, X.; Lai, L.; Xu, G.; Zhang, X.; Shi, J.; Koffas, M.A.G.; Xu, Z. Rewiring the central metabolic pathway for high-yield l-serine production in Corynebacterium glutamicum by using glucose. Biotechnol. J. 2019, 14, 1800497. [Google Scholar] [CrossRef]
  63. Zhang, J.; Qian, F.; Dong, F.; Wang, Q.; Yang, J.; Jiang, Y.; Yang, S. De novo engineering of Corynebacterium glutamicum for l-proline production. ACS Synth. Biol. 2020, 9, 1897–1906. [Google Scholar] [CrossRef]
  64. Mustafi, N.; Grünberger, A.; Mahr, R.; Helfrich, S.; Nöh, K.; Blombach, B.; Kohlheyer, D.; Frunzke, J. Application of a genetically encoded biosensor for live cell imaging of L-valine production in pyruvate dehydrogenase complex-deficient Corynebacterium glutamicum strains. PLoS ONE 2014, 9. [Google Scholar] [CrossRef] [Green Version]
  65. Mahr, R.; Gätgens, C.; Gätgens, J.; Polen, T.; Kalinowski, J.; Frunzke, J. Biosensor-driven adaptive laboratory evolution of l-valine production in Corynebacterium glutamicum. Metab. Eng. 2015, 32, 184–194. [Google Scholar] [CrossRef]
  66. Pérez-García, F.; Ziert, C.; Risse, J.M.; Wendisch, V.F. Improved fermentative production of the compatible solute ectoine by Corynebacterium glutamicum from glucose and alternative carbon sources. J. Biotechnol. 2017, 258, 59–68. [Google Scholar] [CrossRef]
  67. Sanchez, S.; Rodríguez-Sanoja, R.; Ramos, A.; Demain, A.L. Our microbes not only produce antibiotics, they also overproduce amino acids. J. Antibiot. 2017. [Google Scholar] [CrossRef]
  68. Sgobba, E.; Stumpf, A.K.; Vortmann, M.; Jagmann, N.; Krehenbrink, M.; Dirks-Hofmeister, M.E.; Moerschbacher, B.; Philipp, B.; Wendisch, V.F. Synthetic Escherichia coli-Corynebacterium glutamicum consortia for l-lysine production from starch and sucrose. Bioresour. Technol. 2018, 260, 302–310. [Google Scholar] [CrossRef] [PubMed]
  69. Duan, Y.; Chen, T.; Chen, X.; Jingyu, W.; Zhao, X. Enhanced riboflavin production by expressing heterologous riboflavin operon from Bacillus cereus ATCC14579 in Bacillus subtilis. Chin. J. Chem. Eng. 2010, 18, 129–136. [Google Scholar] [CrossRef]
  70. Lin, Z.; Xu, Z.; Li, Y.; Wang, Z.; Chen, T.; Zhao, X. Metabolic engineering of Escherichia coli for the production of riboflavin. Microb. Cell Factories 2014, 13, 104. [Google Scholar] [CrossRef] [Green Version]
  71. Wang, Z.; Chen, T.; Ma, X.; Shen, Z.; Zhao, X. Enhancement of riboflavin production with Bacillus subtilis by expression and site-directed mutagenesis of zwf and gnd gene from Corynebacterium glutamicum. Bioresour. Technol. 2011, 102, 3934–3940. [Google Scholar] [CrossRef]
  72. Burgess, C.; O’Connell-Motherway, M.; Sybesma, W.; Hugenholtz, J.; van Sinderen, D. Riboflavin production in Lactococcus lactis: Potential for in situ production of vitamin-enriched foods. Appl. Environ. Microbiol. 2004, 70, 5769–5777. [Google Scholar] [CrossRef] [PubMed] [Green Version]
  73. Henke, N.A.; Wendisch, V.F. Improved astaxanthin production with Corynebacterium glutamicum by application of a membrane fusion protein. Mar. Drugs 2019, 17, 621. [Google Scholar] [CrossRef] [Green Version]
  74. Tsuge, Y.; Hori, Y.; Kudou, M.; Ishii, J.; Hasunuma, T.; Kondo, A. Detoxification of furfural in Corynebacterium glutamicum under aerobic and anaerobic conditions. Appl. Microbiol. Biotechnol. 2014, 98, 8675–8683. [Google Scholar] [CrossRef]
  75. Walter, T.; Veldmann, K.H.; Götker, S.; Busche, T.; Rückert, C.; Kashkooli, A.B.; Paulus, J.; Cankar, K.; Wendisch, V.F. Physiological response of Corynebacterium glutamicum to indole. Microorganisms 2020, 8, 1945. [Google Scholar] [CrossRef]
  76. Tsuge, Y.; Kudou, M.; Kawaguchi, H.; Ishii, J.; Hasunuma, T.; Kondo, A. FudC, a protein primarily responsible for furfural detoxification in Corynebacterium glutamicum. Appl. Microbiol. Biotechnol. 2016, 100, 2685–2692. [Google Scholar] [CrossRef]
Figure 1. (A) Growth values of the strain RiboGlu. (B) Growth values of the strain RiboMan. (C) Growth values of the strain RiboXyl. (D) Growth values of the strain RiboSSL. (E) Production values of the strain RiboGlu. (F) Production values of the strain RiboMan. (G) Production values of the strain RiboXyl. (H) Production values of the strain RiboSSL. Upper plots depict growth rates [h−1] (dark grey bars), and biomass yields (g g−1) (light grey bars). Lower plots depict riboflavin titers [mg L−1] (dark yellow bars), and riboflavin yields (mg g−1) (light yellow bars). Values represent means and standard deviations.
Fermentation 07 00011 g001
Figure 2. Growth and production of the strains RiboGlu, RiboMan, RiboXyl, and RiboSSL during bioreactor batch fermentations with 20 g L−1 glucose, mannose, or xylose as sole carbon source. The combination of strain and sugar is as follows: (A) RiboGlu plus glucose; (B) RiboMan plus glucose; (C) RiboXyl plus glucose; (D) RiboSSL plus glucose; (E) RiboGlu plus mannose; (F) RiboMan plus mannose; (G) RiboGlu plus xylose; (H) RiboXyl plus xylose. Data is depicted as follows: glucose consumption (blue line), mannose consumption (red line), xylose consumption (green line), riboflavin accumulation (yellow line), biomass formation (thick black line), stirring profile (thin black line), and pO2 profile (dotted line). One replication of each cultivation was carried out.
Fermentation 07 00011 g002
Figure 3. Bioreactor batch fermentations with 60 g L−1 synSSL as sole carbon source. (A) Growth and production of the strain RiboGlu. (B) Growth and production of the strain RiboMan. (C) Growth and production of the strain RiboXyl. (D) Growth and production of the strain RiboSSL. Data is depicted as follows: glucose consumption (blue line), mannose consumption (red line), xylose consumption (green line), riboflavin accumulation (yellow line), biomass formation (thick black line), stirring profile (thin black line), and pO2 profile (dotted line). One replication of each cultivation was carried out.
Fermentation 07 00011 g003
Figure 4. By-products accumulation profiles during the bioreactors bath fermentations. The combination of strain and sugar is as follows: (A) RiboGlu plus 20 g L−1 of glucose; (B) RiboMan plus 20 g L−1 of glucose; (C) RiboXyl plus 20 g L−1 of glucose; (D) RiboSSL plus 20 g L−1 of glucose; (E) RiboGlu plus 20 g L−1 of mannose; (F) RiboMan plus 20 g L−1 of mannose; (G) RiboGlu plus 20 g L−1 of xylose; (H) RiboXyl plus 20 g L−1 of xylose; (I) RiboGlu plus 60 g L−1 synSSL; (J) RiboMan plus 60 g L−1 synSSL; (K) RiboXyl plus 60 g L−1 synSSL; (L) RiboSSL plus 60 g L−1 synSSL. Data is depicted as follows: l-glutamate (filled squares), l-alanine (filled diamonds), l-alanine (filled triangles), l-lactate (empty squares), and pyruvate (empty circles).
Fermentation 07 00011 g004
Figure 5. Growth and production of three independent co-cultivation batch fermentations with the strains RiboMan and RiboXyl. (A) RiboMan and RiboXyl were inoculated together at the beginning of the process; (B) yields for riboflavin achieved when inoculating RiboMan and RiboXyl together; (C) RiboXyl was inoculated during the exponential phase of RiboMan; (D) yields for riboflavin achieved when inoculating RiboXyl during the exponential phase of RiboMan where phase I indicates before inoculation of RiboXyl and phase II indicates after inoculation of RiboXyl; (E) RiboXyl was inoculated during the stationary phase of RiboMan; (F) yields for riboflavin achieved when inoculating RiboXyl during the stationary phase of RiboMan where phase I indicates before inoculation of RiboXyl and phase II indicates after inoculation of RiboXyl. Data is depicted as follows: glucose consumption (blue line), mannose consumption (red line), xylose consumption (green line), riboflavin accumulation (yellow line), biomass formation (thick black line), stirring profile (thin black line), pO2 profile (dotted line), and the sum of by-products (dashed line) (by-products details in Figure 6). One replication of each cultivation was carried out.
Fermentation 07 00011 g005
Figure 6. Accumulation of by-products during the batch co-cultivation processes. (A) RiboXyl inoculated together with RiboMan, (B) RiboXyl inoculated during the exponential phase of RiboMan, and (C) RiboXyl inoculated during the stationary phase of RiboMan. Data is depicted as follows: l-glutamate (filled squares), l-alanine (filled diamonds), l-alanine (filled triangles), l-lactate (empty squares), and pyruvate (empty circles).
Fermentation 07 00011 g006
Figure 7. Growth and production during fed-batch fermentation of the strain RiboSSL (A) and the dynamic co-cultivation of RiboMan and RiboXyl (B). Data is depicted as follows: glucose consumption (blue line), mannose consumption (red line), xylose consumption (green line), riboflavin accumulation (yellow line), biomass formation (thick black line), stirring profile (thin black line), pO2 profile (dotted line), and the sum of by-products (dashed line) (by-products details in Figure 8). The feeding started after glucose depletion and lasted 65 h with a linear rate of 0.4 mL min−1. One replication of each cultivation was carried out.
Fermentation 07 00011 g007
Figure 8. By-products accumulation during the fed-batch cultivation processes. (A) fermentation carried out with the strains RiboSSL, and (B) fermentation carried out with the co-cultivation of RiboXyl and RiboMan. Data is depicted as follows: l-glutamate (filled squares), l-alanine (filled diamonds), l-alanine (filled triangles), l-lactate (empty squares), and pyruvate (empty circles).
Fermentation 07 00011 g008
Figure 9. Production data comparison when using synSSL as the carbon source during fermentations in bioreactors. Data is depicted as follows: strain or strains used in the process, type of process performed, final riboflavin titer (mg L−1), riboflavin yield (g g−1), riboflavin volumetric productivity (g L−1 h−1), and total by-products accumulated (g L−1). The time point for the inoculation of RiboXyl is indicated in parenthesis.
Fermentation 07 00011 g009
Table 1. Strains and plasmids used in this work.
Strains and PlasmidsDescriptionSource
Strains
  Corynebacterium glutamicumwild-type strain ATCC 13032, auxotrophic for biotin[29]
  RiboGluCorynebacterium glutamicum carrying the plasmids pEKEx3-sigH and pSH1This work
  RiboManCorynebacterium glutamicum carrying the plasmids pEKEx3-sigH and pSH1-manAThis work
  RiboXylCorynebacterium glutamicum carrying the plasmids pEKEx3-sigH and pSH1-xylABThis work
  RiboSSLCorynebacterium glutamicum carrying the plasmids pEKEx3-sigH and pSH1-manA-xylABThis work
Plasmids
  pSH1KanR, C. glutamicum/E. coli shuttle plasmid (Ptuf, pHM1519 OriVCg)[30]
  pEKEx3SpecR, C. glutamicum/E. coli shuttle plasmid (Ptac, lacI, pBL1 OriVCg)[31]
  pSH1-manAKanR, pSH1 overexpressing manA from Corynebacterium glutamicum This work
  pSH1-xylABKanR, pSH1 overexpressing xylA from Xanthomonas campestris and xylB from Corynebacterium glutamicumThis work
  pSH1-manA-xylABKanR, pSH1 overexpressing manA from Corynebacterium glutamicum, xylA from Xanthomonas campestris and xylB from Corynebacterium glutamicumThis work
  pEKEx3-sigHSpecR, pEKEx3 overexpressing sigH from Corynebacterium glutamicum [27]
Table 2. Primers used in this study. Ribosomal binding sites are in bold, binding sequences for amplification are underlined.
PrimersSequence (5′ to 3′)
xylAB-fwCCTGCAGGTCGACTCTAGAGGAAAGGAGGCCCTTCAGATGAGCAACACCGTTTTCATC
xylAB-rvGAGCTCGGTACCCGGGGATCTAGTACCAACCCTGCGTTGC
manA-fwCCTGCAGGTCGACTCTAGAGGAAAGGAGGCCCTTCAGATGGAGCTATTGGAAGGCTCAC
manA-rvGAGCTCGGTACCCGGGGATCCTAAACCCTAGCGAGGAATAC
xyl-manA-fwGGTACTAGATCCCCGGGTACGAAAGGAGGCCCTTCAGATGGAGCTATTGGAAGGCTCAC
xyl-manA-rvGGCCAGTGAATTCGAGCTCGGTACCTAAACCCTAGCGAGGAATAC
pSH1-conf-fwACCGGCTCCAGATTTATCAG
pSH1-conf-rvATCTTCTCTCATCCGCCA
Table 3. Growth and production values of various riboflavin producing strains in shake flask cultivation with different concentrations of glucose, mannose, xylose, and synSSL.
Carbon Source[Carbon Source]Growth RateBiomassBiomass YieldRiboflavin TiterRiboflavin Yield
g L−1h−1g L−1g g−1mg L−1mg g−1
Glucose50.25 ± 0.002.0 ± 0.10.39 ± 0.021.1 ± 0.00.22 ± 0.01
Glucose100.25 ± 0.014.2 ± 0.20.42 ± 0.022.2 ± 0.30.22 ± 0.03
Glucose200.25 ± 0.017.8 ± 0.40.39 ± 0.024.5 ± 0.40.23 ± 0.02
Glucose500.22 ± 0.0119.4 ± 0.70.39 ± 0.016.9 ± 0.40.14 ± 0.01
Glucose1000.17 ± 0.0020.9 ± 0.60.21 ± 0.017.7 ± 0.80.08 ± 0.01
Mannose50.14 ± 0.011.9 ± 0.10.38 ± 0.020.8 ± 0.10.16 ± 0.01
Mannose100.16 ± 0.013.9 ± 0.10.39 ± 0.011.5 ± 0.10.15 ± 0.01
Mannose200.19 ± 0.018.0 ± 0.30.40 ± 0.013.0 ± 0.30.15 ± 0.02
Mannose500.15 ± 0.0214.9 ± 0.70.30 ± 0.014.6 ± 0.80.09 ± 0.02
Mannose1000.12 ± 0.0114.2 ± 0.70.14 ± 0.015.1 ± 0.50.05 ± 0.00
Xylose 50.12 ± 0.011.4 ± 0.00.28 ± 0.011.1 ± 0.10.22 ± 0.02
Xylose100.13 ± 0.002.9 ± 0.30.29 ± 0.032.6 ± 0.10.26 ± 0.01
Xylose200.13 ± 0.015.2 ± 0.40.26 ± 0.025.6 ± 0.30.28 ± 0.01
Xylose500.12 ± 0.003.9 ± 0.20.08 ± 0.008.8 ± 0.8 0.18 ± 0.02
Xylose1000.11 ± 0.014.0 ± 0.10.04 ± 0.009.4 ± 0.40.09 ± 0.00
SynSSL150.23 ± 0.013.5 ± 0.20.24 ± 0.011.9 ± 0.10.12 ± 0.01
SynSSL300.24 ± 0.018.3 ± 0.60.28 ± 0.024.4 ± 0.70.15 ± 0.02
SynSSL600.24 ± 0.0117.0 ± 0.40.28 ± 0.019.9 ± 0.7 0.17 ± 0.01
SynSSL1500.18 ± 0.0014.0 ± 0.80.09 ± 0.0112.7 ± 1.20.08 ± 0.01
SynSSL3000.06 ± 0.002.6 ± 0.20.01 ± 0.000.9 ± 0.20.00 ± 0.00
Means and standard deviations of three independent replicates are given.
Table 4. Growth and production values of various riboflavin producing strains in bioreactor batch cultivation with 20 g L−1 glucose, 20 g L−1 mannose, 20 g L−1 xylose, or 60 g L−1 synSSL.
Carbon SourceStrainBiomassBiomass YieldRiboflavin TiterRiboflavin YieldVolumetric Productivity
g L−1g g−1mg L−1mg g−1mg L−1 h−1
GlucoseRiboGlu6.10.314.80.240.18
GlucoseRiboMan9.90.497.10.360.24
GlucoseRiboXyl5.30.271.70.080.03
GlucoseRiboSSL6.50.335.30.260.12
MannoseRiboGlu2.60.133.90.200.03
MannoseRiboMan3.90.202.60.130.04
XyloseRiboXyl6.70.336.00.300.17
SynSSLRiboGlu8.40.146.80.110.08
SynSSLRiboMan8.90.156.50.110.09
SynSSLRiboXyl11.70.2011.70.190.17
SynSSLRiboSSL12.80.217.30.120.11
Publisher’s Note: MDPI stays neutral with regard to jurisdictional claims in published maps and institutional affiliations.

