
Microbial and Chemical Analysis of Non-Saccharomyces Yeasts from Chambourcin Hybrid Grapes for Potential Use in Winemaking


Department of Food Science, The Pennsylvania State University, Rodney A. Erickson Food Science Building, State College, PA 16803, USA
*
Author to whom correspondence should be addressed.
Fermentation 2021, 7(1), 15; https://0-doi-org.brum.beds.ac.uk/10.3390/fermentation7010015
Submission received: 19 December 2020
/
Revised: 18 January 2021
/
Accepted: 19 January 2021
/
Published: 21 January 2021
(This article belongs to the Special Issue Enological Repercussions of Non-Saccharomyces Species 3.0)
Abstract
:Native microorganisms present on grapes can influence final wine quality. Chambourcin is the most abundant hybrid grape grown in Pennsylvania and is more resistant to cold temperatures and fungal diseases compared to Vitis vinifera. Here, non-Saccharomyces yeasts were isolated from spontaneously fermenting Chambourcin must from three regional vineyards. Using cultured-based methods and ITS sequencing, Hanseniaspora and Pichia spp. were the most dominant genus out of 29 fungal species identified. Five strains of Hanseniaspora uvarum, H. opuntiae, Pichia kluyveri, P. kudriavzevii, and Aureobasidium pullulans were characterized for the ability to tolerate sulfite and ethanol. Hanseniaspora opuntiae PSWCC64 and P. kudriavzevii PSWCC102 can tolerate 8–10% ethanol and were able to utilize 60–80% sugars during fermentation. Laboratory scale fermentations of candidate strain into sterile Chambourcin juice allowed for analyzing compounds associated with wine flavor. Nine nonvolatile compounds were conserved in inoculated fermentations. In contrast, Hanseniaspora strains PSWCC64 and PSWCC70 were positively correlated with 2-heptanol and ionone associated to fruity and floral odor and P. kudriazevii PSWCC102 was positively correlated with a group of esters and acetals associated to fruity and herbaceous aroma. Microbial and chemical characterization of non-Saccharomyces yeasts presents an exciting approach to enhance flavor complexity and regionality of hybrid wines.
1. Introduction
Saccharomyces cerevisiae has been widely applied to many fermentation processes including baking, winemaking, and brewing for thousands of years [1]. High tolerance of glucose and ethanol, and ability to convert sugars to alcohol in fermentation makes S. cerevisiae important for alcoholic beverages [2]. In winemaking, commercial strains of S. cerevisiae are selected for their efficient and reliable fermentation capabilities especially important in producing final wines that are consistent in taste and aroma. Although commercial S. cerevisiae yeasts are common in winemaking, there is increasing interest in using non-Saccharomyces yeasts (also known as native ‘wild’ yeasts) during early stages of wine fermentation. Previous studies demonstrate that unique physiological properties of certain non-Saccharomyces yeast strains can influence resulting wine such as alcohol levels and volatile metabolite profile [3,4,5,6,7]. For example, Metschnikowia pulcherrima and Torulaspora delbrueckii were able to produce 0.28 and 0.3 g ethanol/g sugar, respectively, compared to S. cerevisiae at 0.46 g ethanol/g sugar [8]. Decreased ethanol levels in wines is favorable from a regulatory and health-related perspective [9]. Coinoculation of non-Saccharomyces yeasts such as Hanseniaspora uvarum and Starmerella bacillaris were able to enhance aromatic profile by producing higher alcohols that correspond to floral odor (i.e., -phenylethyl alcohol) [10,11,12]. -phenylethyl alcohol is an important phenolic higher alcohol in wine and consumers have responded favorably to richer, fruitier, and more complex styles of wine [9,13]. Thus, targeted use of non-Saccharomyces yeasts through sequential or coinoculation can favorably impact physicochemical properties that determine quality of final wines.
The composition, distribution, and abundance of non-Saccharomyces yeasts are affected by environmental factors such as weather, soil, rainfall, and winemaking practices [14]. Among diverse non-Saccharomyces yeasts present within vineyards and winery environments, Hanseniaspora spp., Pichia spp., and Candida spp. are dominant yeast populations that have been previously reported to contribute to the initial stages of fermentation and improve the organoleptic characteristics of final wine [15]. To date, most studies that characterize the diversity of non-Saccharomyces yeasts have been associated with Vitis vinifera varieties. Much is still unknown relative to how microbial populations present on hybrid grapes affect final wine quality. Hybrid grape varieties or also known as interspecific varieties have been of recent interest due to their versatile characteristics related to the ability to tolerate extreme cold weathers and increased disease resistance [16]. For example, Marquette (cross between two hybrids, MN 1094 × Ravat 262) is resistant to downy mildew and cold temperature at −34 °C [17]. Chambourcin (Joannès Seyve × Seibel 5455) is a French–American hybrid grape varietal and is the most abundant hybrid grape grown in Pennsylvania, USA. Chambourcin grapes have been shown to tolerate cold temperatures (−25 °C) and fungal diseases such as grey rot caused by Botrytis cinerrea [17]. Therefore, hybrid grapes could be used as an approach to decrease risks of wine faults.
During the initial and early stages of winemaking, sulfur dioxide (SO2) and ethanol are critical intrinsic factors that can directly impact the diversity and abundance of microbial populations including non-Saccharomyces yeasts. The addition of SO2 is recommended for protection against spoilage fungi or bacteria. Therefore, one important characteristic of wine yeasts is the ability to tolerate and grow in varying levels of sulfites during winemaking. On the other hand, tolerance of wine yeasts to increasing concentrations of ethanol during alcoholic fermentation is also a prerequisite for winemaking. Generally, red wines contain between 12% and 14% of ethanol and commercial strains of S. cerevisiae have been reported to be able to tolerate up to 13% ethanol [18]. However, depending on the yeast strain, cell growth and viability can be inhibited by high ethanol concentrations, and thus limit fermentation productivity and ethanol yield [19,20,21,22]. Therefore, physiological properties of yeast strains such as SO2 and ethanol tolerance is important to support the use of non-Saccharomyces yeasts in winemaking applications.
Wine flavor is a complex interaction of nonvolatile and volatile chemical constituents that contribute to taste and smell. Certain core compounds such as ethanol, glycerol, organic acids, and residual sugars contribute to the primary taste of wine. Sensory panelists perceive these core nonvolatile compounds as a mouth-warming effect, viscosity, sourness, and sweetness. These core compounds are fundamental components of wine which an individual experiences via sense [23]. On the other hand, volatile compounds in wine are composed of hundreds of different compounds with concentrations ranging from 10−1 to 10−10 g/kg typically perceived as wine aroma [24]. Wine associated volatile metabolites are a result of three processes, (1) metabolism of grape-derived compounds into active aroma compounds, (2) biosynthesis of fermentation-derived metabolites, and (3) post-fermentation practice-derived metabolites such as barrel aging [25]. Previous literature have identified methoxypyrazines, C13-norisoprenoids, volatile sulfur compounds, and terpenes as the major contribution to primary aroma, and volatile fatty acids, higher alcohols, esters, and aldehydes as contribution to secondary aroma [26,27]. However, the balance and interaction of these chemical compounds determine the wine quality. The biosynthesis of these compounds depends on the microorganism present in winemaking. Therefore, in order to isolate and identify novel non-Saccharomyces yeast strains for applications in winemaking, it is critical to analyze core volatile and nonvolatile metabolites of individual strains.
The annual economic impact of the wine industry in the State of Pennsylvania is approximately USD 2.5 billion with more than 300 wineries across the State. Pennsylvania is ranked fifth for wine production in the USA [28,29]. The overall objective of this study is to determine the potential contribution of hybrid grapes-associated non-Saccharomyces yeasts for use in winemaking to enhance regionality of local wines. Cultured-based methods coupled with ITS sequencing were used to isolate and identify Chambourcin-associated non-Saccharomyces yeasts from three regional vineyards in Pennsylvania. UHPLC-RI and GC-MS were used to measure volatile and nonvolatile compounds within inoculated fermentation using five candidate non-Saccharomyces yeast in a sterile Chambourcin grape juice system. Here, we focus on volatile metabolite changes that drive differentiation between candidate non-Saccharomyces yeasts compared to the commercial benchmark strain, S. cerevisiae. We hypothesize that non-Saccharomyces yeast isolated from hybrid grapes like Chambourcin can enhance regional characteristics of hybrid grapes and potentially increase the quality and appreciation of hybrid wines.
2. Materials and Methods
2.1. Grape Sampling and Juice Collection
Chambourcin grapes were obtained from three regional vineyards in Pennsylvania, USA. Grapes were collected and refrigerated at 4 °C until further processing (not more than 72 h). One hundred and fifty grams of grape berries were crushed to produce must and allowed to ferment in a 1000-mL sterile beaker covered with aluminum foil at 25 °C for 24 h. Previous studies demonstrate that addition of sulfite is one factor that can decrease richness and evenness of non-Saccharomyces yeast during fermentation, thus representative yeast selection was conducted without supplemental sulfite to maximize isolation of diverse populations.
2.2. Growth Media and Fungal Isolation
To isolate and identify non-Saccharomyces yeasts, a combination of microbiological culture-based approaches with molecular methods facilitates the identification of species. Fungal isolation was conducted as outlined in Raymond Eder et al. (2017) and Vaudano et al. (2019) with minor modifications related to type of selective agar and sampling timepoint [14,30]. To isolate grape-associated fungal populations, appropriate dilutions ( dilutions) of fermented Chambourcin must at 0 and 24 h were plated on Dichloran Rose Bengal Chloramphenicol (DRBC) agar based on manufacturer’s instructions (Difco, Sparks, MD, USA). DRBC agar is recommended for the enumeration and selection of yeasts and molds in food and dietary supplements. It contains peptone as a source of carbon and nitrogen, dextrose as a sugar source, and magnesium sulfate to provide trace elements [31]. Chloramphenicol is added to inhibit bacterial growth resulting in better recovery of fungal cells, and rose bengal is added to increase the selectivity of non-Saccharomyces yeast by suppression of rapidly growing molds such as Neurospora and Rhizopus spp. [32]. Dichloran is added to inhibit the spreading of molds by reducing colony diameters [33]. Culture plates were incubated at 25 °C for 5 days. Twenty colonies were selected based on unique colony morphology observed from 0 and 24 h samples across all three regional wineries. Five milliliter enrichments were prepared for individual isolates using liquid yeast peptone dextrose (YPD) medium (1% yeast extract (Difco, Sparks, MD, USA), 2% peptone (Difco, Sparks, MD, USA) and 2% dextrose (VWR International, Radnor, PA, USA)), and grown at 25 °C for 24 h with shaking at 200 rpm (standard laboratory conditions). Yeast Peptone Dextrose is a complete medium used for cultivation of a wide range of yeasts, including Saccharomyces cerevisiae [34]. Four milliliters of enrichment culture (YPD + single colony yeast isolate grown for 24 h) was centrifuged at 3000× g for 3 min, supernatant was discarded, and cell pellets were kept frozen at −80 °C until further use. Remaining enrichment cultures were stored at −80 °C as a yeast cryo-stock supplemented with 30% (v/v) glycerol and deposited into our laboratory’s culture collection. Saccharomyces cerevisiae BY4742 [ATCC 4040004, YVC1] was used as a reference strain, grown in liquid YPD medium under standard laboratory conditions, and stored with 30% (v/v) glycerol at −80 °C.
2.3. Molecular Identification of Fungal Isolates
After culturing of yeast isolates, internal transcribed spacer (ITS) region consisting of the 5.8S rRNA genes has been shown to provide the highest probability of successful identification for the broadest range of fungi [35]. Thus, studies to date use a combination of culture-based methods and sequencing to identify fungal populations in complex fermentation systems such as winemaking. A total of 120 isolated strains were identified by analysis of the ribosomal internal transcribed spacer (ITS) region (ITS1-5.8S-ITS2) from three regional vineyards [30]. It is important to note that for molecular identification of Ascomycota yeast, the 28S nuclear ribosomal large subunit rRNA gene (LSU) is used in combination with the ITS region to improve accuracy of identification [35]. For the purpose of this study, ITS was chosen to support wine yeast literature as well as metagenomic HTS analyses [36]. Genomic DNA were extracted from frozen cell pellets using a MasterPure Yeast DNA Purification Kit based on manufacturer’s instructions (Lucigen, Middleton, WI, USA). For isolates which resemble filamentous fungi characterized by aerial mycelium growth, isolates were rinsed with 0.1 M and recentrifuged to obtain dry cell tissue for cell lysis and precipitation of DNA. Genomic DNA for colonies with yeast-like morphologies were extracted based on manufacturers’ instructions.
The ITS region was amplified by PCR using the universal primers, ITS1 (5′- TCC GTA GGT GAA CCT GCG G-3′) and ITS4 (5′-TCC TCC GCT TAT TGA TAT GC-3′) [37]. PCR was carried out in a final volume of 25 μL, containing 12.5 μL of PCR Master Mix 5Prime HotMasterMix (Quantabio, Beverly, MA, USA), 1.25 μL of 10 nM forward primer and 1.25 μL of 10 nM reverse primer, and 10 μL of template DNA (10 ng/μL). PCR cycles were as follows: initial denaturation at 93 °C for 3 min and 35 cycles of denaturation at 93 °C for 30 s, annealing at 52 °C for 30 s, extension at 72 °C for 1 min, with a final extension at 72 °C for 10 min. PCR amplicons were separated on 1.5% agarose gel in 1 x TAE buffer, stained with SYBR Safe DNA gel stain (Invitrogen, Thermo Fisher Scientific, MA, USA) and visualized using UV transillumination. PCR products were purified using the QIAquick PCR purification Kit (Qiagen, Hilden, Germany). Sanger sequencing was performed using ITS4 primers mentioned above at The Pennsylvania State University’s HUCK Institutes of Life Sciences (University Park, PA, USA) on an Applied Biosystems 3730XL DNA Analyzer (Applied Biosystems, Foster City, CA, USA).
ITS sequences obtained from Sanger sequencing were subjected to visual quality assessment on DNA sequencing chromatogram, and then queried using BLAST (https://blast.ncbi.nlm.nih.gov/Blast.cgi) as outlined in Brysch-Herzberg and Seidel (2015) and Raymond Eder et al. (2017) with minor modifications on criteria of alignment score for molecular identification [30,38]. The species of reference strain was assigned to an isolate when an identity score of 99%. Identity scores lower than 99% were assigned a genus and not further identified to species level in this study. Of important to this study, five candidate strains were subsequently aligned with GeneBank type strain sequence with the following identity score: 100% for Hanseniaspora uvarum PSWCC70, 99.25% for H. opuntiae PSWCC64, 99.74% for Pichia kluyveri PSWCC62, 93.85% for P. kudriavzevii PSWCC102, and 100% for Aureobasidium pullulans PSWCC82. For isolates with multiple possible genus and species identification from the National Center for Biotechnology Information (NCBI) database, MycoBank (http://www.mycobank.org/; [39]) was used for fungal synonyms searching and UNITE (https://unite.ut.ee/) was used for similarity searches against additional fungal databases to increase identification for that particular fungal isolate. ITS sequences for this study have been deposited into NCBI (#Accession MW301459-MW301578). Phylogenetic analysis was conducted using the Molecular Evolutionary Genetics Analysis (MEGA) software version 10.1.7 [40,41]. ITS sequences were aligned with Multiple Sequence Comparison by Log-Expectation (MUSCLE) and phylogenetic tree was constructed using the maximum likelihood (ML) method supported by 500 bootstrap replications [42,43].
2.4. Physiological Characterization of Non-Saccharomyces Yeasts
Candidate non-Saccharomyces yeasts for downstream characterization experiments were selected based on results obtained from sequencing analysis and the absence of toxin production based on previously published studies. For example, strains with highest statistical confidence based on BLAST results, de novo sequences alignment, and phylogenetic analysis were selected as candidate strains. Candidate strains Hanseniaspora uvarum PSWCC70, H. opuntiae PSWCC64, Pichia kluyveri PSWCC62, P. kudriavzevii PSWCC102, and Aureobasidium pullulans PSWCC82 isolated from spontaneously fermenting Chambourcin must were chosen for downstream analysis. Saccharomyces cerevisiae BY4742 was used as a laboratory control.
Candidate non-Saccharomyces yeast strains were grown under varying concentrations of sulfite and ethanol using a microplate-based method described by Tofalo et al. (2014) and Englezos et al. (2015) with minor modifications related to the concentration of substrate [44,45]. For characterization of sulfite tolerance, yeast strains were grown in liquid YPD media with final concentrations of 0, 40, 60, 80, 100 mg/L sodium metabisulfite (VWR International, Radnor, PA) at pH = 3.0. Sulfites are most effective as an antimicrobial agent in acidic conditions due to the effect from the molecular penetrating the cell wall and disrupting the enzymatic. For characterization of ethanol tolerance, yeast strains were grown in liquid YPD media (pH = 6.5) containing 0, 8, 10, 12, and 14% (v/v) ethanol (Decon Labs, King of Prussia, PA, USA). Varying ethanol concentrations were chosen to represent 12–14% ethanol typically present in red wines.
Five candidate strains and one control strain BY4742 were streaked on YPD agar (1.5% Bacto Agar) (Difco, Sparks, MD, USA) to obtain single colonies which were transferred to 5 mL of liquid YPD media and allowed to grow for 24 h at 25 °C with shaking (200 rpm). Cell pellets were collected by centrifugation at 4000× g for 5 min and washed twice with sterile phosphate-buffered saline (PBS) and resuspended in fresh liquid YPD media to obtain a starting optical density (OD) of 0.2 at 600 nm. A starting OD600 of 0.2 is approximately equal to a cell density of . The resulting yeast culture (20 μL) was added to 180 μL liquid YPD media supplemented with varying concentrations of sodium metabisulfite or ethanol described above. The microplate-based assay was conducted at 25 °C and OD600 was measured every 30 min after orbital shaking for 10 s using the continuous measurement mode on a microplate reader for 48 h (BioTek Instruments, Winooski, VT, USA). To determine ethanol and sulfite tolerance of these isolates, the ratio (%) between growth of the isolate in YPD media with and without sodium metabisulfite or ethanol at the end of incubation time (t = 48 h) was calculated using the following equation:
Isolates with a percentage growth ratio of larger than 10% were considered tolerant [45]. Three biological experiments containing triplicate samples for each experimental condition were used for sulfite and ethanol tolerance experiments.
2.5. Laboratory Scale Fermentation
Fresh Chambourcin grapes were obtained from three regional vineyards as described above. Grapes were crushed in the lab, must obtained, juice centrifuged, and filter-sterilized through a 0.2 μm membrane filter (VWR International, Radnor, PA, USA) and stored at −20 °C until used. For the remaining of this manuscript, we use the term “sterile juice” to represent filter sterile Chambourcin juice. Five candidate strains and control S. cerevisiae BY4742 were inoculated into sterile juice (pH = 3.26) for laboratory scale fermentation. Inoculated fermentation of sterile juice has been previously established [4,46]. We use the term “inoculated fermentations” to represent filtered sterile juice inoculated with candidate yeast strains or control S. cerevisiae. Yeast cultures were prepared from enriched 5 mL of liquid YPD media with a single colony. Cell pellets were washed with PBS resuspended in fresh liquid YPD media to obtain a starting optical density (OD) of 0.2 at 600 nm with same procedure as for the tolerance test.
Laboratory scale fermentations were carried out starting OD600 = 0.2 () inoculated to 50 mL sterile juice in 250-mL glass Erlenmeyer flask fitted with an airlock closure to enable carbon dioxide release. Inoculated fermentations were performed at 25 °C in static condition, and fermentation was monitored by measuring weight loss due to carbon dioxide release as previously described [4,46,47] (see Supplementary Materials Figure S1). Fermentation was considered complete when weight loss of each sample was lower than 0.05 g in 24 h as outlined in [4]. The resulting fermented juice was collected at the end of fermentation and frozen at −20 °C for analysis of volatile and nonvolatile compounds. For volatile and nonvolatile analysis, three independent laboratory scale fermentations were conducted for each experimental condition.
2.6. Analysis of Flavor Compounds of Fermented Chambourcin Juice
2.6.1. Analysis of Nonvolatile Compounds by UHPLC
To analyze nonvolatile compounds, sterile juice and inoculated fermentations were filtered through a 0.2 μm membrane. Nine nonvolatile compound standards and mobile phase were prepared including glucose (99%, Acros Organics, Thermo Fisher Scientific, Waltham, MA, USA), fructose (99%, Alfa Aesar, Haverhill, MA, USA), glacial acetic acid (VWR International, Radnor, PA, USA), tartaric acid (99%, TCI America, Portland, OR, USA), citric acid (99.5%, VWR International, Radnor, PA, USA), malic acid (99%, Acros Organics, Thermo Fisher Scientific, Waltham, MA, USA), succinic acid (99%, Acros Organics, Thermo Fisher Scientific, Waltham, MA, USA), glycerol (VWR International, Radnor, PA, USA), ethanol (Decon Labs, King of Prussia, PA, USA), and sulfuric acid (Sigma-Aldrich, St. Louis, MO, USA) were purchased. Standards and mobile phase were dissolved in deionized water to a desired concentration and filtered through 0.2 and 0.45 μm membrane filters, respectively. Standards were prepared according to previously published concentration of compounds in juice or wine [48,49]. Five concentrations of each compound were made by a two-fold serial dilution to construct a standard curve. The highest concentration of each compound was glucose and fructose: 40 g/L; glacial acetic acid: 0.8 g/L, tartaric acid: 8 g/L, citric acid: 2 g/L, malic acid: 6 g/L, succinic acid: 2 g/L, glycerol 6 g/L, and ethanol: 7% (v/v). Serial dilution standards were injected to construct a standards curve and the retention time (RT) of each compound was recorded and validated. Equations of each standard curve had = 1.
Chromatographic separations were performed on an Ultra High-Performance Liquid Chromatography (UHPLC) system (Vanquish UHPLC Systems, Thermo Fisher Scientific, Waltham, MA, USA) equipped with a refractive index (RI) detector (RefractoMax 521, Thermo Fisher Scientific, Waltham, MA, USA) at the HUCK CSL Behring Fermentation Facility at Penn State. Targeted compounds were separated and analyzed on an Aminex HPX-87H column (300 × 7.8 mm) (Bio-Rad Laboratories, Hercules, CA, USA), protected by a Micro-Guard Cation H guard column (30 × 4.6 mm) (Bio-Rad Laboratories, Hercules, CA, USA) and kept at 60 °C. The analytical conditions used were as follows: 10 μL of injection volume, flow 0.5 mL/min, eluent 5 mM . Temperatures set for autosampler and RI detector were 4 and 35 °C, respectively. A standard curve was prepared using standards to determine the relationship between concentration and the peak area of a particular compound eluted. The chromatographic peak corresponding to each compound was identified by comparing the retention time with that of standards. All standards and samples were injected in technical triplicate.
2.6.2. Analysis of Volatile Compounds by Gas Chromatography-Mass Spectrometry
Aromatic compounds were analyzed by gas chromatography-mass spectrometry (GC-MS) (7890B System, 5977B MSD, Agilent Technologies, Santa Clara, CA, USA) using the method described here with minor modifications [50]. In total, 2 mL of samples was mixed with 3 g sodium chloride (VWR International, Radnor, PA, USA), 50 μL internal standard (including 13.7 mg/L 2-octanol and 9.9 mg/L naphthalene-d8 in methanol), and 0.5g D-gluconic acid lactone (Sigma-Aldrich, St. Louis, MO, USA), which inhibits grape -glucosidase activity during sample preparation and analysis [51]. Samples were then vortexed and analyzed immediately. Each injection was performed in technical triplicates from three biological flasks.
Solid-phase microextraction (SPME) mixture comprised heptanal (0.452 g/L), octanal (0.484 g/L), nonanal (0.477 g/L), 1-decanol (0.394 g/L), 1-undecanol (0.392 g/L), 1-dodecanol (0.521 g/L), n-decane (0.451 g/L), n-dodecane (0.481 g/L), n-tetradecane (0.497 g/L), methanol (0.511 g/L), (-)-trans- and (-)-cis-carveol (0.778 g/L), (+)-carvone (0.584 g/L), a-pinene (0.553 g/L), b-pinene (0.472 g/L), and p-cymene (0.424 g/L) in acetone. A total of 50 μL of internal standard as a blank and 10 μL of SPME mixture as a quality control were used and placed in the first and last order of each batch of samples, respectively. Performance test of GC-system was carried by the mixture of 5 μL alkane standard solution ( ~40 mg/L each in hexane; Sigma-Aldrich, St. Louis, MO, USA) and 50 μL internal standard.
Samples were incubated at 30 °C for 5 min under agitation at 250 rpm, and then extracted using a 2 cm Divinylbenzene/Carboxen/Polydimethylsiloxane (DVB/CAR/PDMS) SPME fiber assembly (Sigma-Aldrich, St. Louis, MO, USA) for 30 min. Separation was carried out with a Rtx-Wax capillary column (25 m 0.25 mm I.D. 0.25 μm film thickness; Restek Corporation, Bellefonte, PA, USA) in splitless mode. The transfer line and ion source (70 eV) were maintained at 250 and 230 °C, respectively. The oven temperature was programmed as follows: hold at 30 °C for 1 min; increase to 250 °C at rate of 10 °C/min and hold for 5 min. Helium was used as the carrier gas under constant flow at 1 mL/min. Mass spectra were acquired at a rate of 33–350 amu scan.
To identify fermentation associated volatile compounds, chromatograms were stripped of common contaminating ions (147, 148, 149, 207, 221, 267, and 281 m/z) using the Denoising function in OpenChrom followed by the Savitzky–Golay smoothing filter with default settings (width = 15; order = 2) to enhance chromatographic data by reducing noise while maintaining the shape and height of waveform peaks [52,53,54]. The PARAFAC2 based Deconvolution and Identification System (PARADISe) computer platform (version 3.9) was used to deconvolute mass spectra with 7000 iterations and non-negativity constraint settings [55]. Retention time intervals were manually selected to increase the resolution of peak identification. Identification based on deconvoluted mass spectra were conducted using the National Institute of Standards and Technology (NIST14) mass spectral library with criteria of match factor over 700, and validated with Kovats retention indices referred to NIST14 library, PubChem (https://pubchem.ncbi.nlm.nih.gov/) or literature. Relative abundance of volatile compounds was calculated by dividing the peak area of volatile compounds by the peak area of internal standards (IS) and then subtracted by the relative abundance of such in the blank, 50 μL internal standard.
2.7. Statistical Analysis
IBM® SPSS® Statistic software version 26 was used for ANOVA and Tukey post-hoc test [56]. One-way analysis of variance (ANOVA) to calculate statistical significance of optical density (OD600) data obtained from the tolerance assays and quantification of nonvolatile compounds by UHPLC analysis. Significant differences were established by using the Tukey post-hoc test (p < 0.05) comparing the mean values of treatment groups. Partial least squares-discriminant analysis (PLS-DA) and clustered heatmap was generated using MetaboAnalyst to help visualize volatile and nonvolatile compounds driving separation between inoculated fermentations (https://www.metaboanalyst.ca/) [57]. Input data was normalized using log transformation and Pareto scaling function to remove heteroskedasticity resulting in a data set with normal distribution [58]. ANOVA was used to identify significant differences of relative abundance of volatile compounds across inoculated fermentations conducted by candidate yeast strains using false discovery rate (FDR) adjusted p-value (or q-value) of 0.05.
3. Results
3.1. Spontaneous Fermentation of Chambourcin Grape Must Provides Insights into Fungal Diversity of Red Hybrid Grapes
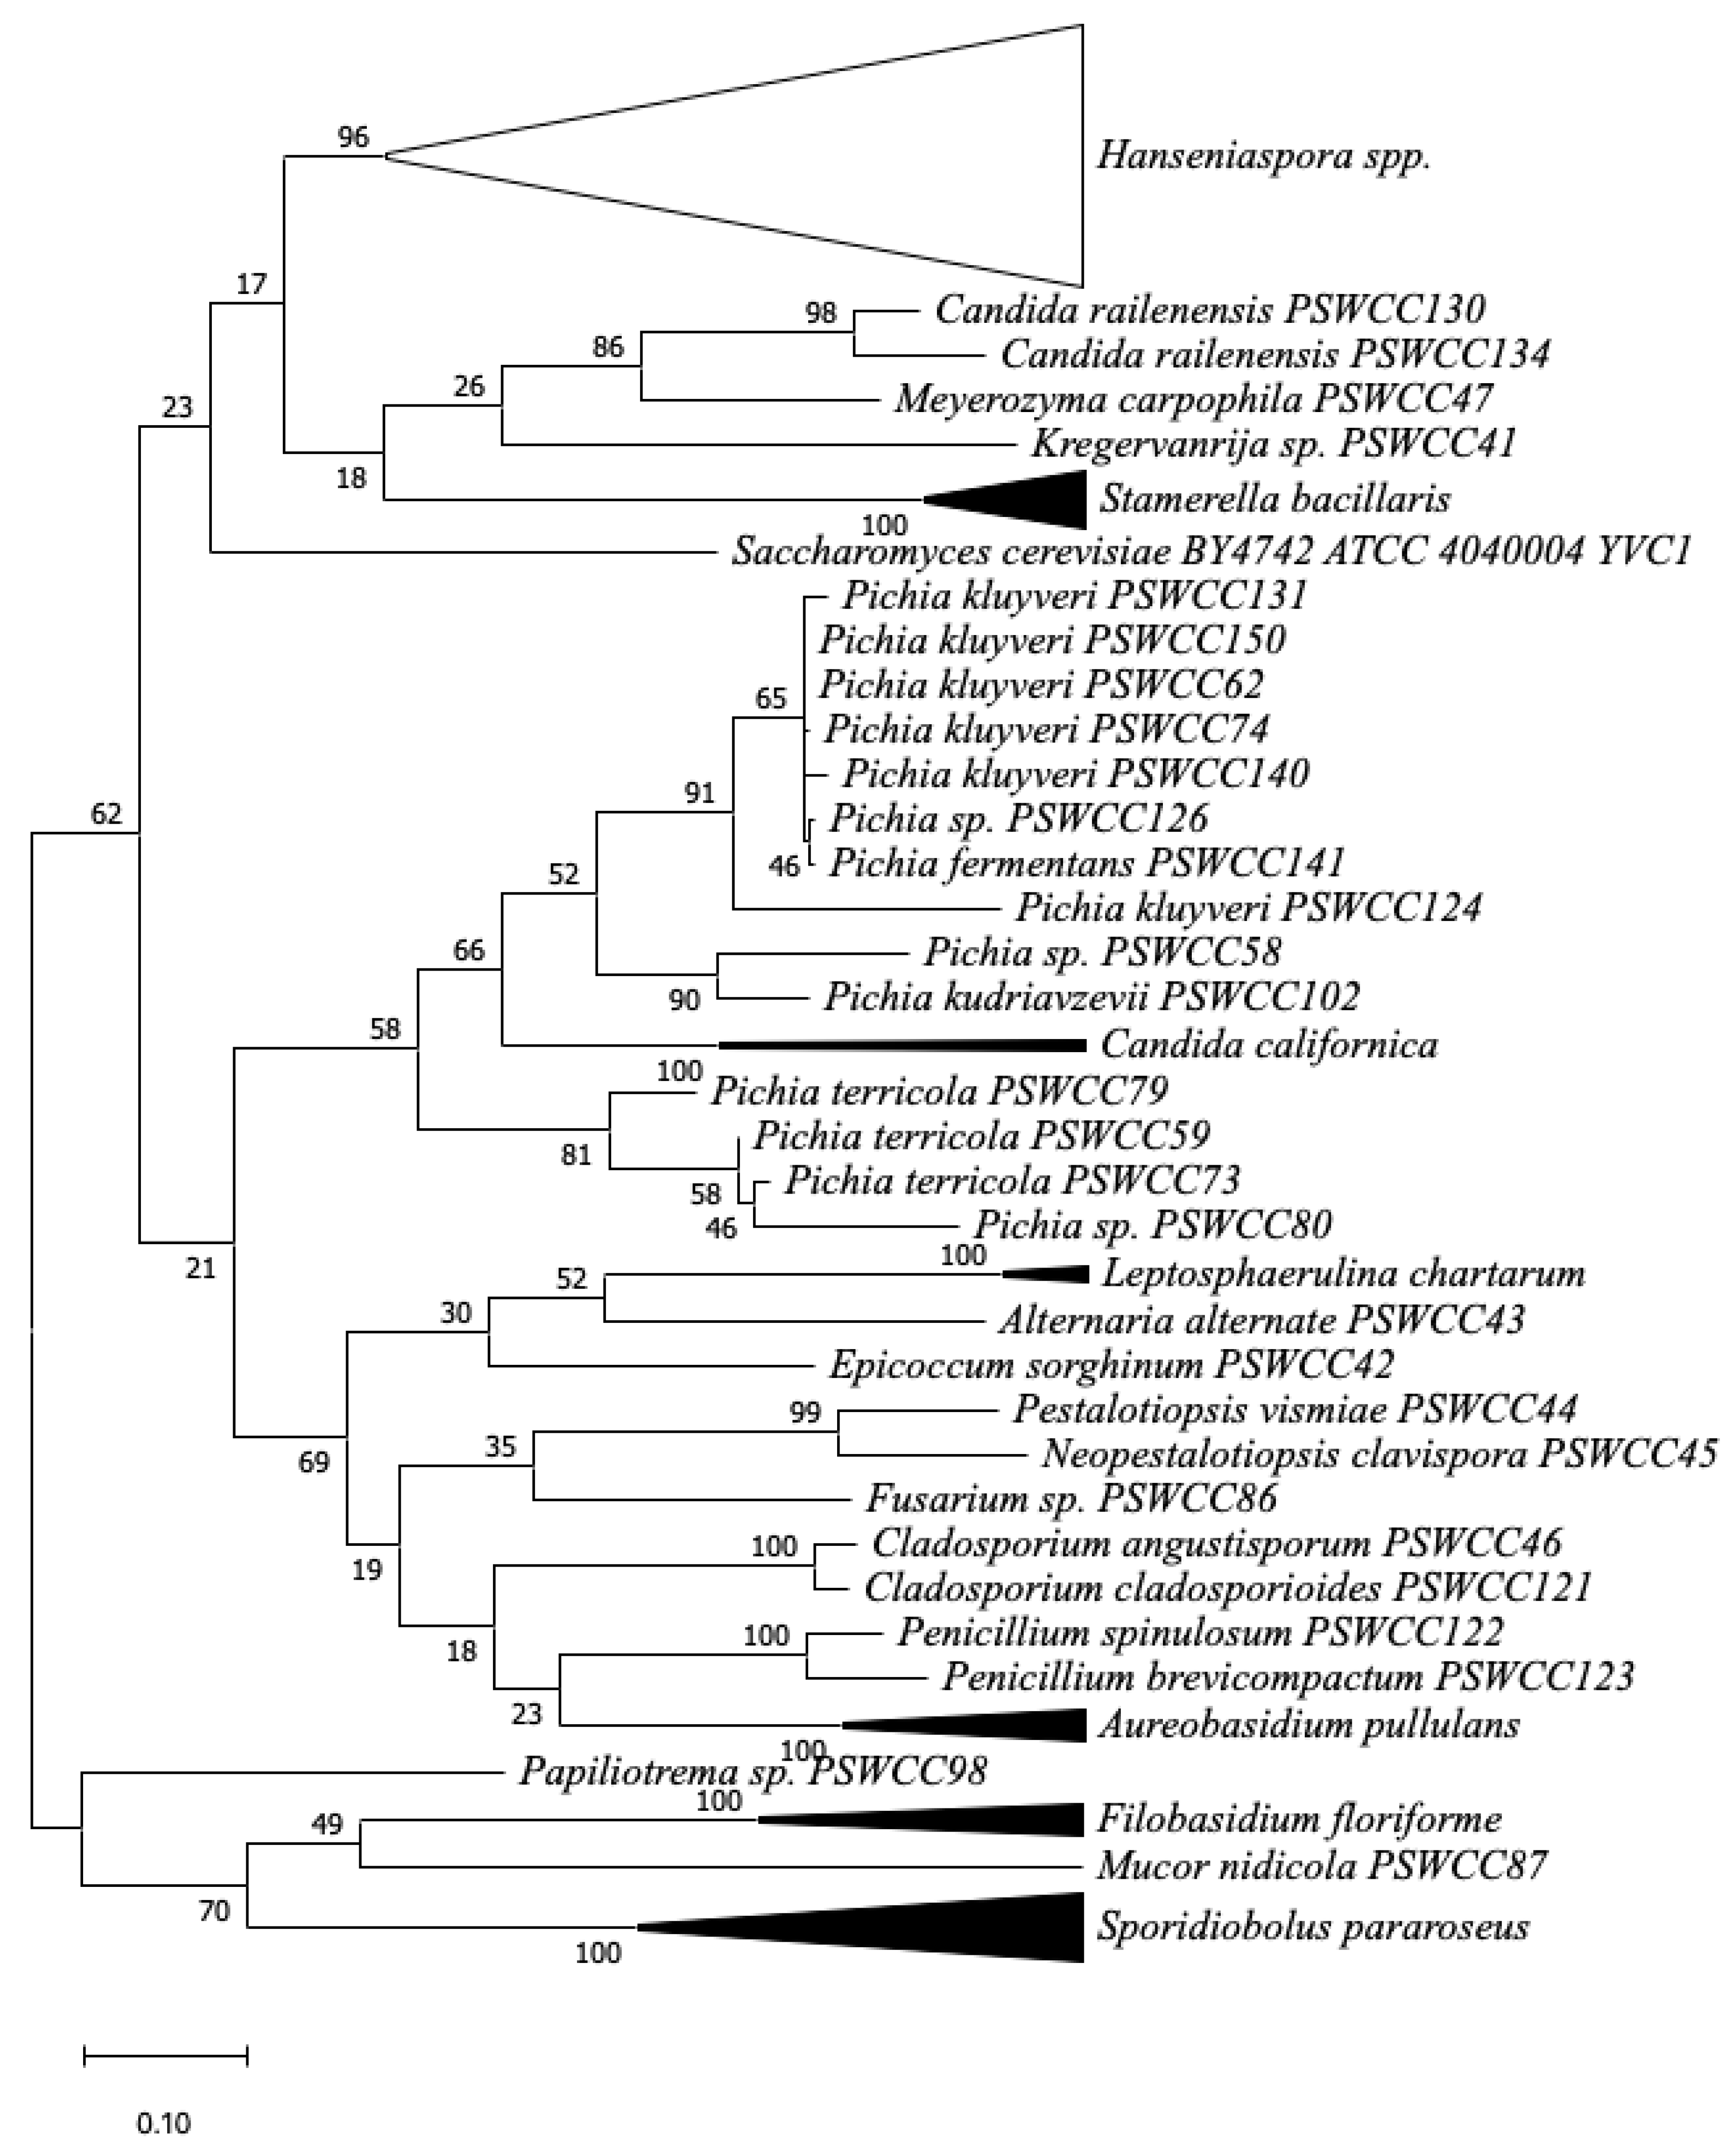
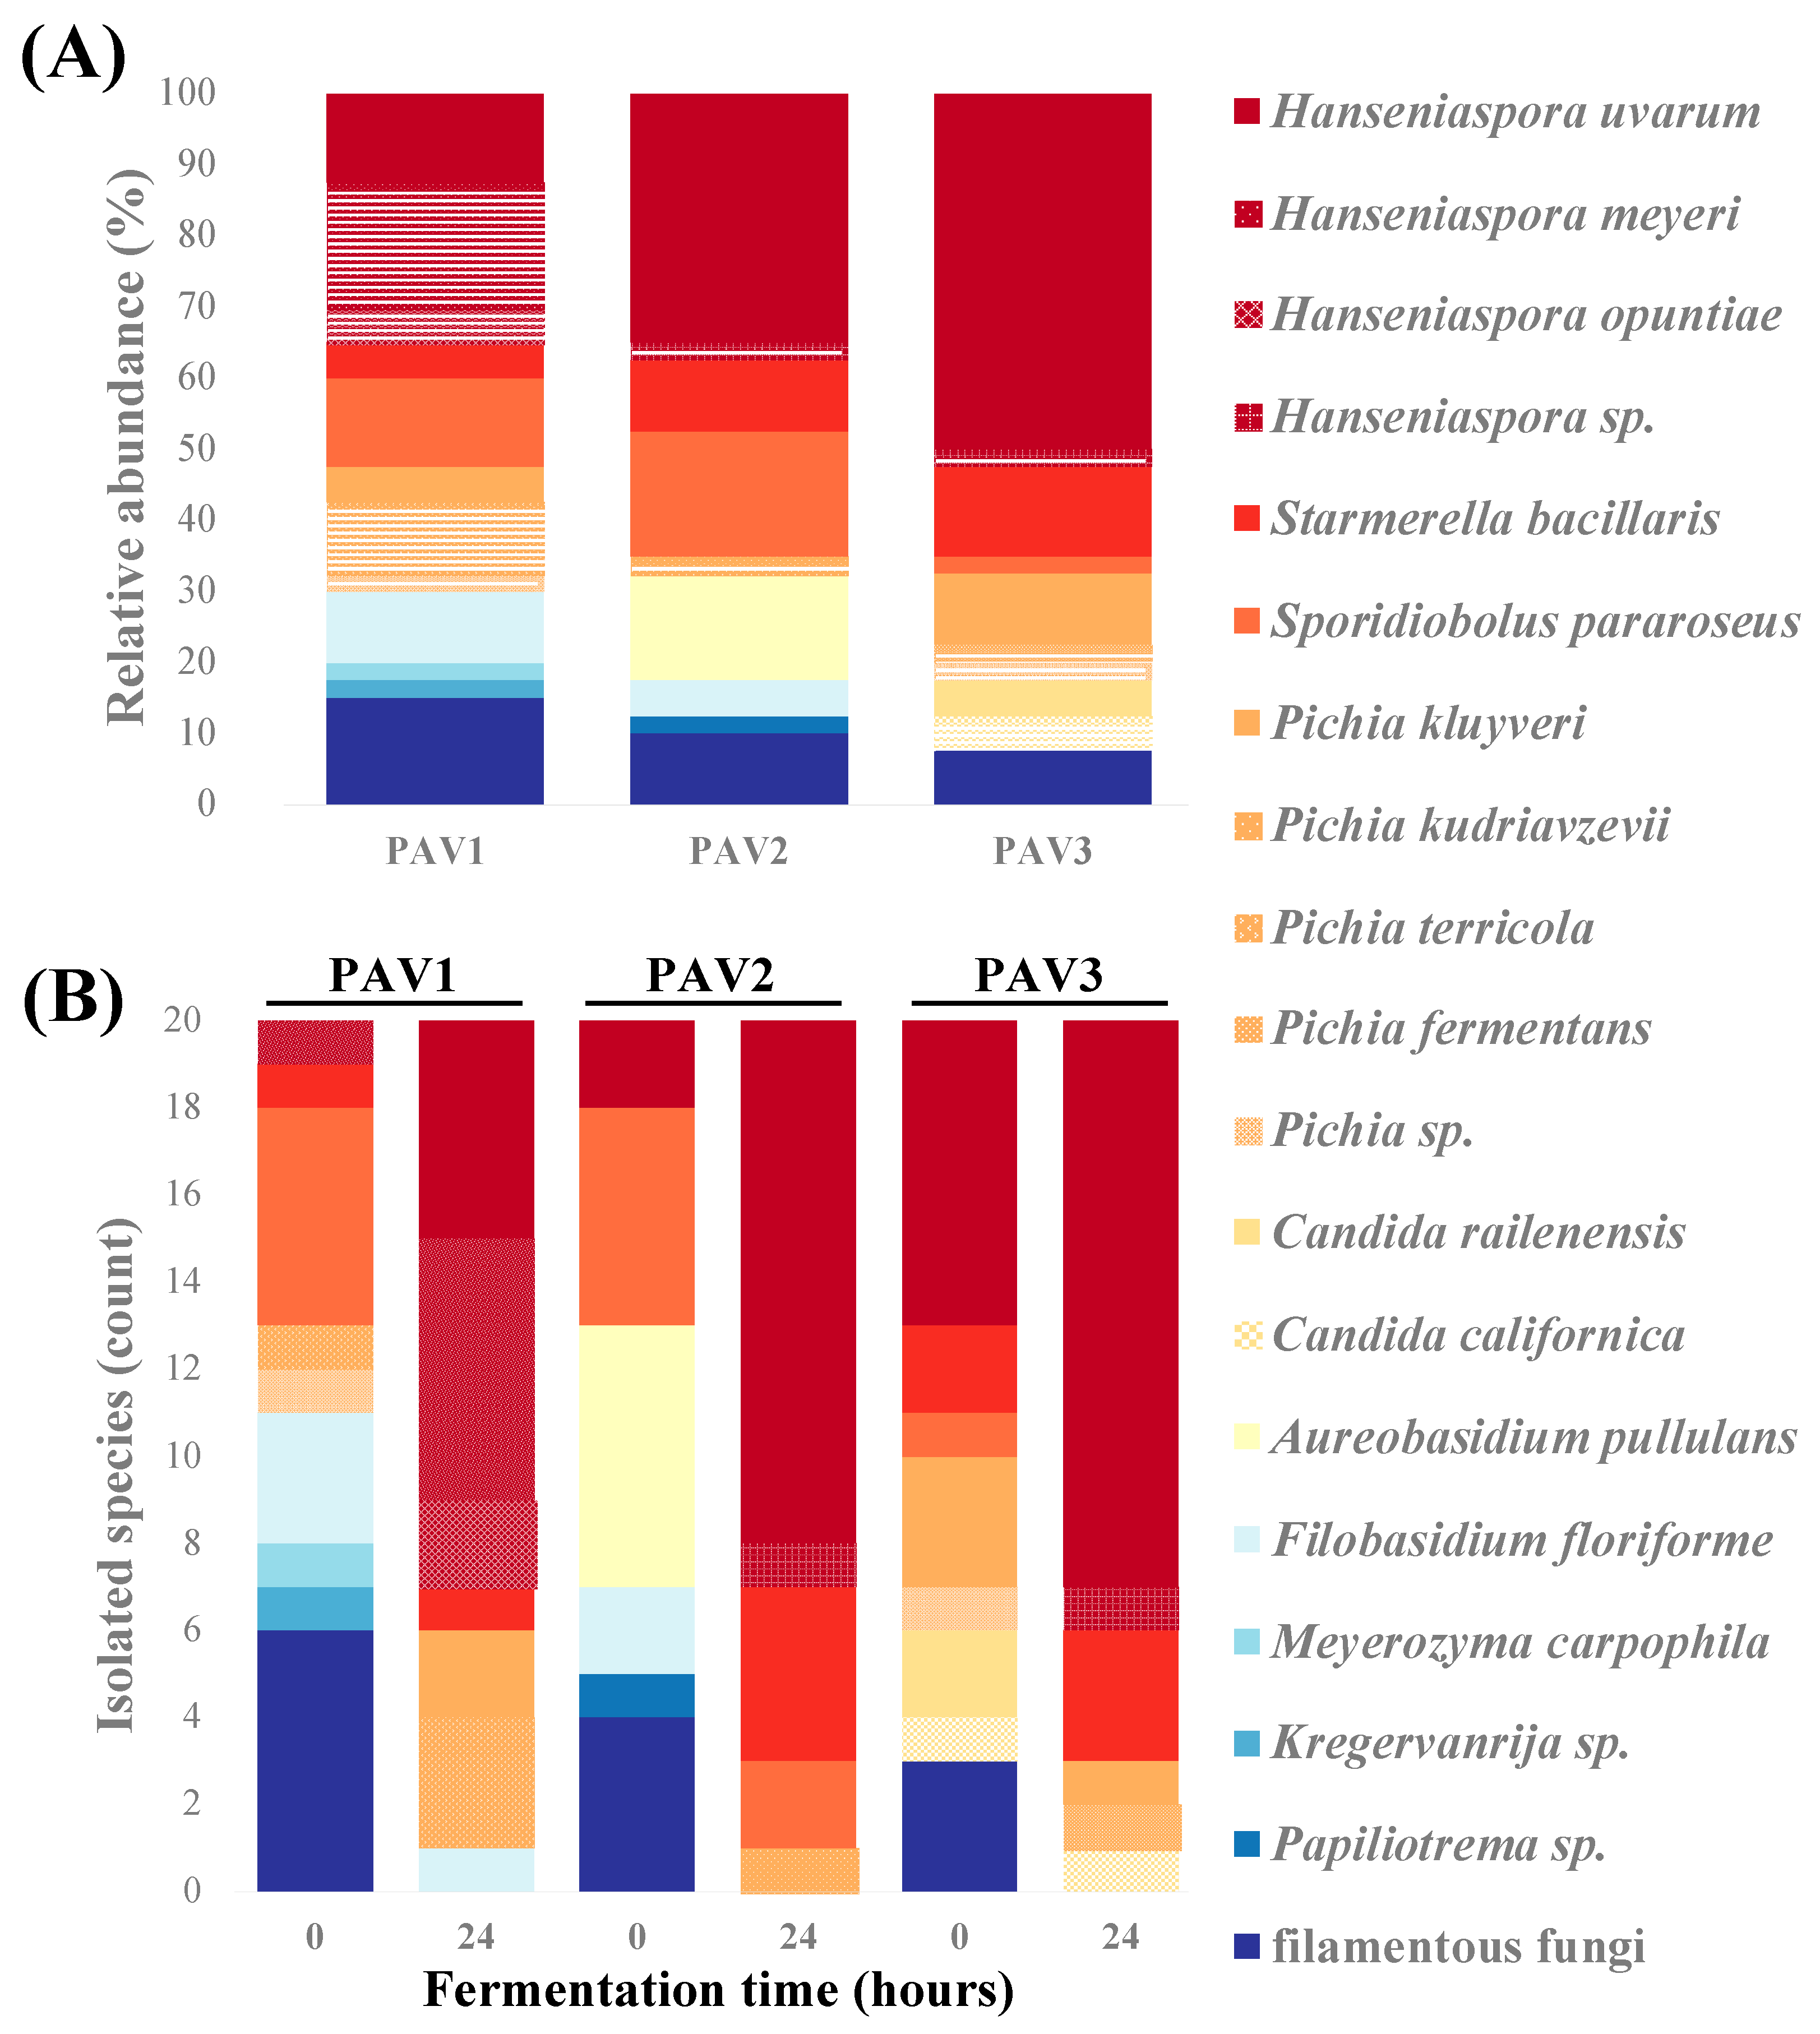
One hundred and twenty isolates from Chambourcin grape must were obtained from three vineyards during the 2019 vintage. Phylogenetic analysis of the fungal ITS region clustered these isolates into four main clades (Figure 1). Forty isolates were identified from each location by colony morphology and Sanger sequencing (see Section 2). Hanseniaspora spp. and Pichia spp. were the most abundant populations followed by Sporidiobolus pararoseus, Starmerella bacillaris, and Aureobasidium pullulans (Figure 2A). Observations from all three regional wineries suggests that H. uvarum, H. meyeri, and H. opuntiae were the most abundant (41.5%) in grape must. Pichia fermentans, P. kluyveri, P. kudriavzevii, and P. terricola were the second most abundant species (10.8%), as well as S. pararoseus. S. bacillaris (9%), Aureobasidium pullulans, and Filobasidium floriforme were also identified with equal relative abundance (5%). In PAV1, fungal composition was most diverse (17 fungal species identified) highlighted by diversity of Hanseniaspora spp. and Pichia spp. as well as the presence of filamentous fungi such as Cladosporium angustisporum, Epicoccum sorghinum, Neopestalotiopsis clavispora, and Pestalotiopsis vismiae. In PAV2, 11 fungal species were identified with H. uvarum, S. pararoseus, and A. pullulans being the most dominant species. Finally, 12 fungal species were identified in PAV3 where H. uvarum accounted for 50% of isolated strains and Pichia spp., S. bacillaris and Candida spp. accounted for the remaining fungal community.
Other yeast species isolated and identified from spontaneous fermentation include Candida spp., Meyerozyma carpophila, Kregervanrija sp., and Papiliotrema sp. Candida species included C. californica and C. railenensis. Candida californica was identified only from PAV3. One strain of Kregervanrija sp. and Papiliotrema sp. was found in PAV1 and PAV2, respectively. Using this culture-based approach, filamentous fungi were less dominant and less consistent across vineyards compared to the abundance of yeast species present on grape berries. Leptosphaerulina chartarum was the only species found across vineyards at PAV1 and PAV2. Other examples of filamentous fungi identified within individual vineyards include Alternaria alternata, Cladosporium spp., Epicoccum sorghinum, Fusarium sp., Mucor nidicola, Neopestalotiopsis clavispora, Penicillium brevicompactum, P. spinulosum, and Pestalotiopsis vismiae (Table S1). After 24 h of spontaneous fermentation, decreased fungal diversity in Chambourcin must was observed and filamentous fungi were not identified in Chambourcin grape must. Hanseniaspora spp. and Pichia spp. were the most dominant species in PAV1, and Hanseniaspora spp. and S. bacillaris were dominant in PAV2 and PAV3 after 24 h of spontaneous fermentation (Figure 2B).
3.2. Physiological Characterization of Non-Saccharomyces Yeasts
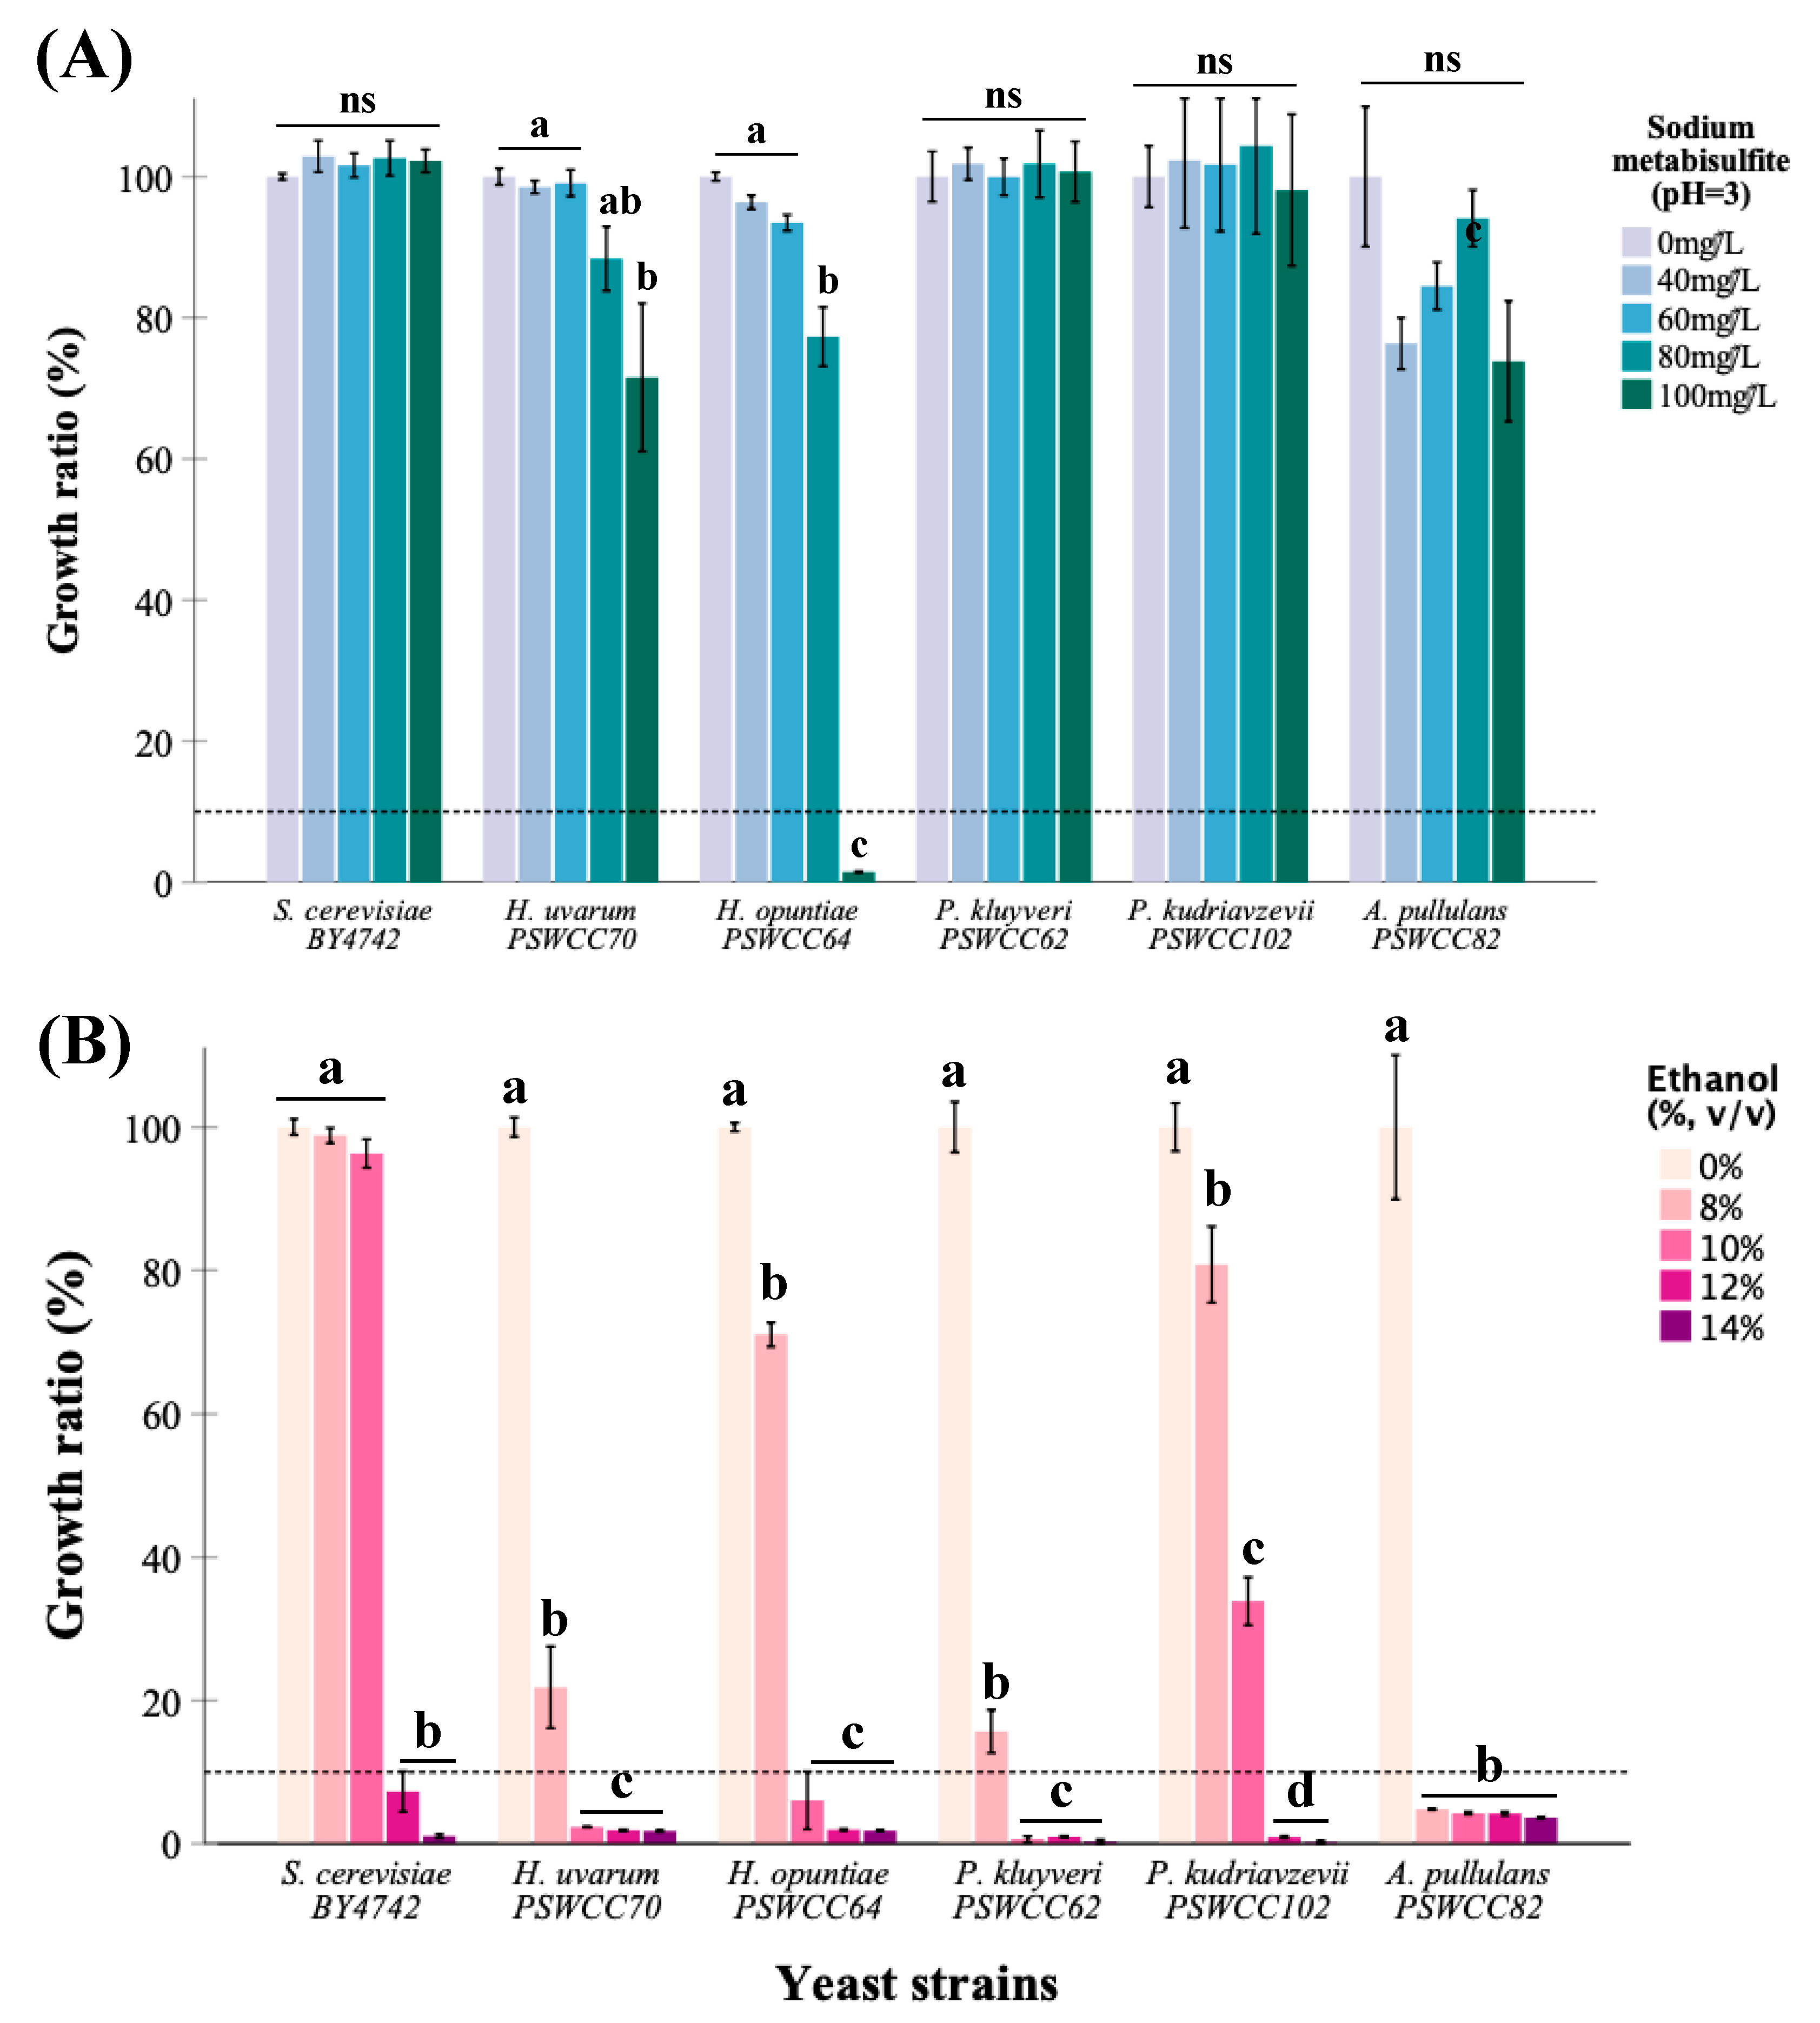
Hanseniaspora uvarum PSWCC70, H. opuntiae PSWCC64, Pichia kluyveri PSWCC62, P. kudriavzevii PSWCC102, and Aureobasidium pullulans PSWCC82 were candidate yeasts selected for downstream microbial and chemical analysis. Previous literature suggests Hanseniaspora spp. and Pichia spp. can utilize fruit sugars for fermentation and have not been shown to produce harmful toxins whereas Aureobasidium pullulans is well known for the production of extracellular enzymes such as pectinases [59]. Therefore, we characterized sulfite and ethanol tolerance of these five strains compared to control S. cerevisiae BY4742. Hanseniaspora opuntiae PSWCC64 showed a tolerance at 80 mg/L sodium metabisulfite, and other candidate strains and S. cerevisiae BY4742 had tolerance at 100 mg/L. Hanseniaspora uvarum PSWCC70 and H. opuntiae PSWCC64 were relatively sensitive to sulfite with significantly decreased growth ratio when sodium metabisulfite concentration was higher than 80 mg/L (Figure 3A). On the other hand, all five candidate strains demonstrated lower tolerance to ethanol compared to BY4742. Hanseniaspora uvarum PSWCC70, H. opuntiae PSWCC64, and P. kluyveri PSWCC62 demonstrate tolerance at 8% of ethanol while A. pullulans PSWCC82 was not tolerant to any concentration of ethanol tested. Interestingly, P. kudriavzevii PSWCC102 was the only non-Saccharomyces yeast candidate with comparable ethanol tolerance to BY4742 grown in 10% ethanol (Figure 3B). These results suggest that H. opuntiae PSWCC64 and P. kudriavzevii PSWCC102 could adapt to high ethanol environment better than the other candidate non-Saccharomyces yeasts during the alcoholic fermentation process.
3.3. Characterization of Core Nonvolatile Compounds Highlight Fermentative Potential of Candidate Non-Saccharomyces Yeasts
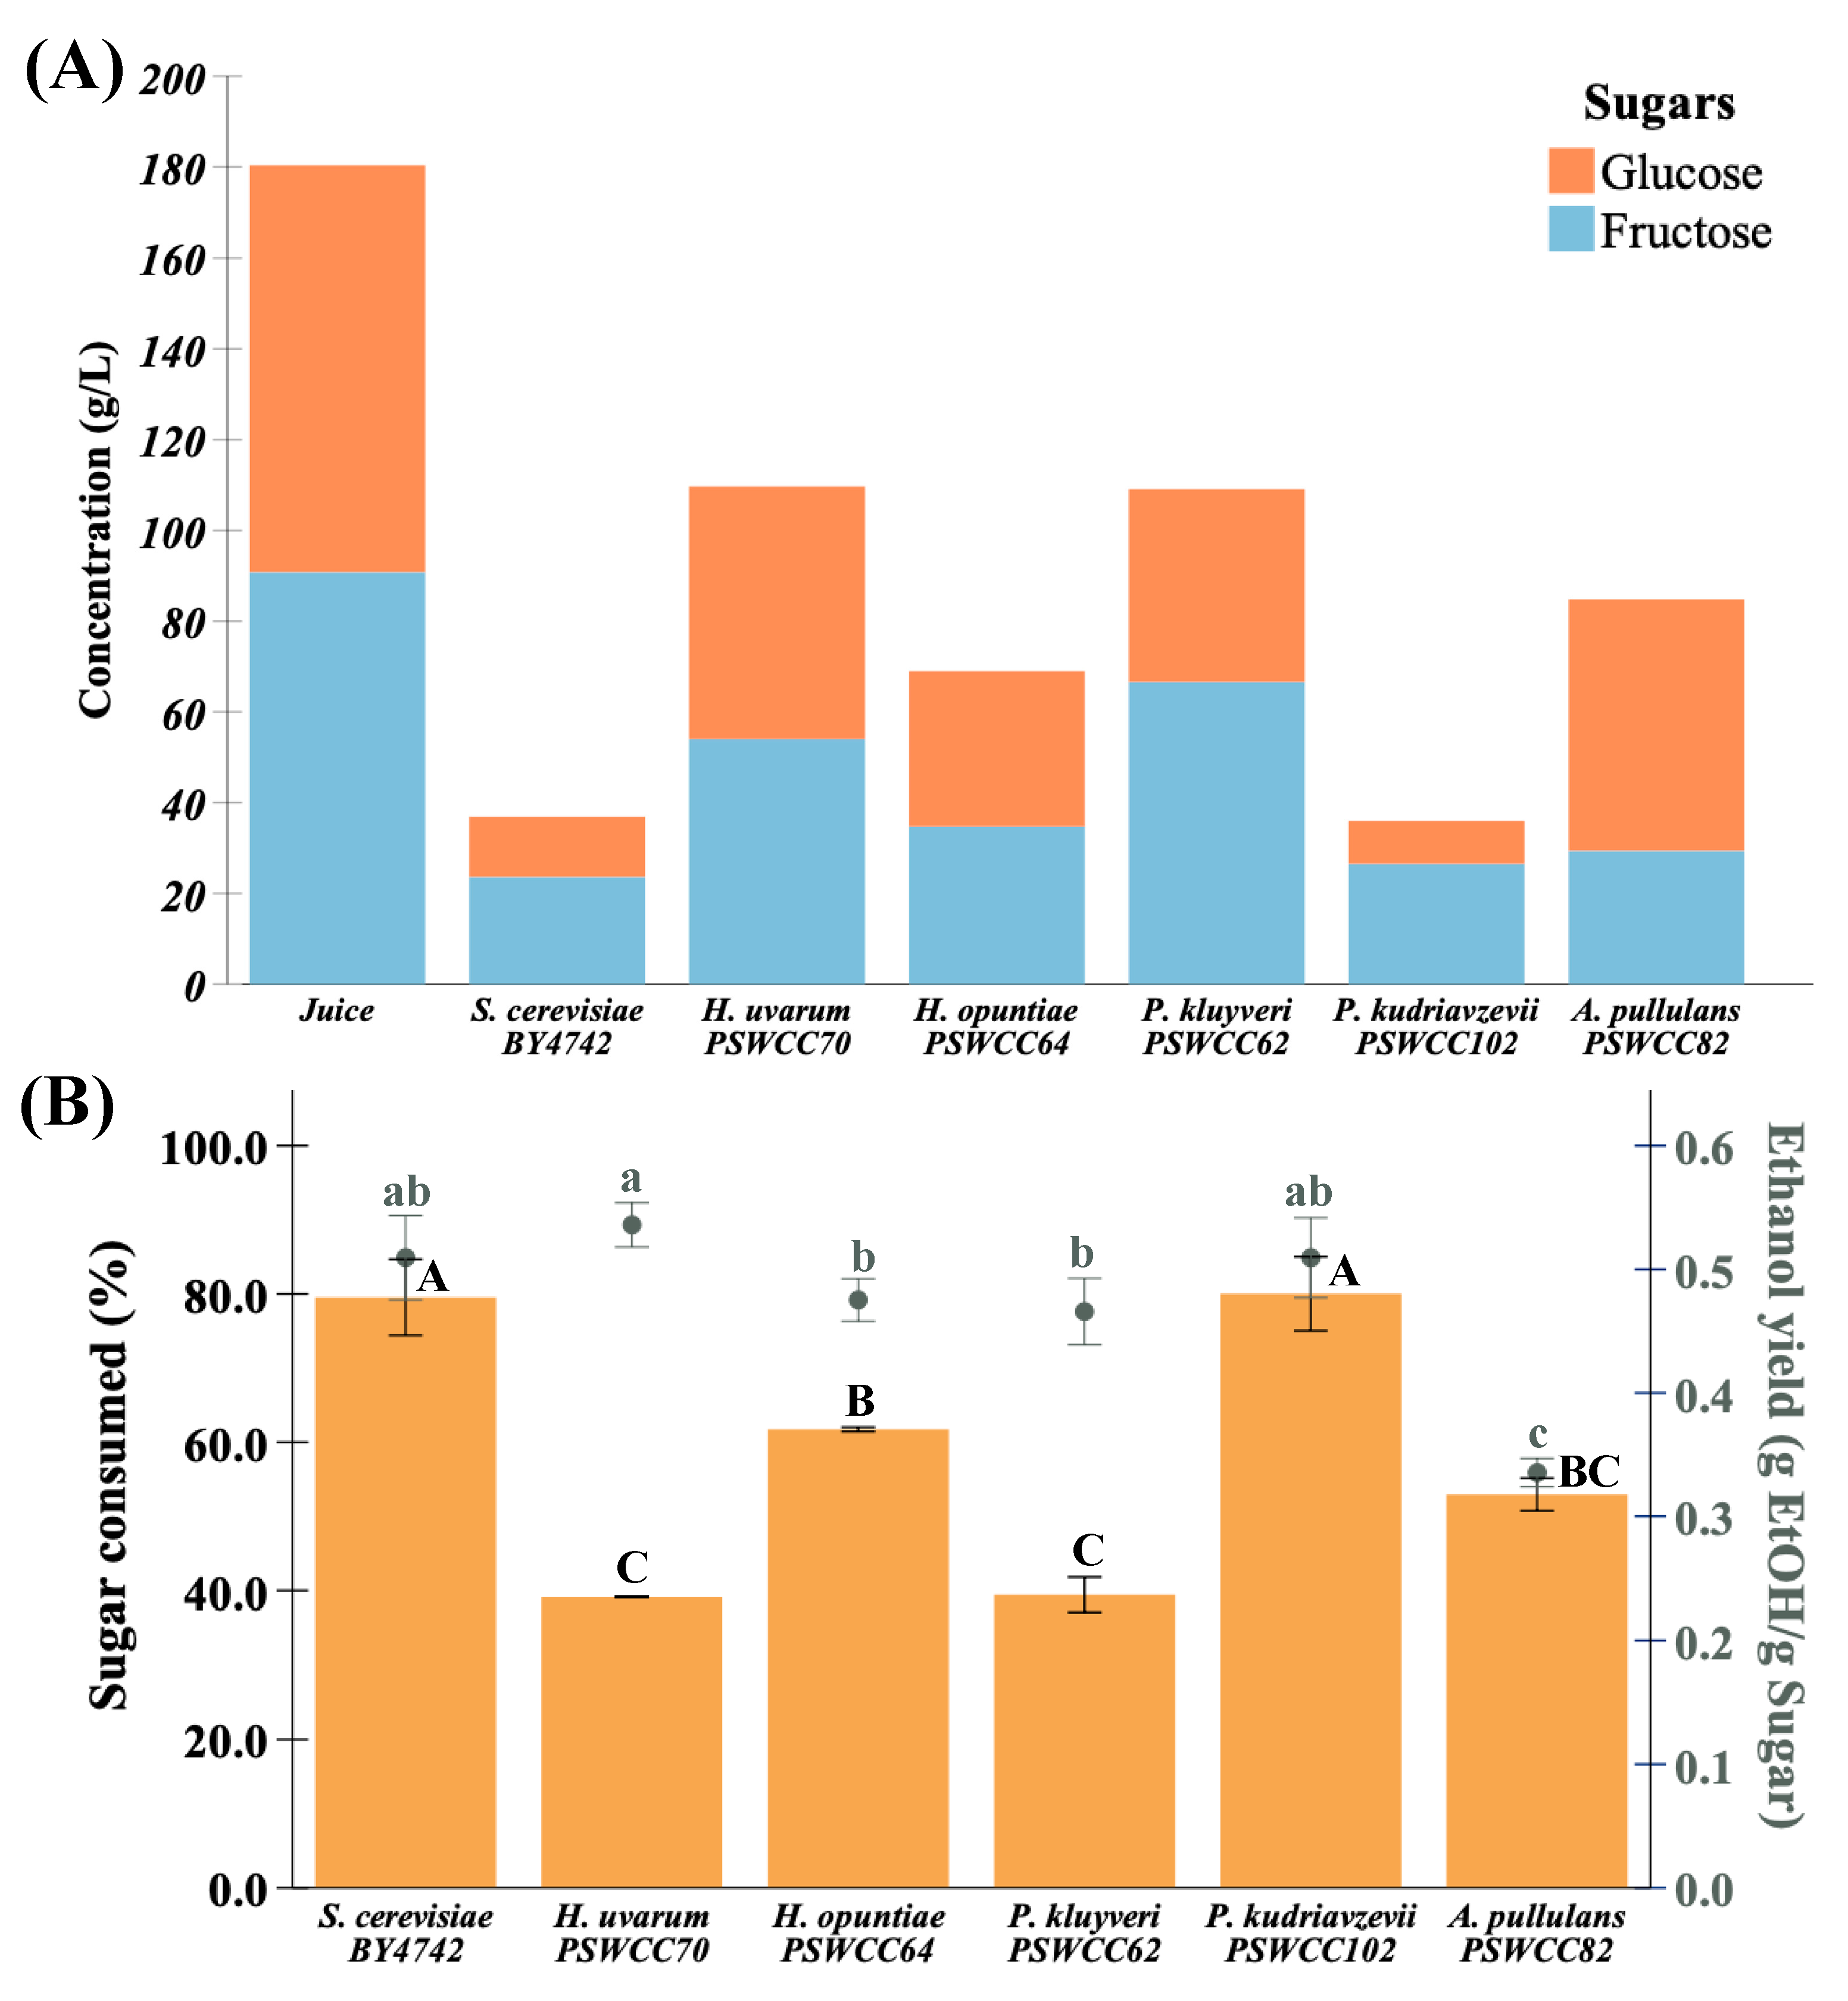
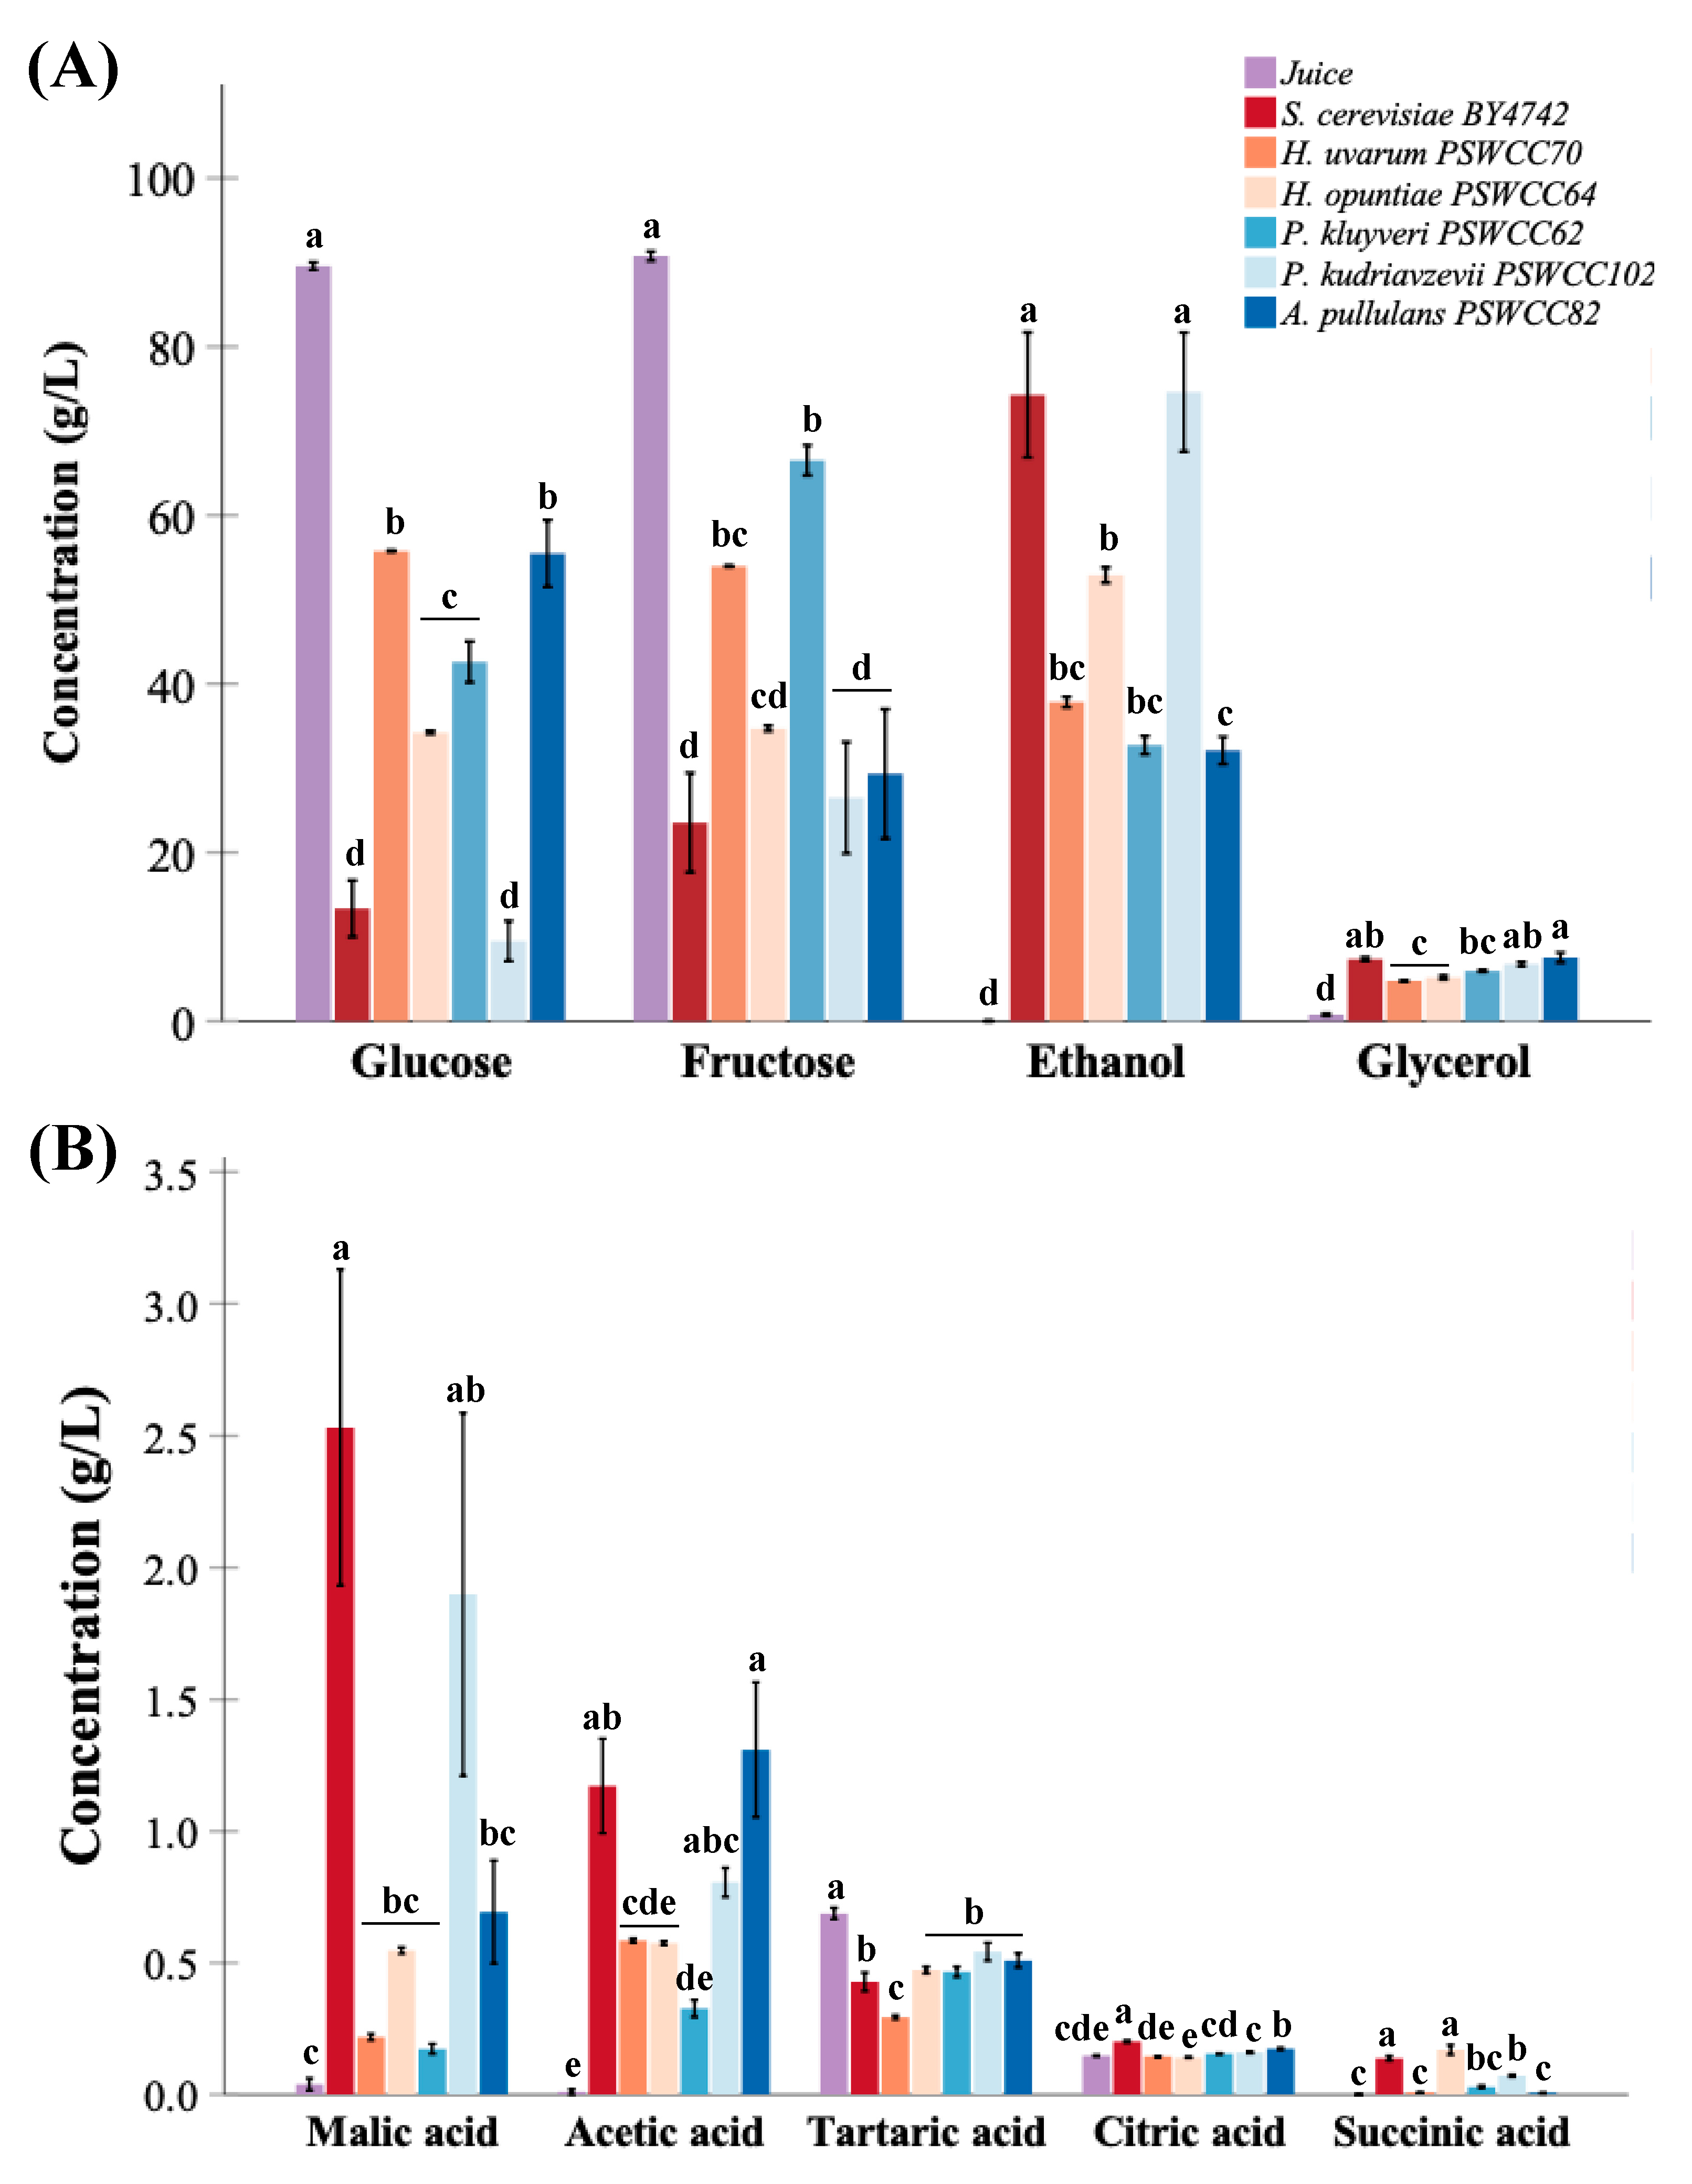
Nine nonvolatile compounds that represent fermentative potential of non-Saccharomyces yeasts compared to control strain, S. cerevisiae BY4742 were measured at the end of fermentation (Figure S1). Glucose (89.56 ± 0.78 g/L) and fructose (90.75 ± 0.56 g/L) are major sugars in Chambourcin juice. We hypothesized that candidate non-Saccharomyces strains can contribute to production of fermentation important metabolites. In support of this, the ability of non-Saccharomyces strains to convert sugars into different wine important fermentation by-products was examined. There was no significant difference in residual sugars measured in inoculated fermentations of Pichia kudriavzevii PSWCC102 (35.99 g/L) compared to S. cerevisiae BY4742 (36.88 g/L) (Figure 4A). Residual sugars are typically expressed as °Brix and are important to monitor the progress of fermentation. During inoculated fermentations, S. cerevisiae BY4742 and P. kudriazevii PSWCC102 converted about 80% of total sugars (glucose and fructose) followed by H. opuntiae PSWCC64 and A. pullulans PSWCC82 (60%), and H. uvarum PSWCC70 and P. kluyveri PSWCC62 (40%). All non-Saccharomyces strains produced similar levels of ethanol measured as “g EtOH/g Sugars” except A. pullulans PSWCC82. Interestingly, the conversion efficiency of H. uvarum PSWCC70 (0.54 (0.03)) was not significantly different when compared to S. cerevisiae BY4742 (0.51 (0.05)) (Figure 4B).
Ethanol and glycerol are two major primary metabolites produced during alcoholic fermentation of yeast and are important indicators of fermentation. The amount of ethanol produced by P. kudriazevii PSWCC102 (74.71 g/L) was not statistically different compared to S. cerevisiae BY4742 (74.29 g/L), but was significantly higher than ethanol levels produced by H. uvarum PSWCC70 (37.84 g/L), H. opuntiae PSWCC64 (52.90 g/L), P. kluyveri PSWCC62 (2.75 g/L), and A. pullulans PSWCC82 (32.11 g/L). However, there was no significant difference between glycerol production by S. cerevisiae BY4742, P. kluyveri PSWCC62, P. kudriazevii PSWCC102, and A. pullulans PSWCC82 (5.95~7.54 g/L) (Figure 5A). One aspect of wine quality relative to fermentation-derived nonvolatile metabolites are the types and levels of organic acids. Organic acids contribute to sourness, bitterness, and tartness of final wines [49]. Although present at low levels compared to ethanol, five organic acids were chosen for analysis of common acids present in inoculated fermentations. Specifically, P. kudriazevii PSWCC102 produced 1.90 0.69 g/L of malic acid and 0.810.06 g/L of acetic acid with no significant difference compared to S. cerevisiae BY4742. Concentration of tartaric acid decreased after fermentation by most of the yeast strains (0.29~0.54 g/L) and was significantly different compared to sterile juice (0.69 0.02 g/L). The control strain, BY4742 produced the highest amount of citric acid (0.20 0.003 g/L) followed by A. pullulans PSWCC82 (0.17 0.005 g/L). Hanseniaspora opuntiae PSWCC64 produced the highest amount of succinic acid (0.17 0.02 g/L) followed by S. cerevisiae BY4742 with no significant difference (Figure 5B).
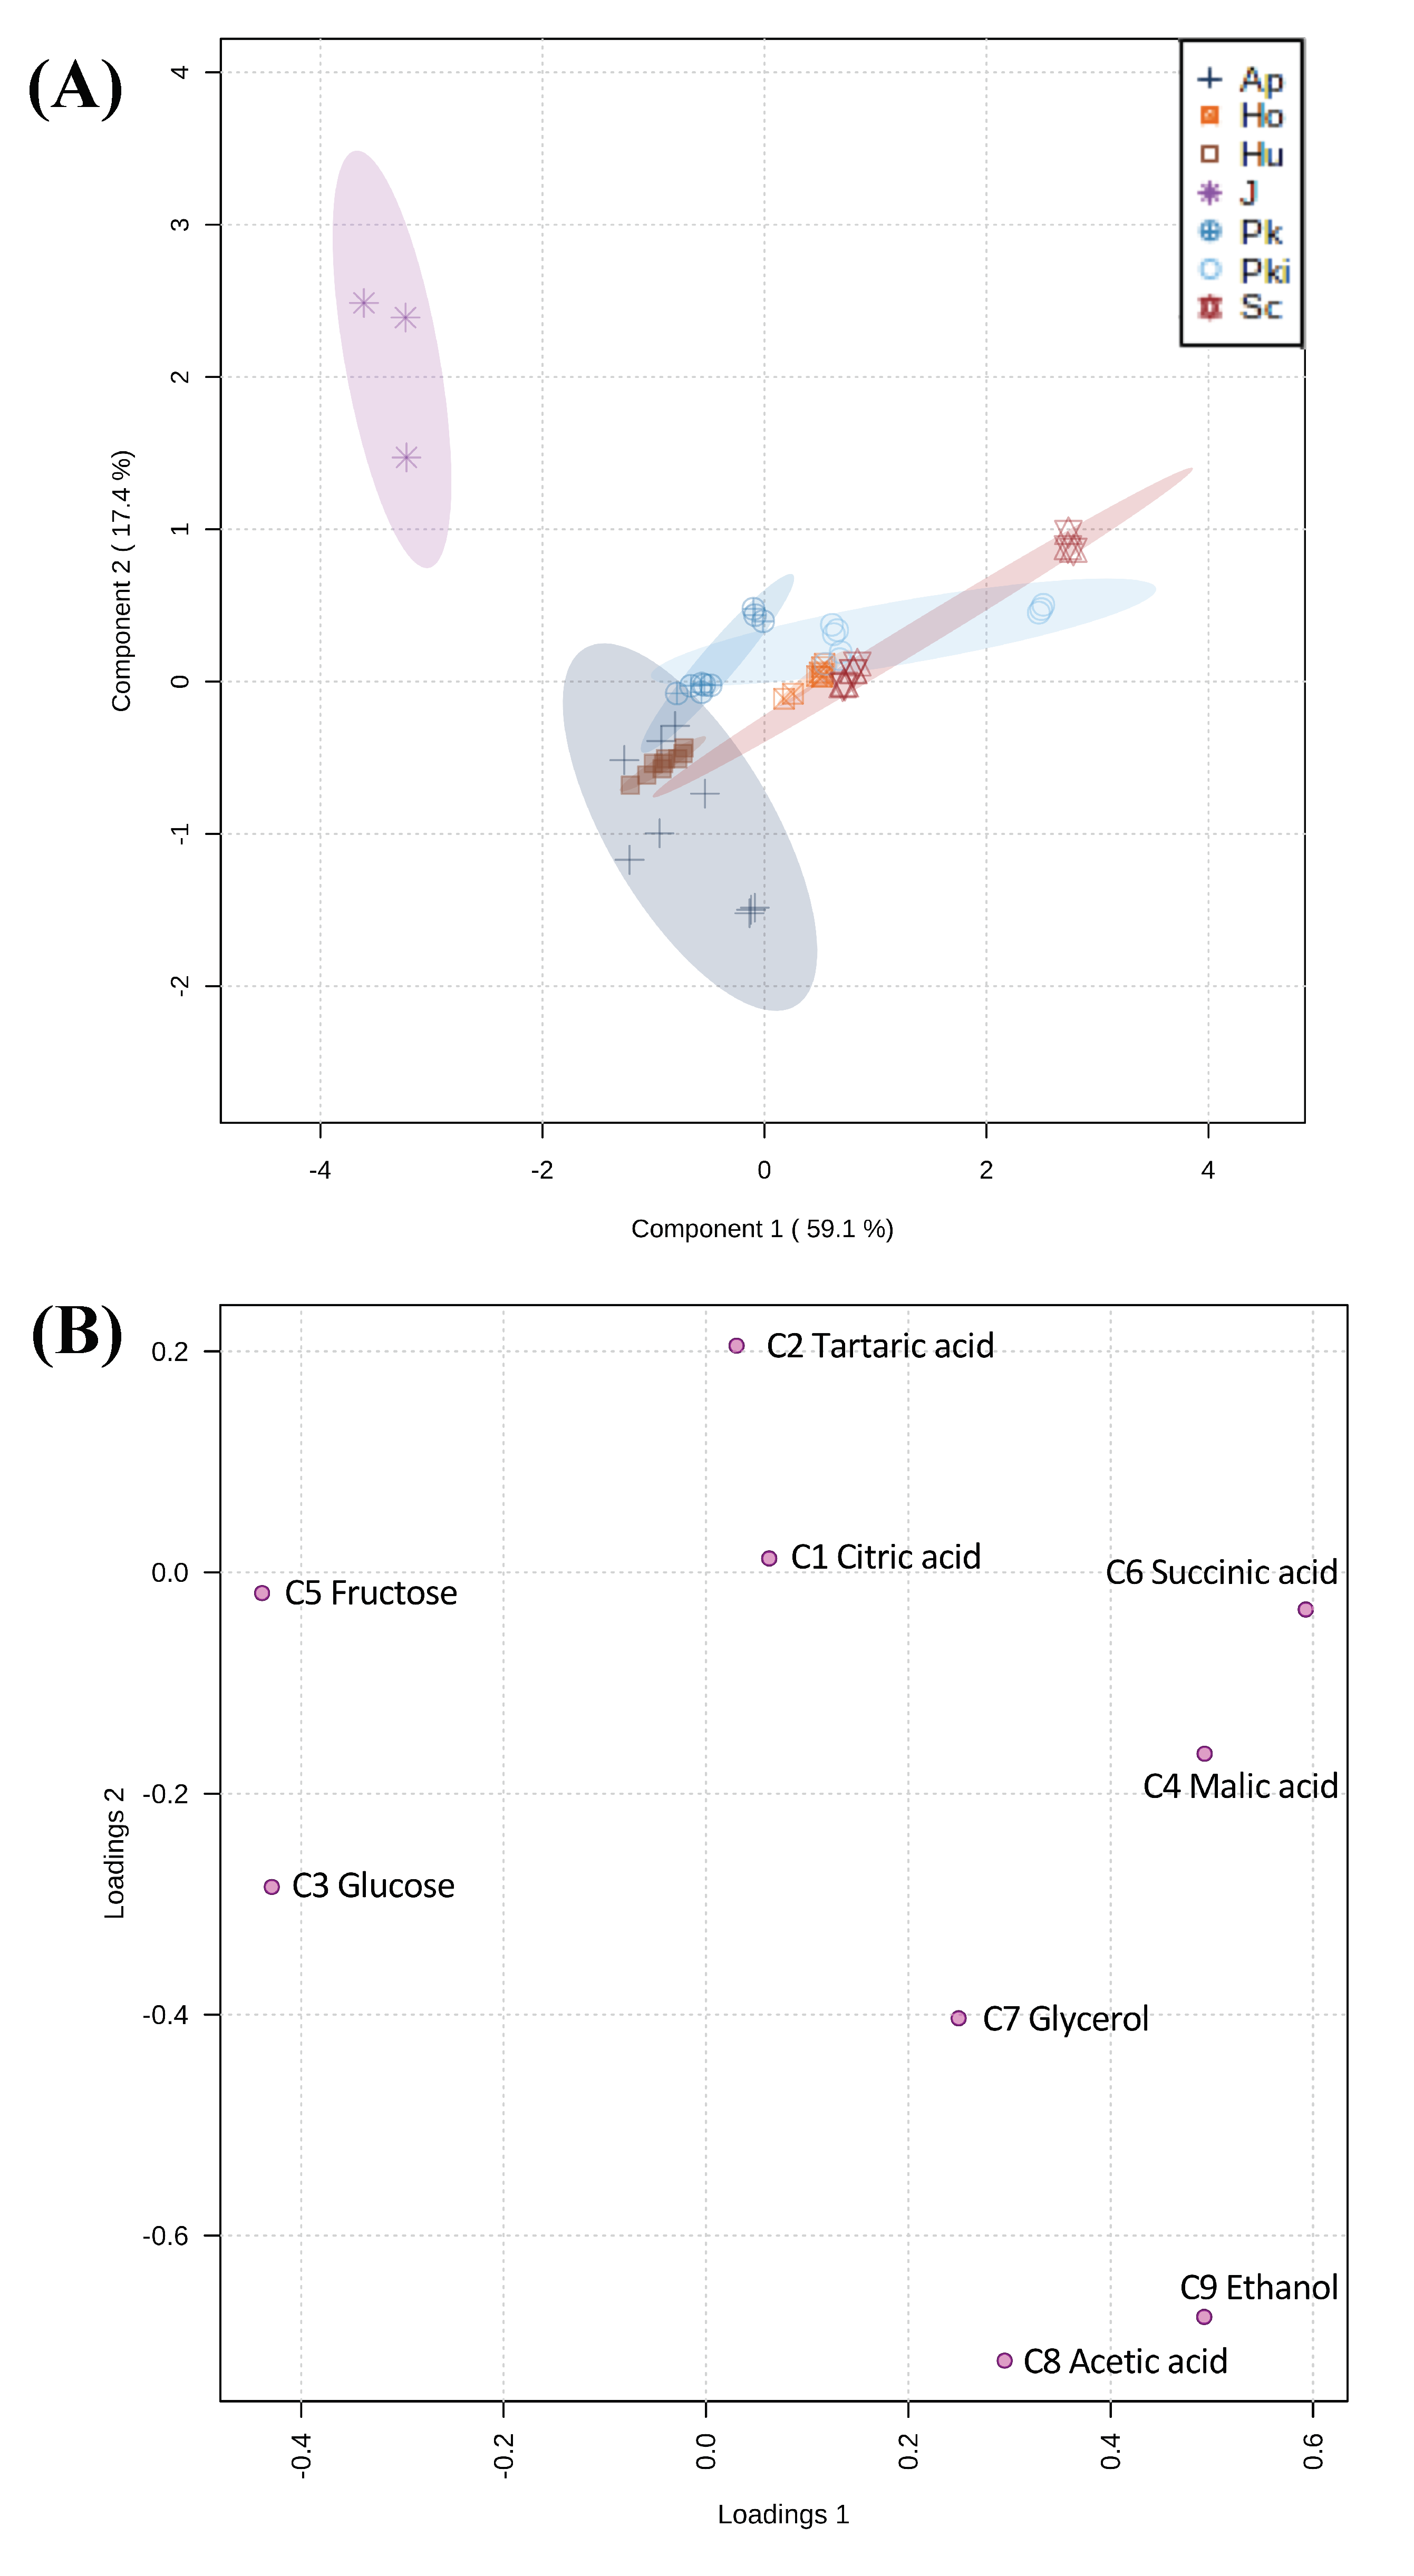
Partial least squares-discriminant analysis (PLS-DA) was used to identify how nine core nonvolatile compounds present in inoculated fermentations drive differentiation of candidate non-Saccharomyces yeast strains compared to S. cerevisiae. In PLS-DA score plot the first two components explained 76.5% of variance which separated experimental control (sterile juice) and inoculated fermentations (Figure 6A). Uninoculated juice was included in this analysis as a benchmark for comparison to ensure that the model system using Chambourcin sterile juice is reliable and reproducible to characterize candidate yeast strains for use in winemaking. The main compounds separating the samples analyzed in component 1 are glucose (C3) and fructose (C5) (negative loading), and malic acid (C4), succinic acid (C6), and ethanol (C9) (negative loading). In the case of PC2, tartaric acid (C2) was the major compound responsible for the separation between inoculated fermentations (Figure 6B).
3.4. Distinct Fermentation-Derived Volatile Metabolites Provide Insights into Unique Properties of Candidate Non-Saccharomyces Yeast from Chambourcin
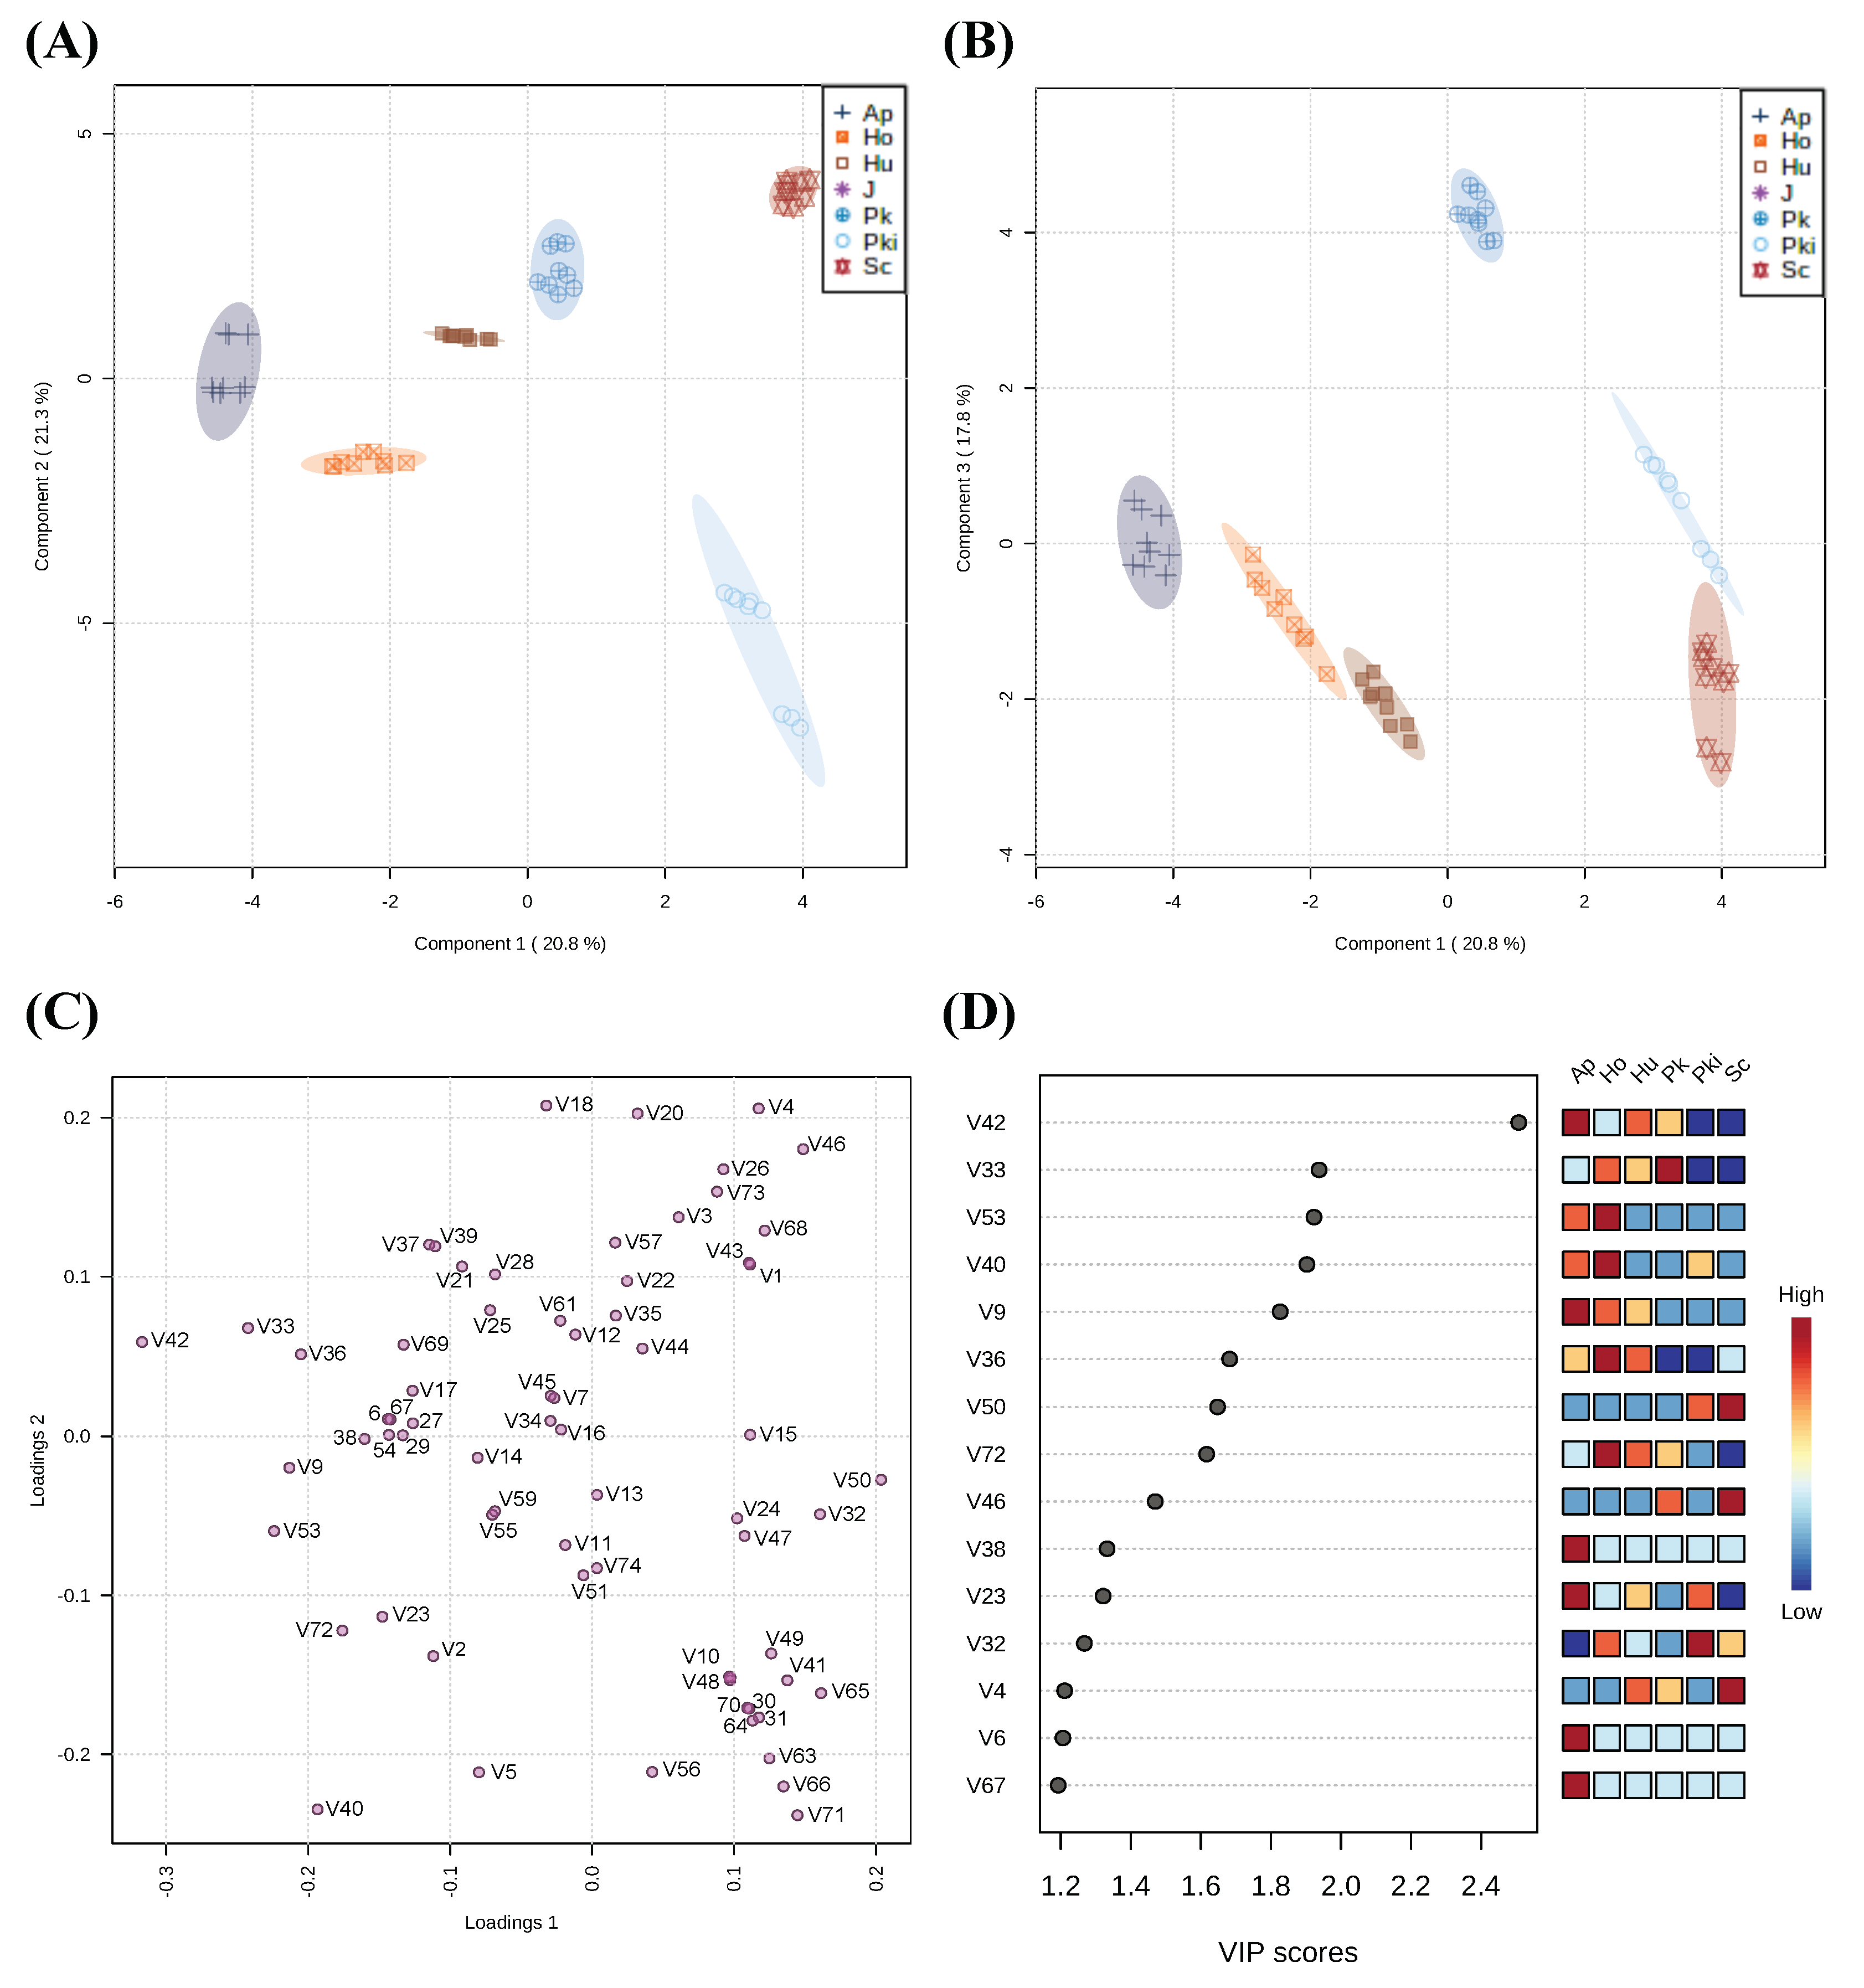
One aspect of wine quality is the contribution of fermentation-derived volatile compounds which can enhance sensory characteristics of final wine. Using GC-MS, 74 volatiles were identified when comparing sterile juice and inoculated fermentations and assigned to 11 classes based on their chemical structure (Figure S2). All 74 identified compounds were validated and included for further analysis (Table S2). Statistical differences of volatile compounds in inoculated fermentations are shown in Table S3. The correlation between volatile profiles and candidate yeast strains were analyzed by PLS-DA based on the identified volatile compounds. In total, 59.9% of the experimental variance was explained by the first three components, while components 1, 2 and 3 accounted for 20.8%, 21.3%, and 17.8%, respectively (Figure 7A–C). In the PLS-DA score plot, three components separated the inoculated fermentations into distinctive groups. Fifteen identified volatile compounds with the highest variable importance in projection (VIP) scores by PLS-DA can help explain volatile metabolome features driving separation between inoculated fermentations (Figure 7D). In this context, we interpret volatile compounds with high VIP scores as the most discriminant variables in PLS-DA. Here, we are most interested in features that differentiate candidate non-Saccharomyces fermentations compared to S. cerevisiae inoculated fermentations. For example, ionone (V42); 3-(methylthio)propyl acetate (V33); 2-heptanol (V9); 1-propanol, 3-(methylthio)- (V72); hexanoic acid, methyl ester (V23) were the most abundant compounds in inoculated fermentations with Hanseniaspora strains PSWCC64 and PSWCC70 but had low abundance in S. cerevisiae control strain. In addition, linalool (V53); acetoin (V40); acetyl valeryl (V38); 2-buten-1-ol, 3-methyl-, acetate (V6); 3(2H)-Thiophenone, dihydro-2-methyl- (V67) were also important features driving the differences of inoculated fermentation present with high intensity in A. pullulans but low intensity in S. cerevisiae control strain. On the contrary, two of the other important features, butanoic acid, 2-methyl- (V50) and octanoic acid, ethyl ester (V32), were present with high intensity in both P. kudriazevii and S. cerevisiae.
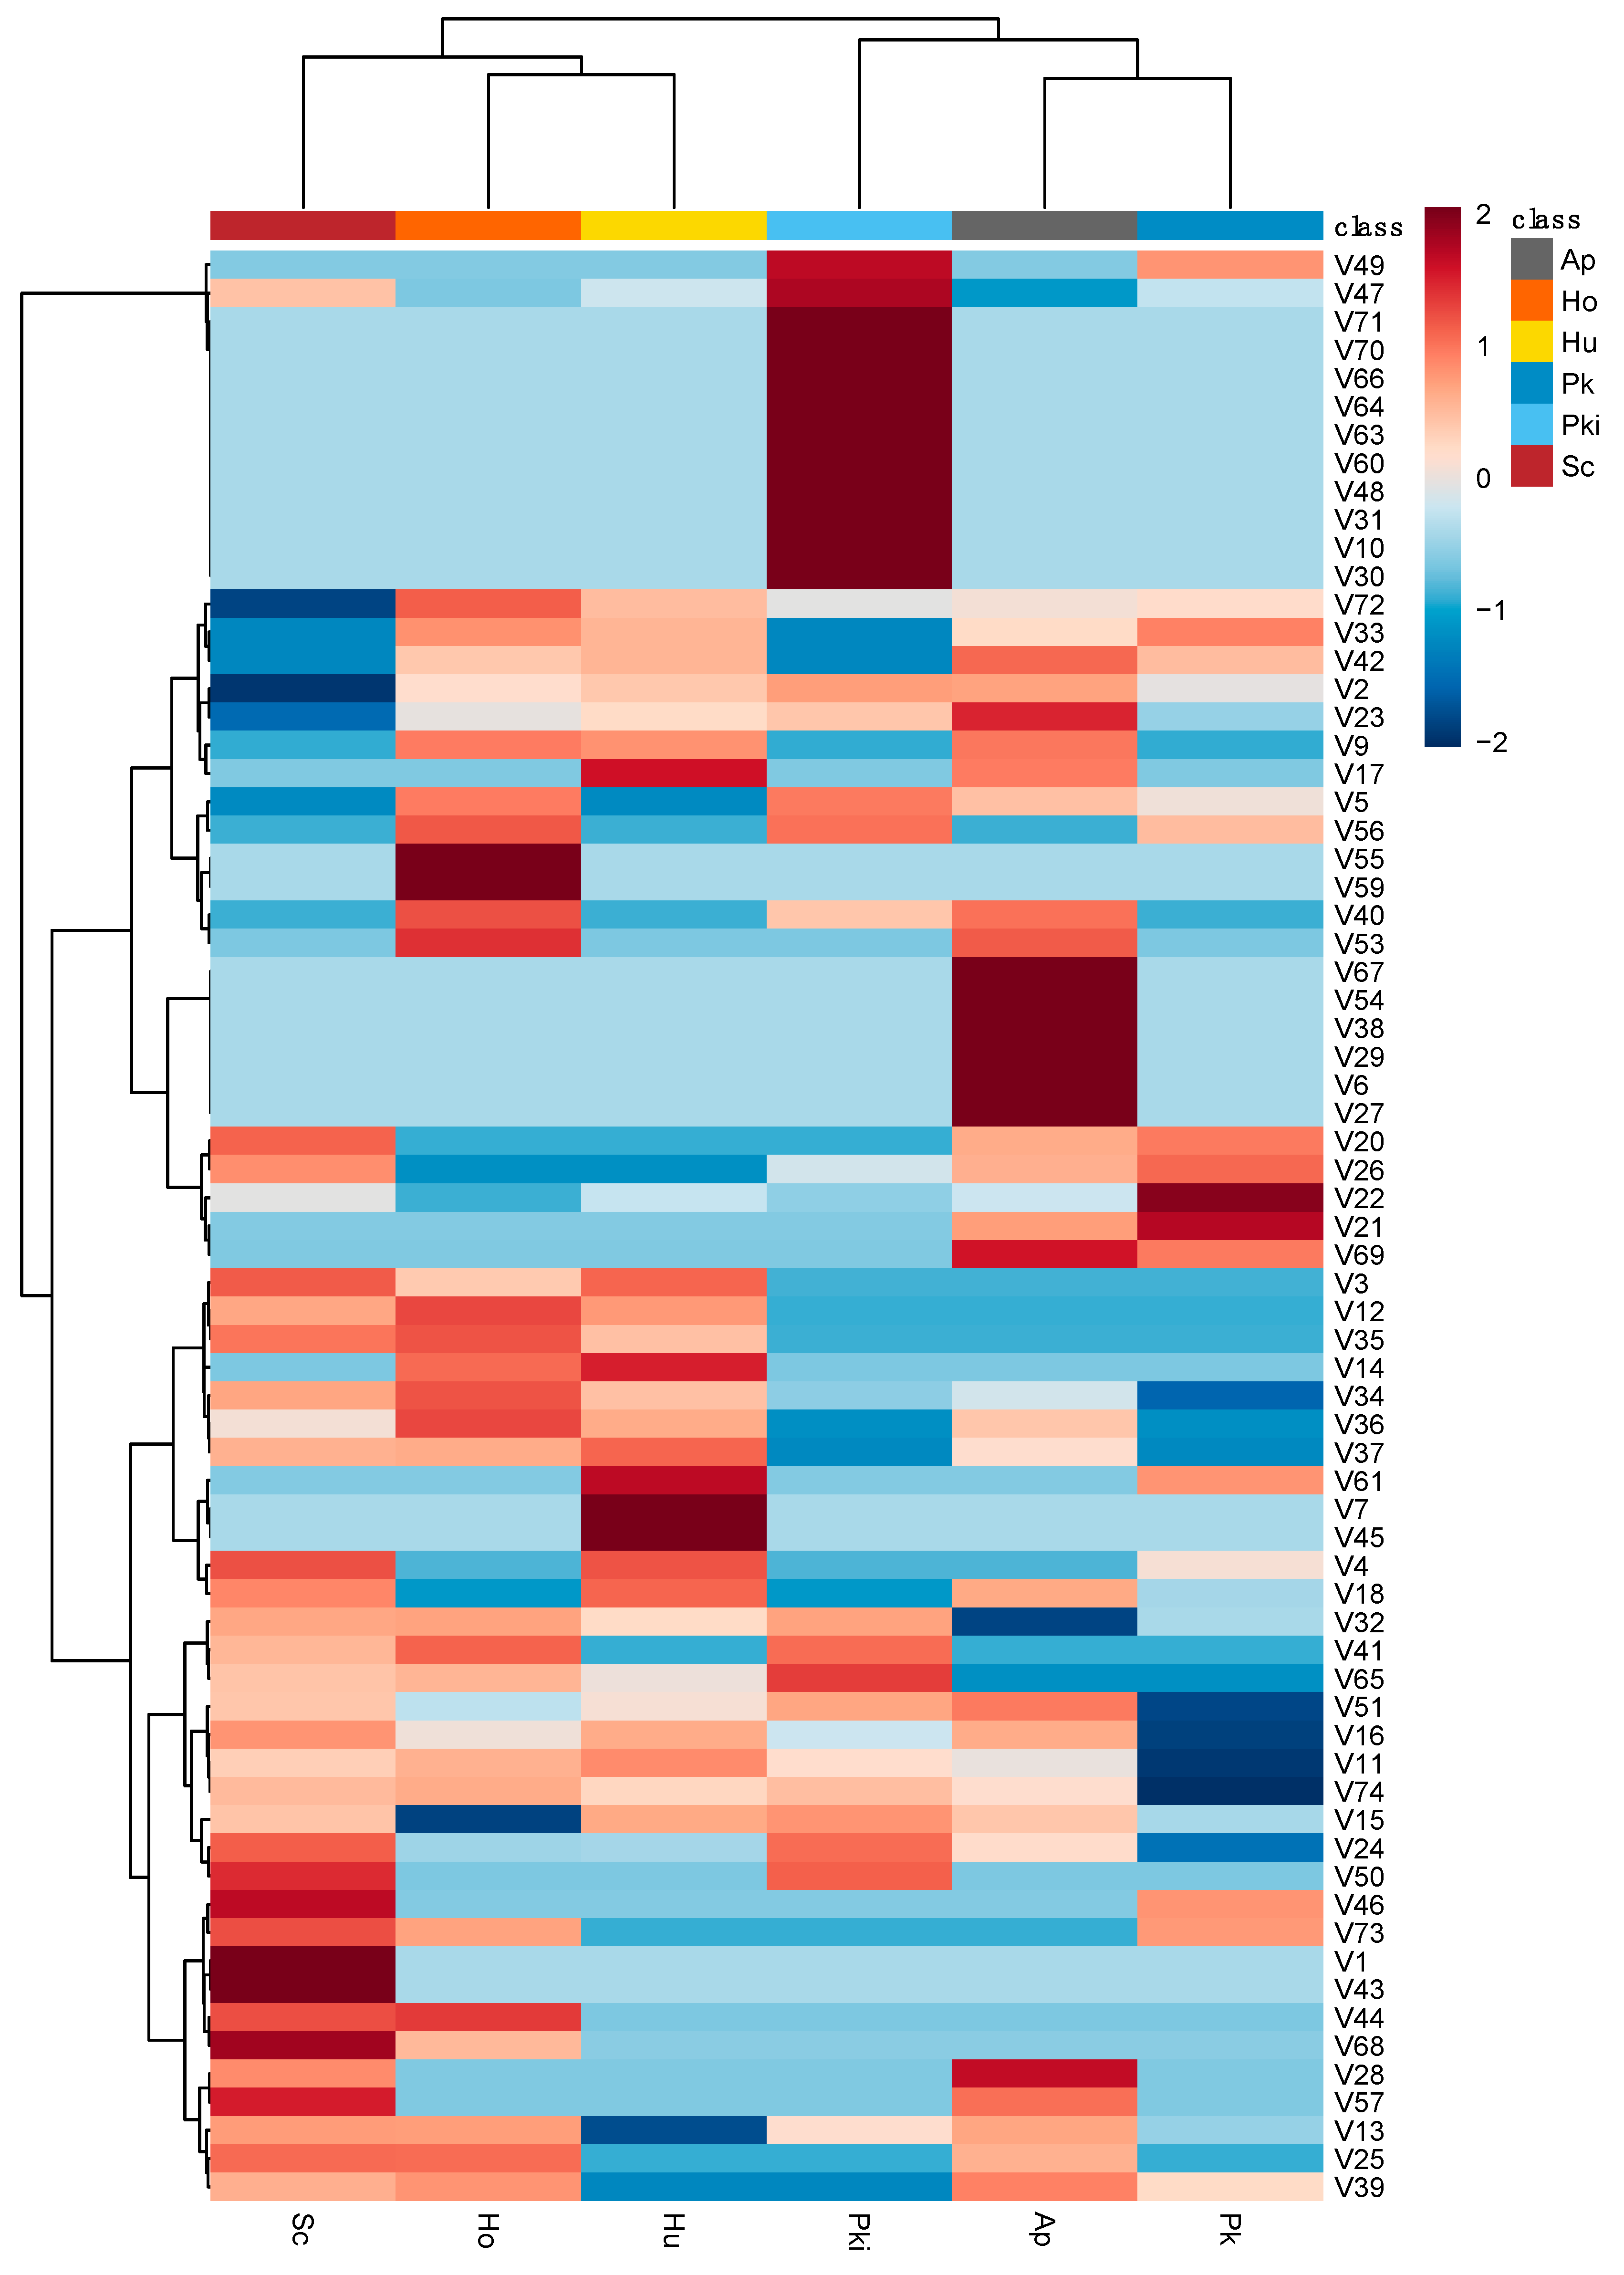
Next, we asked whether important features identified using the VIP scores plot were associated with particular strains or categories of metabolites. Based on Pearson’s correlation, we observed hierarchal clustering of 74 volatile metabolites against non-Saccharomyces strains compared to S. cerevisiae (Figure 8). Of particular interest is the group of metabolites associated with P. kudriazevii but not with other strains. Volatile metabolites associated with this cluster include 3-methyl-1-pentanol (V10); heptanoic acid, ethyl ester (V30); 2-hexenoic acid, ethyl ester (V31); propanoic acid, 2-methyl- (V47); butanoic acid (V48); butanoic acid, 3-methyl- (V49); benzaldehyde, 3-methyl- (V60); butane, 1-(1-ethoxyethoxy)- (V63); and butane, 1,1-diethoxy-3-methyl- (V64) was distinct compared to other strains. In addition, A. pullulans is associated with increased levels of 2-buten-1-ol, 3-methyl-, acetate (V6); 3-hexen-1-ol, acetate, (Z)- (V27); ethyl (S)-(-)-lactate (V29); acetyl valeryl (V38); L-à-terpineol (V54); 3(2H)-thiophenone, dihydro-2-methyl- (V67) in inoculated fermentations. The other distinct group of compounds, 1-pentanol, 4-methyl- (V7); 2-buten-1-one, 1-(2,6,6-trimethyl-1,3-cyclohexadien-1-yl)- (V45); benzaldehyde, 4-methyl- (V61) were positively correlated to H. uvarum. Pearson’s correlation of candidate strains with relative abundance of volatile metabolites from inoculated fermentation could provide a unique fingerprint to further explore different combinations of non-Saccharomyces yeast strains in sequential or coinoculation.
4. Discussion
Terroir is an expression in viticulture used to describe the unique contribution of regional features such as cultivar, vintage, and climate, that define wine sensory characteristics and product identity in a particular region. Although much is known about terroir relative to Vitis vinifera varieties, much is unknown about hybrid grapes. In this work, 29 species were identified from 120 isolates and distinct patterns of microbial composition in three PA vineyards were observed. In support of a parallel study on Chambourcin microbiome, these results highlight unique differences in microbial populations even within a small geographic area (radius about 90 km) [60]. In 15 vineyards across southern Australia (5–400 km part), distinct microbial profiles were found in environmental samples collected from soil, plant, must, and across fermentation stages [61]. Previous studies also demonstrate that microbial populations can impact wine quality [62]. For example, Starmerella bacillaris and Metschnikowia pulcherrima isolated from multiple regions of Italy were found to increase production of higher alcohols such as -phenylethyl alcohol corresponding to floral odor through coinoculation [12]. Kazachstania aerobia and K. servazzii in Shiraz grape must from southern Australia were found to have increased production of esters, such as phenylethyl acetate and isoamyl acetate associated to rose and fruity aroma [63]. These examples prompted us to ask whether microbial populations on Chambourcin hybrid grapes in PA vineyards can shape wine characteristics of the region.
Hanseniaspora spp. and Pichia spp. were the most dominant species identified during spontaneous fermentation of Chambourcin with relative abundances of 42% and 11% of total isolates, respectively (Figure 1 and Table S1). Previous studies have reported the dominance of Hanseniaspora and Pichia species on various grape varieties (i.e., V. vinifera, V. labrusca, and hybrid grapes), in grape must, and at early stages of fermentation [30,38,64,65,66]. The abundance of Hanseniaspora spp. and Pichia spp. appear as core non-Saccharomyces yeasts on wine grapes and could be related to nutrient availability of mature grape berries which supports fast growth of these species while suppressing other microorganisms [62]. In early stages of spontaneous fermentation, high abundance of H. uvarum, P. klyuveri, P. novergenisis, and P. guilliermondii were found on V. vinifera (Malbec), V. labrusca (Isabel and Bordeaux), and hybrid grapes (Zweigelt, cross between St. Laurent and Blaufränkisch) [65,66,67]. Therefore, our findings on the dominance of Hanseniaspora spp. and Pichia spp. further suggest these two species are the conserved components in microbial terroir of Chambourcin hybrid grapes.
Tolerance to sulfite and ethanol are two characteristics important in non-Saccharomyces strains for potential use in winemaking. In particular, P. kudriavzevii PSWCC102 can tolerate 10% (v/v) ethanol comparable to the control strain S. cerevisiae, whereas Hanseniaspora species PSWCC70 and PSWCC64 can tolerate up to 8% (v/v) ethanol. Several studies have indicated increased ethanol tolerance of up to 6% in some non-Saccharomyces yeasts such as H. guilliermondii and C. stellate [68]. Although there are fewer studies on mechanism of higher ethanol tolerance on non-Saccharomyces yeasts, increased ethanol tolerance in S. cerevisiae has been positively linked to the improvement of fermentation capacity and production of wine important flavor compounds [69,70]. Thus, it would be interesting in future studies to add H. uvarum PSWCC70, H. opuntiae PSWCC64, and P. kudriavzevii PSWCC102 in sequence or in combination with S. cerevisiae to assess improvement of flavor profile in wine fermentation.
Nonvolatile compounds typically contribute to production of conserved metabolites most easily perceived by sensory analysis of wines such as metabolites that contribute to the perception of sweetness, sourness, and mouthfeel (Figure 6). Previous study reported no more than 25% of tartaric acid degraded by S. cerevisiae and non-Saccharomyces species (Kloeckera, Candida, Schizosaccharomyces, and Hansenula spp.) which corresponds to our results except H. uvarum PSWCC70 [71]. The association between H. uvarum and degradation of tartaric acid could possibly be yeast strain using, for example, the carbon and energy source regardless of the presence of assimilable sugar [72]. Hanseniaspora opuntiae PSWCC64 producing higher concentration of succinic acid with no significant difference with S. cerevisiae control strain might indicate a larger proportion of fermented sugar was used for the production of succinic acid [73]. Moreover, the trend of acetic acid production by yeast strains was similar to the glycerol production as the production of these two compounds has been linked together. According to these results, although nonvolatile profiles by candidate strains were clustered with control strain on PLS-DA score plot, different productions of nonvolatile compounds indicated that non-Saccharomyces yeasts utilized fermented sugar differently in the metabolic pathway to S. cerevisiae.
One area of interest in winemaking is strain innovation. Previous works have demonstrated that fermentation-derived metabolites from non-Saccharomyces yeast can contribute to unique volatile characteristics of final wines. We hypothesize that non-Saccharomyces isolates from local wineries can enhance and preserve regionality of final wines. To this end, we used GC-MS coupled with statistical methods that enable visualization of important volatile metabolites that drive differences between candidate strains. Notable differences in volatile wine-associated profile between candidate non-Saccharomyces yeasts and control strain were demonstrated by PLS-DA and Pearson’s correlation. We were particularly interested in compounds that drive volatilome changes in non-Saccharomyces strains compared to BY4742 (Figure 7D). High VIP scores indicate important compounds positively correlated to Hanseniaspora strains PSWCC64 and PSWCC70 were 2-heptanol (V9) having fruity and herbaceous odor, ionone (V42) with floral and fruity odor, and 1-propanol, 3-(methylthio)-(V72) preserved odor of cauliflower and potato, which were negatively correlated to S. cerevisiae BY4742 [74,75,76,77]. This demonstrated the potential of candidate strains in winemaking to increase the complexity of wine aroma which Saccharomyces yeasts were less capable of contributing to wines. Of particular interest in this study, P. kudriazevii PSWCC102 positively correlates with a group of volatiles which is negatively correlated to other candidate strains. This included esters and acetals, such as heptanoic acid, ethyl ester (V30), 2-hexenoic acid, ethyl ester (V31), butane, 1-(1-ethoxyethoxy)- (V63), benzaldehyde, 3-methyl- (V60), and butane, 1,1-diethoxy-3-methyl- (V64) having pleasant fruity and herbaceous aroma [78,79,80,81]. In addition, P. kudriavzevii PSWCC102 demonstrates ethanol tolerance (10%) comparable to S. cerevisiae control strain. Therefore, P. kudriazevii PSWCC102 could be a potential candidate for future studies that investigate the sequential or coinoculation of P. kudriasevii during winemaking and production of fruity aroma compounds that are unique to the strain. Others have shown that sequential or coinoculation of non-Saccharomyces yeasts with S. cerevisiae has been demonstrated to increase complexity of wine-important volatiles and sensory qualities [82,83,84,85]. Conducting sensory analysis is also valuable to understand whether cofermentation could positively influence the sensory qualities and consumer preferences by considering the attributes of taste, flavor, mouthfeel, and color.
5. Conclusions
Our investigations on candidate strains isolated from local PA vineyards suggest the potential of non-Saccharomyces yeasts in winemaking based on the unique fermentation characteristics. Two candidate strains, Hanseniaspora opuntiae PSWCC64 and Pichia kudriavzevii PSWCC102 demonstrated relatively high tolerance to ethanol at 8–10% as well as the ability to produce volatile metabolites associated with flowery and fruity aroma which was negatively correlated to S. cerevisiae BY4742 control strain. This study provides an exciting step to incorporate non-Saccharomyces yeasts within winemaking of hybrid grapes to enhance regional characteristics and quality of hybrid grapes. Other isolated strains in our collection constitutes a valuable source for more microbiological, evolutionary, and ecological studies to provide more beneficial knowledge to the Pennsylvania Wine Industry and fortify the interest in the novel non-Saccharomyces yeasts as the wine starters.
Supplementary Materials
The following are available online at https://0-www-mdpi-com.brum.beds.ac.uk/2311-5637/7/1/15/s1, Figure S1: Fermentation kinetics of candidate non-Saccharomyces strains compared with control S. cerevisiae BY4742 inoculated into sterile juice. Figure S2. Volatile compounds in sterile juice and inoculated fermentations grouped based on chemical structures. Table S1. Fungal species identified from spontaneously fermenting Chambourcin grapes isolated from three Pennsylvania vineyards at 0 and 24 h combined by number of species and relative abundance (%). Table S2. List of volatiles detected in sterile juice and inoculated fermentations with candidate non-Saccharomyces strains and S. cerevisiae BY4742 with mean retention time (RT) and Kovats retention indices (RI). Table S3. Volatile compounds with significant difference (ANOVA, FDR-adjusted p-value < 0.05) across inoculated fermentations with candidate yeast strains. Data shown here were after normalization by control group, S. cerevisiae BY4742.
Author Contributions
Conceptualization and methodology, C.T.F., X.D., and J.W.; validation, formal analysis, and investigation, C.T.F.; resources, J.W.; data curation and visualization, C.T.F. and J.W.; writing—original draft preparation, C.T.F.; writing—review and editing, X.D. and J.W.; supervision, project administration and funding acquisition, J.W. All authors have read and agreed to the published version of the manuscript.
Funding
This research was funded by U.S. Department of Agriculture National Institute of Food and Agriculture and Hatch Appropriations under Project #PEN04699 and Accession #1019351 and the Crouch Endowment for Viticulture, Enology, and Pomology Research.
Institutional Review Board Statement
Not applicable to this study.
Informed Consent Statement
Not applicable to this study.
Data Availability Statement
The data presented in this study are available in article: ITS sequences for this study have been deposited into NCBI (#Accession MW301459-MW301578).
Acknowledgments
The authors acknowledge and thank the generous support and participation of Pennsylvania wineries (Happy Valley Vineyards and Winery, Shade Mountain Winery and Vineyards, and Nissley Vineyards and Winery) during experimental design, sample collection, and handling. Technical expertise and training related to UHPLC analysis was conducted with the help of Ashik Sathish (CSL Behring Fermentation Facility). The authors also acknowledge the technical expertise of Helene Hopfer and Hung Li Wang with GC-MS analysis.
Conflicts of Interest
The authors declare no conflict of interest and the funders had no role in the design of the study; in the collection, analyses, or interpretation of data; in the writing of the manuscript, or in the decision to publish the results.
References
- Legras, J.-L.; Merdinoglu, D.; Cornuet, J.-M.; Karst, F. Bread, Beer and Wine: Saccharomyces Cerevisiae Diversity Reflects Human History. Mol. Ecol. 2007, 16, 2091–2102. [Google Scholar] [CrossRef] [PubMed]
- Johnson, E.A.; Echavarri-Erasun, C. Yeast Biotechnology. In The Yeasts; Elsevier: Amsterdam, The Netherlands, 2011; Volume 1, pp. 21–44. ISBN 9780444521491. [Google Scholar]
- Contreras, A.; Hidalgo, C.; Henschke, P.A.; Chambers, P.J.; Curtin, C.; Varela, C. Evaluation of Non-Saccharomyces Yeasts for the Reduction Of Alcohol Content in Wine. Appl. Environ. Microbiol. 2014, 80, 1670–1678. [Google Scholar] [CrossRef] [PubMed] [Green Version]
- Lemos Junior, W.J.F.; Nadai, C.; Crepalde, L.T.; De Oliveira, V.S.; De Matos, A.D.; Giacomini, A.; Corich, V. Potential Use of Starmerella Bacillaris as Fermentation Starter for the Production of Low-Alcohol Beverages Obtained from Unripe Grapes. Int. J. Food Microbiol. 2019, 303, 1–8. [Google Scholar] [CrossRef] [PubMed]
- Gamero, A.; Quintilla, R.; Groenewald, M.; Alkema, W.; Boekhout, T.; Hazelwood, L. High-Throughput Screening of a Large Collection of Non-Conventional Yeasts Reveals Their Potential for Aroma Formation in Food Fermentation. Food Microbiol. 2016, 60, 147–159. [Google Scholar] [CrossRef] [PubMed]
- Escribano-Viana, R.; González-Arenzana, L.; Portu, J.; Garijo, P.; López-Alfaro, I.; López, R.; Santamaría, P.; Gutiérrez, A.R. Wine Aroma Evolution Throughout Alcoholic Fermentation Sequentially Inoculated with Non- Saccharomyces/Saccharomyces Yeasts. Food Res. Int. 2018, 112, 17–24. [Google Scholar] [CrossRef]
- Chen, K.; Escott, C.; Loira, I.; Del Fresno, J.M.; Morata, A.; Tesfaye, W.; Calderon, F.; Suárez-Lepe, J.A.; Han, S.; Benito, S. Use of Non-Saccharomyces Yeasts and Oenological Tannin in Red Winemaking: Influence on Colour, Aroma and Sensorial Properties of Young Wines. Food Microbiol. 2018, 69, 51–63. [Google Scholar] [CrossRef]
- Contreras, A.; Hidalgo, C.; Schmidt, S.; Henschke, P.A.; Curtin, C.; Varela, C. The Application of Non-Saccharomyces Yeast in Fermentations with Limited Aeration as a Strategy for the Production of Wine with Reduced Alcohol Content. Int. J. Food Microbiol. 2015, 205, 7–15. [Google Scholar] [CrossRef]
- Goold, H.D.; Kroukamp, H.; Williams, T.C.; Paulsen, I.T.; Varela, C.; Pretorius, I.S. Yeast’s Balancing Act Between Ethanol And Glycerol Production In Low-Alcohol Wines. Microb. Biotechnol. 2017, 10, 264–278. [Google Scholar] [CrossRef]
- Tristezza, M.; Tufariello, M.; Capozzi, V.; Spano, G.; Mita, G.; Grieco, F. The Oenological Potential of Hanseniaspora Uvarum In Simultaneous And Sequential Co-Fermentation With Saccharomyces Cerevisiae For Industrial Wine Production. Front. Microbiol. 2016, 7, 670. [Google Scholar] [CrossRef] [Green Version]
- Englezos, V.; Torchio, F.; Cravero, F.; Marengo, F.; Giacosa, S.; Gerbi, V.; Rantsiou, K.; Rolle, L.; Cocolin, L. Aroma Profile And Composition Of Barbera Wines Obtained By Mixed Fermentations Of Starmerella Bacillaris (Synonym Candida Zemplinina) And Saccharomyces Cerevisiae. LWT Food Sci. Technol. 2016, 73, 567–575. [Google Scholar] [CrossRef]
- Binati, R.L.; Lemos Junior, W.J.F.; Luzzini, G.; Slaghenaufi, D.; Ugliano, M.; Torriani, S. Contribution Of Non-Saccharomyces Yeasts To Wine Volatile And Sensory Diversity: A Study On Lachancea Thermotolerans, Metschnikowia Spp. And Starmerella Bacillaris Strains Isolated In Italy. Int. J. Food Microbiol. 2020, 318, 108470. [Google Scholar] [CrossRef] [PubMed]
- Jackson, R.S. Chemical Constituents of Grapes and Wine. In Wine Science; Elsevier: Amsterdam, The Netherlands, 2014; pp. 347–426. [Google Scholar]
- Vaudano, E.; Quinterno, G.; Costantini, A.; Pulcini, L.; Pessione, E.; Garcia-Moruno, E. Yeast Distribution In Grignolino Grapes Growing In A New Vineyard In Piedmont And The Technological Characterization Of Indigenous Saccharomyces spp. Strains. Int. J. Food Microbiol. 2019, 289, 154–161. [Google Scholar] [CrossRef] [PubMed] [Green Version]
- Fleet, G.H. Wine Yeasts For The Future. In Proceedings of the Fems Yeast Research; Oxford Academic: Oxford, UK, 2008; Volume 8, pp. 979–995. [Google Scholar]
- Jones, N.K. The Influence of Recent Climate Change on Wine Regions in Quebec, Canada. J. Wine Res. 2012, 23, 103–113. [Google Scholar] [CrossRef]
- Pedneault, K.; Provost, C. Fungus Resistant Grape Varieties as a Suitable Alternative for Organic Wine Production: Benefits, Limits, and Challenges. Sci. Hortic. (Amst.) 2016, 208, 57–77. [Google Scholar] [CrossRef]
- Ghareib, M.; Youssef, K.A.; Khalil, A.A. Ethanol Tolerance of Saccharomyces Cerevisiae and Its Relationship to Lipid Content and Composition. Folia Microbiol. 1988, 33, 447–452. [Google Scholar] [CrossRef]
- Cray, J.A.; Bell, A.N.W.; Bhaganna, P.; Mswaka, A.Y.; Timson, D.J.; Hallsworth, J.E. The Biology of Habitat Dominance; Can Microbes Behave As Weeds? Microb. Biotechnol. 2013, 6, 453–492. [Google Scholar] [CrossRef] [Green Version]
- Brown, S.W.; Oliver, S.G.; Harrison, D.E.F.; Righelato, R.C. Ethanol Inhibition of Yeast Growth and Fermentation: Differences in the Magnitude and Complexity of the Effect. Eur. J. Appl. Microbiol. Biotechnol. 1981, 11, 151–155. [Google Scholar] [CrossRef]
- Aguilera, F.; Peinado, R.A.; Millán, C.; Ortega, J.M.; Mauricio, J.C. Relationship Between Ethanol Tolerance, H+-Atpase Activity And The Lipid Composition Of The Plasma Membrane In Different Wine Yeast Strains. Int. J. Food Microbiol. 2006, 110, 34–42. [Google Scholar] [CrossRef]
- Zhang, Q.; Wu, D.; Lin, Y.; Wang, X.; Kong, H.; Tanaka, S. Substrate and Product Inhibition on Yeast Performance in Ethanol Fermentation. Energy Fuels 2015, 29, 1019–1027. [Google Scholar] [CrossRef]
- Lopez, E.F.; Gomez, E.F. Simultaneous Determination of the Major Organic Acids, Sugars, Glycerol, and Ethanol by Hplc in Grape Musts and White Wines. J. Chromatogr. Sci. 2013, 34, 254–257. [Google Scholar] [CrossRef] [Green Version]
- Rapp, A.; Mandery, H. Wine Aroma. Experientia 1986, 42, 873–884. [Google Scholar] [CrossRef]
- Styger, G.; Prior, B.; Bauer, F.F. Wine Flavor and Aroma. J. Ind. Microbiol. Biotechnol. 2011, 38, 1145–1159. [Google Scholar] [CrossRef] [PubMed]
- Padilla, B.; Gil, J.V.; Manzanares, P. Past And Future Of Non-Saccharomyces Yeasts: From Spoilage Microorganisms To Biotechnological Tools For Improving Wine Aroma Complexity. Front. Microbiol. 2016, 7, 411. [Google Scholar] [CrossRef] [PubMed] [Green Version]
- Ebeler, S.E.; Thorngate, J.H. Wine Chemistry and Flavor: Looking Into the Crystal Glass. J. Agric. Food Chem. 2009, 57, 8098–8108. [Google Scholar] [CrossRef] [PubMed]
- General Industry Stats. United States Wine and Grape Industry FAQS|Wineamerica. International Association of America Wineries. 2019. Available online: https://Wineamerica.Org/Policy/By-The-Numbers/ (accessed on 18 September 2020).
- Pennsylvania Winery Association. About Pennsylvania Wines—Pennsylvania Wines. 2020. Available online: Https://Pennsylvaniawine.Com/About/ (accessed on 18 September 2020).
- Raymond Eder, M.L.; Reynoso, C.; Lauret, S.C.; Rosa, A.L. Isolation and Identification of the Indigenous Yeast Population during Spontaneous Fermentation of Isabella (Vitis Labrusca L.) Grape Must. Front. Microbiol. 2017, 8, 532. [Google Scholar] [CrossRef] [Green Version]
- Smith, N.R.; Dawson, V.T. The Bacteriostatic Action of Rose Bengal in Media Used For Plate Counts of Soil Fungi. Soil Sci. 1944, 58, 467–472. [Google Scholar] [CrossRef]
- Salfinger, Y.; Tortorello, M.L. Compendium of Methods for the Microbiological Examination of Foods; American Public Health Association: Washington, DC, USA, 2013. [Google Scholar]
- Henson, O.E. Dichloran as an Inhibitor of Mold Spreading In Fungal Plating Media: Effects on Colony Diameter and Enumeration. Appl. Environ. Microbiol. 1981, 42, 656–660. [Google Scholar] [CrossRef] [Green Version]
- Dobrowolski, P. Short protocols in molecular biology. A compendium of methods from “current protocols in molecular biology”. edited by Frederick, M. Ausubel et al., John Wiley & Sons, 1992., ISBN 0-471-57735-9. Acta Biotechnologica. 1993, 13, 88. [Google Scholar]
- Schoch, C.L.; Seifert, K.A.; Huhndorf, S.; Robert, V.; Spouge, J.L.; Levesque, C.A.; Chen, W.; Consortium, F.B. Nuclear Ribosomal Internal Transcribed Spacer (Its) Region As A Universal Dna Barcode Marker For Fungi. Proc. Natl. Acad. Sci. USA 2012, 109, 6241–6246. [Google Scholar] [CrossRef] [Green Version]
- Zabukovec, P.; Čadež, N.; Čuš, F. Isolation and Identification of Indigenous Wine Yeasts and Their Use in Alcoholic Fermentation. Food Technol. Biotechnol. 2020, 58, 337–347. [Google Scholar] [CrossRef]
- White, T.; Bruns, T.; Lee, S.; Taylor, J. Amplification and Direct Sequencing of Fungal Ribosomal RNA Genes for Phylogenetics. In PCR Protocols: A Guide to Methods and Applications; Mycological Society of America: Albuquerque, NM, USA, 1990; Volume 18, pp. 315–322. [Google Scholar]
- Brysch-Herzberg, M.; Seidel, M. Yeast Diversity on Grapes in Two German Wine Growing Regions. Int. J. Food Microbiol. 2015, 214, 137–144. [Google Scholar] [CrossRef] [PubMed]
- Crous, P.W.; Gams, W.; Stalpers, J.A.; Robert, V.; Stegehuis, G. Mycobank: An Online Initiative to Launch Mycology into the 21st Century. Stud. Mycol. 2004, 50, 19–22. [Google Scholar]
- Kumar, S.; Stecher, G.; Li, M.; Knyaz, C.; Tamura, K. Mega X: Molecular Evolutionary Genetics Analysis across Computing Platforms. Mol. Biol. Evol. 2018, 35, 1547–1549. [Google Scholar] [CrossRef]
- Stecher, G.; Tamura, K.; Kumar, S. Molecular Evolutionary Genetics Analysis (Mega) For Macos. Mol. Biol. Evol. 2020, 37, 1237–1239. [Google Scholar] [CrossRef] [PubMed]
- Edgar, R.C. Muscle: Multiple Sequence Alignment with High Accuracy and High Throughput. Nucleic Acids Res. 2004, 32, 1792–1797. [Google Scholar] [CrossRef] [Green Version]
- Buehler, A.J.; Evanowski, R.L.; Martin, N.H.; Boor, K.J.; Wiedmann, M. Internal Transcribed Spacer (Its) Sequencing Reveals Considerable Fungal Diversity in Dairy Products. J. Dairy Sci. 2017, 100, 8814–8825. [Google Scholar] [CrossRef]
- Tofalo, R.; Schirone, M.; Torriani, S.; Rantsiou, K.; Cocolin, L.; Perpetuini, G.; Suzzi, G. Diversity of Candida Zemplinina Strains From Grapes And Italian Wines. Food Microbiol. 2012, 29, 18–26. [Google Scholar] [CrossRef]
- Englezos, V.; Rantsiou, K.; Torchio, F.; Rolle, L.; Gerbi, V.; Cocolin, L. Exploitation of the Non-Saccharomyces Yeast Starmerella Bacillaris (Synonym Candida Zemplinina) In Wine Fermentation: Physiological and Molecular Characterizations. Int. J. Food Microbiol. 2015, 199, 33–40. [Google Scholar] [CrossRef]
- Capece, A.; Siesto, G.; Romaniello, R.; Lagreca, V.M.; Pietrafesa, R.; Calabretti, A.; Romano, P. Assessment Of Competition In Wine Fermentation Among Wild Saccharomyces Cerevisiae Strains Isolated From Sangiovese Grapes In Tuscany Region. LWT Food Sci. Technol. 2013, 54, 485–492. [Google Scholar] [CrossRef]
- Maturano, Y.P.; Mestre, M.V.; Kuchen, B.; Toro, M.E.; Mercado, L.A.; Vazquez, F.; Combina, M. Optimization Of Fermentation-Relevant Factors: A Strategy To Reduce Ethanol In Red Wine By Sequential Culture Of Native Yeasts. Int. J. Food Microbiol. 2019, 289, 40–48. [Google Scholar] [CrossRef]
- Threlfall, R.; Main, G.; Morris, J. Effect of Freezing Grape Berries and Heating Must Samples on Extraction of Components and Composition Parameters of Red Wine Grape Varieties. Aust. J. Grape Wine Res. 2006, 12, 161–169. [Google Scholar] [CrossRef]
- Chidi, B.S.; Rossouw, D.; Buica, A.S.; Bauer, F.F. Determining The Impact Of Industrial Wine Yeast Strains On Organic Acid Production Under White And Red Wine-Like Fermentation Conditions. S. Afr. J. Enol. Vitic. 2015, 36, 316–327. [Google Scholar] [CrossRef] [Green Version]
- Pedneault, K.; Dorais, M.; Angers, P. Flavor of Cold-Hardy Grapes: Impact of Berry Maturity and Environmental Conditions. J. Agric. Food Chem. 2013, 61, 10418–10438. [Google Scholar] [CrossRef] [PubMed]
- Fenoll, J.; Manso, A.; Hellín, P.; Ruiz, L.; Flores, P. Changes In The Aromatic Composition Of The Vitis Vinifera Grape Muscat Hamburg During Ripening. Food Chem. 2009, 114, 420–428. [Google Scholar] [CrossRef]
- Bromba, M.U.A.; Ziegler, H. Application Hints for Savitzky-Holay Digital Smoothing Filters. Anal. Chem. 1981, 53, 1583–1586. [Google Scholar] [CrossRef]
- Wenig, P.; Odermatt, J. Openchrom: A Cross-Platform Open Source Software for the Mass Spectrometric Analysis of Chromatographic Data; BMC Bioinformatics: Hamburg, Germany, 2010. [Google Scholar]
- Schafer, R.W. What Is A Savitzky-Golay Filter? IEEE Signal Process. Mag. 2011, 28, 111–117. [Google Scholar] [CrossRef]
- Johnsen, L.G.; Skou, P.B.; Khakimov, B.; Bro, R. Gas Chromatography—Mass Spectrometry Data Processing Made Easy. J. Chromatogr. A 2017, 1503, 57–64. [Google Scholar] [CrossRef]
- Field, A. Discovering Statistics Using Ibm Spss Statistics; SAGE Publications Ltd.: Thousand Oaks, CA, USA, 2013; pp. 1–816. [Google Scholar]
- Chong, J.; Wishart, D.S.; Xia, J. Using Metaboanalyst 4.0 for Comprehensive and Integrative Metabolomics Data Analysis. Curr. Protoc. Bioinform. 2019, 68, e86. [Google Scholar] [CrossRef]
- Van Den Berg, R.A.; Hoefsloot, H.C.J.; Westerhuis, J.A.; Smilde, A.K.; Van Der Werf, M.J. Centering, Scaling, And Transformations: Improving The Biological Information Content Of Metabolomics Data. Bmc Genom. 2006, 7, 142. [Google Scholar] [CrossRef] [Green Version]
- Manachini, P.L.; Parini, C.; Fortina, M.G. Pectic Enzymes from Aureobasidium Pullulans Lv 10. Enzyme Microb. Technol. 1988, 10, 682–685. [Google Scholar] [CrossRef]
- Wang, H.L. Characterization of Microbial Dynamics and Volatile Metabolome Changes during Fermentation of Chambourcin Grapes in Two Pennsylvania Regions. Master Thesis, The Pennsylvania State University, The Graduate School, State College, PA, USA, 2020. [Google Scholar]
- Liu, D.; Chen, Q.; Zhang, P.; Chen, D.; Howell, K.S. The Fungal Microbiome Is An Important Component Of Vineyard Ecosystems And Correlates With Regional Distinctiveness Of Wine. Msphere 2020, 5, e00534-20. [Google Scholar] [CrossRef] [PubMed]
- Barata, A.; Malfeito-Ferreira, M.; Loureiro, V. The Microbial Ecology of Wine Grape Berries. Int. J. Food Microbiol. 2012, 153, 243–259. [Google Scholar] [CrossRef] [PubMed]
- Lin, M.M.H.; Boss, P.K.; Walker, M.E.; Sumby, K.M.; Grbin, P.R.; Jiranek, V. Evaluation Of Indigenous Non-Saccharomyces Yeasts Isolated From A South Australian Vineyard For Their Potential As Wine Starter Cultures. Int. J. Food Microbiol. 2020, 312, 108373. [Google Scholar] [CrossRef] [PubMed]
- Baffi, M.A.; Dos Santos Bezerra, C.; Arévalo-Villena, M.; Isabel Briones-Pérez, A.; Gomes, E.; Da Silva, R. Isolation And Molecular Identification Of Wine Yeasts From A Brazilian Vineyard. Ann. Microbiol. 2011, 61, 75–78. [Google Scholar] [CrossRef]
- Bezerra-Bussoli, C.; Baffi, M.A.; Gomes, E.; Da-Silva, R. Yeast Diversity Isolated From Grape Musts during Spontaneous Fermentation from A Brazilian Winery. Curr. Microbiol. 2013, 67, 356–361. [Google Scholar] [CrossRef]
- Eder, M.L.R.; Conti, F.; Rosa, A.L. Differences between Indigenous Yeast Populations in Spontaneously Fermenting Musts from V. Vinifera L. And V. Labrusca L. Grapes Harvested In The Same Geographic Location. Front. Microbiol. 2018, 9, 1320. [Google Scholar] [CrossRef]
- Lopandic, K.; Tiefenbrunner, W.; Gangl, H.; Mandl, K.; Berger, S.; Leitner, G.; Abd-Ellah, G.A.; Querol, A.; Gardner, R.C.; Sterflinger, K.; et al. Molecular Profiling Of Yeasts Isolated During Spontaneous Fermentations Of Austrian Wines. FEMS Yeast Res. 2008, 8, 1063–1075. [Google Scholar] [CrossRef] [Green Version]
- Pina, C.; Santos, C.; Couto, J.A.; Hogg, T. Ethanol Tolerance of Five Non-Saccharomyces Wine Yeasts In Comparison With A Strain of Saccharomyces Cerevisiae—Influence Of Different Culture Conditions. Food Microbiol. 2004, 21, 439–447. [Google Scholar] [CrossRef]
- Kim, I.S.; Kim, Y.S.; Kim, H.; Jin, I.; Yoon, H.S. Saccharomyces Cerevisiae Knu5377 Stress Response During High-Temperature Ethanol Fermentation. Mol. Cells 2013, 35, 210–218. [Google Scholar] [CrossRef] [Green Version]
- Yang, Y.; Xia, Y.; Lin, X.; Wang, G.; Zhang, H.; Xiong, Z.; Yu, H.; Yu, J.; Ai, L. Improvement Of Flavor Profiles In Chinese Rice Wine By Creating Fermenting Yeast With Superior Ethanol Tolerance And Fermentation Activity. Food Res. Int. 2018, 108, 83–92. [Google Scholar] [CrossRef]
- Gao, C.; Fleet, G.H. Degradation Of Malic And Tartaric Acids By High Density Cell Suspensions Of Wine Yeasts. Food Microbiol. 1995, 12, 65–71. [Google Scholar] [CrossRef]
- Hong, S.K.; Lee, H.J.; Park, H.J.; Hong, Y.A.; Rhee, I.K.; Lee, W.H.; Choi, S.W.; Lee, O.S.; Park, H.D. Degradation Of Malic Acid In Wine By Immobilized Issatchenkia Orientalis Cells With Oriental Oak Charcoal And Alginate. Lett. Appl. Microbiol. 2010, 50, 522–529. [Google Scholar] [CrossRef] [PubMed]
- Nghiem, N.P.; Kleff, S.; Schwegmann, S. Succinic Acid: Technology Development and Commercialization. Fermentation 2017, 3, 26. [Google Scholar] [CrossRef]
- Qian, M.C.; Wang, Y. Seasonal Variation of Volatile Composition and Odor Activity Value of “Marion” (Rubus spp. hyb) and “Thornless Evergreen” (R. laciniatus L.) Blackberries. J. Food Sci. 2005, 70, C13–C20. [Google Scholar] [CrossRef]
- Plotto, A.; Barnes, K.W.; Goodner, K.L. Specific Anosmia Observed For β-Ionone, But Not For α-Ionone: Significance for Flavor Research. J. Food Sci. 2006, 71, S401–S406. [Google Scholar] [CrossRef]
- Tripathi, J.; Chatterjee, S.; Gamre, S.; Chattopadhyay, S.; Variyar, P.S.; Sharma, A. Analysis Of Free And Bound Aroma Compounds Of Pomegranate (Punica Granatum L.). LWT Food Sci. Technol. 2014, 59, 461–466. [Google Scholar] [CrossRef]
- Deed, R.C.; Hou, R.; Kinzurik, M.I.; Gardner, R.C.; Fedrizzi, B. The Role Of Yeast Aro8, Aro9 And Aro10 Genes In The Biosynthesis Of 3-(Methylthio)-1-Propanol From L-Methionine During Fermentation In Synthetic Grape Medium. FEMS Yeast Res. 2019, 19, 109. [Google Scholar] [CrossRef]
- Schreier, P.; Paroschy, J.H. Volatile Constituents from Concord, Niagara (Vitis Labrusca, L.) And Elvira (V. Labrusca, L. × V. Riparia, M.) Grapes. Can. Inst. Food Sci. Technol. J. 1981, 14, 112–118. [Google Scholar] [CrossRef]
- Zakarya, D.; Yahiaoui, M.; Fkih-Tetouani, S. Structure–Odour Relations for Bitter Almond Odorants. J. Phys. Org. Chem. 1993, 6, 627–633. [Google Scholar] [CrossRef]
- Masino, F.; Montevecchi, G.; Riponi, C.; Antonelli, A. Composition Of Some Commercial Grappas (Grape Marc Spirit): The Anomalous Presence Of 1,1-Diethoxy-3-Methylbutane: A Case Study. Eur. Food Res. Technol. 2009, 228, 565–569. [Google Scholar] [CrossRef]
- Niu, Y.; Yao, Z.; Xiao, Z.; Zhu, G.; Zhu, J.; Chen, J. Sensory Evaluation Of The Synergism Among Ester Odorants In Light Aroma-Type Liquor By Odor Threshold, Aroma Intensity And Flash Gc Electronic Nose. Food Res. Int. 2018, 113, 102–114. [Google Scholar] [CrossRef] [PubMed]
- Henschke, P. Stuck Fermentation: Causes, Prevention And Cure. In Advances in Juice Clarification and Yeast Inoculation; Australian Society of Viticulture and Oenology: Adelaide, Australia, 1997; pp. 30–41. [Google Scholar]
- Sadineni, V.; Kondapalli, N.; Reddy Obulam, V.S. Effect Of Co-Fermentation With Saccharomyces Cerevisiae And Torulaspora Delbrueckii Or Metschnikowia Pulcherrima On The Aroma And Sensory Properties Of Mango Wine. Ann. Microbiol. 2012, 62, 1353–1360. [Google Scholar] [CrossRef]
- Maisonnave, P.; Sanchez, I.; Moine, V.; Dequin, S.; Galeote, V. Stuck Fermentation: Development of a Synthetic Stuck Wine and Study of a Restart Procedure. Int. J. Food Microbiol. 2013, 163, 239–247. [Google Scholar] [CrossRef] [PubMed]
- Querol, A.; Pérez-Torrado, R.; Alonso-Del-Real, J.; Minebois, R.; Stribny, J.; Oliveira, B.M.; Barrio, E. New Trends in the Uses of Yeasts in Oenology. In Advances in Food and Nutrition Research; Academic Press: Cambridge, MA, USA, 2018; Volume 85, pp. 177–210. ISBN 9780128150894. [Google Scholar]
Figure 1.
Phylogenetic diversity of fungal strains associated with Chambourcin hybrid grape must during spontaneous fermentation based on ribosomal internal transcribed spacer (ITS) regions and 5.8S rRNA gene sequences. Branches corresponding to partitions reproduced from less than 50% bootstrap replicates were collapsed. The percentage of replicate trees in which the associated taxa clustered together in the bootstrap test are shown next to the branches. Hanseniaspora clade was suppressed into a black empty triangle including all Hanseniaspora species clustered with 96% bootstrap support. Subtrees including same species supported by 100% bootstrap value were suppressed and represented as solid black triangles, including Starmerella bacillaris, Candida californica, Leptosphaerulina chartarum, Aureobasidium pullulans, Filobasidium floriforme, and Sporidiobolus pararoseus strains.

Figure 2.
Main contributing fungal species during spontaneous fermentation of Chambourcin grape must. (A) Relative proportion of identified fungal species (%) from 120 randomly selected colonies (20 isolates/sampling time; 40 isolates from each location) obtained during spontaneous fermentation. (B) Fungal species identified on Dichloran Rose Bengal Chloramphenicol (DRBC) agar plates at 0 and 24 h (20 colonies/time point).

Figure 3.
(A) Sulfite and (B) ethanol tolerance of candidate non-Saccharomyces isolates compared to laboratory control, S. cerevisiae BY4742. The heights of bar graphs represent tolerance which is defined as a ratio greater than 10% between growth of a strain in media supplemented with and without sulfite or ethanol. Yeast Peptone Dextrose (pH 3.0) was used as a growth medium for sulfite tolerance assay whereas YPD at pH 7.0 was used for ethanol tolerance (see Section 2). Dotted line across the y-axis represents a 10% cutoff. Strains used in this study are represented on the x-axis. Data is presented as mean ratio ± SEM with a common superscript indicating significance (p < 0.05).

Figure 4.
Composition of major sugars, sugar consumed, and ethanol yield in sterile juice compared to inoculated fermentations with candidate non-Saccharomyces yeast strains measured by UHPLC analysis. (A) Glucose (blue) and fructose (orange) represent major sugars in grape juice and wine. (B) Percent sugar consumed and ethanol yield during fermentation. Circles represent ethanol yield measured at the end of fermentation. Different types of yeasts used in this study are represented on the x-axis. Data presented as mean ratio ± SEM with a common superscript indicating significance (p < 0.05). Strains used in this study are represented on the x-axis, S. cerevisiae BY4742 was used as a control.

Figure 5.
Nonvolatile compounds in sterile juice compared with inoculated fermentations with candidate non-Saccharomyces yeast strains with S. cerevisiae BY4742 as control. UHPLC-RI was used to measure nonvolatile compounds in inoculated fermentation, sugars (glucose and fructose), ethanol, glycerol (A), and acids (malic acid, acetic acid, tartaric acid, citric acid, and succinic acid) (B). The different types of yeasts used in this study are represented on the x-axis. S. cerevisiae BY4742 was used as a control. Data presented as mean ratio ± SEM with a common superscript indicating significance (p < 0.05).

Figure 6.
Nonvolatile compounds from inoculated fermentations differentiates from sterile juice. (A) PLS-DA scores plot and (B) loading plot of the variables with components 1 and 2 based on the nonvolatile composition of sterile juice (eight spoked asterisk) and inoculated fermentations with candidate yeast strains and S. cerevisiae BY4742. Each symbol in panel A represents a yeast strain and the ellipse around symbols represents a 95% confidence region of biological and technical triplicates.

Figure 7.
Partial least squares discriminant analysis (PLS-DA) performed on volatile compounds in inoculated fermentations by candidate yeast strains. (A,B) Score plots demonstrated a clear separation between inoculated fermentations and the variables could be explained with three components. Each symbol represents a yeast strain and ellipse around symbols represents at 95% confidence region of biological and technical triplicates. (C) Variables in loading plot of the components 1 and 2, and (D) selected compounds as important features based on variable important in projection (VIP) scores. The colored boxes on the right indicate the relative concentrations of the corresponding volatiles in each group with red (high) and blue (low).

Figure 8.
Clustered heatmap based on the volatile compounds in inoculated fermentations with candidate yeast strains compared to S. cerevisiae BY4742. Data were normalized by a pooled sample from the control group, S. cerevisiae BY4742. The correlation between each compound and candidate strain is illustrated with a chromatic scale (from dark blue, negative correlation, to dark red, positive correlation). Dendrogram for the hierarchical clustering was analyzed using Ward’s cluster algorithm. Abbreviations: Ap, A. pullulans (class 1, black); Ho, H. opuntiae (class 2, orange); Hu, H. uvarum (class 3, yellow); Pk, P. kluyveri (class 4, dark blue); Pki, P. kudriavzevii (class 5, blue); Sc, S. cerevisiae (class 6, red).

Publisher’s Note: MDPI stays neutral with regard to jurisdictional claims in published maps and institutional affiliations. |
© 2021 by the authors. Licensee MDPI, Basel, Switzerland. This article is an open access article distributed under the terms and conditions of the Creative Commons Attribution (CC BY) license (http://creativecommons.org/licenses/by/4.0/).
Share and Cite
MDPI and ACS Style
Feng, C.T.; Du, X.; Wee, J. Microbial and Chemical Analysis of Non-Saccharomyces Yeasts from Chambourcin Hybrid Grapes for Potential Use in Winemaking. Fermentation 2021, 7, 15. https://0-doi-org.brum.beds.ac.uk/10.3390/fermentation7010015
AMA Style
Feng CT, Du X, Wee J. Microbial and Chemical Analysis of Non-Saccharomyces Yeasts from Chambourcin Hybrid Grapes for Potential Use in Winemaking. Fermentation. 2021; 7(1):15. https://0-doi-org.brum.beds.ac.uk/10.3390/fermentation7010015
Chicago/Turabian StyleFeng, Chun Tang, Xue Du, and Josephine Wee. 2021. "Microbial and Chemical Analysis of Non-Saccharomyces Yeasts from Chambourcin Hybrid Grapes for Potential Use in Winemaking" Fermentation 7, no. 1: 15. https://0-doi-org.brum.beds.ac.uk/10.3390/fermentation7010015
Note that from the first issue of 2016, this journal uses article numbers instead of page numbers. See further details here.