
Upcycling of Whey Permeate through Yeast- and Mold-Driven Fermentations under Anoxic and Oxic Conditions


College of Agriculture and Life Sciences, Cornell University, Ithaca, NY 12983, USA
*
Authors to whom correspondence should be addressed.
Fermentation 2021, 7(1), 16; https://0-doi-org.brum.beds.ac.uk/10.3390/fermentation7010016
Submission received: 23 December 2020
/
Revised: 19 January 2021
/
Accepted: 21 January 2021
/
Published: 26 January 2021
(This article belongs to the Special Issue Biomass Conversion: Fermentation Chemicals and Fuels)
Abstract
:Dairy manufacturing generates whey by-products, many of them considered waste; others, such as whey permeate, a powder high in lactose and minerals from deproteinated whey, have unrealized potential. This study identified yeast species capable of utilizing lactose from whey permeate to produce ethanol or organic acids, and identified fungal species that reduced the acidity of whey by-products. Reconstituted whey permeate was fermented anaerobically or aerobically for 34 days, using species from Cornell University’s Food Safety Lab, Alcaine Research Group, and Omega Labs. Yeast species: Kluyveromyces marxianus, Kluyveromyces lactis, Dekkera anomala, Brettanomyces claussenii, Brettanomyces bruxellensis; mold species: Mucor genevensis and Aureobasidium pullulans. Density, pH, cell concentrations, organic acids, ethanol, and sugar profiles were monitored. Under anoxic conditions, K. marxianus exhibited the greatest lactose utilization and ethanol production (day 20: lactose non-detectable; 4.52% ± 0.02 ethanol). Under oxic conditions, D. anomala produced the most acetic acid (day 34: 9.18 ± 3.38 g/L), and A. pullulans utilized the most lactic acid, increasing the fermentate’s pH (day 34: 0.26 ± 0.21 g/L, pH: 7.91 ± 0.51). This study demonstrates that fermentation of whey could produce value-added alcoholic or organic acid beverages, or increase the pH of acidic by-products, yielding new products and increasing sustainability.
1. Introduction
One consequence of the increase in production of Greek yogurt (GY) and lactose-free and ultra-filtered dairy products in the United States has been an excess of lactose-containing whey by-products [1]. New York State (NYS) alone produced 771,000 metric tons of GY in 2015. Erickson [1] found that for every 1 kg of GY produced, 2–3 kg of the by-product acid whey was generated. Acid whey generally has a pH between 4.21 and 4.48 and a lactose content of 3.5% [2,3]. Many such whey by-products undergo further processing to remove protein; once deproteinated, by-products will be disposed of through land application or wastewater treatment [2,4]. Disposal and further processing can be costly for manufacturers, motivating governments, scientists, and industry to develop solutions.
Beverage sales in America have been trending upwards, increasing by more than $2 billion in 2017 [5]. Consumer preferences are shifting toward healthier, functional beverages that supply both micro- and macronutrients, or that contain probiotics [6]. Fermented dairy products have been shown to aid in digestion and organ function [7]. Furthermore, research suggests that organic acids such as acetic and lactic acid produced by microbes have health benefits, making fermented beverages like kombucha appealing to consumers [6]. Large consumer product companies are interested in appealing to these consumer trends, and are actively acquiring smaller companies whose products also align with those trends, as exemplified by Coca-Cola’s purchase of MOJO kombucha [5]. Another rising beverage trend in the United States is consumption of low-alcohol beverages [8]. These beverages have lower sugar content and fewer adverse health effects [7]. Both trends stem from a consumer-driven desire for health-conscious beverages, and a growing interest in fermented products [5,8]. Fermentation of whey by-products could provide beverages with high organic acid content, or low-alcohol tonics, both of which could be explored as value-added products for dairy manufacturers.
This study aimed to evaluate the fermentation of reconstituted whey permeate, a powdered high-lactose by-product generated from the deproteination of whey. Fermentations were carried out using a variety of yeasts and molds capable of generating organic acids and ethanol [9,10]. Under anoxic conditions, yeasts are well known to produce ethanol from fermentable sugars, as is commonly done in the brewing and wine industry, whereas aerobic fermentations result in the production of organic acids such as acetic and lactic acids, seen in products like kombucha or kefir [11,12]. Molds may have similar outputs, and can often sustain growth in highly acidic environments [11]. Yeast species from the genus Kluyveromyces are viewed as spoilage organisms in dairy fermentations, while Brettanomyces and its teleomorphic genus Dekkara have been used in beer production and are considered spoilage organisms by the wine industry, respectively [13,14,15]. The mold Mucor genevensis has been found as a contaminant in dairy manufacturing and has been demonstrated to metabolize lactose, and some strains of Aureobasidium pullulans have been seen to produce the enzyme-Galactosidase, allowing for further metabolism of the sugar [16,17]. In this study, fermentations were conducted under both anoxic and oxic conditions in order to determine which species were best adapted for the utilization of lactose from whey permeate, and what concentrations of ethanol or organic acids could be produced. With our findings, we can make suggestions as to which of the species studied would be most appropriate to ferment whey permeate and related substrates in order to generate novel value-added products.
2. Materials and Methods
2.1. Microorganisms
Yeasts and molds that could potentially hydrolyze lactose were selected. The following species were obtained from Cornell University’s Food Safety Lab (FSL; Ithaca, NY, USA): Aureobasidium pullulans (a mold; FSL E2–0290); Kluyveromyces lactis (FSL B9–0069) and Kluyveromyces marxianus (both yeasts; FSL B9–0008). These spoilage organisms were originally isolated from commercial dairy products. Commercial cultures of Brettanomyces claussenii (FSL ARGTD-0007) and Brettanomyces bruxellensis (both yeasts; FSL ARGSK-0018) were obtained from Omega Yeast Labs (St. Louis, MO, USA; original product numbers OYL201, OYL-202 respectively). B. bruxellensis was used as a control species from the same genus as B. claussenii; B. claussenii has been demonstrated to ferment lactose, whereas B. bruxellensis cannot. Dekkera anomala (a yeast; FSL ARGSK-0014) was obtained from the USDA’s ARS Culture Collection (NRRL Y-1414). Also included was Mucor genevensis (a mold; FSL ARGTD-0019), a common dairy spoilage organism, which was isolated from a commercial dairy product by the Alcaine Research Group (Cornell University, Ithaca, NY, USA). Additional information on the FSL isolates can be found in Food Microbe Tracker at www.foodmicrobetracker.com.
2.2. Experimental Design
Both anaerobic and aerobic fermentations were conducted in triplicate and were run for 34 days. Each replicate was initiated on a separate day. Cryopreserved isolates of each species were first streaked onto plates of Potato Dextrose Agar plus chloramphenicol (PDA-cam); 12 ℃ Plato Dry Malt Extract broth (DME) was then used to propagate single colonies of each yeast and representative hyphae for each mold. Hemocytometer counts were performed daily until the obtainment of a desired cell concentration sufficient to achieve a final inoculation level of ~6 × 10⁶ CFU/mL of substrate to be fermented. Cultures were then stored at 4 ℃ until inoculation of the fermentation substrate (described below). New cultures were propagated for each replicate.
Fermentation substrate was prepared in batches of 2 L of MilliQ water, 200 g of Deproteinized Whey Powder (protein 3.6%, fat 0.2%, ash 8.4%, moisture 4.5%, lactose 78%, pH 6.0, titratable acidity 0.12%; Great Lakes, Adams, NY, USA), 2 g of diammonium phosphate, and 0.8 g of Fermaid K (Lallemand; Fredericia, Denmark). Fermaid K and diammonium phosphate were added as nitrogen sources, to supplement the low levels of protein in the substrate. This solution was filtered using a 0.45 um polyethersulfone filter, and 500 mL aliquots were transferred to vessels appropriate for either anaerobic or aerobic fermentation, as outlined below. Each of the substrate aliquots received a pure culture inoculum of one of the species previously outlined, resulting in a cell concentration of ~6 × 10⁶ CFU/mL at the time of inoculation.
Anaerobic fermentations were conducted in airtight 500 mL bottles which were incubated in a water bath kept at 30 °C; no agitation was applied. For each fermentate, samples were taken aseptically by means of a sterile 5” hypodermic needle that was left with its Luer lock sealed when not in use to prevent exposure to the outside environment. The needle end was permanently inserted into the bottle for the duration of the experiment. Single-use syringes were then used to aspirate samples through the needle at each time point. A Luer lock has a screw thread to connect the syringe and the needle, allowing for a single insertion of the needle into the fermentate, and one-time use syringes.
Aerobic fermentations were conducted on 500 mL volumes of substrate in 1 L flasks covered with aluminum foil. The flasks were kept at 30 °C with agitation of 185 rpm. Samples were aspirated next to a flame using a sterile stripette.
2.3. Data Collection
pH readings for the anaerobic fermentations were taken every four hours using an iCinac system (AMS Alliance; Rome, Italy) equipped with InLab Smart Pro-ISM probes (Mettler Toledo; Columbus, OH, USA). At the time of inoculation, a sterile probe was inserted into each fermentate through a cap fitted with a silicone septum. This probe stayed sealed in the fermentate throughout the experiment. For the aerobic fermentations, pH samples were aspirated from the fermentates on days 0, 1, 2, 3, 4, 6, 8, 10, 12, 14, 16, 18, 20, 27 and 34 (on these days, the time of sampling was within ±3 h of the time of inoculation on day 0). The above sampling schedule was also used for taking density measurements of both the aerobic and anaerobic fermentations. Density was measured using an Anton Paar DMA 35 (Graz, Austria) densitometer.
Cell concentrations were enumerated through the plating of serial dilutions. Fermentate samples were serially diluted in Phosphate-Buffered Saline (PBS). Appropriate dilutions were then plated onto PDA-cam in duplicate and incubated at 30 °C until visible growth occurred. Colony counting was performed using a Chemopharm® Color QCount model 530 (Advanced Instruments, Inc., Norwood, MA, USA). Species were plated on days 0, 2, 4, 6, 8, 10, 12, 14, 16, 18, 20, 27 and 34.
Organic acids and ethanol concentrations were measured by Cornell University’s Craft Beverage Analytical Laboratory (Geneva, NY, USA). Ethanol was measured using gas chromatography-flame ion detection using an Agilent 6890N (Santa Clara, CA, USA), with a Phenomenex Zebron ZB-WAXplus column (Torrance, CA, USA). Organic acids were measured using high-performance liquid chromatography with a Shimadzu Prominence (Kyoto, Japan). Both methods were used to analyze samples from days 0, 20 and 34.
Sugar analyses were performed by Eurofins Labs (Madison, WI, USA). Measurements of fructose, glucose, sucrose, maltose, lactose, galactose and total sugar were taken using high-performance anion-exchange chromatography coupled with pulse electrochemical detection. Sugar profiles were measured for triplicate uninoculated substrate samples, and for samples representing each fermentation treatment on day 27, comprising all three replicates. Only measurements of lactose, glucose and galactose are reported in this study, as the other measured sugars had no detectable values.
All resulting data was processed and analyzed using JMP Pro 14, which was also used to generate tables and figures. For each data type, reported data display mean values and standard deviations for all executed replicates.
3. Results
3.1. Density
The brewing industry often measures a wort’s concentration of fermentable sugars (and by implication, how much sugar has been converted to ethanol) by taking the density throughout the course of the fermentation [18]. When microbes metabolize the sugars, smaller, less dense, or volatile secondary metabolites are produced (such as organic acids or ethanol), and the density of the liquid decreases [18]. The variation in reduction of densities is likely attributable to the fermenting species’ ability to hydrolyze sugar or available organic acids, the ability to continue metabolic processes in anoxic vs. oxic environments, and/or the organism’s ability to uptake lactose through its cell membrane.
In both anoxic and oxic conditions, the K. marxianus fermentate’s density decreased consistently throughout the fermentation, and among all the species investigated, these densities were the lowest on day (D) 34 (anaerobic D0: 1.036 ± 0.001, D34: 1.002 ± 0.001; aerobic D0: 1.037 ± 0.000, D34: 1.009 ± 0.000 g/cm3). K. lactis produced final densities similar to K. marxianus; however, K. marxianus’s rate of decrease was faster (Figure 1 and Figure 2).
The fermentates of B. claussenii and D. anomala saw similar declines in density throughout the course of fermentation under each oxic status; both species produced lower final densities under anoxic conditions (Figure 1 and Figure 2). B. claussenii averaged a lower density by D34 in each condition (D34 anaerobic: B. claussenii 1.021 ± 0.002, D. anomala 1.022 ± 0.001; D34 aerobic: B. claussenii 1.030 ± 0.002, D. anomala 1.032 ± 0.004 g/cm3).
3.2. Sugar Utilization
Each fermentate started with an average of 7.2 g ± 0.1 of lactose/100 g sample (as measured in the uninoculated samples), and non-detectable (ND, <0.1 g sugar/100 g sample) levels of glucose and galactose (Table 1 and Table 2). Of the species studied, K. marxianus utilized lactose most efficiently, and its fermentation of the substrate in both the presence and absence of oxygen resulted in an ND value as of D27 for each sugar measured (Table 1 and Table 2). K. lactis performed similarly under oxic conditions.
The sugar utilization patterns of D. anomala and B. claussenii demonstrated similarities to each other regardless of the oxic status of the fermentate (Table 1 and Table 2). Both species utilized more lactose under anoxic conditions (anaerobic: B. claussenii 3.9 g ± 0.6, D. anomala 4.0 g ± 0.6; aerobic: B. claussenii 5.4 g ± 0.6, D. anomala 5.5 g ± 0.8; all values represent grams lactose/100 g sample, as measured on D27).
3.3. Changes in Fermentate pH
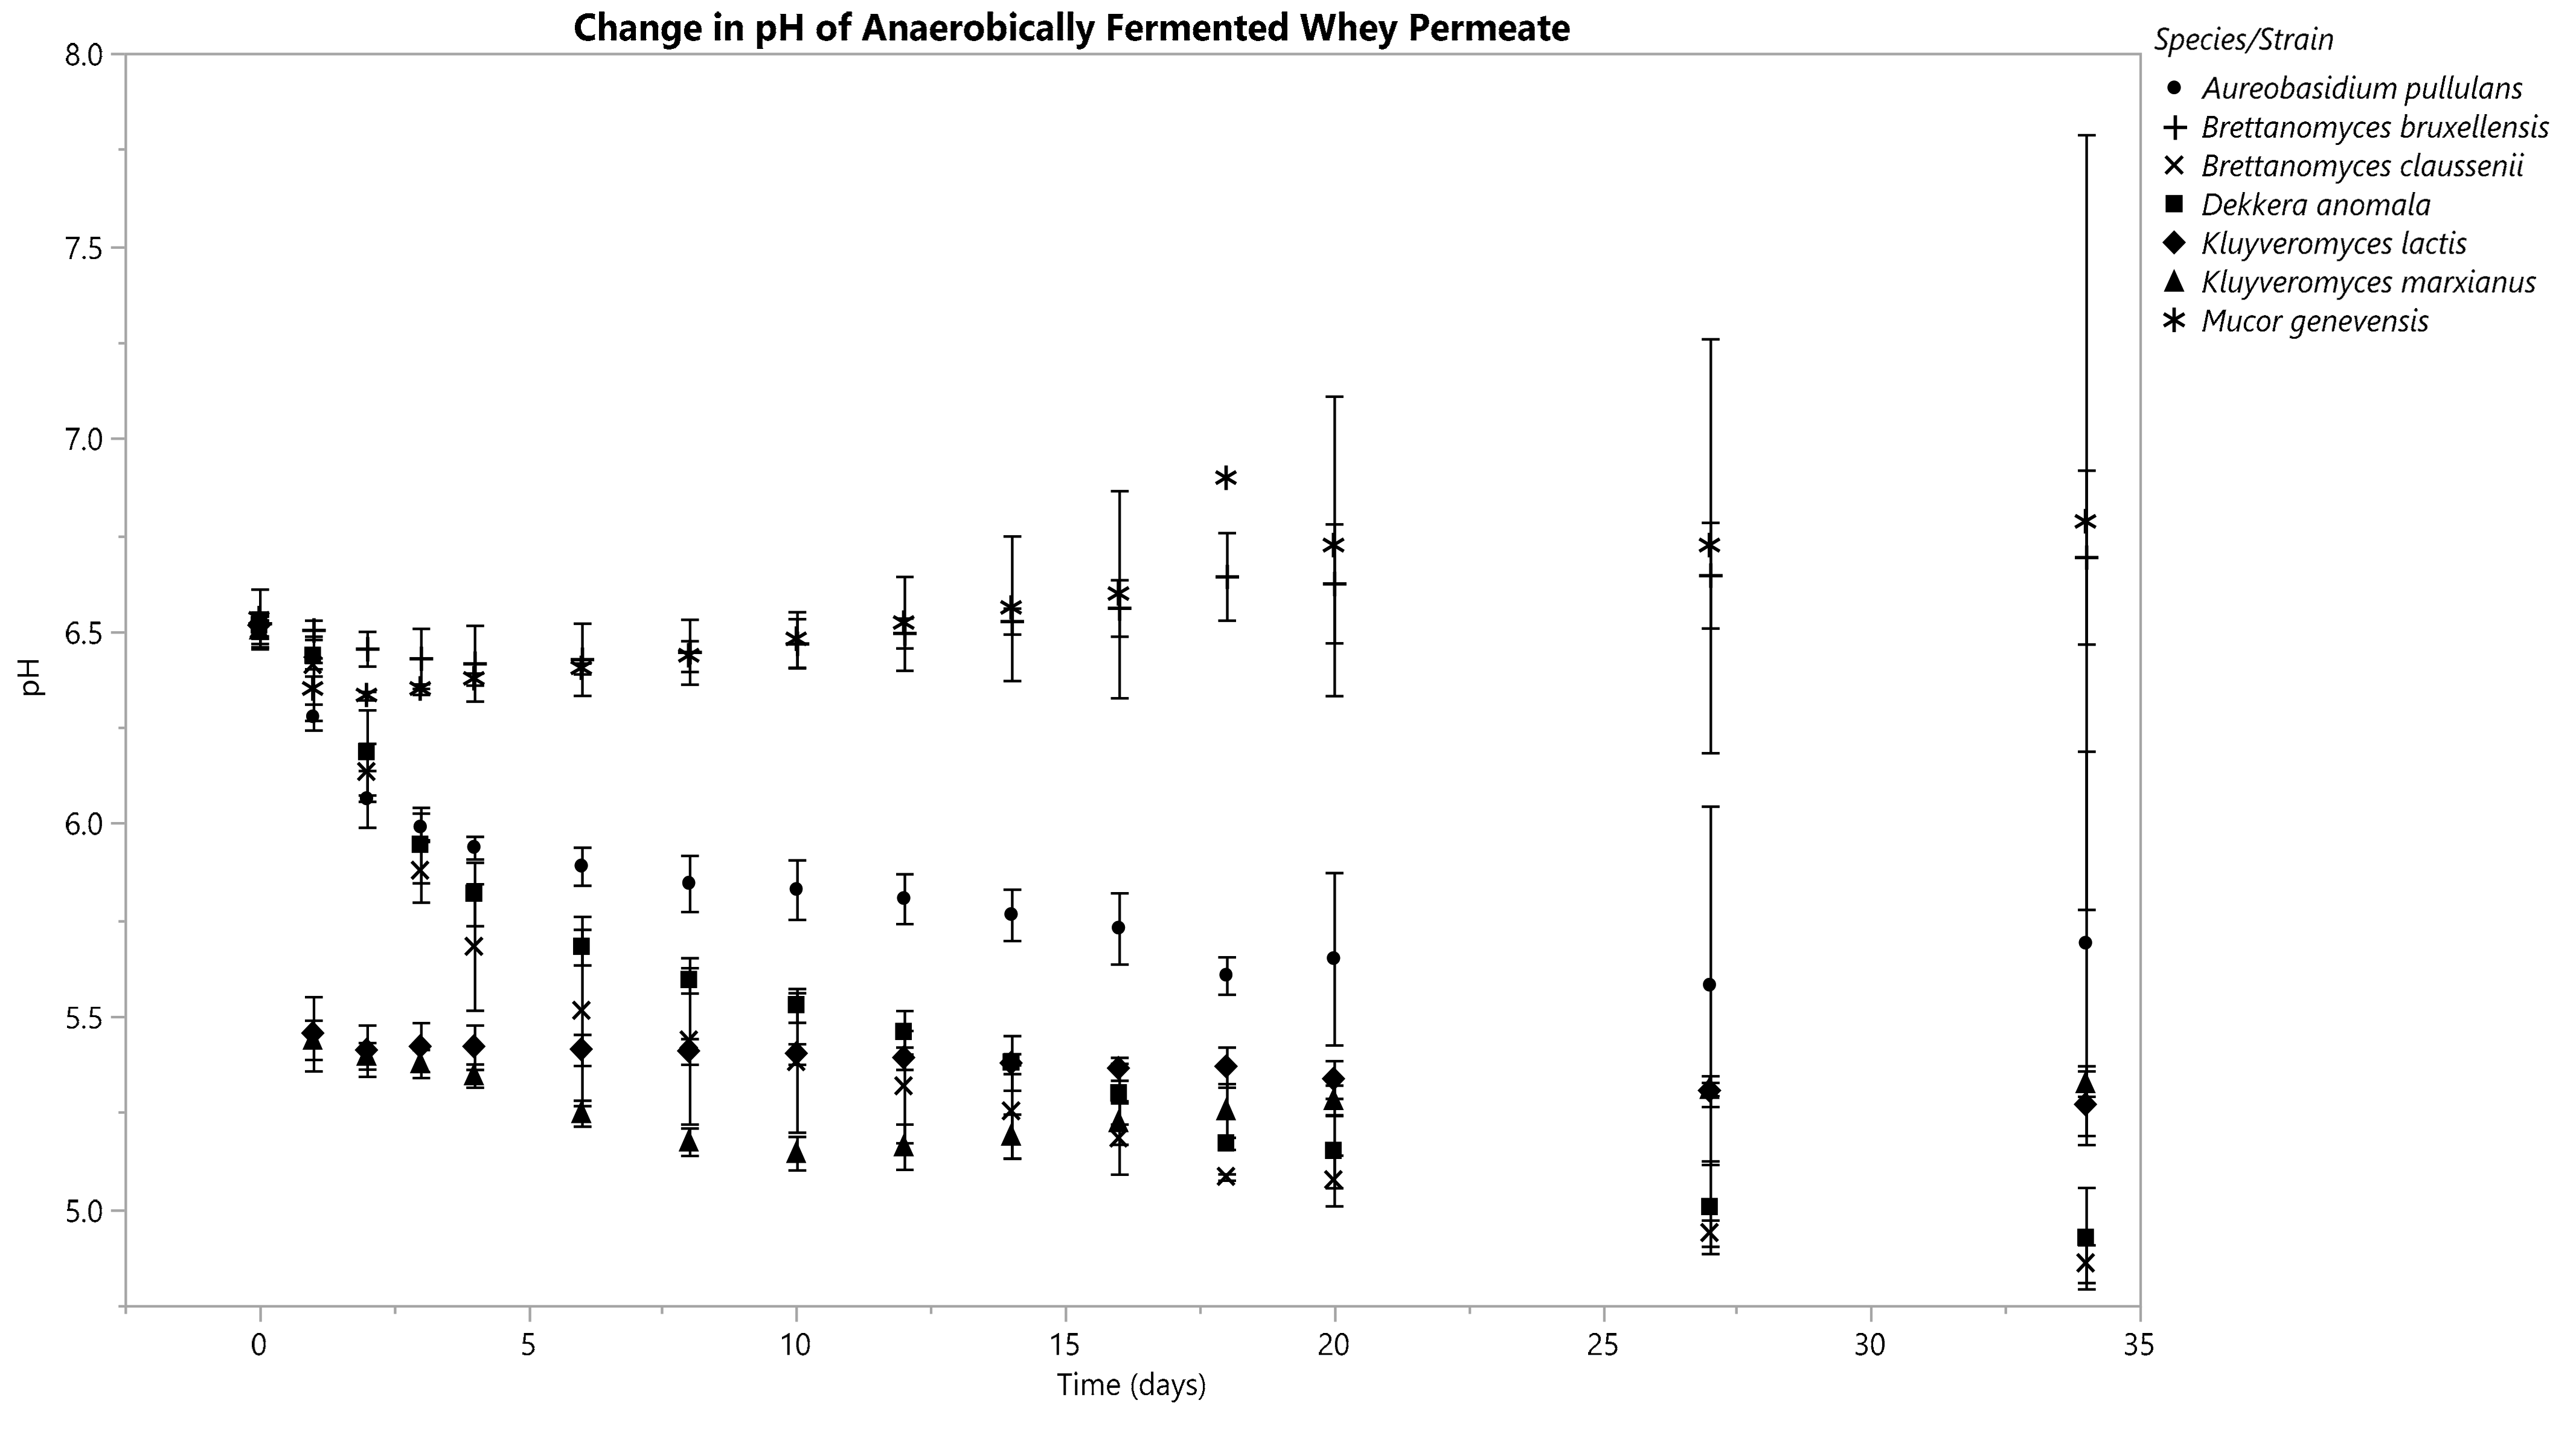
3.3.1. Anaerobic
Each Kluyveromyces species decreased its fermentate’s pH within 36 h under anoxic conditions (Figure 3). The pH of K. marxianus’s fermentate continued to drop until D10, then it began to increase slightly through D34 (Figure 3). K. lactis’s fermentate continued to drop in pH until D16, after which minimal changes occurred (Figure 3). B. claussenii and D. anomala both generated a constant decline in pH through D34, ending in a pH of 4.86 ± 0.05 and 4.93 ± 0.13, respectively (Figure 3). A. pullulans’s fermentate’s pH decreased from D0 (6.50 ± 0.03) through D18 (5.61 ± 0.05), after which increases were seen until D34, with a final pH of 5.69 ± 0.50 (Figure 3). B. bruxellensis and M. genevensis caused minimal changes in pH; both of their fermentates had slightly higher pH values on D34 than they did immediately following inoculation (Figure 3).
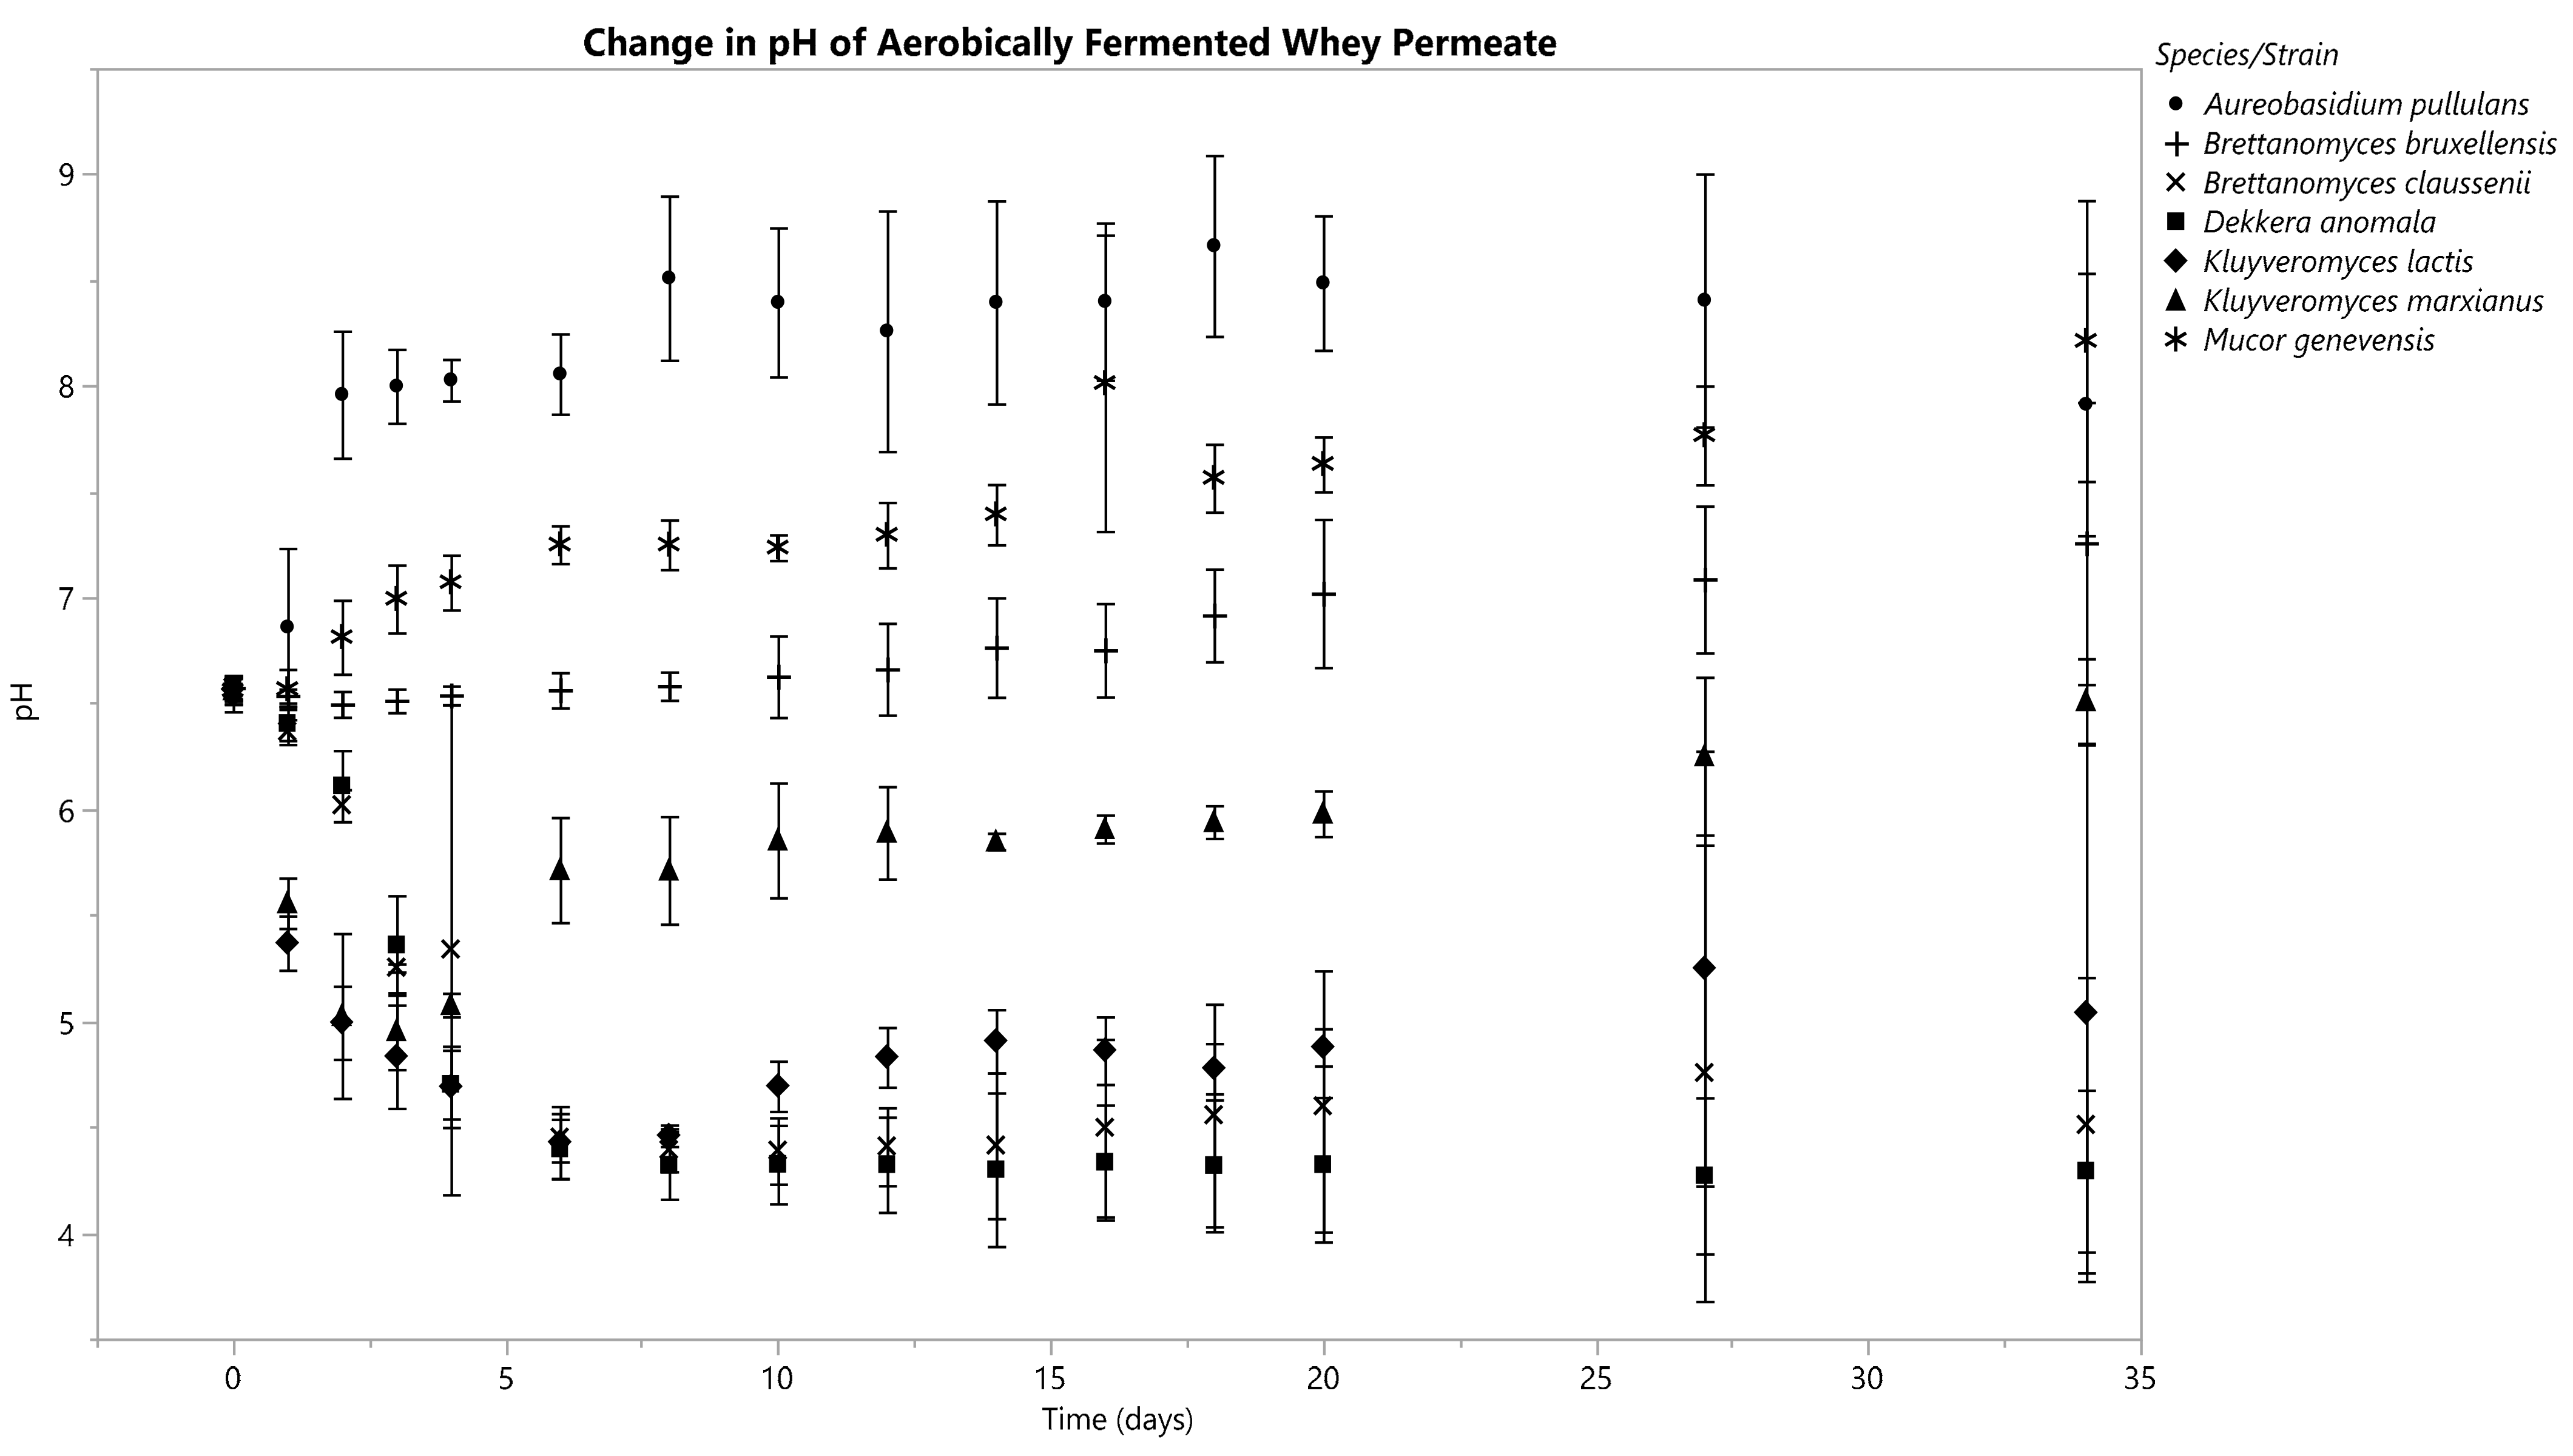
3.3.2. Aerobic
K. marxianus’s fermentate pH decreased from 6.56 ± 0.07 to 4.95 ± 0.15 on D3, from which the pH then increased to 6.51 ± 0.16 by D34 (Figure 4). K. lactis’s fermentate’s pH decreased steadily from an initial value of 6.57 ± 0.04 until hitting a nadir of 4.43 ± 0.14 on D6, after which it began to increase, ultimately reaching 5.04 ± 1.03 by D34.
The pH curves for the fermentates of B. claussenii and D. anomala had similar trends: both started at a pH of 6.58; B. claussenii’s final pH was 4.51 ± 0.57, and D. anomala’s was 4.29 ± 0.31 (Figure 4).
The fermentates of B. bruxellensis, A. pullulans, and M. genevensis all underwent increases in pH by D34 (Figure 4).
3.4. Organic Acid Concentration (Acetic, Lactic, Tartaric, Malic)
3.4.1. Anaerobic
K. marxianus, K. lactis, D. anomala, B. claussenii, A. pullulans and M. genevensis all produced acetic acid under anoxic conditions, while the B. bruxellensis fermentate’s acetic acid concentration declined (Table 3).
Lactic acid concentrations increased in the B. claussenii, D. anomala and A. pullulans fermentates, while K. marxianus, B. bruxellensis and M. genevensis all decreased their respective fermentates’ lactic acid concentrations (Table 4).
The fermentate of K. lactis was the only sample to produce noteworthy concentrations of tartaric acid (Table 5).
No malic acid was produced by any species under anoxic conditions in this study.
3.4.2. Aerobic
Over the course of the fermentation, acetic acid levels increased in the fermentates of K. lactis, B. claussenii and D. anomala (Table 6). Concentrations of acetic acid decreased in the fermentates of K. marxianus, B. bruxellensis and M. genevensis, while A. pullulans caused minimal changes in acetic acid concentration (Table 6).
All species depleted the lactic acid concentration of their fermentates under oxic conditions (Table 7).
Negligible levels of tartaric acid were seen in fermentates from B. claussenii, D. anomala, B. bruxellensis and A. pullulans (Table 8).
No malic acid was measured in the initial substrate, nor after fermentation by any of the organisms.
3.5. Ethanol Production
3.5.1. Anaerobic
K. marxianus and K. lactis had the highest levels of ethanol production in this study (Table 9). The K. marxianus fermentate’s percent ethanol was the highest at D20 (4.52% ± 0.02), but decreased by D34 (4.47% ± 0.02). Even with this decrease, K. marxianus still produced a higher percent ethanol than those of other fermentates on D34. Both Kluyveromyces species produced more ethanol from D0 to D20 than from D20 to D34. K. lactis’s fermentate increased in ethanol concentration from D20 (3.72% ± 0.62) to D34 (4.33% ± 0.10).
3.5.2. Aerobic
The highest percentage of ethanol in any aerobically generated fermentates were seen in those from K. marxianus and K. lactis on D20 (K. marxianus 0.68% ± 0.58; K. lactis 0.53% ± 0.40) (Table 10). However, the D. anomala and B. claussenii aerobic fermentates had the highest final percentages of ethanol at D34, as the percent ethanol decreased in the K. lactis and K. marxianus fermentates after D20 (Table 10).
No ethanol production was seen by B. bruxellensis, M. genevensis and A. pullulans under oxic conditions (Table 10).
3.6. Cell Counts
3.6.1. Anaerobic
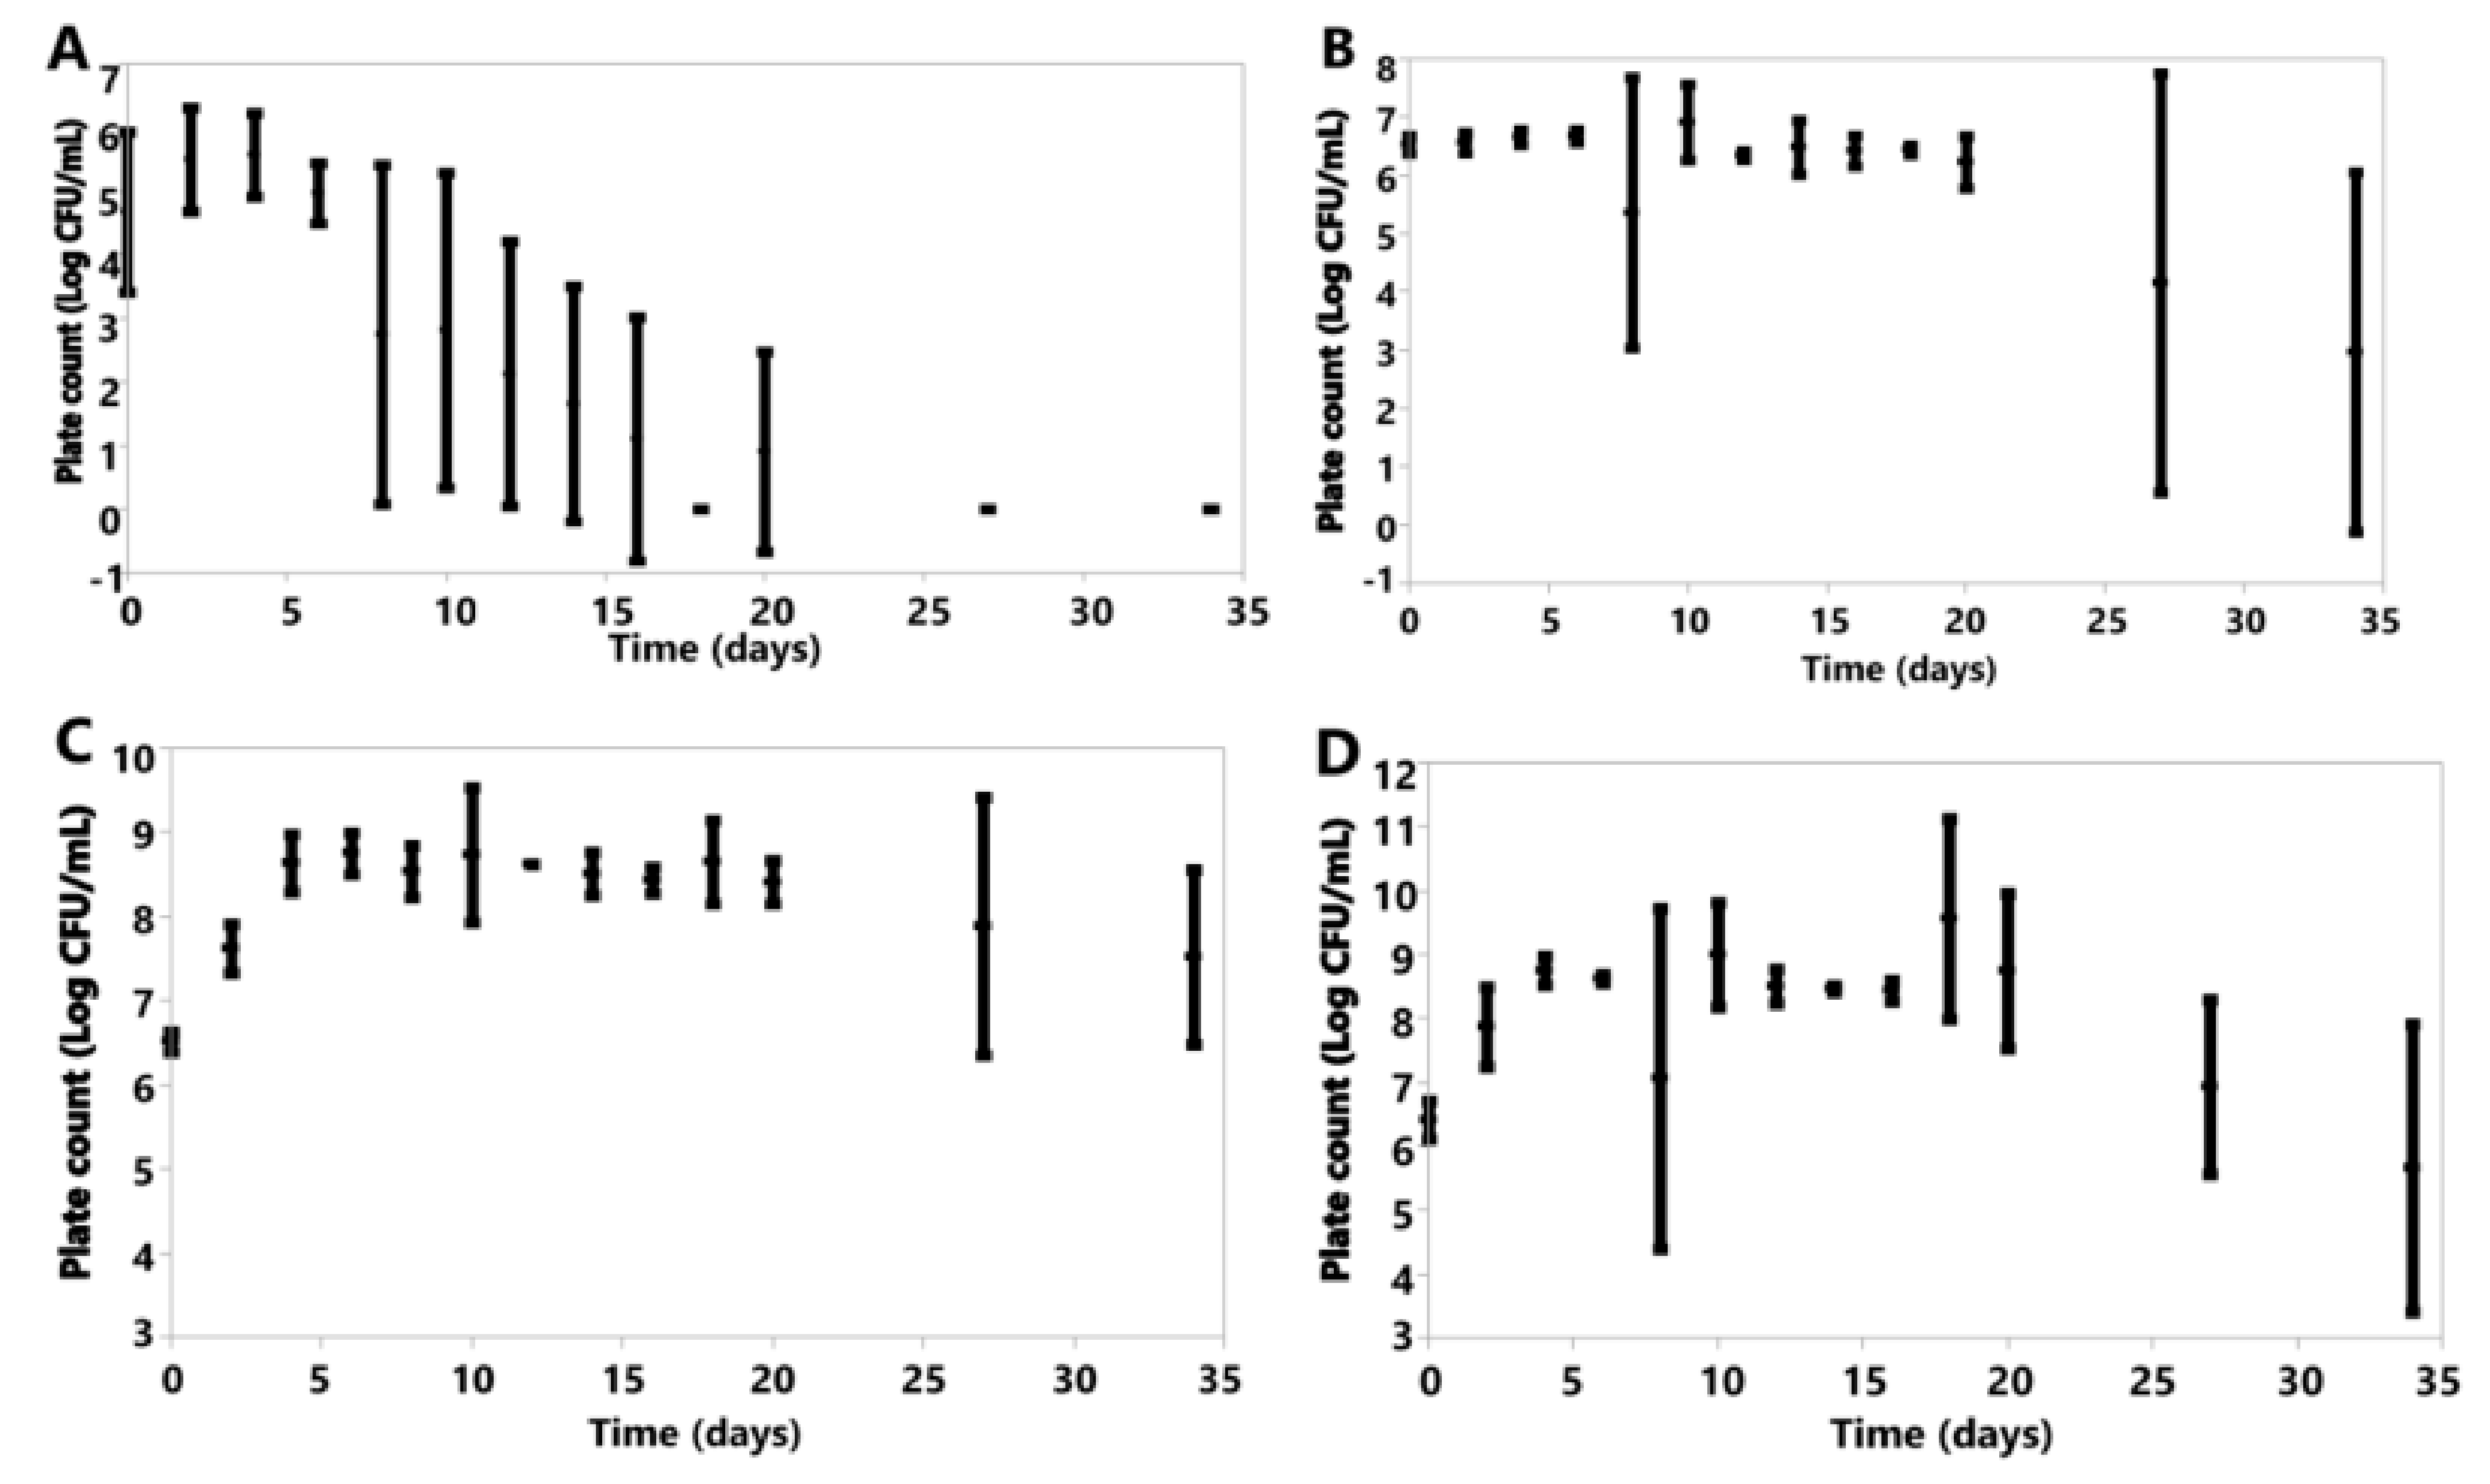
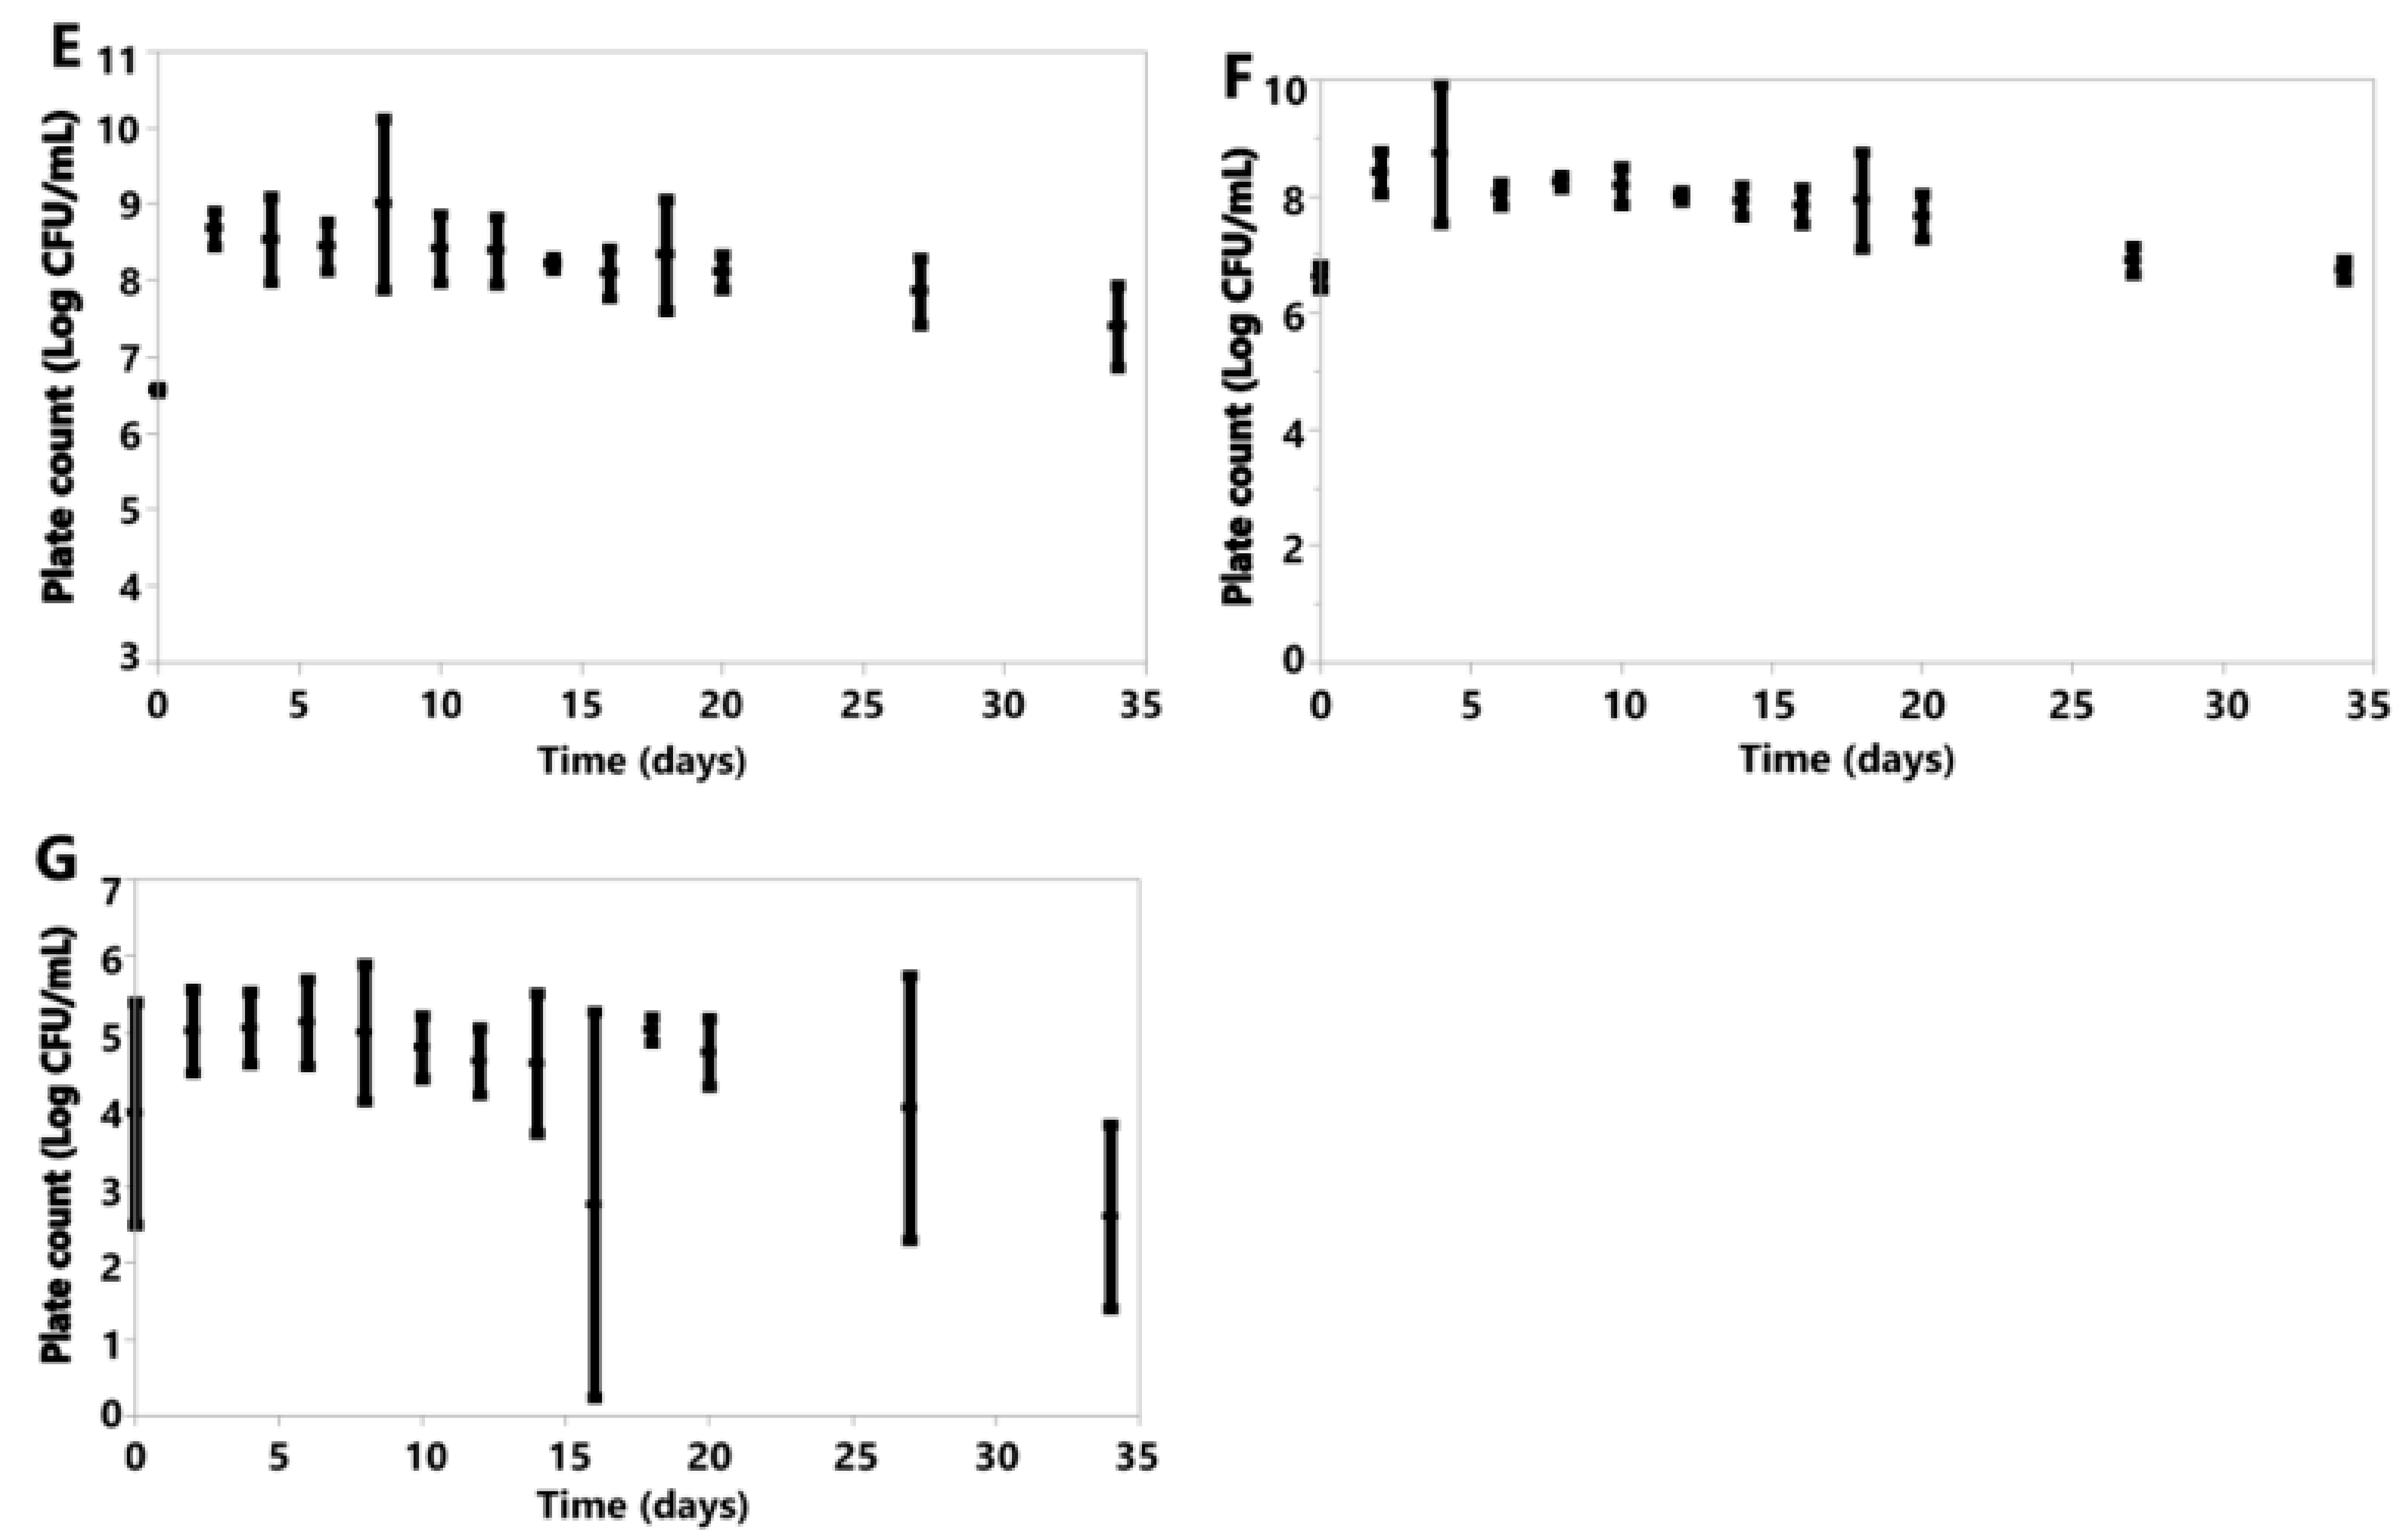
Under anoxic conditions, each species saw declines in cell counts following inoculation (Figure 5A–G).
3.6.2. Aerobic
Under oxic conditions, variation was seen in the cell counts of the species investigated (Figure 6). K. marxianus, K. lactis and B. claussenii all increased in cell concentration by D34 (K. marxianus D0 6.61 ± 0.20, D34 6.73 ± 0.18; K. lactis D0 6.57 ± 0.04, D34 7.40 ± 0.54; B. claussenii D0 6.51 ± 0.12, D34 7.52 ± 1.04 Log CFU/mL) (Figure 6). D. anomala, B. bruxellensis, A. pullulans and M. genevensis all had final cell counts lower than those at the time of inoculation (D. anomala D0 6.41 ± 0.30, D34 5.66 ± 2.25; B. bruxellensis D0 6.52 ± 0.15, D34 2.96 ± 3.09; A. pullulans D0 4.67 ± 1.26, D34 0.00 ± 0.00; M. genevensis D0 3.94 ± 1.45, D34 2.60 ± 1.20 Log CFU/mL) (Figure 6). All species did see an initial increase in cell concentrations from D0 to D4 (Figure 6).
4. Discussion
4.1. Yeast Species
4.1.1. Kluyveromyces spp.
The organisms that most effectively utilized lactose were K. marxianus under anoxic and oxic conditions, followed by K. lactis (Table 1 and Table 2). The Kluyveromyces spp. have been observed to thrive in dairy manufacturing environments. They are considered spoilage organisms because of their ability to hydrolyze lactose through the expression of β-galactosidase and lactose permease, causing a supplemental fermentation of the product above and beyond that intended by the manufacturer [15,19,20]. In our trials, both organisms saw an increase in cell concentration by D2; under oxic conditions, these cell concentrations remained higher than those at the time of inoculation. These observations indicate that in the presence of oxygen, these two species can extract lactose to yield sufficient amounts of ATP for sustained cell proliferation (Figure 6, Table 2).
K. marxianus experienced the highest level of acetic acid production of all the species, while K. lactis produced the most tartaric acid among all species (K. marxianus acetic acid 1.39 ± 0.23; K. lactis tartaric acid 0.44 ± 0.07 g/L by D34), both under anoxic conditions (Table 3 and Table 5). These two organisms caused the largest decreases in lactic acid concentration in oxic conditions (D34: K. marxianus 0.06 ± 0.10; K. lactis ND g/L), suggesting utilization of this acid (Table 7).
Under anoxic conditions, the fermentative production of ethanol can be inhibitory for the growth and survival of unicellular species [21]. In our anaerobic fermentates, decreases in cell counts were observed for K. marxianus and K. lactis; these observations may be attributable to these species’ ethanol production (Table 9). Not unexpectedly, less ethanol production was seen in oxic conditions (Table 10). Oxidative cellular respiration yields higher levels of ATP than anaerobic respiration, which can be utilized by the organism. These factors likely lead to cell concentrations of both species to increase under aerobic fermentation (Figure 6).
4.1.2. Brettanomyces spp. and D. anomala
Brettanomyces and Dekkera species have an anamorph-teleomorph relationship, and are all facultative anaerobes [13,22]. B. claussenii is used in brewing operations, and D. anomala is viewed as a spoilage organism by the wine industry [14,23]. Brettanomyces spp. and Dekkera spp. have often been used in alcoholic fermentations due to their ability to survive and continue metabolic activities in acidic and low-oxygen environments [23,24]. In our study, the ability by these species to continue metabolic activity in an acidic environment manifested itself in sustained acetic acid or ethanol production, lactose utilization, and stable cell concentrations in both anoxic and oxic conditions, ultimately generating the lowest final pH values of all of the fermentates (Figure 3, Figure 4, Figure 5, Figure 6; Table 1, Table 2, Table 6 and Table 9) [23].
The two highest acetic acid concentrations were seen in the aerobic fermentates of B. claussenii and D. anomala (D34 B. claussenii 7.75 ± 5.35; D. anomala 9.18 ± 4.13 g/L) (Table 6). These organisms had the lowest fermentate pH on D34 under oxic conditions (B. claussenii 4.51 ± 0.70; D. anomala 4.29 ± 0.38) (Figure 4). B. claussenii and D. anomala both maintained stable cell concentrations throughout their respective fermentations, affirming previous studies that found that these organisms can continue cellular processes at an acidic pH (D0 6.51 ± 0.12; D34 7.52 ± 1.04) (Figure 6) [23]. Both organisms caused declines in lactic acid under oxic conditions, and increases in anoxic conditions (Table 4 and Table 7).
B. claussenii was more efficient on average than D. anomala at utilizing lactose under both conditions (Table 1 and Table 2). The D. anomala and B. claussenii fermentates both had small amounts of galactose present at the end of the anaerobic fermentations, suggesting that once these organisms have hydrolyzed lactose, glucose is their preferred substrate (Table 1 and Table 2). Longer fermentations would need to be conducted to see if total utilization of lactose is possible.
B. bruxellensis demonstrated no lactose utilization under anoxic conditions, and limited utilization under oxic conditions (Table 1 and Table 2). In both the presence and absence of oxygen, B. bruxellensis was able to utilize both acetic and lactic acid, results that are corroborated by the increase in fermentate pH (Figure 3 and Figure 4; Table 3, Table 4, Table 6 and Table 7). Cell concentrations decreased in anoxic and oxic conditions (Figure 5 and Figure 6). It is likely that B. bruxellensis is not as well suited for fermentation of lactose-containing products.
4.2. Mold Species
4.2.1. M. genevensis
Mucor spp. have been shown to utilize lactose, and are considered spoilage organisms in dairy facilities [16,19,25]. Research suggests that lactose utilization and enzyme production in M. circinelloides and M. miehei can be affected by temperature and pH [26,27]. Both species showed optimal lactose utilization at 60 ℃ in a pH range of 4–6 [26,27]. It is possible that our fermentation at 30 ℃ was not warm enough to promote lactose utilization for M. genevensis (Table 1 and Table 2).
M. genevensis is a dimorphic fungus, growing as a mold in oxic conditions, and as a yeast in anoxic conditions [28,29]. It is probable that when expressing different morphologies, the organism produces different enzymes, changing its metabolic capabilities. This study did not examine each organism’s genetics, and further experiments would be needed to support this hypothesis.
M. genevensis experienced different cell concentration trends under each oxic condition (Figure 5 and Figure 6). This may be attributable to the dimorphic lifecycle [29]. More research will need to be conducted in order to draw conclusions on how environmental conditions affect cell growth, and which morphology is more suited for cell growth.
Under anoxic conditions, M. genevensis utilized all lactic acid in the fermentate, the highest level of utilization of any species investigated; this consumption resulted in ND values on D20 and D34 (Table 4). Under oxic conditions, M. genevensis utilized the least lactic acid of all species tested (Table 7) Acetic acid was produced by this organism under anoxic conditions, and utilized under oxic conditions (Table 3 and Table 6). The pH of the fermentates increased under conditions of both oxic status; however, a much larger pH increase was seen in an anoxic environment, likely attributable to the utilization of lactic acid (Figure 3 and Figure 4). Given the differences in organic acid utilization under each oxic condition, it is likely that the presence of oxygen impacts the species’ metabolic activities, which may correlate to the expressed morphology.
4.2.2. A. pullulans
A. pullulans has been seen to prefer acidic environments with a pH below 4 [7]. Studies have shown that given this preference, adaptation of A. pullulans to a lactose substrate can be achieved in an oxic environment with a pH below 5 [17,30]. This study did not optimize the substrate, pH or environmental conditions specifically for each species, which could suggest why A. pullulans’s lactose utilization was limited under anoxic and oxic conditions. More research would need to be conducted to understand if adaptation to whey permeate is possible.
5. Conclusions
Under anoxic conditions, K. lactis or K. marxianus would be best suited for producing alcoholic beverages from whey permeate, as these species displayed the most ethanol production (Table 9). Both B. claussenii and D. anomala could also be used to produce low-alcohol variants with residual sugar. The production of ethanol and organic acids provide important sensory characteristics unique to fermented beverages. Optimization of these fermentations will need to be conducted to yield desired sensory attributes. With customer acceptance, these beverages could potentially provide economic gains for dairy manufacturers, and could compete in the rising market of low-alcohol beverages [8]. Such products could also decrease the costs accrued from waste disposal by creating a demand for upcycling whey permeate.
The U.S. Tax and Trade Bureau requires that if a fermented beverage has greater than 0.5% alcohol at any point of production, including the final bottled product, the beverage must be labeled and regulated as an alcoholic beverage [33]. In our trials, B. claussenii and D. anomala could produce the most acetic acid of all species studied, while maintaining low ethanol percentages (<0.5%) under oxic conditions (Table 6 and Table 10). Acetic acid has become a popular nutrient in drinking vinegars and kombucha, the sales of which are expected to experience large increases, with forecasts of a $3.8 billion industry by 2023 [34]. With the rise of kombucha and functional beverages, the products suggested by our study would be poised for success in the growing market of functional probiotic beverages. Further research would need to be done following bottling of these products to ensure that ethanol levels do not exceed 0.5%; however, the investigated species should be considered as viable options in the production of a whey permeate fermented beverage.
Both A. pullulans and M. genevensis decreased lactic acid content and produced increases in pH under oxic conditions (Figure 4, Table 7). Whey permeate has a similar lactose concentration to that of acid whey; however, the pH of the whey permeate substrate in this study was ~6.5 (Figure 3 and Figure 4), while acid whey has been measured to have a pH between 4.21 and 4.48 [2,35]. Acid whey’s pH limits possibilities for disposal methods, which are governed under Part 360 Solid Waste Management Facilities General Requirements of New York State [4]. Inoculating acid whey with A. pullulans or M. genevensis should be tested, as these processes might increase the pH to neutral. If these species were able to neutralize acid whey, they could be used as part of a waste processing system, to increase the pH to a level that would allow for more acid whey to be deposited into soil, or to be added to animal feed. This simple process could increase the volume of acid whey disposed of per acre of land, which would decrease the amount of energy that waste treatment plants use processing acid whey, thus lowering costs of dairy manufacturers.
Tartaric acid is often found to be synthesized by plants, particularly grapes as seen in the wine industry [24]. Few microbes are known to produce tartaric acid; however, some yeast strains have been seen to synthesize it [24]. The highest production of tartaric acid in our trials was seen under anoxic conditions from K. lactis’s fermentate (Table 5). Even at this level of production, the amount of tartaric acid is below the level of >2 g/L typically found to have a sensory impact in wine [36]. This acid is used in the food industry as a leavening agent and has been suggested to have nutritional benefits [37]. It should be noted that K. lactis can utilize a lactose input to produce tartaric acid. The process of optimizing the biological synthesis of this acid will need to be studied, as a higher rate of production could be of economic benefit to the dairy industry.
Author Contributions
Ideation for this research was from S.D.A. Laboratory work was conducted by J.F.M. and T.A.D. Writing of the manuscript was completed by J.F.M. Data curation was completed by T.A.D. Edits were led by T.A.D. and completed by each author. All authors discussed the results and contributed to the completion of the manuscript. All authors have read and agreed to the published version of the manuscript.
Funding
Funding was supplied from the New York State Milk Promotion Advisory Board (Albany, NY, USA), via the New York State Department of Agriculture and Markets.
Data Availability Statement
The data presented in this study are available on request from the corresponding author.
Acknowledgments
We would like to thank the support from the Food Science Department of Cornell University (Ithaca, NY, USA), and the Alcaine Research Group (Ithaca, NY, USA).
Conflicts of Interest
The authors declare no conflict of interest.
References
- Erickson, B.E. Acid whey: Is the waste product an untapped goldmine? Chem. Eng. News Online 2017, 95, 26–30. [Google Scholar]
- Menchik, P.; Zuber, T.; Zuber, A.; Moraru, C.I. Short communication: Composition of coproduct streams from dairy processing: Acid whey and milk permeate. J. Dairy Sci. 2019, 102, 3978–3984. [Google Scholar] [CrossRef]
- Sanjay Gami, G.G.; Czymmek, K.; Ganoe, K.; Ketterings, Q. Acid Whey pH and Nutrient Content. Agron. Fact Sheet Ser. Fact Sheet 2016, 90, 1–2. [Google Scholar]
- State, N.Y. Part 360: Solid Waste Management Facilities General Requirements; D. o. E. Conservation: New York, NY, USA, 2013; pp. 4017–4307. [Google Scholar]
- Staff, J.U.S. Sales of Non-Alcoholic Beverages Grow More Than $2 Billion in 2017; Coca-Cola, Journey: Atlanta, GA, USA, 2018. [Google Scholar]
- Jayabalan, R.; Malbaša, R.V.; Lončar, E.S.; Vitas, J.S.; Sathishkumar, M. A Review on Kombucha Tea—Microbiology, Composition, Fermentation, Beneficial Effects, Toxicity, and Tea Fungus. Compr. Rev. Food Sci. Food Saf. 2014, 13, 538–550. [Google Scholar] [CrossRef]
- Marsh, A.J.; Hill, C.; Ross, R.P.; Cotter, P.D. Fermented beverages with health-promoting potential: Past and future perspectives. Trends Food Sci. Technol. 2014, 38, 113–124. [Google Scholar] [CrossRef] [Green Version]
- French, P. In Focus: Top Trends in Lower Alcohol Beer; Union Press Ltd.: London, UK, 2018. [Google Scholar]
- Smith, M.T. The Yeast; Elsevier Science: New York, NY, USA, 2010. [Google Scholar]
- Martin Lo, S.A.-S.; Hsu, C. Bioprocessing for value-added products from renewable resources. In Chapter 22. Bioconversion of Whey Lactose into Microbial Exopolysaccharides; Elsevier: Amsterdam, The Netherlands; Boston, MA, USA, 2007; pp. 559–583. [Google Scholar]
- Carlile, M.J.; Watkinson, S.C.; Gooday, G.W. The Fungi; Elsevier: London, UK, 2001. [Google Scholar]
- Jones, R.P.; Greenfield, P.F. Alcohol fermentation by yeasts—The effect of environmental and other variables. Process Biochem. 1981, 16, 42–49. [Google Scholar]
- FI Monila, P.S.; Jong, S.C. Validation of the species concept in the genus Dekkera by restriction analysis of genes coding for rRNA. Int. J. Syst. Bacteriol. 1993, 43, 32–35. [Google Scholar]
- Hernâni Gerós, F.C.; Leão, C. Utilization and Transport of Acetic Acid in Dekkera anomala and Their Implications on the Survival of the Yeast in Acidic Environments. J. Food Prot. 1999, 63, 96–101. [Google Scholar] [CrossRef]
- Salman Zafar, M.O. Ethanol production from crude whey by Kluyveromyces marxianus. Biochem. Eng. J. 2006, 27, 295–298. [Google Scholar] [CrossRef]
- Karimi, G.E.; Taherzadeh, M.J. Ethanol production from dilute-acid pretreated rice straw by simultaneous saccharification and fermentation with Mucor indicus, Rhizopus oryzae, and Saccharomyces cerevisiae. Enzyme Microb. Technol. 2006, 40, 138–144. [Google Scholar] [CrossRef]
- Roukas, T. Pullulan production from deproteinized whey by Aureobasidium pullulans. J. Ind. Microbiol. Biotechnol. 1999, 22, 617–621. [Google Scholar] [CrossRef] [PubMed]
- D’Amore, T.; Russel, I.; Stewart, G.G. Sugar Utilization by yeast during fermentation. J. Ind. Microbiol. 1988, 4, 315–324. [Google Scholar] [CrossRef]
- Simova, E.; Beshkova, D.; Angelov, A.; Hristozova, T.; Frengova, G.; Spasov, Z. Lactic acid bacteria and yeasts in kefir grains and kefir made from them. J. Ind. Microbiol. Biotechnol. 2002, 28, 1–6. [Google Scholar] [CrossRef] [PubMed]
- O’Leary, V.S.; Sutton, C.; Bencivengo, M.; Sullivan, B.; Holsinger, V.H. Influence of lactose hydrolysis and solids concentration on alcohol production by yeast in acid whey ultrafiltrate. Biotechnol. Bioeng. 1977, 19, 1689–1702. [Google Scholar] [CrossRef]
- Brown, S.W.; Oliver, S.G.; Harrison, D.E.F.; Righelato, R.C. Ethanol inhibition of yeast growth and fermentation: Differences in the magnitude and complexity of the effect. Appl. Microbiol. Biotechnol. 1981, 11, 151–155. [Google Scholar] [CrossRef]
- Maudy, T.; Smith, A.M.v.G. Dekkera anomala sp. nov., the teleomorph of Brettanomyces anomalus, recovered from spoiled soft drinks. Antonievan Leeuwenhoek 1984, 50, 143–148. [Google Scholar]
- Jan Steensels, L.D.; Malcorps, P.; Derdlinckx, G.; Verachtert, H.; Verstrepen, K.J. Brettanomyces yeasts—From spoilage organisms to valuable contributors to industrial fermentations. Int. J. Food Microbiol. 2015, 206, 24–38. [Google Scholar] [CrossRef] [Green Version]
- Jackson, R.S. Wine Science: Principles and Applications F. S. A. Technology. Science Direct; Academic Press: Cambridge, MA, USA, 2008. [Google Scholar]
- Orlowski, M. Mucor Dimorphism. Microbiol. Rev. 1991, 55, 234–258. [Google Scholar] [CrossRef]
- Walsh, M.; Bombyk, R.A.; Wagh, A.; Bingham, A.; Berreau, L.M. Synthesis of lactose monolaurate as influenced by various lipases and solvents. J. Mol. Catal. B Enzym. 2009, 60, 171–177. [Google Scholar] [CrossRef]
- Saha, B.C. Production, purification and properties of endoglucanase from a newly isolated strain of Mucor circinelloides. Process Biochem. 2004, 39, 1871–1876. [Google Scholar] [CrossRef]
- Bartnicki-Garcia, S. Control of Dimorphism in Mucor by Hexoses: Inhibition of Hyphal Morphogenesis. J. Bacteriol. 1968, 96, 1586–1594. [Google Scholar] [CrossRef] [PubMed] [Green Version]
- Clark-Walker, G.D. Relationship between Dimorphology and Respiration in Mucor genevensis Studied with Chloramphenicol. J. Bacteriol. 1973, 116, 972–980. [Google Scholar] [CrossRef] [PubMed] [Green Version]
- Anh LeDuy, J.-J.Y.; Chagraoui, A. Enhanced Production of Pullulan from Lactose Adaptation and by Mixed Culture Techniques. Biotechnol. Lett. 1983, 5, 49–54. [Google Scholar]
- Denis Rho, A.M.; Luong, J.H.T.; LeDuy, A. Oxygen requirement in pullulan fermentation. Appl. Microbiol. Biotechnol. 1988, 28, 361–366. [Google Scholar]
- Kuan-Chen Cheng, A.D.; Catchmark, J.M. Pullulan: Biosynthesis, production and applications. Appl. Microbiol. Biotechnol. 2011, 92, 29–44. [Google Scholar] [CrossRef]
- Bureau, T.A.T. “Kombucha”. Does TTB Regulate Kombucha Retrieved 5/8/2019. 2019. Available online: https://ttb.gov/kombucha/index.shtml (accessed on 2 January 2021).
- Costello, H. Global Kombucha Market 2018 Size, Demand, Types, Consumption, Key Players, Production, Top Regions, Competitive and Comparative Analysis, Growth & Forecast By 2023; Reuters Online: New York, NY, USA, 2018. [Google Scholar]
- Lawton, M.R. Leveraging endogenous barley enzymes to turn lactose-containing dairy by-products into fermentable adjuncts for Saccharomyces cerevisiae-based ethanol fermentations. J. Dairy Sci. 2019, 102, 2044–2050. [Google Scholar] [CrossRef]
- Shehadeh, A.; Kechagia, D.; Evangelou, A.; Tataridis, P.; Shehadeh, F. Effect of ethanol, glycerol, glucose and tartaric acid on the viscosity of model aqueous solutions and wine samples. Food Chem. 2019, 300, 125191. [Google Scholar] [CrossRef]
- Spiller, G.A.; Story, J.A.; Furumoto, E.J.; Chezem, J.C.; Spiller, M. Effect of tartaric acid and dietary fibre from sun-dried raisins on colonic function and on bile acid and volatile fatty acid excretion in healthy adults. Br. J. Nutr. 2003, 90, 803–807. [Google Scholar] [CrossRef] [Green Version]
Figure 1.
Means are represented by data points and standard deviation by error bars, which were calculated from three replicates for each species, except for M. genevensis, which had two viable replicates.
Figure 1.
Means are represented by data points and standard deviation by error bars, which were calculated from three replicates for each species, except for M. genevensis, which had two viable replicates.
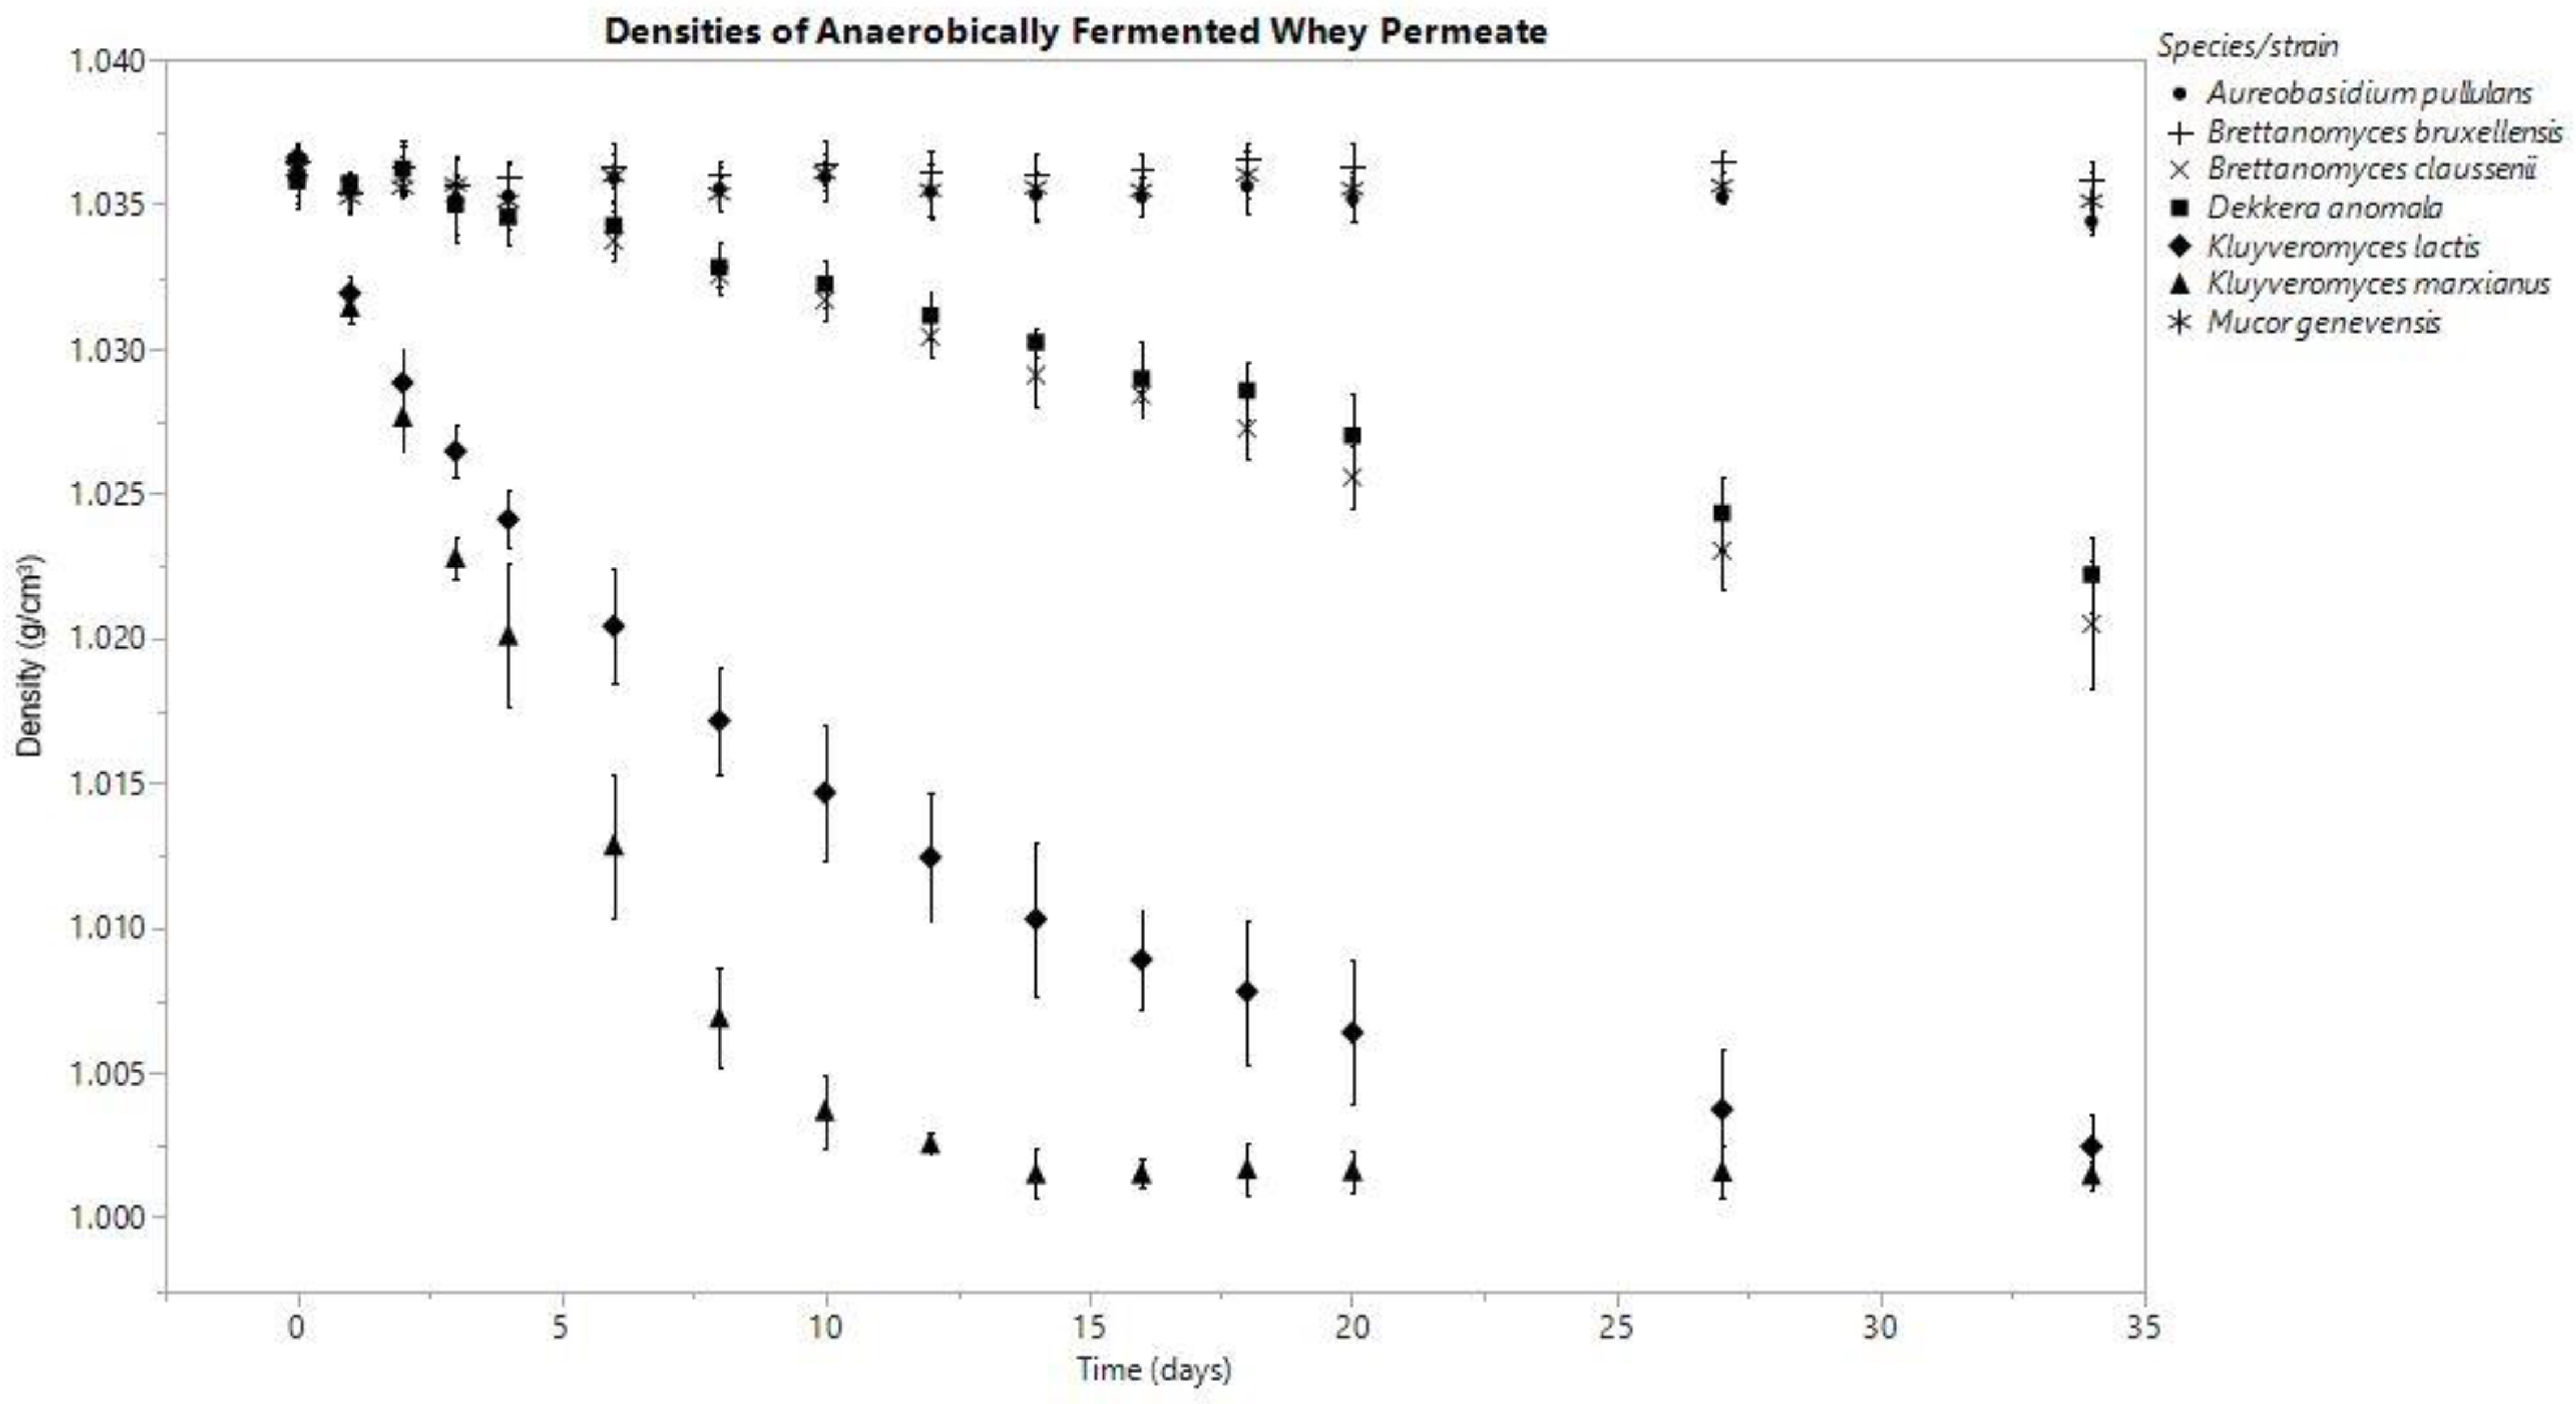
Figure 2.
Means are represented by data points and standard deviation by error bars, which were calculated from three replicates for each species.
Figure 2.
Means are represented by data points and standard deviation by error bars, which were calculated from three replicates for each species.
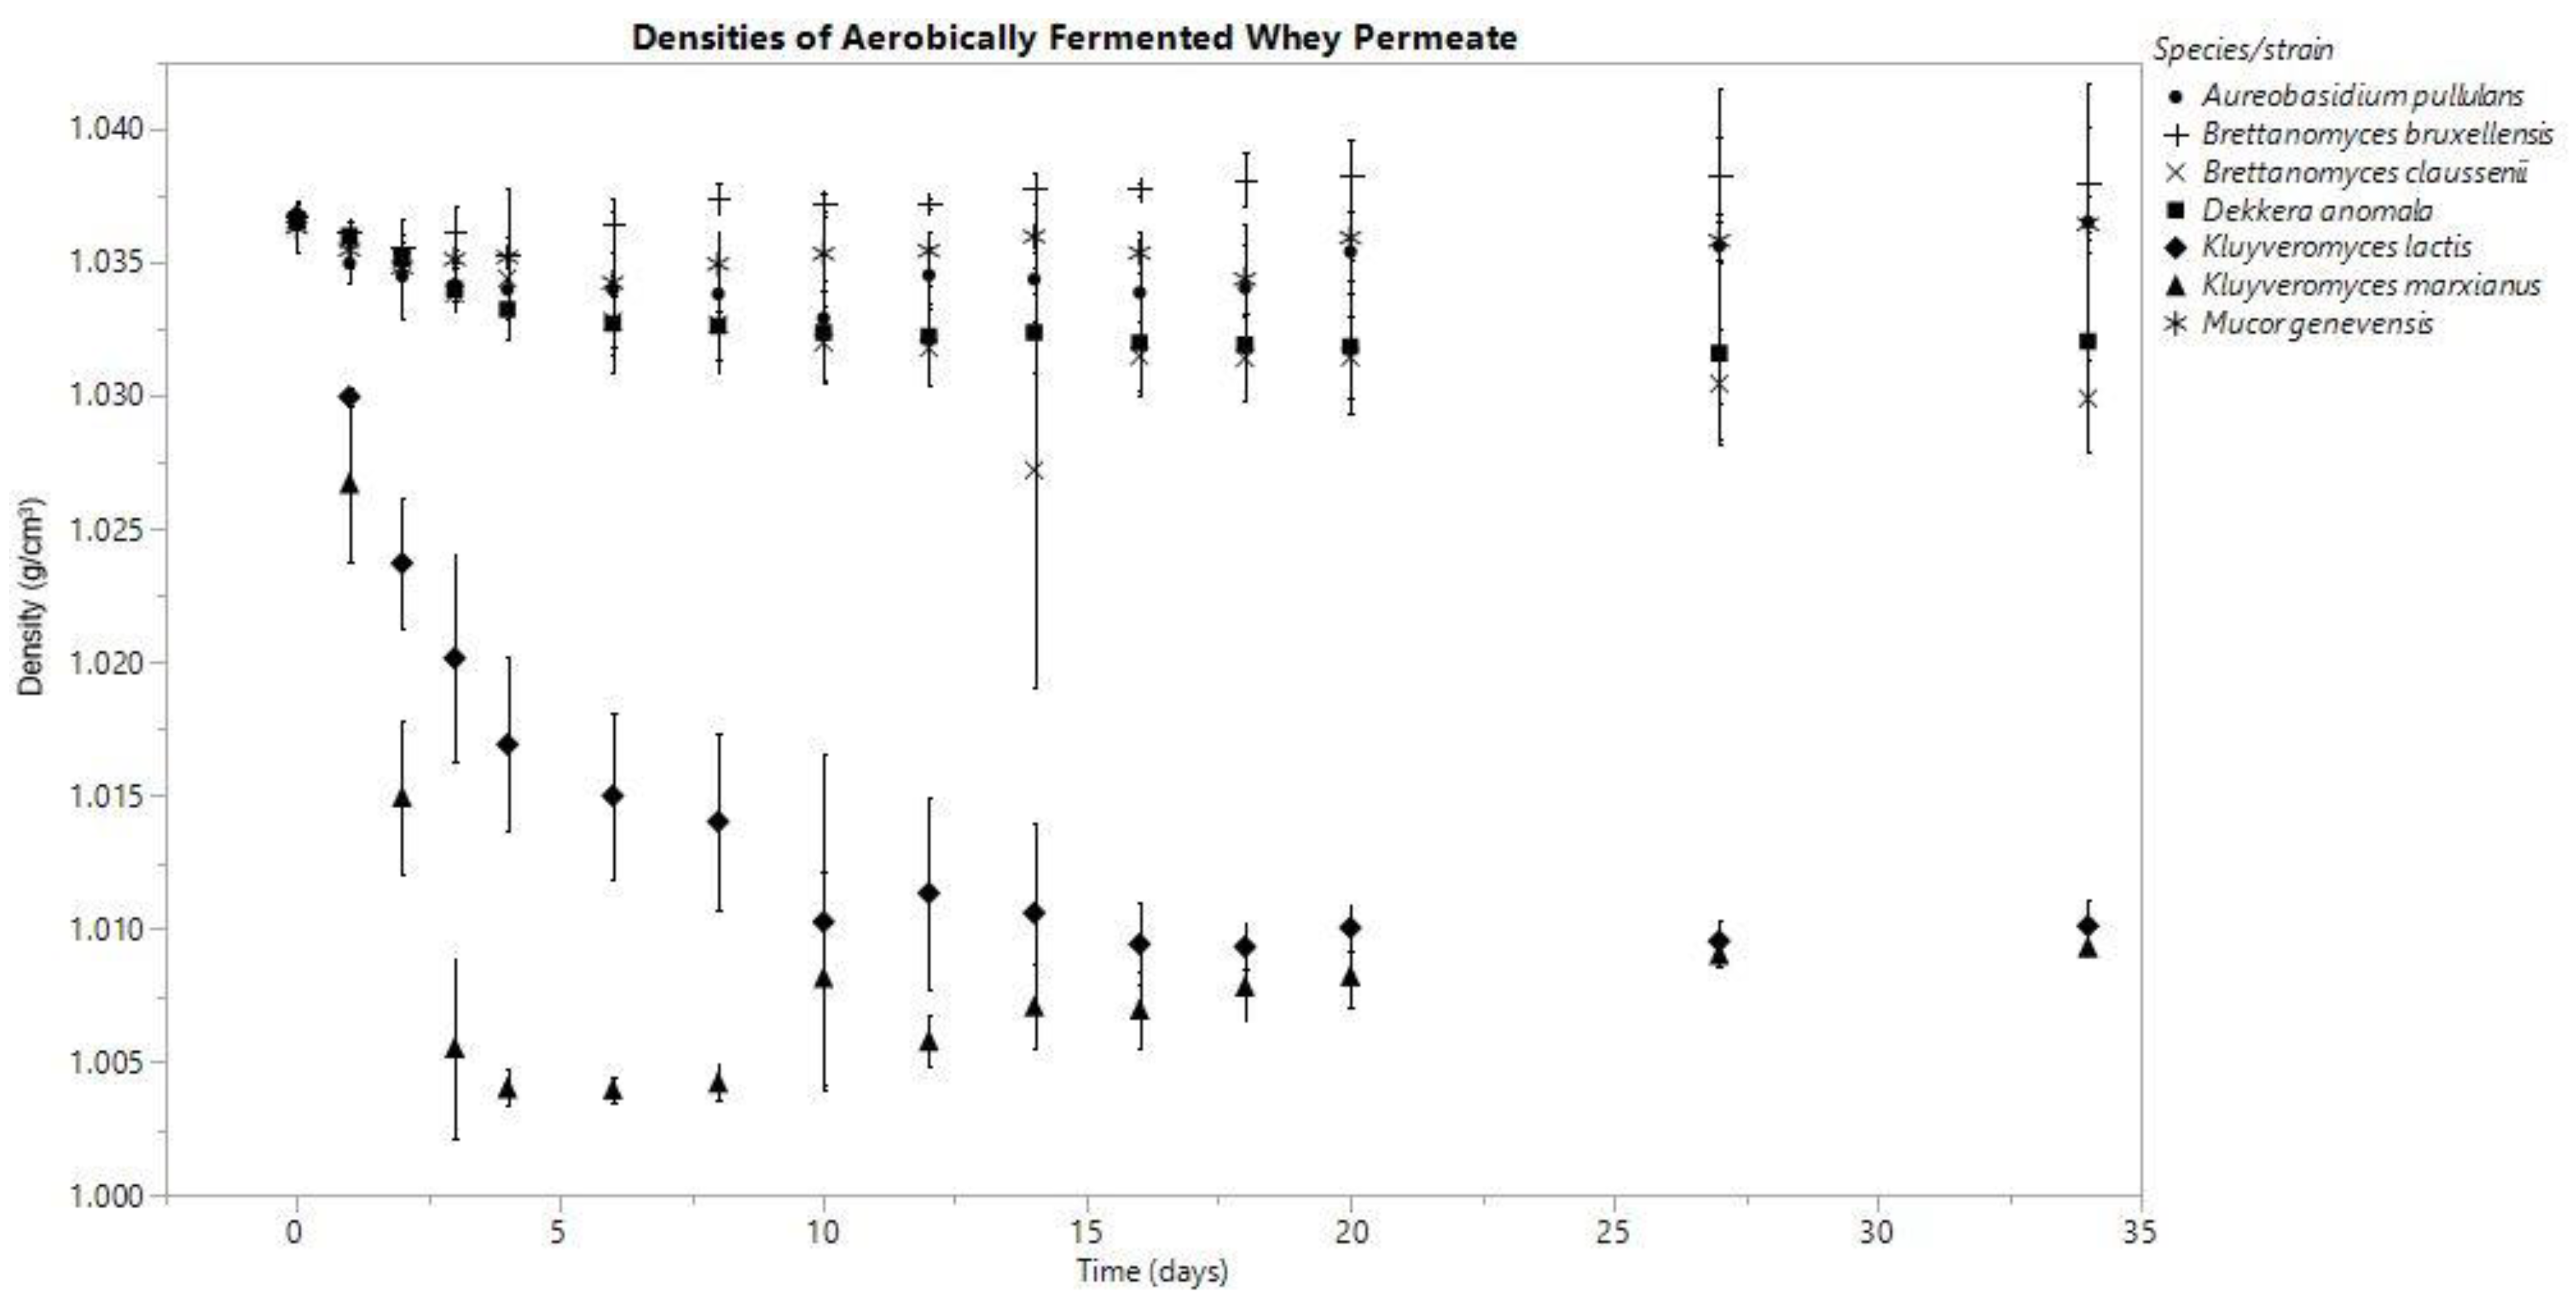
Figure 3.
pH changes in the anaerobically fermented whey permeate were recorded every 4 h for each replicate. Data is displayed from D0, 1, 2, 3, 4, 6, 8, 10, 12, 14, 16, 18, 20, 27 and 34. Means are represented by data points and standard deviations by error bars, which were calculated from three replicates for each species besides M. genevensis, which had two viable replicates.

Figure 4.
Means are represented by data points and standard deviations by error bars, which were calculated from three replicates for each species.
Figure 4.
Means are represented by data points and standard deviations by error bars, which were calculated from three replicates for each species.

Figure 5.
Plotted values represent means, and error bars represent standard deviations for A. pullulans (A), B. bruxellensis (B), B. claussenii (C), D. anomala (D), K. lactis (E), K. marxianus (F), M. genevensis (G) under anoxic conditions. All were calculated from three replicates for each species, except M. genevensis, which only had two viable replications.
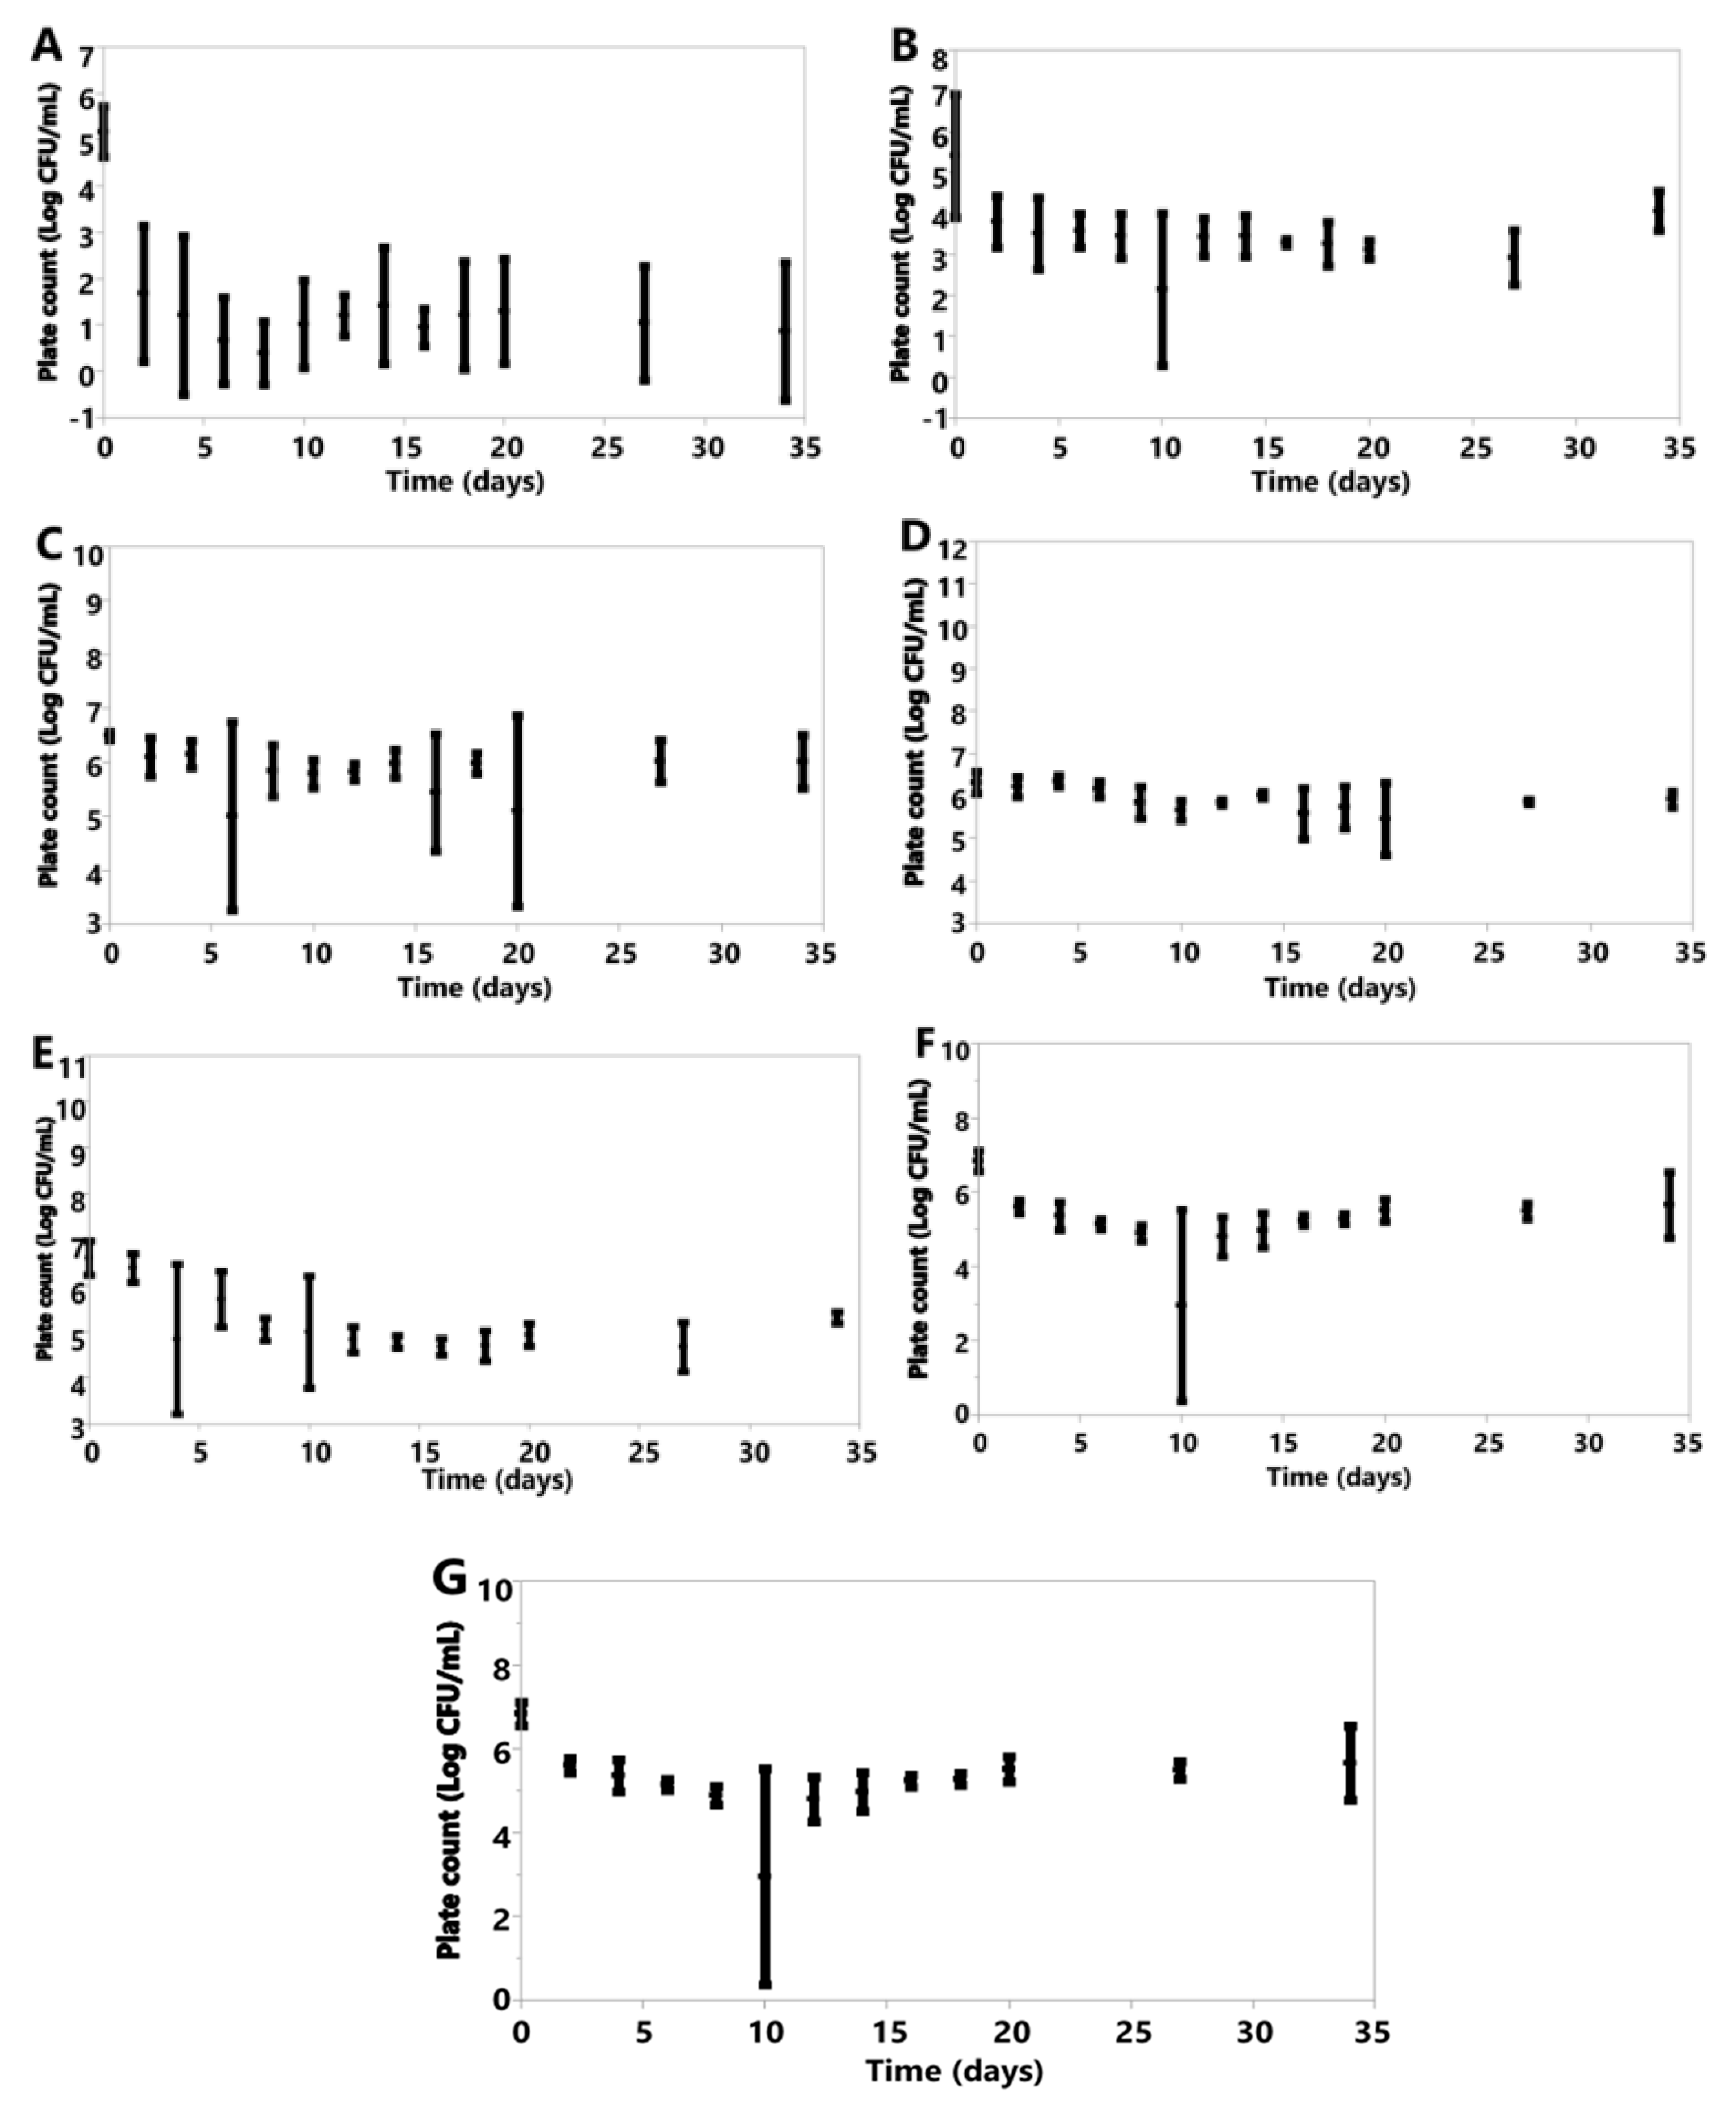
Figure 6.
Plotted values represent means, and error bars represent standard deviations for A. pullulans (A), B. bruxellensis (B), B. claussenii (C), D. anomala (D), K. lactis (E), K. marxianus (F), M. genevensis (G) under oxic conditions; all of which were calculated from three replicates for each species.


Table 1.
Sugar concentrations under anaerobic fermentation (g/100 g).
| Lactose (g/100 g) | Glucose (g/100 g) | Galactose (g/100 g) | Total Sugar (g/100 g) | ||||||
|---|---|---|---|---|---|---|---|---|---|
| Sample Day | Species | Mean | Std Dev | Mean | Std Dev | Mean | Std Dev | Mean | Std Dev |
| 0 | Uninoculated | 7.2 | 0.1 | 0.0 | 0.0 | 0.0 | 0.0 | 7.2 | 0.1 |
| 27 | A. pullulans | 6.6 | 0.2 | 0.0 | 0.0 | 0.2 | 0.1 | 6.9 | 0.3 |
| 27 | B. bruxellensis | 7.4 | 0.0 | 0.0 | 0.0 | 0.0 | 0.0 | 7.4 | 0.0 |
| 27 | B. claussenii | 3.9 | 0.6 | 0.0 | 0.0 | 0.4 | 0.3 | 4.2 | 0.4 |
| 27 | D. anomala | 4.0 | 0.6 | 0.0 | 0.0 | 0.5 | 0.3 | 4.4 | 0.3 |
| 27 | K. lactis | 0.2 | 0.3 | 0.0 | 0.0 | 0.0 | 0.0 | 0.2 | 0.3 |
| 27 | K. marxianus | 0.0 | 0.0 | 0.0 | 0.0 | 0.0 | 0.0 | 0.0 | 0.0 |
| 27 | M. genevensis | 7.2 | 0.0 | 0.0 | 0.0 | 0.0 | 0.0 | 7.2 | 0.0 |
Samples were taken on D27. Values represent means and standard deviations, calculated from three replicates for each species, except for M. genevensis, which had two viable replicates. Measurements are in grams sugar/100 g sample.
Table 2.
Sugar concentrations under aerobic fermentation (g/100 g).
| Lactose | Glucose | Galactose | Total Sugar | ||||||
|---|---|---|---|---|---|---|---|---|---|
| Sample Day | Species | Mean | Std Dev | Mean | Std Dev | Mean | Std Dev | Mean | Std Dev |
| 0 | Uninoculated | 7.2 | 0.1 | 0.0 | 0.0 | 0.0 | 0.0 | 7.2 | 0.1 |
| 27 | A. pullulans | 7.5 | 0.9 | 0.0 | 0.0 | 0.1 | 0.1 | 7.6 | 0.8 |
| 27 | B. bruxellensis | 6.5 | 2.1 | 0.4 | 0.6 | 0.4 | 0.5 | 7.3 | 0.9 |
| 27 | B. claussenii | 5.4 | 0.6 | 0.0 | 0.1 | 0.0 | 0.1 | 5.5 | 0.7 |
| 27 | D. anomala | 5.5 | 0.8 | 0.0 | 0.0 | 0.0 | 0.0 | 5.5 | 0.8 |
| 27 | K. lactis | 0.0 | 0.0 | 0.0 | 0.0 | 0.0 | 0.0 | 0.0 | 0.0 |
| 27 | K. marxianus | 0.0 | 0.0 | 0.0 | 0.0 | 0.0 | 0.0 | 0.0 | 0.0 |
| 27 | M. genevensis | 7.4 | 0.3 | 0.0 | 0.0 | 0.0 | 0.0 | 7.4 | 0.3 |
Samples were taken on D27. Values represent means and standard deviations, calculated from three replicates for each species. Measurements are in grams sugar/100 g sample.
Table 3.
Acetic acid concentrations under anaerobic fermentation (g/L).
| A. pullulans | B. bruxellensis | B. claussenii | D. anomala | K. lactis | K. marxianus | M. genevensis | ||||||||
|---|---|---|---|---|---|---|---|---|---|---|---|---|---|---|
| Time (days) | Mean | Std Dev | Mean | Std Dev | Mean | Std Dev | Mean | Std Dev | Mean | Std Dev | Mean | Std Dev | Mean | Std Dev |
| 0 | 0.09 | 0.16 | 0.24 | 0.06 | 0.52 | 0.46 | 0.21 | 0.02 | 0.28 | 0.15 | 0.66 | 0.67 | 0.28 | 0.08 |
| 20 | 0.56 | 0.21 | 0.07 | 0.13 | 0.66 | 0.46 | 0.54 | 0.07 | 0.60 | 0.22 | 1.17 | 0.21 | 0.56 | 0.20 |
| 34 | 0.45 | 0.23 | 0.08 | 0.14 | 0.90 | 0.33 | 0.73 | 0.29 | 0.79 | 0.09 | 1.39 | 0.23 | 0.66 | 0.55 |
Measurements represent grams organic acid/L of sample. Values represent means and standard deviations, calculated from three replicates for each species besides M. genevensis, which had two viable replicates.
Table 4.
Lactic acid concentrations under anaerobic fermentation (g/L).
| A. pullulans | B. bruxellensis | B. claussenii | D. anomala | K. lactis | K. marxianus | M. genevensis | ||||||||
|---|---|---|---|---|---|---|---|---|---|---|---|---|---|---|
| Time (days) | Mean | Std Dev | Mean | Std Dev | Mean | Std Dev | Mean | Std Dev | Mean | Std Dev | Mean | Std Dev | Mean | Std Dev |
| 0 | 0.85 | 0.06 | 0.78 | 0.08 | 0.78 | 0.09 | 0.81 | 0.03 | 0.80 | 0.04 | 0.79 | 0.06 | 0.75 | 0.06 |
| 20 | 1.27 | 0.30 | 0.70 | 0.24 | 1.37 | 0.29 | 1.21 | 0.24 | 0.84 | 0.07 | 0.81 | 0.03 | 0.00 | 0.00 |
| 34 | 1.09 | 0.34 | 0.57 | 0.36 | 1.33 | 0.19 | 1.25 | 0.13 | 0.85 | 0.13 | 0.47 | 0.09 | 0.00 | 0.00 |
Measurements represent grams organic acid/L of sample. Values represent means and standard deviations, calculated from three replicates for each species besides M. genevensis, which had two viable replicates.
Table 5.
Tartaric acid concentrations under anaerobic fermentation (g/L).
| A. pullulans | B. bruxellensis | B. claussenii | D. anomala | K. lactis | K. marxianus | M. genevensis | ||||||||
|---|---|---|---|---|---|---|---|---|---|---|---|---|---|---|
| Time (days) | Mean | Std Dev | Mean | Std Dev | Mean | Std Dev | Mean | Std Dev | Mean | Std Dev | Mean | Std Dev | Mean | Std Dev |
| 0 | 0.00 | 0.00 | 0.00 | 0.00 | 0.00 | 0.00 | 0.00 | 0.00 | 0.00 | 0.00 | 0.00 | 0.00 | 0.00 | 0.00 |
| 20 | 0.00 | 0.00 | 0.00 | 0.00 | 0.00 | 0.00 | 0.00 | 0.00 | 0.63 | 0.09 | 0.16 | 0.15 | 0.00 | 0.00 |
| 34 | 0.00 | 0.00 | 0.00 | 0.00 | 0.00 | 0.00 | 0.00 | 0.00 | 0.44 | 0.07 | 0.00 | 0.00 | 0.00 | 0.00 |
Measurements represent grams organic acid/L of sample. Values represent means and standard deviations, calculated from three replicates for each species besides M. genevensis, which had two viable replicates.
Table 6.
Acetic acid concentrations under aerobic fermentation (g/L).
| A. pullulans | B. bruxellensis | B. claussenii | D. anomala | K. lactis | K. marxianus | M. genevensis | ||||||||
|---|---|---|---|---|---|---|---|---|---|---|---|---|---|---|
| Time (days) | Mean | Std Dev | Mean | Std Dev | Mean | Std Dev | Mean | Std Dev | Mean | Std Dev | Mean | Std Dev | Mean | Std Dev |
| 0 | 0.25 | 0.22 | 0.40 | 0.09 | 0.69 | 0.62 | 0.86 | 0.42 | 0.76 | 0.29 | 0.52 | 0.32 | 0.50 | 0.30 |
| 20 | 0.29 | 0.03 | 0.00 | 0.00 | 5.88 | 3.97 | 8.49 | 3.71 | 0.75 | 0.41 | 0.48 | 0.35 | 0.26 | 0.02 |
| 34 | 0.25 | 0.08 | 0.03 | 0.06 | 7.75 | 5.35 | 9.18 | 4.13 | 2.68 | 2.22 | 0.34 | 0.20 | 0.40 | 0.19 |
Measurements represent grams organic acid/L of sample. Values represent means and standard deviations, calculated from three replicates for each species.
Table 7.
Lactic acid concentrations under aerobic fermentation (g/L).
| A. pullulans | B. bruxellensis | B. claussenii | D. anomala | K. lactis | K. marxianus | M. genevensis | ||||||||
|---|---|---|---|---|---|---|---|---|---|---|---|---|---|---|
| Time (days) | Mean | Std Dev | Mean | Std Dev | Mean | Std Dev | Mean | Std Dev | Mean | Std Dev | Mean | Std Dev | Mean | Std Dev |
| 0 | 0.83 | 0.05 | 0.84 | 0.01 | 0.85 | 0.04 | 0.87 | 0.03 | 0.86 | 0.02 | 0.86 | 0.01 | 0.86 | 0.01 |
| 20 | 0.26 | 0.24 | 0.66 | 0.35 | 0.40 | 0.10 | 0.34 | 0.06 | 0.00 | 0.00 | 0.13 | 0.22 | 0.67 | 0.09 |
| 34 | 0.26 | 0.26 | 0.29 | 0.51 | 0.31 | 0.28 | 0.19 | 0.17 | 0.00 | 0.00 | 0.06 | 0.10 | 0.37 | 0.35 |
Measurements represent organic acid/L of sample. Values represent means and standard deviations, calculated from three replicates for each species.
Table 8.
Tartaric acid concentrations under aerobic fermentation (g/L).
| A. pullulans | B. bruxellensis | B. claussenii | D. anomala | K. lactis | K. marxianus | M. genevensis | ||||||||
|---|---|---|---|---|---|---|---|---|---|---|---|---|---|---|
| Time (days) | Mean | Std Dev | Mean | Std Dev | Mean | Std Dev | Mean | Std Dev | Mean | Std Dev | Mean | Std Dev | Mean | Std Dev |
| 0 | 0.00 | 0.00 | 0.00 | 0.00 | 0.00 | 0.00 | 0.00 | 0.00 | 0.00 | 0.00 | 0.00 | 0.00 | 0.00 | 0.00 |
| 20 | 0.23 | 0.20 | 0.04 | 0.06 | 0.31 | 0.38 | 0.44 | 0.56 | 0.00 | 0.00 | 0.04 | 0.06 | 0.00 | 0.00 |
| 34 | 0.39 | 0.35 | 0.16 | 0.27 | 0.65 | 0.67 | 0.83 | 0.76 | 0.00 | 0.00 | 0.00 | 0.00 | 0.00 | 0.00 |
Measurements represent grams organic acid/L of sample. Values represent means and standard deviations, calculated from three replicates for each species.
Table 9.
Ethanol concentrations under anaerobic fermentation (%).
| A. pullulans | B. bruxellensis | B. claussenii | D. anomala | K. lactis | K. marxianus | M. genevensis | ||||||||
|---|---|---|---|---|---|---|---|---|---|---|---|---|---|---|
| Time (days) | Mean | Std Dev | Mean | Std Dev | Mean | Std Dev | Mean | Std Dev | Mean | Std Dev | Mean | Std Dev | Mean | Std Dev |
| 0 | 0.00 | 0.00 | 0.00 | 0.00 | 0.00 | 0.00 | 0.00 | 0.00 | 0.00 | 0.00 | 0.00 | 0.00 | 0.00 | 0.00 |
| 20 | 0.00 | 0.00 | 0.00 | 0.00 | 1.27 | 0.25 | 1.04 | 0.16 | 3.72 | 0.62 | 4.52 | 0.02 | 0.00 | 0.00 |
| 34 | 0.00 | 0.00 | 0.00 | 0.00 | 1.81 | 0.44 | 1.63 | 0.23 | 4.33 | 0.10 | 4.47 | 0.02 | 0.00 | 0.00 |
Ethanol values are presented in percent ethanol/volume of solution. Values represent means and standard deviations, calculated from three replicates for each species besides M. genevensis, which had two viable replicates.
Table 10.
Ethanol concentrations under aerobic fermentation (%).
| A. pullulans | B. bruxellensis | B. claussenii | D. anomala | K. lactis | K. marxianus | M. genevensis | ||||||||
|---|---|---|---|---|---|---|---|---|---|---|---|---|---|---|
| Time (days) | Mean | Std Dev | Mean | Std Dev | Mean | Std Dev | Mean | Std Dev | Mean | Std Dev | Mean | Std Dev | Mean | Std Dev |
| 0 | 0.00 | 0.00 | 0.00 | 0.00 | 0.00 | 0.00 | 0.00 | 0.00 | 0.00 | 0.00 | 0.00 | 0.00 | 0.00 | 0.00 |
| 20 | 0.00 | 0.00 | 0.00 | 0.00 | 0.13 | 0.23 | 0.12 | 0.12 | 0.53 | 0.40 | 0.68 | 0.58 | 0.00 | 0.00 |
| 34 | 0.00 | 0.00 | 0.00 | 0.00 | 0.18 | 0.31 | 0.20 | 0.18 | 0.04 | 0.08 | 0.00 | 0.00 | 0.00 | 0.00 |
Ethanol values are presented in percent ethanol/volume of solution. Values represent means and standard deviations, calculated from three replicates for each species.
Publisher’s Note: MDPI stays neutral with regard to jurisdictional claims in published maps and institutional affiliations. |
© 2021 by the authors. Licensee MDPI, Basel, Switzerland. This article is an open access article distributed under the terms and conditions of the Creative Commons Attribution (CC BY) license (http://creativecommons.org/licenses/by/4.0/).
Share and Cite
MDPI and ACS Style
Marcus, J.F.; DeMarsh, T.A.; Alcaine, S.D. Upcycling of Whey Permeate through Yeast- and Mold-Driven Fermentations under Anoxic and Oxic Conditions. Fermentation 2021, 7, 16. https://0-doi-org.brum.beds.ac.uk/10.3390/fermentation7010016
AMA Style
Marcus JF, DeMarsh TA, Alcaine SD. Upcycling of Whey Permeate through Yeast- and Mold-Driven Fermentations under Anoxic and Oxic Conditions. Fermentation. 2021; 7(1):16. https://0-doi-org.brum.beds.ac.uk/10.3390/fermentation7010016
Chicago/Turabian StyleMarcus, Justin Fisk, Timothy A. DeMarsh, and Samuel David Alcaine. 2021. "Upcycling of Whey Permeate through Yeast- and Mold-Driven Fermentations under Anoxic and Oxic Conditions" Fermentation 7, no. 1: 16. https://0-doi-org.brum.beds.ac.uk/10.3390/fermentation7010016
Note that from the first issue of 2016, this journal uses article numbers instead of page numbers. See further details here.