
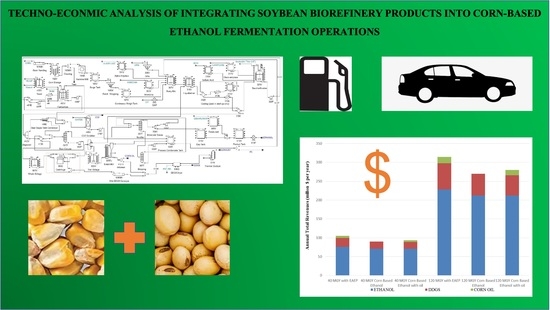
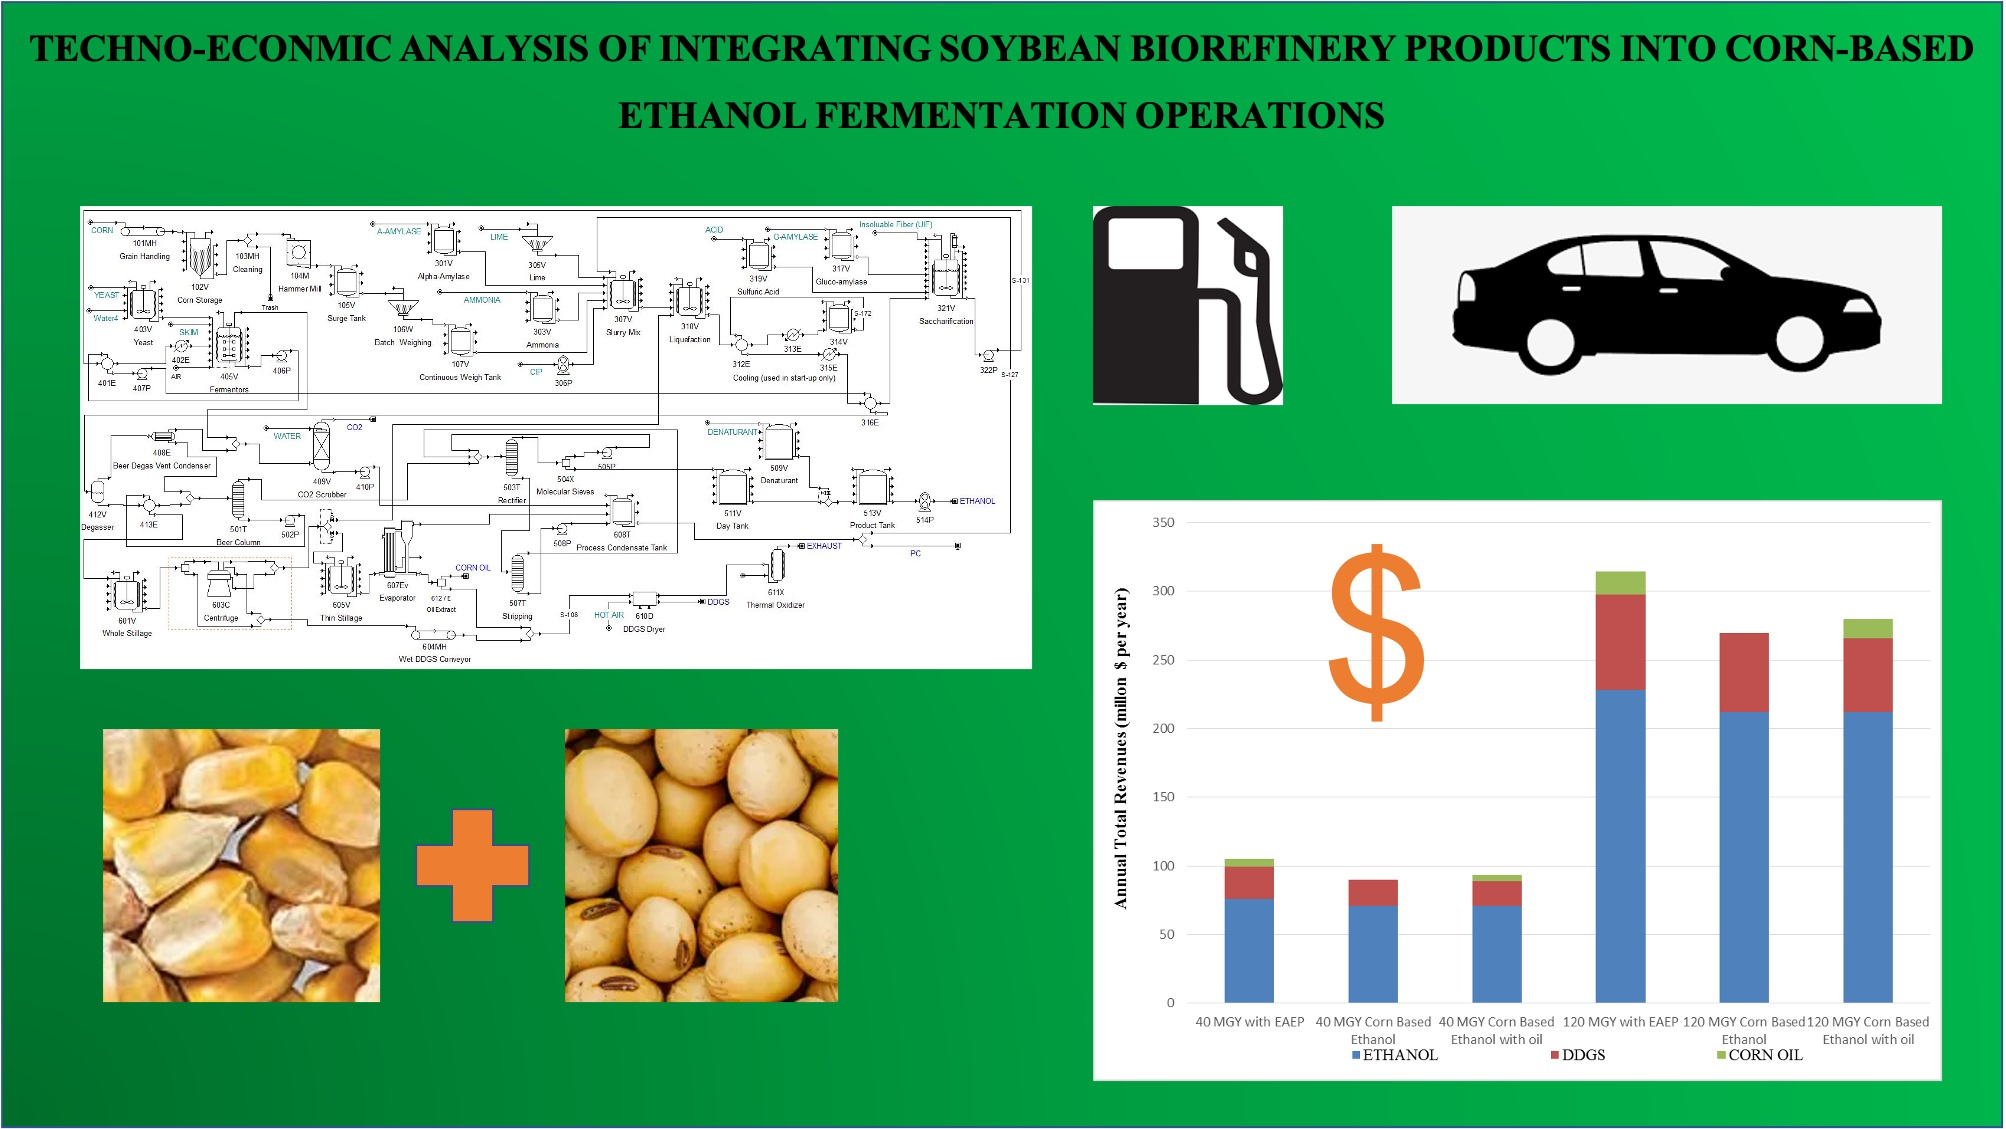
Techno-Economic Analysis of Integrating Soybean Biorefinery Products into Corn-Based Ethanol Fermentation Operations


Department of Agricultural and Biosystems Engineering, Iowa State University, Ames, IA 50011, USA
*
Author to whom correspondence should be addressed.
Fermentation 2021, 7(2), 82; https://0-doi-org.brum.beds.ac.uk/10.3390/fermentation7020082
Submission received: 22 April 2021
/
Revised: 19 May 2021
/
Accepted: 20 May 2021
/
Published: 25 May 2021
(This article belongs to the Special Issue Biofuels Production and Processing Technology)
Abstract
:With the development of agricultural biorefineries and bioprocessing operations, understanding the economic efficiencies and environmental impacts for these have gradually become popular for the deployment of these industrial processes. The corn-based ethanol and soybean oil refining industries have been examined extensively over the years, especially details of processing technologies, including materials, reaction controls, equipment, and industrial applications. The study focused on examining the production efficiency changes and economic impacts of integrating products from the enzyme-assisted aqueous extraction processing (EAEP) of soybeans into corn-based ethanol fermentation processing. Using SuperPro Designer to simulate production of corn-based ethanol at either 40 million gallons per year (MGY) or 120 MGY, with either oil separation or no oil removal, we found that indeed integrating soy products into corn ethanol fermentation may be slightly more expensive in terms of production costs, but economic returns justify this integration due to substantially greater quantities of ethanol, distillers corn oil, and distillers dried grains with solubles being produced.
1. Introduction
As a renewable energy resource, bio-based ethanol has been successful as a partial replacement to gasoline fuel over the last few decades. It has been shown to be relatively benign to the environment, provided many jobs to rural economies in the USA, made substantial contributions to the global feed industry, and provided improved energy security for U.S. agriculture [1]. In fact, the corn-based ethanol industry and related upstream and downstream industries have been very dynamic in recent years and have been developing various new technologies to increase economic returns. To obtain better efficiency and lower production costs, it may be prudent to combine the corn-based ethanol process with other processes. For example, if a biorefinery operation can make several types of products simultaneously, it may have lower costs for the combined products rather than producing the same products at different facilities. Soybean processing may be one type of bioprocessing system that might make sense to incorporate into corn processing operations. In the soybean oil extraction process, enzyme-assisted aqueous extraction processing (EAEP) is a new method to obtain soybean oil, which uses water as an extraction media to remove oil from ground soybeans. However, to date, it is not yet commercialized extensively.
Due to cell walls and membranes around oil and protein bodies, which create barriers to freeing oils and proteins in soybeans, EAEP utilizes the insolubility of oil in water and uses water as a media to fractionate oil, protein, and fiber. Enzymes can be added to assist in breaking down cell walls [2]. EAEP denatures some proteins and destabilizes the cream (oil), which can increase the final oil extraction yield to nearly 90% [3]. The enzymes in the skim can be recycled in the extraction process. Soy skim has the potential to be used as a partial water replacement in the corn-based ethanol process. Actually, in addition to being used as a water source, soy skim has been shown to be an effective nutrient source and has increased ethanol yield and the protein content in final coproducts in laboratory-scale fermentations [4,5]. The high fiber content of soybean fiber from the extraction process is another advantage of EAEP, which can potentially be pretreated and then used directly in saccharification prior to ethanol fermentation. During soybean EAEP, fiber fractions contained 60–70% moisture, and the solids were mainly cellulose, hemicellulose, and insoluble proteins. There may also be some advantages to using soy fiber in terms of resulting DDGS value.
Laboratory-scale research [6] was conducted using coproducts from EAEP on ethanol production in laboratory-scale fermentations. This study indicated that adding soy skim and untreated insoluble fiber from EAEP significantly increased ethanol production rates and ethanol yields. Thus, integrating EAEP products (fiber and skim) into corn-based ethanol production might improve the efficiency for producing ethanol as well as the value of the DDGS.
The composition of skim has been found to be 9% solids (91% moisture content), 6.3% (db) lipids, 57.6% (db—dry basis) protein, 10.1% (db) ash, and 26% (db) carbohydrates; the composition of insoluble fiber has been found to be 15.1% solids (85% moisture), 4.7% (db) lipids, 7.7% (db) protein, 4.0% (db) ash, and 83.6% (db) carbohydrates [6].
Even though integrating corn–soybean fermentation has effectively used for corn-based ethanol production on a lab scale, there is a lack of economic information on efficiency and profit at larger scales. In order to determine if this type of biorefining is economically viable, a techno-economic analysis for combining corn and soybean biorefinery processes is necessary. The objective of this study was to use techno-economic analysis (TEA) for developing complete estimates of all costs associated with the construction and operation of this type of integrated system. In addition, this study compared an integrated corn and soybean biorefinery with an original corn-based ethanol process in economic performance, to explore the effect of new applications on the corn-based ethanol production under 40- and 120-million-gallon ethanol production scales.
2. Materials and Methods
2.1. Computer Model
SuperPro Designer v8.5 (Intelligen, Inc., Scotch Plains, NJ, USA) was utilized to model biofuels processing for an integrated corn and soybean biorefinery. This industrial design software facilitated modeling, evaluation, and optimization of integrated processes for a wide range of industries [7]. Based on the structure of a modified model [8,9], this model was updated by adding operations for integrating soy insoluble fiber (UIF) and soy skim, thus developing an integrated corn and soybean biorefinery. Due to the UIF and skim added as raw material, the energy and mass balances for the individual unit operations were reset, and the recycling index was also updated so the system obtained the mass and economic balances for the entire manufacturing process.
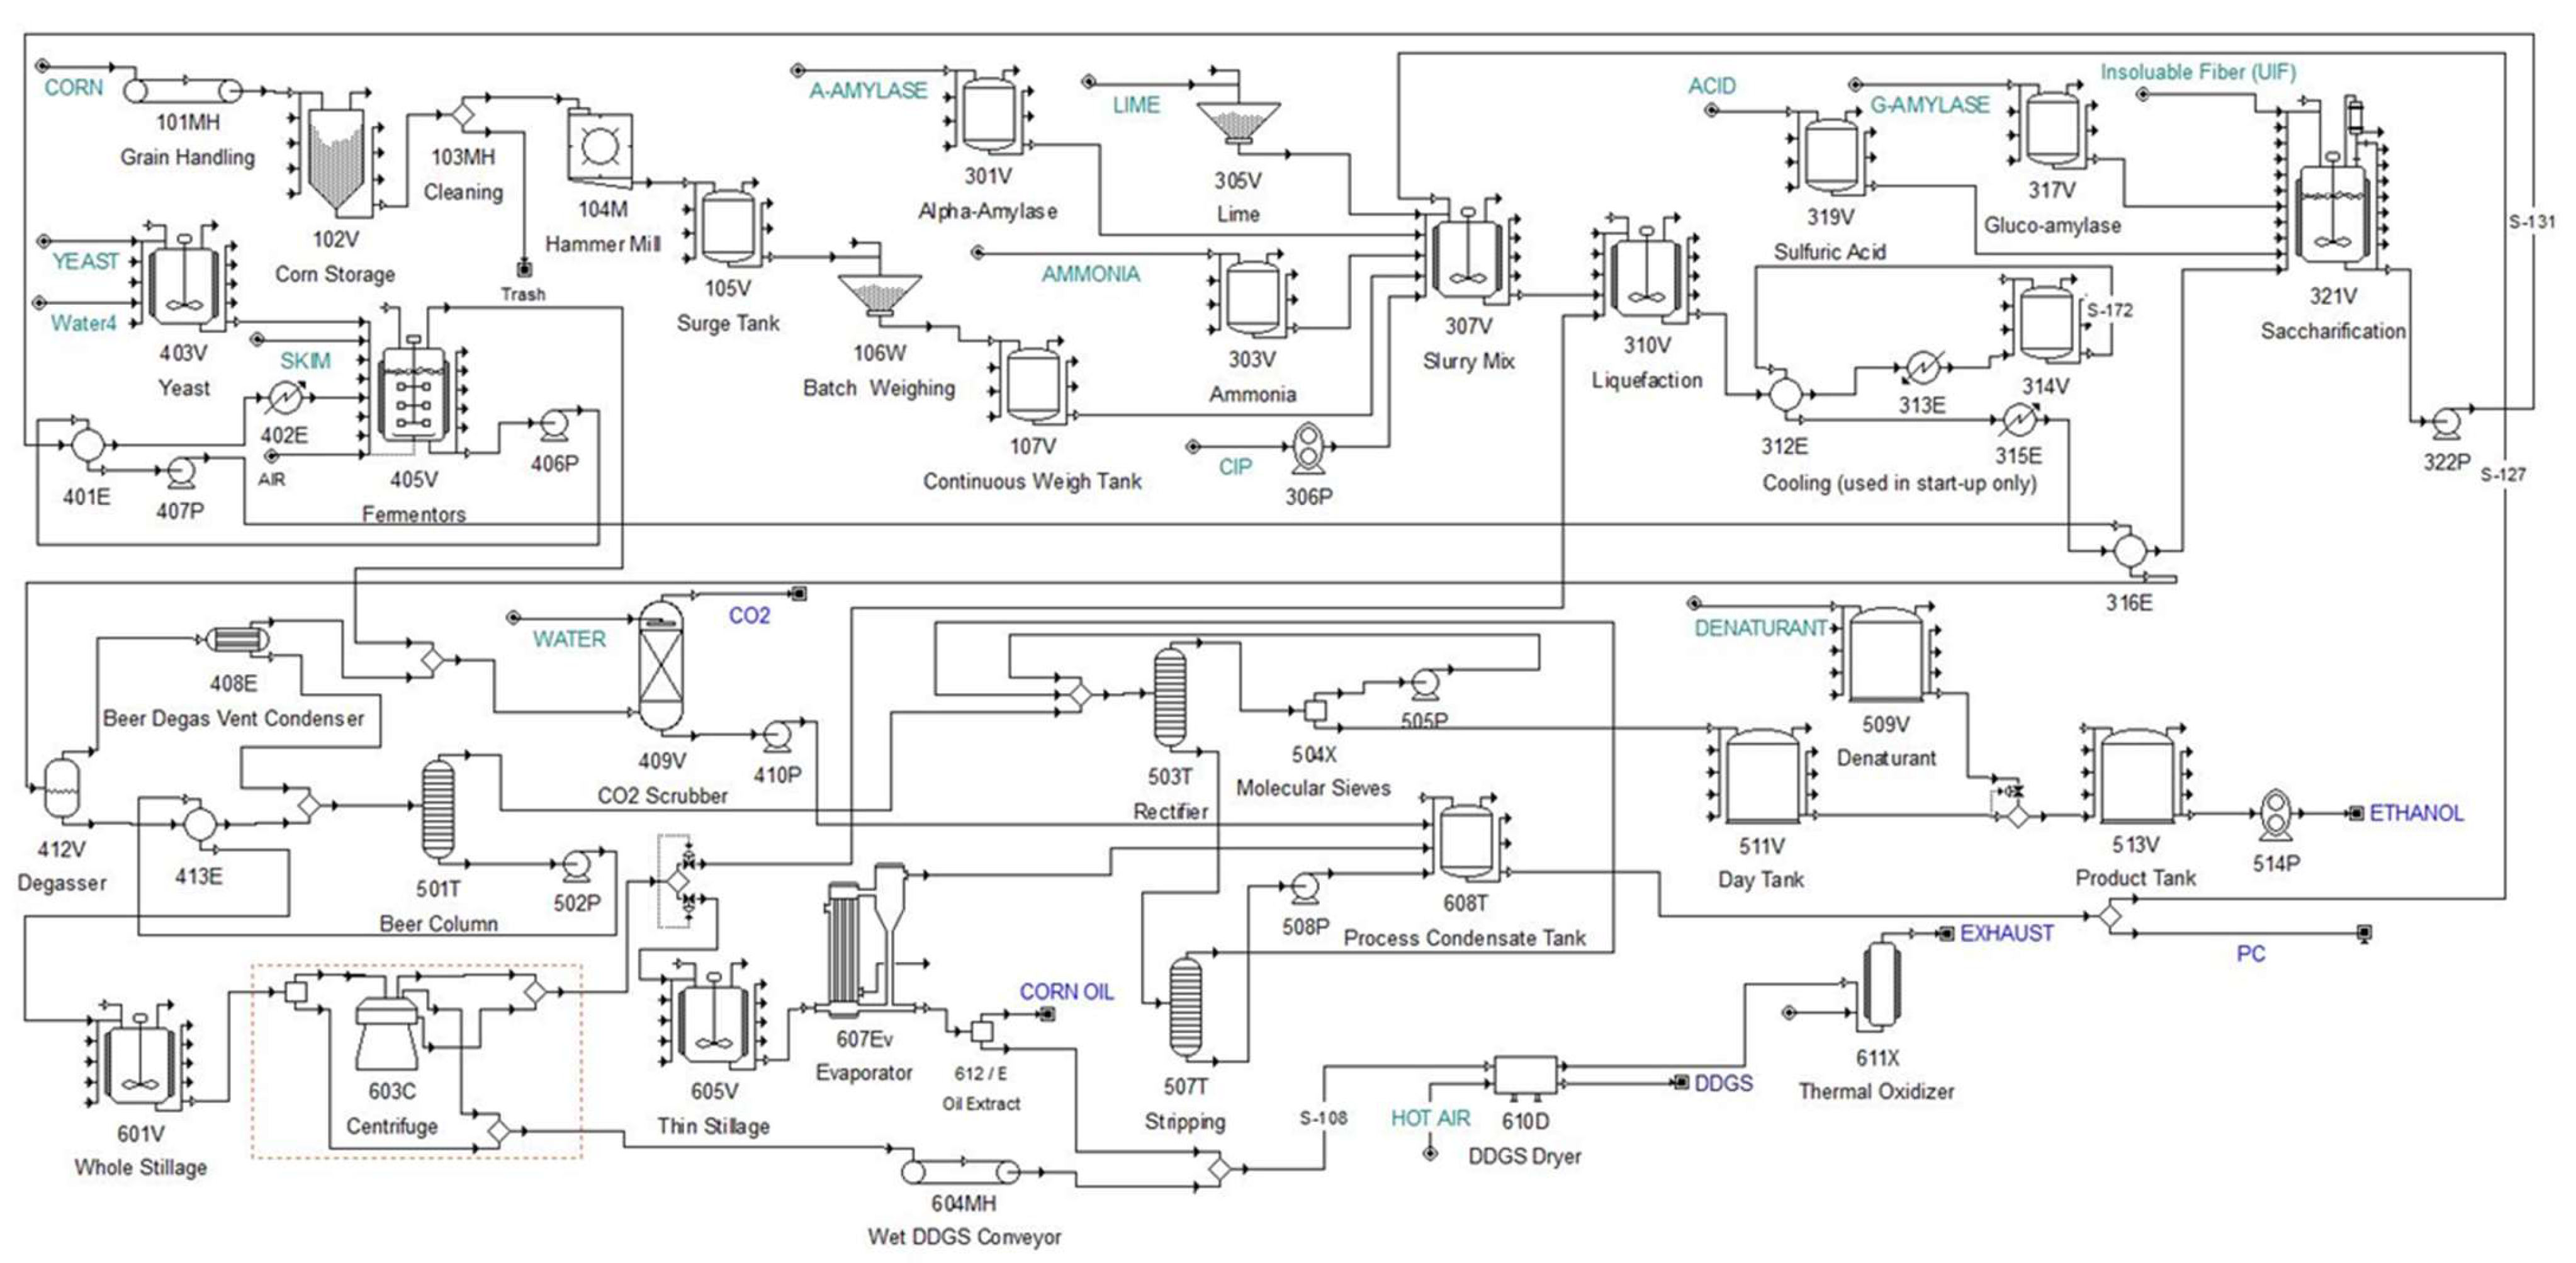
This study utilized 330 working days per year to mirror real industrial processing operations, which generally operate 24 h per day year-round. All annual calculations were based on these factors and were included in the range of reports available by the program. After setting basic data into the model, SuperPro produced a variety of reports based on simulation data changes for each scenario and facilitated judging the economic feasibility of the various scenarios. These reports were produced and compared for each year for each processing scenario, as well as sensitivities for each affected factor. The model framework and structure of dry grind ethanol from corn processing is shown in Figure 1.
2.2. Simulation Scenarios
Scenarios were updated and modified based on the basic corn-based ethanol process plant model, which was developed by [8] and expanded by [9]. Two scenarios were set below:
- Integrated EAEP with corn-based ethanol process producing 40 million gallons ethanol per year with distillers corn oil removal vs. no oil separation.
- Integrated EAEP with corn-based ethanol process producing 120 million gallons ethanol per year with distillers corn oil removal vs. no oil separation.
Based on the pilot scale research of [5], 75 kg of raw soybeans in the EAEP process could yield 14.28 kg oil, 50.64 kg UIF, and 363.81 kg soy skim. According to previous studies, [6] indicated maximum ethanol production could be achieved when UIF and skim were mixed together with at a rate of corn-to-UIF ratio 1:0.16 and skim-to-UIF ratio 6.5:1. To be appropriate for the scales of 40 and 120 million gallons ethanol production, the 75 kg per hour soybean pilot scale with EAEP process was scaled up to commercial scales, which were 17 million and 51 million kg annual soybean oil production, respectively [10]. This equated to UIF of 7596 kg per hour and soy skim of 54,572 kg per hour for the 40 MGY; while large (120 MGY) scale equated to UIF of 22,788 kg per hour and soy skim of 16,3716 kg per hour. After adding UIF and soy skim in the process at these rates, the ratio of water-to-solids in the fermenter increased from 2.0:1 to 2.5:1, which obtained optimal ethanol yield and maximum ethanol production (based upon information from [5,8]).
In this model, operating cost included raw material cost, labor cost, facility cost and utility cost. Corn, UIF and skim were the main raw materials used, which made a significant contribution on materials costs. The market price of corn was USD 145.67 per metric ton, and untreated insoluble fiber was USD 30.66 per metric ton in 2015 [11,12]. The market price of soy skim was unavailable due to lack of data and was generally disposed of as waste trash—since commercial production of EAEP has not really begun yet. In this model, the price of soy skim was treated as water with a price of USD 0.04 per metric ton in 2015 and was mainly used to reduce the water requirement in the fermentation process [13]. For the utility cost, steam was mainly utilized as a heat transfer agent, while natural gas and electricity were used as the energy resource. In this model, steam was set as USD 12.86 per metric ton, while the industrial price of natural gas and electricity in 2015 was set as USD 4.4533 per MBtu (million British Thermal Units) and USD 0.0691 per kW⋅h [13,14]. Labor cost and inflation rate were set according to data form the U.S. Department of Labor. Installation cost depended on various types of equipment. Loan interest was set at 7.0% per year as a common assumption.
Similar to previous studies, the facility costs in this study were composed of maintenance costs, equipment depreciation, interest on debt, insurance, taxes, and other industrial expenses. Based on basic parameters set by [8], maintenance expenses were determined as 3% of total capital costs, while insurance and other industrial expenses were set to 0.8% and 0.75% of the capital cost. Depreciation was set as an initial index, and taxes were set as 24%, because corn-based ethanol plants belong to green and renewable energy industrial sectors, which have a lower tax rate than basic chemical industrial plants [15].
The cost of labor was determined based upon a lump estimate of number of working hours per year (330 day per year). The hourly wage was based on U.S. Department of Labor minimum wage data [16]. This model multiplied the minimum wage by available workers and automatically created labor costs for all scenarios.
Ethanol was the main product of the entire process, with DDGS and DCO extracted from DWG, both of which were treated as coproducts for revenue estimation. The market prices of ethanol (USD 594.91 per metric ton) and DDGS (USD 157.64 per metric ton) were collected from the USDA database in 2015. Corn distillers oil (USD 611.32 per metric ton) from the oil extraction process was collected from The Jacobsen Company [17]. In addition, physical properties, material combinations, and other basic indices were maintained at a similar level as the original corn-based ethanol model [8,9]. Among profitability analyses parameters, unit production cost, unit production revenue, net profit, and payback time were the most important results to explore between the various scenarios. Specific information about how costs, profits, payback, etc. were calculated in this model have been provided elsewhere [10].
3. Results
3.1. Capital Costs
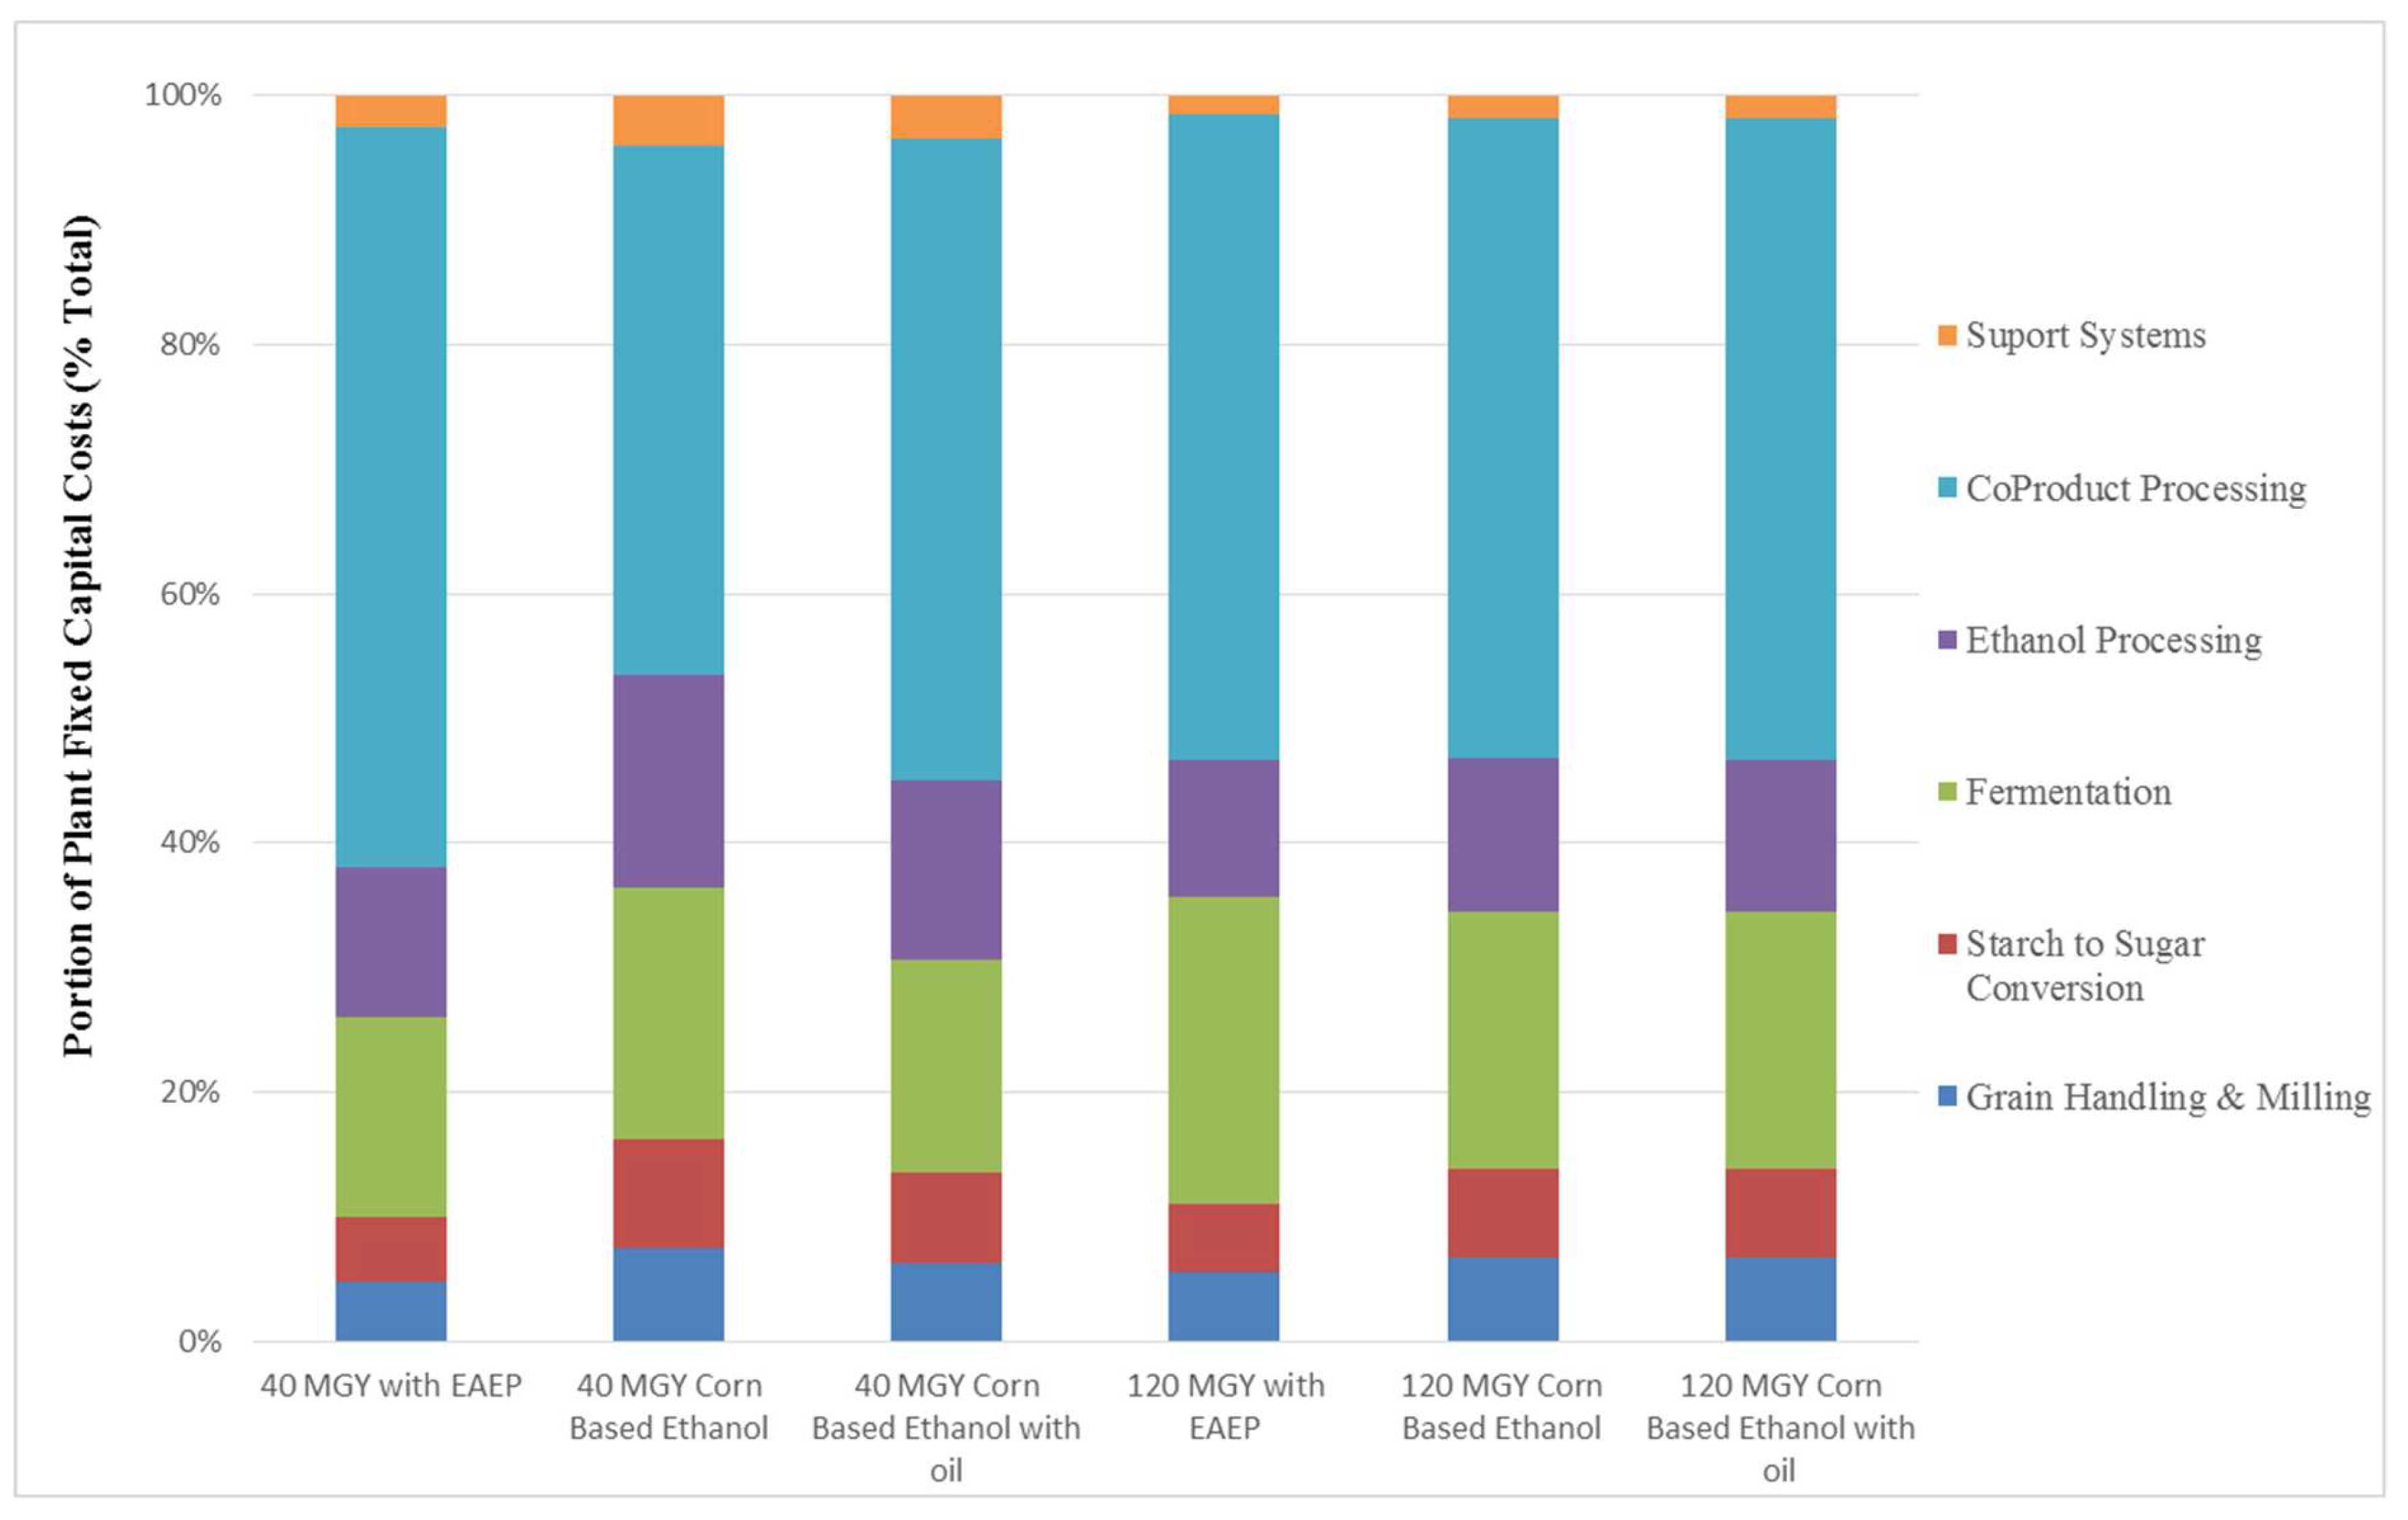
In this study, the total capital cost was composed of the following individual process operations: grain handling and milling, starch to sugar conversion, fermentation, ethanol processing, coproduct processing, and common support systems. For each individual process’s capital cost, the final result was determined based on the equipment purchase price, setting a material factor by the model, and an installation factor [8,9]. For simplifying some indirect support equipment, steam generation and cooling water equipment were not included in capital cost and were treated as purchased utilities. All settings were based on previous data provided by [8,9], which reflected commonly used technologies at US corn-based ethanol plants.
The effect that each of these scenarios had on total capital costs are presented in Figure 2. The simulation data indicated that the cost of starch to sugar conversion decreased in the integrated EAEP models due to soy skim partially replacing the water requirement, which caused a decrease in reactor size requirements. In contrast, the capital cost in fermentation, ethanol processing and coproduct processing increased, which was caused by more products being produced by the additional UIF and skim from EAEP. Overall, the total capital cost required increased at both scales (40 and 120 million gallon) ethanol production which integrated EAEP products and increased to 95.27 million and 162.78 million USD. Coproduct processing represented the largest portion of fixed capital costs in both the 40- and 120-million-gallon ethanol plant models. For the 40-million gallon plant, the coproduct processing costs were 56.5 million USD with the integrated EAEP scenario, were 26.2 million USD for the traditional corn-only processing, and were 37.8 million USD for corn ethanol processing using oil separation systems. For the 120-million gallon plant, the coproduct processing costs were, respectively, 84.4, 68.9, and 68.9 million USD. It was apparent that factory scale clearly impacted the proportion of processing costs that were due to coproduct processing.
3.2. Annual Operating Costs
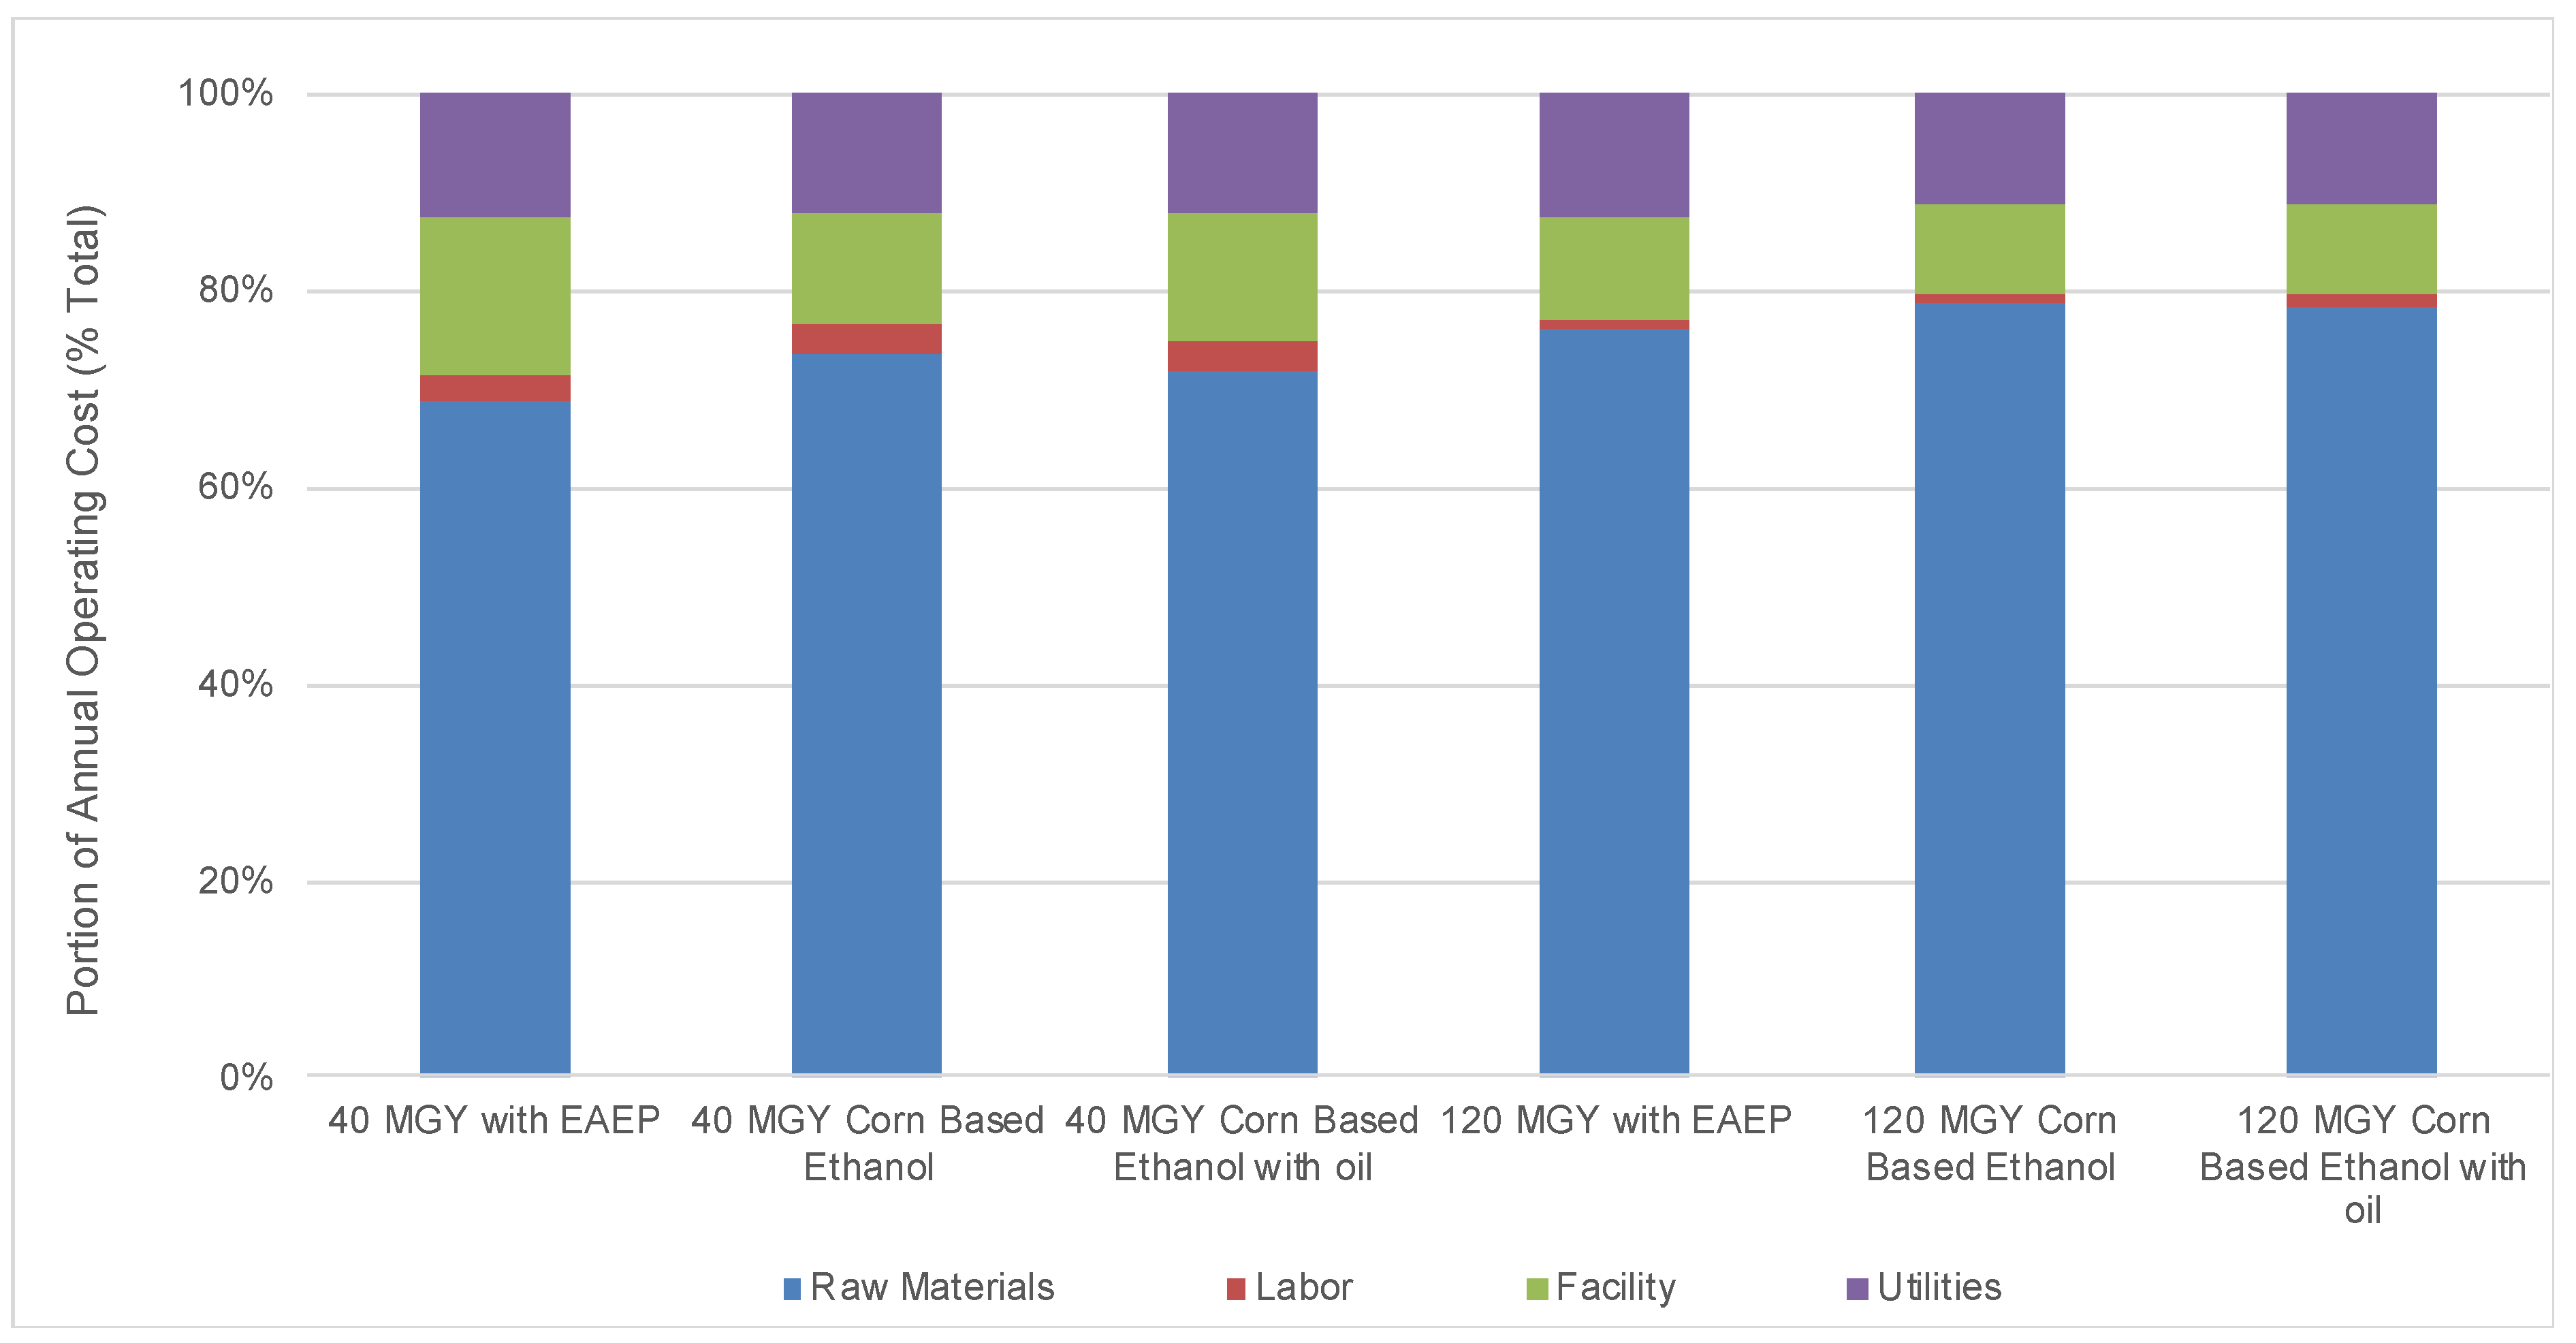
Similar to previous studies, annual operating costs in this study consisted of labor, facility, utility costs, and raw material costs in all three scenarios. In this model, consumables, advertising, royalties, and failed product disposal were not estimated in this techno-economic analysis. Due to added skim and UIF from the EAEP process, integrated EAEP with a corn-based ethanol process required greater operating costs. The 40- and 120-million-gallon integrated EAEP with corn-based ethanol production required 86.71 million and 233.80 million dollars per year, respectively which was around 8% more than the models which did not integrate EAEP products (Figure 3). Differently from original corn-based ethanol models and corn-based ethanol with oil extraction processes, the corn-based ethanol process with integrated EAEP had lower portions of operating costs in raw materials, but higher rates in facility costs and utility costs. The reason for this was that integrating EAEP into corn-based ethanol production required higher liquid-to-solid conditions in fermentation, which meant more DDGS was produced in the coproduct processing operation.
3.2.1. Facility and Labor Costs
A portion of the facility in the EAEP 40 MGY scenario was 15.98%, and the portion of the facility in EAEP 120 MGY scenario was 10.13% (Figure 3). Both scenarios were around 3% higher than other scenarios.
Compared to other indexes of operating costs, labor cost was relatively stable in all scenarios, and was around 2% of total operating cost (Figure 3).
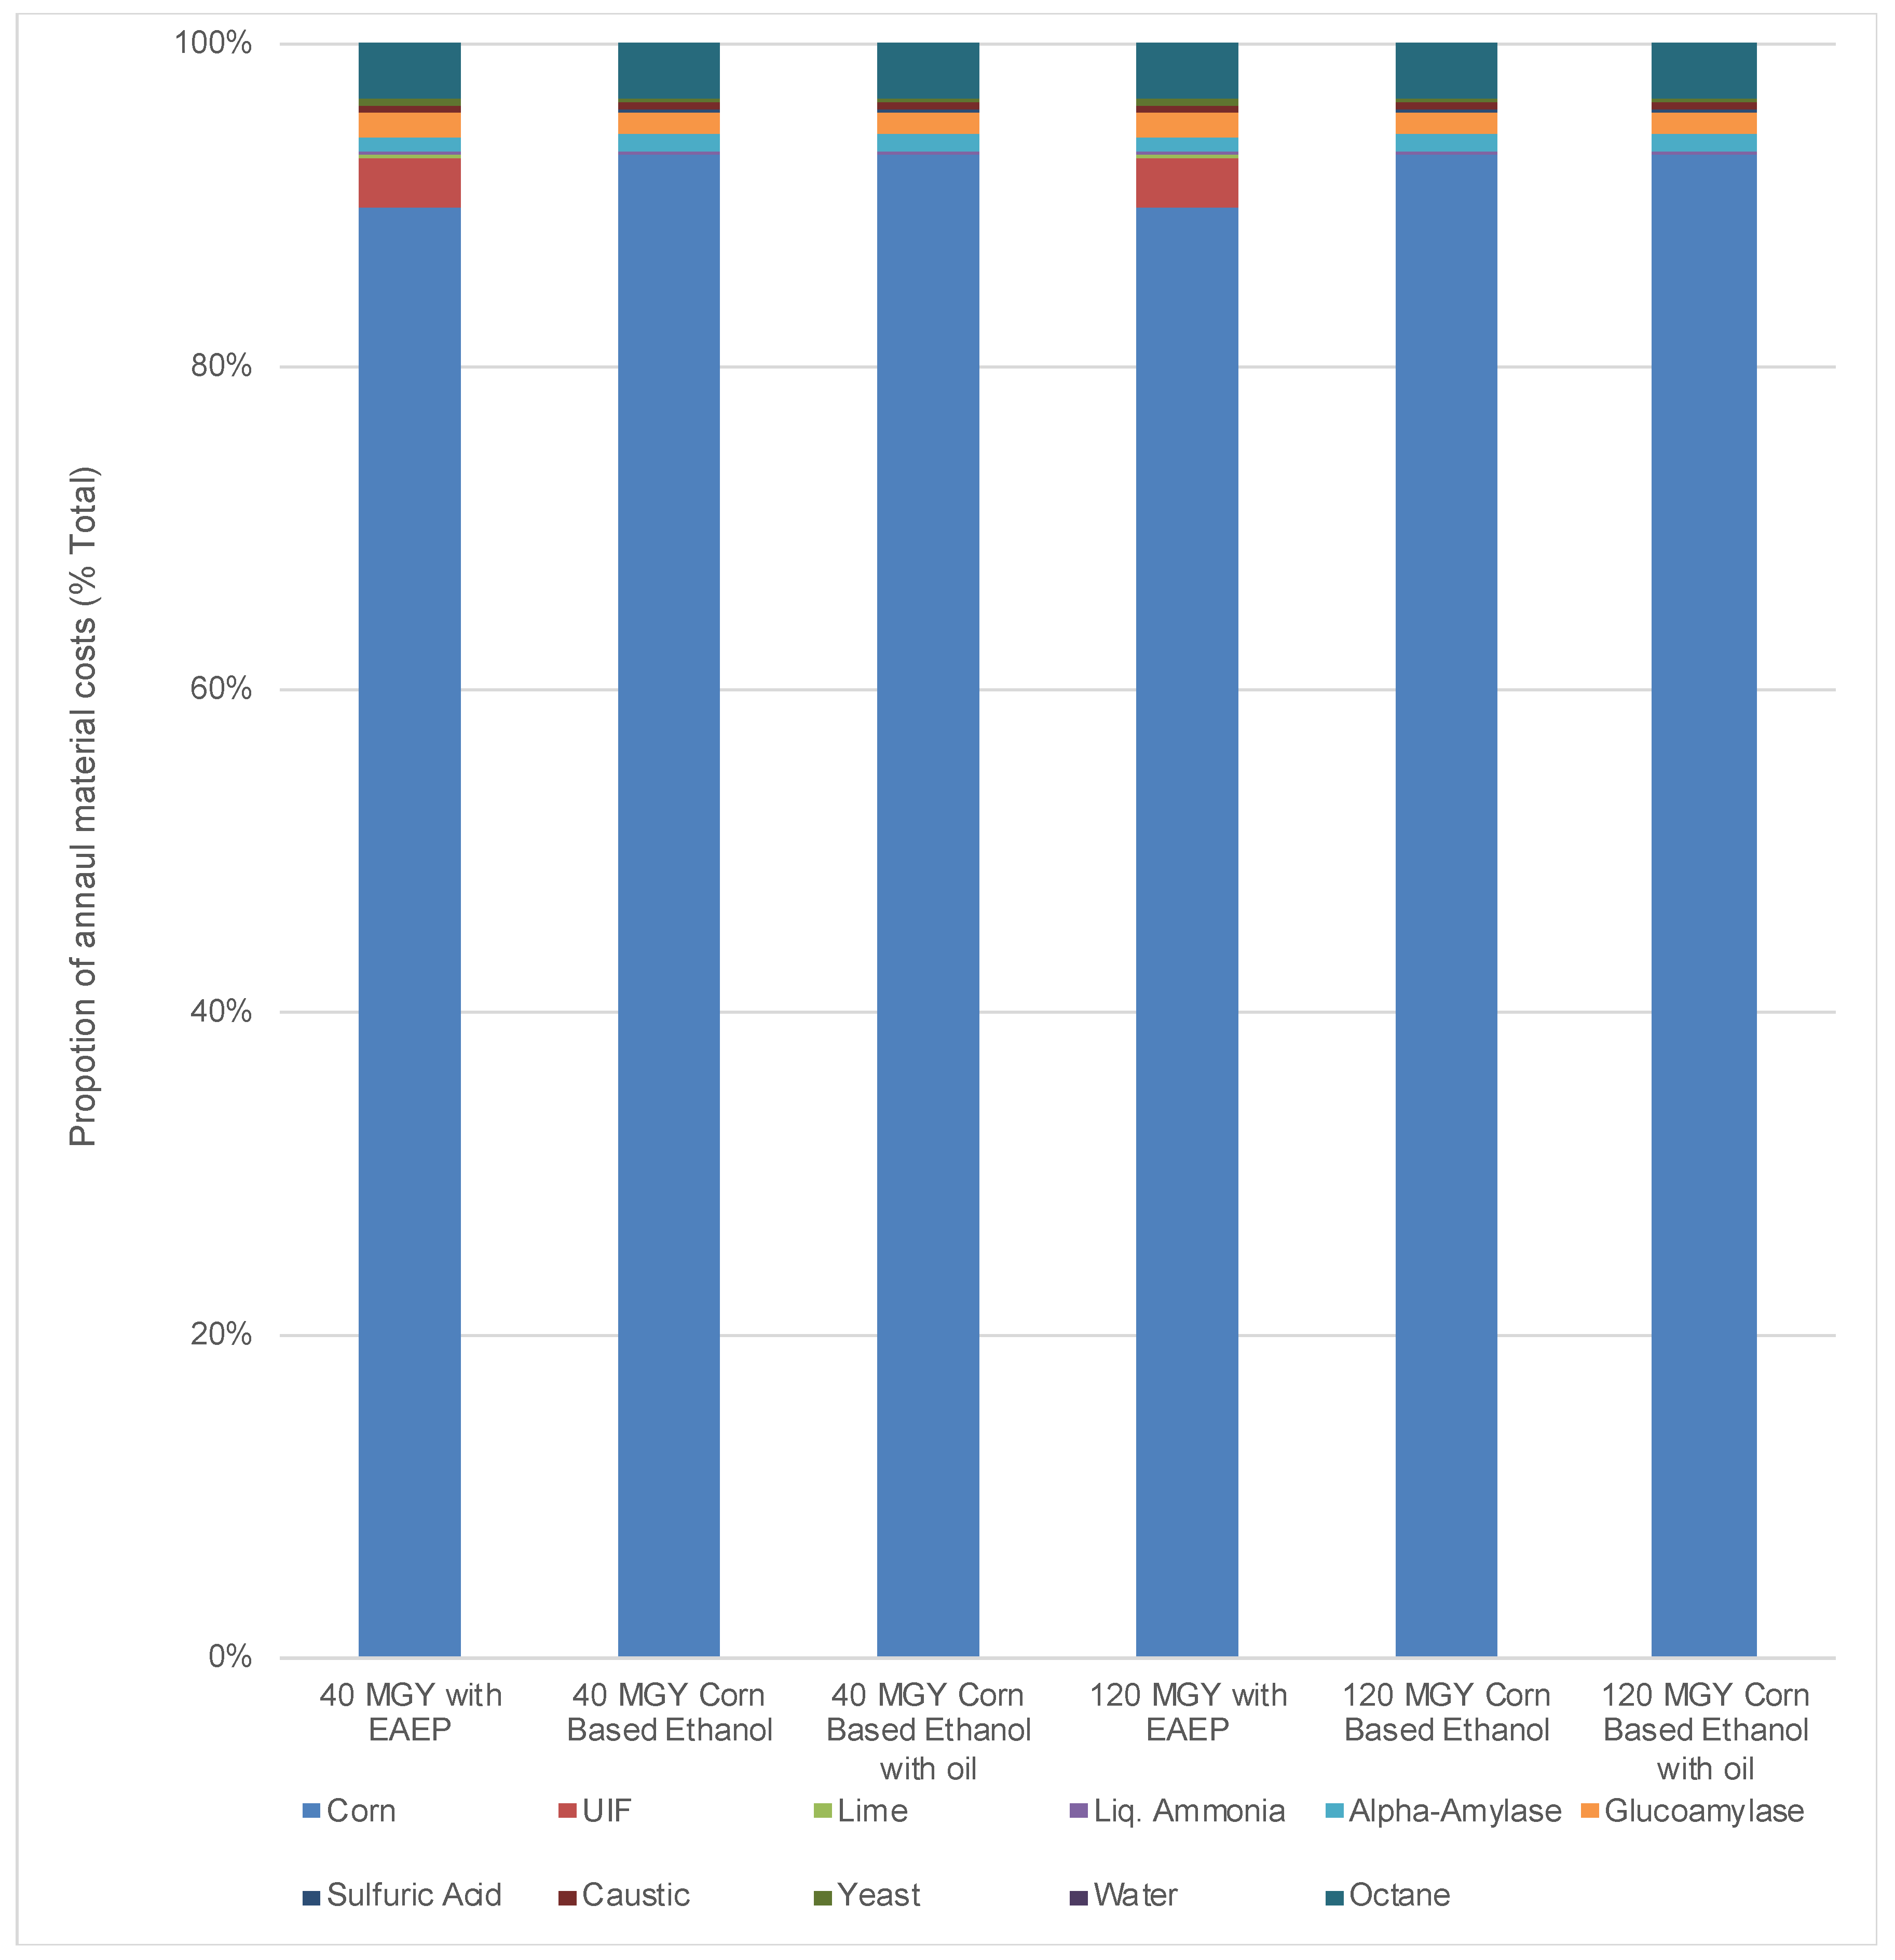
3.2.2. Material Costs
Differently from previous studies, the raw materials for integrated EAEP into a corn-based ethanol plant included corn, water, yeast, caustic, lime, octane, ammonia, sulfuric acid, gluco-amylase, alpha-amylase, as well as untreated insoluble fiber and soy skim from the EAEP process. All material prices were set using marketing prices of 2015. The simulation results are shown in Figure 4. Differently from other scenarios, untreated insoluble fiber made a significant contribution to the annual material cost in the 40 and 120 MGY with integrated EAEP products. The corn portion cost was decreased in those two scenarios, as it was replaced by the coproducts from EAEP.
For the 40-million gallon plant, the raw material costs were 59.6 million USD/year with the integrated EAEP scenario, were 57.6 million USD/year for the traditional corn-only processing, and were 57.6 million USD/year for corn ethanol processing using oil separation systems. For the 120-million gallon plant, the raw material costs were, respectively, 178.1, 172.1, and 172.1 million USD/year. It was apparent that factory scale clearly impacted the proportion of annual operating costs that were due to raw materials.
3.2.3. Utility Costs
Similar to previous studies, utility costs were mainly from electricity, natural gas, steam, and chilled water. The price of electricity was set at USD 0.0691 per kW h, and natural gas was set at USD 4.4533 per MBtu (million British thermal unit). According to Figure 3, utility costs increased slightly in the two EAEP scenarios, which was required to treat more DDGS coproducts which were being produced. Due to the relatively stable rate of composition for utilities, integrating EAEP within a corn-based ethanol process had only a slight effect on the portion of utility in annual operation costs.
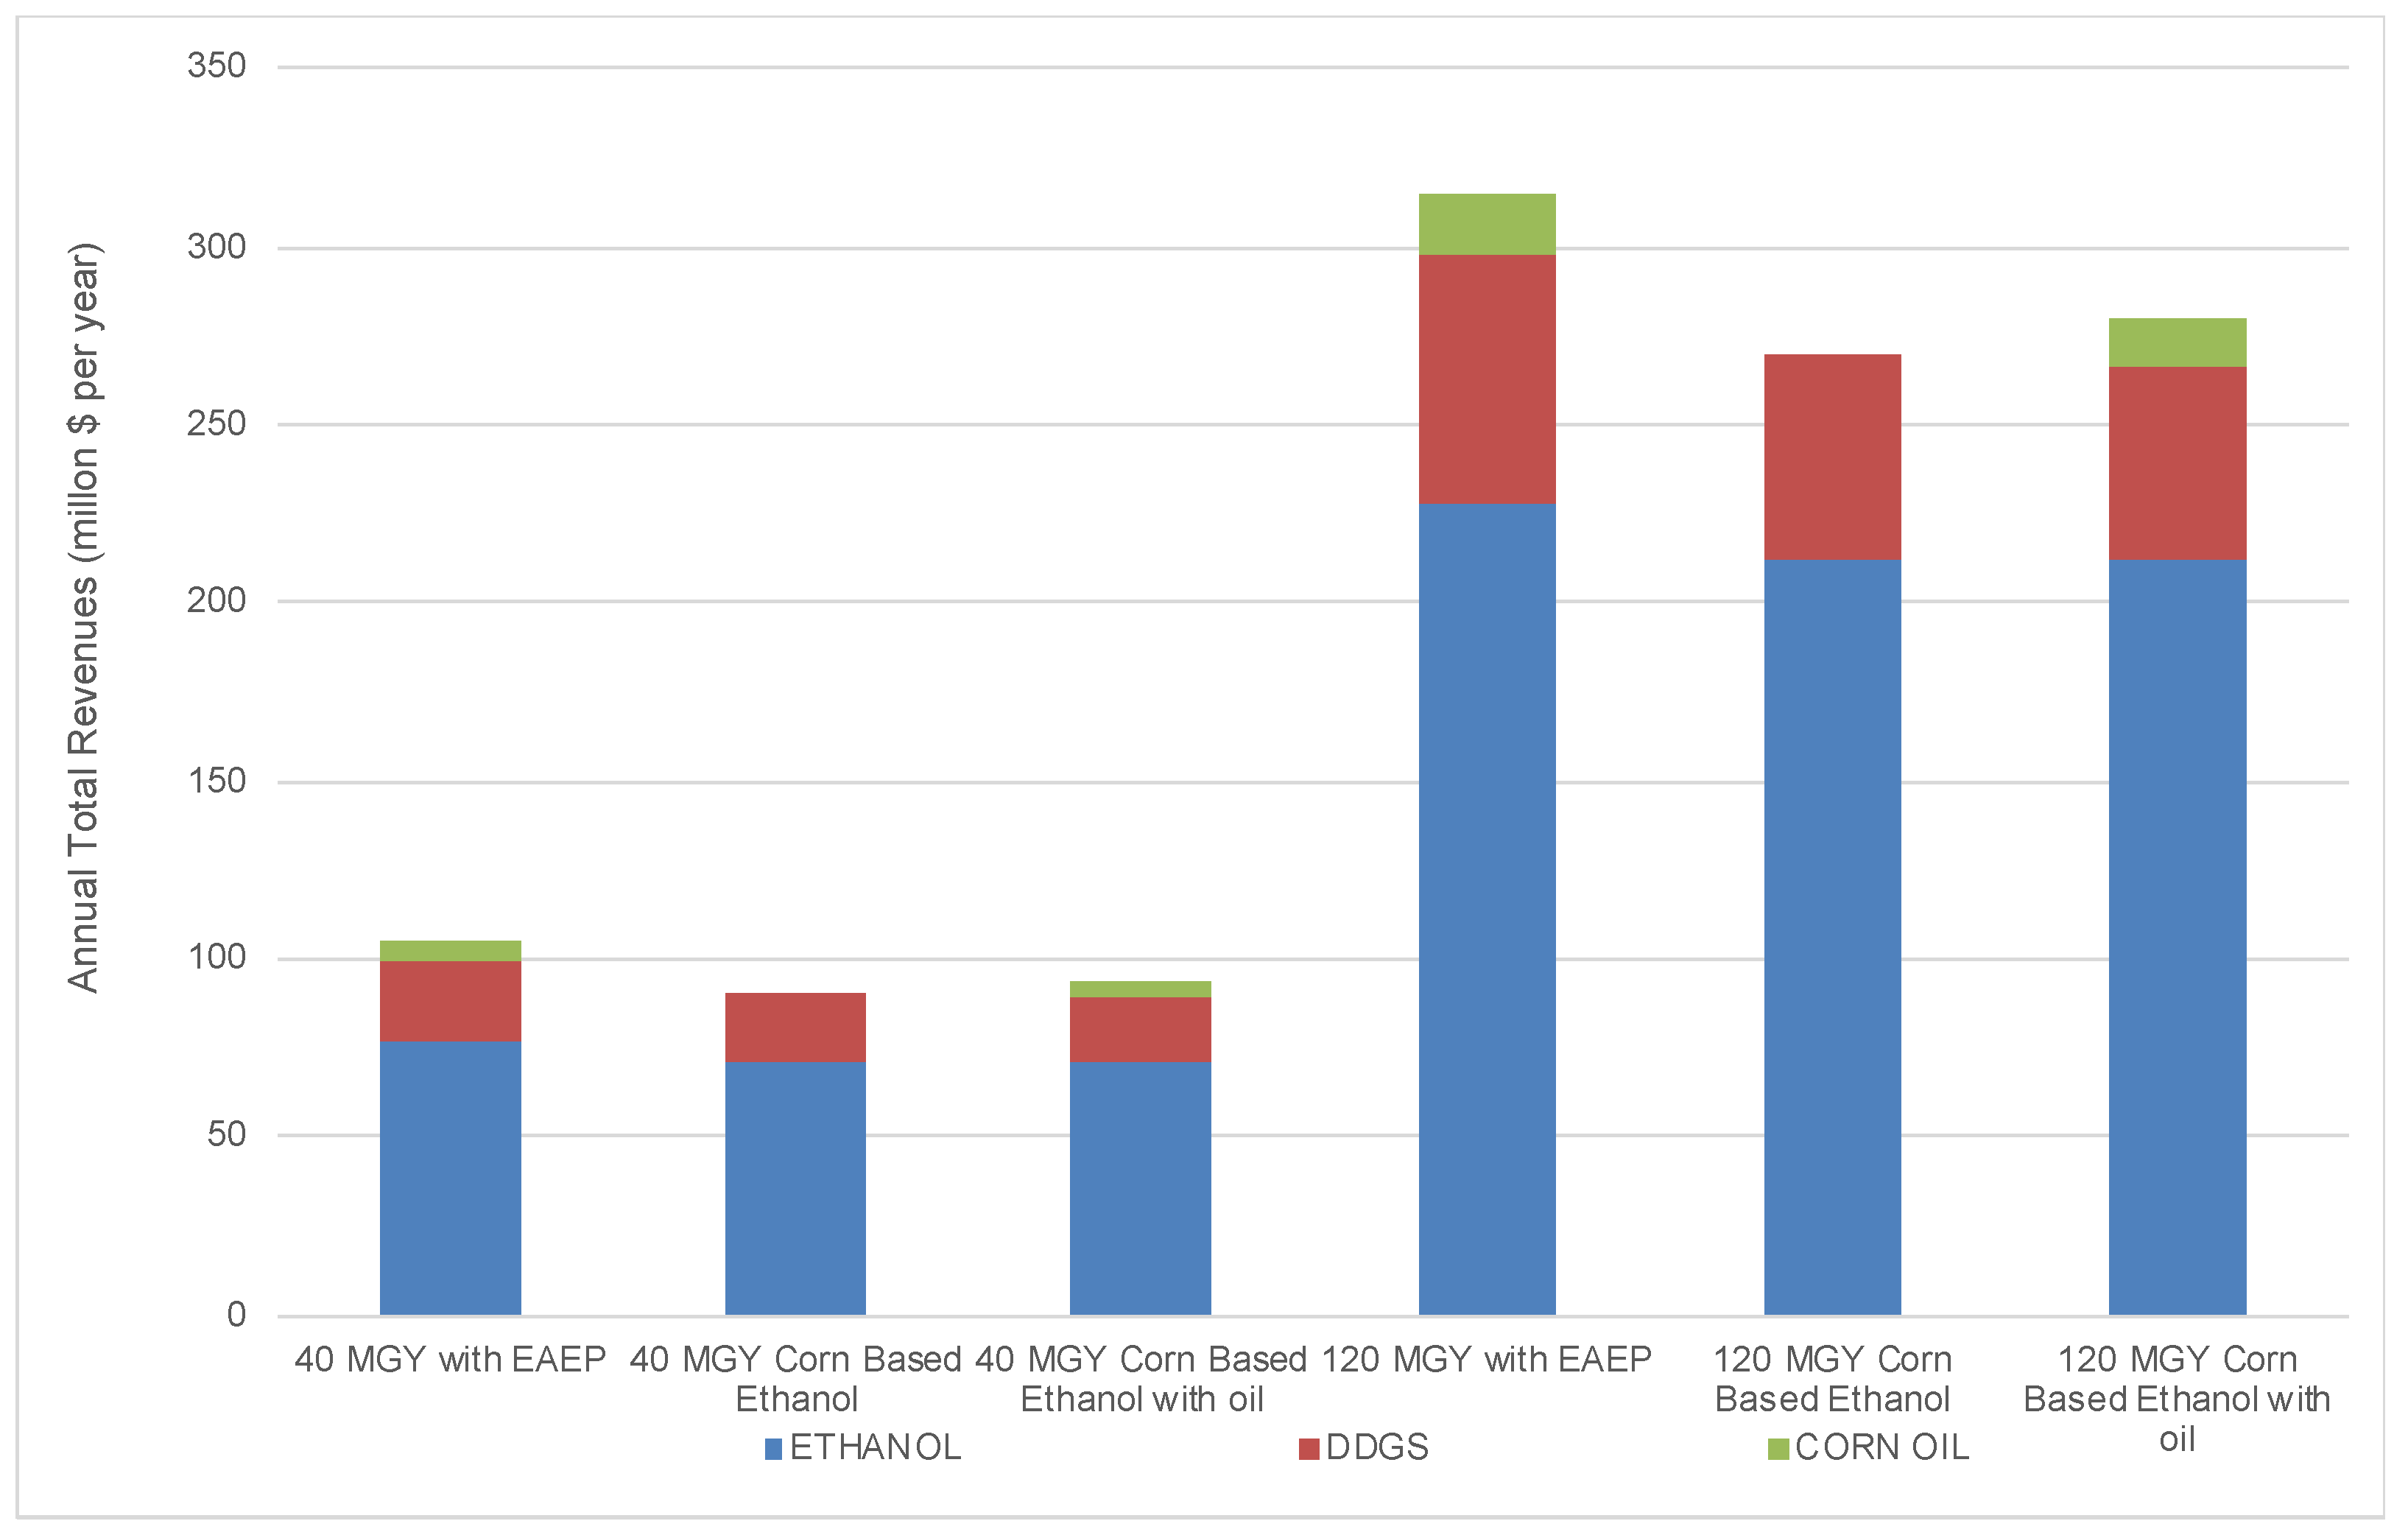
3.3. Annual Revenues
In this study, annual revenues were defined as the total income from all of the final products and coproducts, which included ethanol, distillers corn oil (DCO) and DDGS. The average corn price was USD 594.91 per metric ton in 2015, and the average DDGS price was USD 157.64 per metric ton in 2015 [11]. According to data from [17], the marketing price of DCO was USD 611.32 per metric ton in 2015.
3.3.1. Ethanol
For these simulations, ethanol was approximately 30% of the total mass produced annually by the ethanol process but contributed more than 70% of the total annual revenues in all scenarios. Compared with corn-based ethanol models and corn-based ethanol with oil extraction processes, 40 and 120 MGY with integrated EAEP produced more ethanol, which was a 7.5% increase for ethanol production (Figure 5). The main reason for this increase was that UIF provided more carbon for fermentation, thus integrating EAEP with a corn-based ethanol process increased the ethanol yield and production.
3.3.2. Distillers Dried Grains with Solubles (DDGS)
DDGS made up about 55% of the total mass produced by the ethanol plant. Sales price was determined using [11]. Comparing corn-based ethanol models and corn-based ethanol with oil extraction processes, the revenues for DDGS in the 40 and 120 MGY with integrated EAEP products significantly increased, which was a 20% increase for DDGS annual revenue (Figure 5). The main reason for this increase was that skim and UIF supplied more DDGS mass and thus resulted in more DDGS sales.
3.3.3. Distillers Corn Oil (DCO)
Similar to previous studies, oil extraction rates for this model were set at 80%, which was a reasonable rate for current industrial production. Compared to corn-based ethanol with an oil extraction process (both production scales), the revenue for oil in the 40 and 120 MGY with integrated EAEP products scenarios significantly increased, which was around a 23% increase for the oil annual revenue (Figure 5). The main reason was skim and UIF from the EAEP process supplied extra oil content, which facilitated oil extraction from the thin stillage.
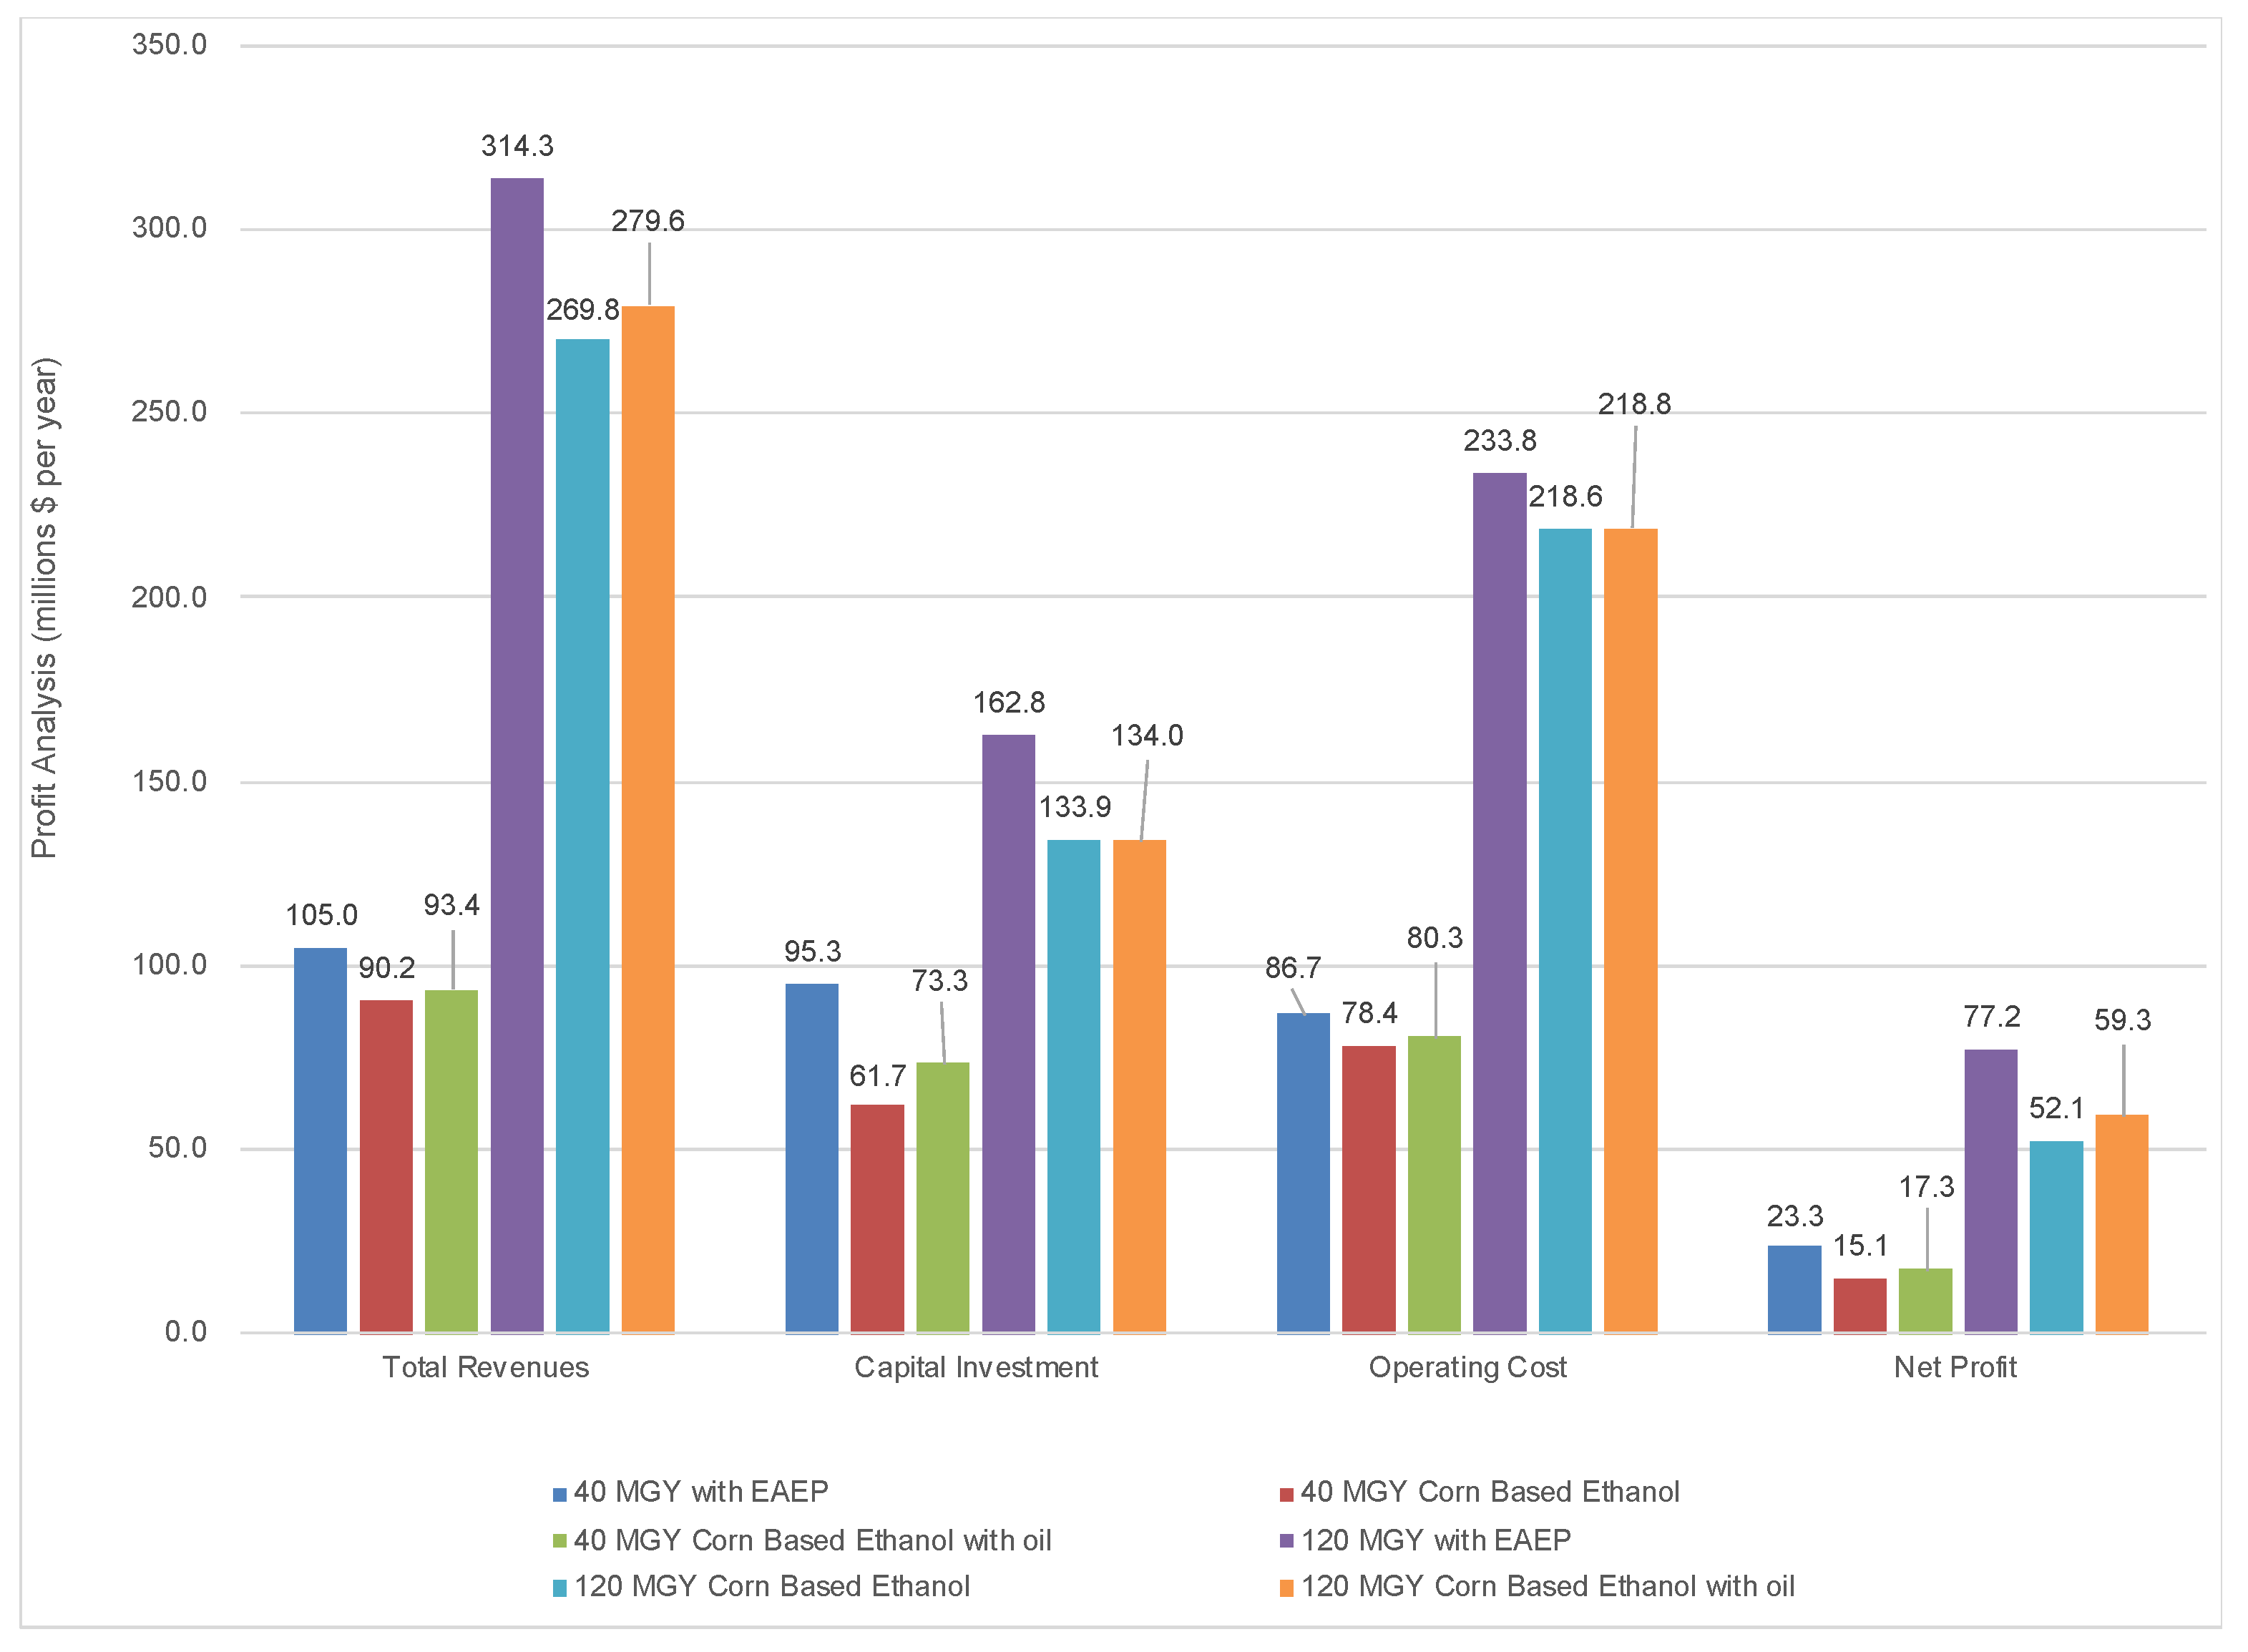
3.4. Gross Operating Margins and Payback Time
Similar to previous studies, gross profit was defined as the annual revenues minus the annual operating costs. The payback period was the length of time required to recover the cost of an investment. Gross operating margins are seen in Figure 6, which contains capital costs, operating costs, revenues, and profits in millions of dollars per year. Figure 6 clearly indicates that the 40 and 120 MGY with integrated EAEP products scenarios had higher amounts in capital investment and operating cost, which was directly affected by the addition of soy skim and UIF from the EAEP process. However, due to more resources for fermentation and coproduct processes, the corn-based ethanol process with integrated EAEP obtained more revenues from the higher amounts of ethanol, DDGS and distillers corn oil production. The 40 MGY with EAEP scenario obtained USD 23.33 million per year at the scale of a 40 million gallons ethanol per year, while the 120 MGY with integrated EAEP scenario obtained USD 77.17 million per year for the 120 million gallons per year ethanol process. The net profit results indicated that the 40 and 120 MGY with integrated EAEP products scenarios had better performance, while corn-based ethanol models with oil extraction also obtained more profit than the original corn-based ethanol process (i.e., without oil separation).
The annual operating costs and annual revenues were then divided into dollar per kg ethanol basis, which directly reflected the efficiency of how costs are related to each kilogram of ethanol produced by the plant. Unit production cost, unit production revenue, and payback time are shown in Figure 7. Not surprisingly, due to economies of scale, the unit production cost decreased when increasing the production scale. The corn-based ethanol process with integrated EAEP required more equipment and utility capacity, causing small increases in unit production. Due to the addition of UIF and skim from EAEP, unit production revenues increased with more ethanol and other coproducts being produced. Payback time also indicated that integrating EAEP with a corn-based ethanol process had economic feasibility in industrial applications. In addition, larger scales owned a higher efficiency for unit production.
4. Conclusions
To perform economic calculations for integrating EAEP products into a corn-based ethanol processes, SuperPro Designer was used for techno-economic analysis on two industrial scales—40 and 120 MGY ethanol production—both without and with corn oil separation operations. According to the simulation results, integrating EAEP with corn-based ethanol processing required more capacity for equipment and utilities, causing small increases in unit production costs. Due to the addition of UIF and skim from EAEP, unit production revenues increased by generating more ethanol and other coproducts. Payback time also indicated that integrating EAEP with corn-based ethanol processing has economic feasibility for industrial applications. Even though economic analyses look promising, to date, this integration has not yet been commercially realized. In fact, EAEP soy processing has not been widely commercially deployed either. Future research should aim to optimize process efficiencies and lower production costs in order to make this type of processing more economically attractive.
Author Contributions
W.Z. built and tested the model, and drafted the paper; K.A.R. supervised the project, verified the model results, and edited the paper. Both authors have read and agreed to the published version of the manuscript.
Funding
United States Department of Agriculture, National Institute of Food and Agriculture.
Institutional Review Board Statement
Not applicable.
Informed Consent Statement
Not applicable.
Data Availability Statement
Not applicable.
Acknowledgments
The authors would like to thank Andy McAloon and Winnie Yee at the United States Department of Agriculture-Agricultural Research Service (USDA-ARS) for developing the original SuperPro model of the corn ethanol plant, which they generously shared, and which we built and expanded upon during this research project.
Conflicts of Interest
The authors declare no conflict of interest.
References
- Alinia, R.; Zabihi, S.; Esmaeilzadeh, F.; Kalajahi, J.F. Pretreatment of wheat straw by supercritical CO2 and its enzymatic hydrolysis for sugar production. Biosyst. Eng. 2010, 107, 61–66. [Google Scholar] [CrossRef]
- Lamsal, B.P.; Murphy, P.A.; Johnson, L.A. Flaking and extrusion as mechanical treatments for enzyme-assisted aqueous extraction of oil from soybeans. J. Am. Oil Chem. Soc. 2006, 83, 973–979. [Google Scholar] [CrossRef]
- Chabrand, R.M.; Glatz, C.E. Destabilization of the emulsion formed during the enzyme-assisted aqueous extraction of oil from soybean flour. Enzyme Microb. Technol. 2009, 45, 28–35. [Google Scholar] [CrossRef]
- Yao, L.; Wang, T.; Wang, H. Effect of soy skim from soybean aqueous processing on the performance of corn ethanol fermentation. Bioresour. Technol. 2011, 120, 9199–9205. [Google Scholar] [CrossRef] [PubMed]
- Yao, L.; Lee, S.L.; Wang, T.; de Moura, J.M.; Johnson, L.A. Effects of fermentation substrate conditions on corn-soy co-fermentation for fuel ethanol production. Bioresour. Technol. 2012, 120, 140–148. [Google Scholar] [CrossRef] [PubMed]
- Sekhon, J.K.; Jung, S.; Wang, T.; Rosentrater, K.A.; Johnson, L.A. Effect of co-products of enzyme-assisted aqueous extraction of soybeans on ethanol production in dry-grind corn fermentation. Bioresour. Technol. 2015, 192, 451–460. [Google Scholar] [CrossRef] [PubMed]
- Ngo, H.L.; Yee, W.C.; McAloon, A.J.; Haas, M.J. Techno-economic analysis of an improved process for producing saturated branched-chain fatty acids. J. Agric. Sci. 2014, 6, 158. [Google Scholar] [CrossRef] [Green Version]
- McAloon, A.; Yee, W. Ethanol Plant Model; USDA, ARS: Wyndmoor, PA, USA, 2011. [Google Scholar]
- Wood, C.; Rosentrater, K.A.; Muthukumarappan, K. Techno-economic modeling of a corn based ethanol plant in 2011/2012. Ind. Crops Prod. 2014, 56, 145–155. [Google Scholar] [CrossRef] [Green Version]
- Cheng, M.H.; Rosentrater, K.A.; Sekhon, J.; Wang, T.; Jung, S.; Johnson, L.A. Economic feasibility of soybean oil production by enzyme-assisted aqueous extraction processing. Food Bioprocess Technol. 2019, 12, 539–550. [Google Scholar] [CrossRef]
- USDA (United States Department of Agriculture). Fuel Ethanol, Corn and Gasoline Prices, Marketing Year. Available online: http://marketnews.usda.gov/portal/lg (accessed on 21 May 2021).
- Alibaba. Alibaba.com. Retrieved from Untreated Insoluble Fiber. 2016. Available online: http://www.alibaba.com/showroom/untreatedinsolublefiber.html (accessed on 21 May 2021).
- EIA (U.S. Energy Information Administration). U.S. Natural Gas Wellhead Price. 2016. Available online: http://www.eia.gov/dnav/ng/hist/n9190us3a.htm (accessed on 21 May 2021).
- EIA (U.S. Energy Information Administration). Average Retail Price of Electricity to Ultimate Customers. 2016. Available online: http://www.eia.gov/electricity/data.cfm#traderel (accessed on 21 May 2021).
- Damodaran, A. Investment Valuation: Tools and Techniques for Determining the Value of Any Asset; John Wiley & Sons: Hoboken, NJ, USA, 2012; Volume 666. [Google Scholar]
- Index, C.P. Bureau of Labor Statistics, U.S. Department of Labor. Washington, DC. 2012. Available online: http://data.bls.gov/cgi-bin/surveymost/ (accessed on 21 May 2021).
- Jacobsen. (2016, July). Distillers Corn Oil. Retrieved from The Jacobsen Research Database. Available online: https://thejacobsen.com (accessed on 21 May 2021).
Figure 1.
Process flow diagram used to model integrated corn-EAEP ethanol fermentation processing. Note that soy skim is added directly to the fermentor, but soy insoluble fiber is added to the saccharification step immediately prior to fermentation. This SuperPro model was adapted from [8,9].

Figure 2.
Capital costs for integrated corn-soy ethanol fermentation processing. Scenarios include a 40 million gallon per year (MGY) ethanol plant with or without corn oil separation, a 120 MGY ethanol with or without corn oil separation, and a 40 or 120 MGY ethanol plant, without corn oil separation but with EAEP products used for fermentation.

Figure 3.
Operating costs for integrated corn-soy ethanol fermentation processing. Scenarios include a 40 million gallon per year (MGY) ethanol plant with or without corn oil separation, a 120 MGY ethanol with or without corn oil separation, and a 40 or 120 MGY ethanol plant, without corn oil separation but with EAEP products used for fermentation.

Figure 4.
Material costs for integrated corn-soy ethanol fermentation processing. Scenarios include a 40 million gallon per year (MGY) ethanol plant with or without corn oil separation, a 120 MGY ethanol with or without corn oil separation, and a 40 or 120 MGY ethanol plant, without corn oil separation but with EAEP products used for fermentation.

Figure 5.
Annual total revenues for integrated corn-soy ethanol fermentation processing. Scenarios include a 40 million gallon per year (MGY) ethanol plant with or without corn oil separation, a 120 MGY ethanol with or without corn oil separation, and a 40 or 120 MGY ethanol plant, without corn oil separation but with EAEP products used for fermentation.

Figure 6.
Profitability analysis for integrated corn-soy ethanol fermentation processing. Scenarios include a 40 million gallon per year (MGY) ethanol plant with or without corn oil separation, a 120 MGY ethanol with or without corn oil separation, and a 40 or 120 MGY ethanol plant, without corn oil separation but with EAEP products used for fermentation.

Figure 7.
Unit analysis and payback time for integrated corn-soy ethanol fermentation processing. Scenarios include a 40 million gallon per year (MGY) ethanol plant with or without corn oil separation, a 120 MGY ethanol with or without corn oil separation, and a 40 or 120 MGY ethanol plant, without corn oil separation but with EAEP products used for fermentation.

Publisher’s Note: MDPI stays neutral with regard to jurisdictional claims in published maps and institutional affiliations. |
© 2021 by the authors. Licensee MDPI, Basel, Switzerland. This article is an open access article distributed under the terms and conditions of the Creative Commons Attribution (CC BY) license (https://creativecommons.org/licenses/by/4.0/).
Share and Cite
MDPI and ACS Style
Rosentrater, K.A.; Zhang, W. Techno-Economic Analysis of Integrating Soybean Biorefinery Products into Corn-Based Ethanol Fermentation Operations. Fermentation 2021, 7, 82. https://0-doi-org.brum.beds.ac.uk/10.3390/fermentation7020082
AMA Style
Rosentrater KA, Zhang W. Techno-Economic Analysis of Integrating Soybean Biorefinery Products into Corn-Based Ethanol Fermentation Operations. Fermentation. 2021; 7(2):82. https://0-doi-org.brum.beds.ac.uk/10.3390/fermentation7020082
Chicago/Turabian StyleRosentrater, Kurt A., and Weitao Zhang. 2021. "Techno-Economic Analysis of Integrating Soybean Biorefinery Products into Corn-Based Ethanol Fermentation Operations" Fermentation 7, no. 2: 82. https://0-doi-org.brum.beds.ac.uk/10.3390/fermentation7020082
Note that from the first issue of 2016, this journal uses article numbers instead of page numbers. See further details here.