Article

Optimization of Yeast, Sugar and Nutrient Concentrations for High Ethanol Production Rate Using Industrial Sugar Beet Molasses and Response Surface Methodology

by
Jean-Baptiste Beigbeder
,
Julia Maria de Medeiros Dantas
and
Jean-Michel Lavoie
*
Biomass Technology Laboratory, Department of Chemical Engineering and Biotechnology Engineering, Université de Sherbrooke, 2500 Boul. de l’Université, Sherbrooke, QC J1K 2R1, Canada
*
Author to whom correspondence should be addressed.
Submission received: 5 May 2021 / Revised: 20 May 2021 / Accepted: 25 May 2021 / Published: 31 May 2021
(This article belongs to the Special Issue Food Waste Valorization)

Abstract

:
Among the various agro-industrial by-products, sugar beet molasses produced by sugar refineries appear as a potential feedstock for ethanol production through yeast fermentation. A response surface methodology (RSM) was developed to better understand the effect of three process parameters (concentration of nutrient, yeast and initial sugar) on the ethanol productivity using diluted sugar beet molasses and Saccharomyces cerevisiae yeast. The first set of experiments performed at lab-scale indicated that the addition of 4 g/L of nutrient combined with a minimum of 0.2 g/L of yeast as well as a sugar concentration lower than 225 g/L was required to achieve high ethanol productivities (>15 g/L/d). The optimization allowed to considerably reduce the amount of yeast initially introduced in the fermentation substrate while still maximizing both ethanol productivity and yield process responses. Finally, scale-up assays were carried out in 7.5 and 100 L bioreactors using the optimal conditions: 150 g/L of initial sugar concentration, 0.27 g/L of yeast and 4 g/L of nutrient. Within 48 h of incubation, up to 65 g/L of ethanol were produced for both scales, corresponding to an average ethanol yield and sugar utilization rate of 82% and 85%, respectively. The results obtained in this study highlight the use of sugar beet molasses as a low-cost food residue for the sustainable production of bioethanol.

1. Introduction

Over the years, climate changes and air pollution attributed to the use of fossil fuels has been an increased concern all around the world [1]. One of the main reasons related to the actual environmental issues is the high amount of greenhouse gases (GHG) continuously released into the atmosphere due to anthropogenic activities (industries, land use, transportation, etc.) [2]. In this context, the use of biofuels such as bioethanol has emerged as a sustainable alternative to fossil fuels due to numerous advantages, including reduced emission of GHG, hydrocarbons and nitrogen oxides during both bioethanol production and combustion [3]. In this context, many countries have been adopting new policies to promote the use of biofuels, and the market perspectives are a 2-fold increase in Brazil and the USA and a 4-fold increase in China and EU by 2040 [4].
Among biofuels, bioethanol production through anaerobic fermentation of carbohydrates by yeast microorganisms is the most developed and implemented process at an industrial scale [5]. Fermentable sugars are generally extracted from various plants such as corn, sugarcane and sugar beet, which represent the main feedstock used for the actual worldwide ethanol production [6]. However, even if part of the carbon released after the fuel combustion is captured by the crops during their growth, the production of bioethanol from conventional crops can still impact carbon neutrality [4].
One way to reach a carbon neutrality (or even negative carbon emissions) could involve reusing biomass residues such as agricultural and food wastes as alternative feedstocks [7]. These by-products represent a concrete solution to avoid the direct land use impact of using crops for the production of fuels, especially in light of life cycle assessment calculations that will determine the carbon impact of biofuels [8]. Recent studies reported the use of various residues such as food waste [9], corncobs [10] and algae waste [11] for the sustainable production of bioethanol. In the case of lignocellulosic biomass, several pre-treatment steps are often required to break down the complex lignin structure and depolymerise the crystalline cellulose to access fermentable sugars [12]. However, residues from the food industry often have the advantage of being rich in easily fermentable carbohydrates, which could simplify the overall process while reducing the energy requirements for the process and possibly, the carbon intensity of the downstream fuel [13].
Sugar beet and cane molasses are abundant liquid by-products from the sugar industry, which are generally found at high amount of total sugars (50.6–71.0% w/w) and traces of micronutrients such as minerals (Ca, Mg, Na and K), phosphate and nitrogen compounds [14]. These sugar-rich solutions does not require any major physical or chemical pretreatment (such as hydrolysis, filtration, sterilization, etc.) before fermentation, making them very appropriate for ethanol production. In this context, several studies already reported the efficient production of bioethanol using sugar beet and sugarcane molasses. For instance, Razmovski et al. compared the fermentation performances of immobilised and free yeast cells using sugar beet molasses and thick juice at three initial glucose concentrations of 100, 200 and 300 g/L [13]. For both substrates, immobilised yeasts resulted in higher ethanol yields than free cells condition, with the highest ethanol volumetric productivity of 1.257 and 1.422 g/L/h obtained with molasses and thick juice diluted at 150 g/L of initial sugar, respectively. In another study, the continuous production of ethanol was investigated using an immobilised yeast cell reactor and sugarcane molasses as low-cost fermentation substrate [15]. The highest ethanol production of 19.15 g/L was obtained with a hydraulic retention time of 15.63 h combined with an initial sugar concentration of 150 g/L. In a recent study, a rotary biofilm reactor was developed for long-term bioethanol production using non-sterilised sugar beet molasses [16]. By recycling 30% of the fermentation broth every 36 h, a stable production of 52.3 g/L of ethanol was achieved over a period of 60 days. In addition, molasses can also be used for the production of different alcoholic beverages such as rum, a spirit distillate with an ethanol content of 37–43% alcohol by volume [17]. In another study, the ethanol production performances of corn marsh feedstock were improved by the addition of sugarcane molasses [18]. Mixing 50% of corn mash with 50% of sugar cane molasses generated the highest ethanol concentration (8.2%).
To implement an efficient fermentation process using industrial by-products, several process parameters such as sugar and yeast concentrations must be optimised to ensure high ethanol productivity while keeping in mind the economic aspects of the process [19]. Nutrient supplementation is also an important parameter to take into consideration since an adequate amount of nutrient can significantly improve yeast viability and resistance to the medium, stimulating ethanol production performances. Since alcoholic fermentation is a complex biological process involving various operating factors, the use of the classical “one factor at a time” approach could be time-consuming due to the large number of experiments to perform. Hence, tools such as the statistical design of experiment (DoE) allow investigating the effect of several operational factors as well as their interactions on the overall process while considerably reducing the number of experimental tests [20]. For instance, a central composite design coupled with response surface methodology (CCD-RSM) represents a powerful and effective statistical tool that could commonly be used for the optimization of biotechnological processes such as fermentation [19,21,22]. Once developed, the CCD-RSM can be used to predict a process output, while imposing specific constraints based on economical and technical aspects.
In this context, the present work aims to optimise the production of ethanol from non-treated sugar beet molasses produced by a local sugar refinery. For this purpose, a CCD-RSM was designed and developed to investigate the effect of three fermentation process parameters (initial sugar, yeast and nutrient concentrations) on ethanol productivity while considering several operating parameters such as ethanol yield and sugar utilization rate. Then, the second-order mathematical model obtained through the CCD-RSM was tested to evaluate its ability to make accurate predictions based on specific desired process outputs. To the best of our knowledge, this is the first study reporting the use of a CCD-RSM statistical approach to maximise the production of ethanol from non-sterilised sugar beet molasses while scaling up the experimental results up to a 100 L bioreactor scale.

2. Materials and Methods

2.1. Sugar Beet Molasses Preparation

The sugar beet molasses was collected from a local sugar refinery located in Coaticook (Québec, Canada) and stored at 4 °C until further use. The sugar beet crops were cultivated and harvested by the same company before being processed to produce sugar. The fresh molasses was initially characterised for pH, density as well as for sugars and other metabolites concentrations (see Table 1).

2.2. Statistical Experimental Design Methodology

The first part of this study aimed to optimise the ethanol fermentation of sugar beet molasses using a CCD-RSM. This statistical approach allows investigating specific operational parameters together with their related effects on the fermentation process with a limited number of experiments. Therefore, a CCD-RSM was implemented for three process variables: initial sugar concentration (Factor A) as well as yeast (Factor B) and nutrient (Factor C) concentrations. These investigated factors were studied at low, middle and high levels, coded −1, 0 and +1, respectively (Table 2). In addition, two centre points were added to check for curvature and verify the repeatability of the fermentation process. Finally, confirmation experiments were performed to verify the accuracy of the developed mathematical model and its capacity to predict process responses within the design space. The CCD-RSM was designed and analysed using the Design-Expert 12 software (Stat-Ease Inc., Minneapolis, MN, USA).
The ethanol productivity was used as the main experimental process response (Y1) for the CCD-RSM and calculated using Equation (1).
Ethanol   productivity   g / L / d =   EtOH max /   t fermentation
where EtOHmax represents the maximum ethanol concentration (g/L) and tfermentation represents the time of incubation (d) required to achieve the EtOHmax.
In addition, ethanol yields were calculated based on the maximum theoretical ethanol concentration calculated for the three initial sugar concentrations. Using Equation (2), it can be assumed that 1 g of glucose produces 0.51 g of ethanol and 0.49 g of carbon dioxide (CO2).
C 6 H 12 O 6   2 C 2 H 6 O + 2 CO 2
Ethanol yields were expressed as % of the maximum theoretical ethanol concentration.

2.3. Fermentation Experiments

The fermentations assays were carried out according to the different experimental lines described by the DoE (Table 3). Therefore, sugar beet molasses was diluted to reach the required initial sugar concentration using tap water and the respective amount of nutrient (Fermaid O, Lallemand Biofuels & Distilled Spirits, Montreal, QC, Canada) was added to the solution. Fermaid O is a mix of inactivated yeast fractions, rich in organic nitrogen, generally used in the wine industry. This nutrient was not supplemented by any ammonia salts or micronutrients. Fermaid O was referred to as “nutrient” parameter in this study. After pH adjustment to 5.5 using an 11 M H2SO4 solution, fermentation broths were placed into 50 mL serum vials with a working volume of 25 mL. Yeast inoculum was prepared by rehydrating Saccharomyces cerevisiae dry yeast cells (Thermosacc® DRY, Lallemand Biofuels & Distilled Spirits, Canada) with tap water at 30 °C, 140 rpm for a period of 15 min using a shaking incubator (Ecotron, Infors-HT Inc., Bottmingen, Switzerland). Three concentrated yeast suspensions were prepared to obtain the desired initial yeast concentration in the final fermentation media. After yeast inoculation, all the fermentation vials were capped with rubber septum stoppers and aluminium rings, before being flushed with N2 for 5 min to ensure an anaerobic environment. The fermentation vials were finally incubated at 30 °C for 112 h under a 140 rpm stirring. Temperature and agitation parameters were not optimised in this work and their values were selected based on our previous study dealing with the fermentation of softwood residues [21]. Liquid samples were taken at the beginning and at the end of the experiment to quantify different metabolites and products such as sugars and ethanol concentrations. All conditions were carried out in triplicate and results are expressed as average value ± standard deviation.
The optimal conditions obtained during the CCD were used to design and perform scale-up assays using 7.5 and 100 L bioreactors with working volumes of 5 and 50 L, respectively (Figure 1). The 7.5 L glass bioreactor (Infors-HT Inc., Bottmingen, Switzerland) was equipped with a double envelope to control the temperature at 30 °C, meanwhile, a mechanical stirrer provided a continuous agitation at 250 rpm. In addition, a water-cooled condenser was attached to the reactor to prevent evaporation. The 100 L stainless bioreactor was equipped with a 2000 W heating element to maintain the fermentation media temperature to 30 °C. Constant stirring at 70 rpm was achieved using a 2-blades impeller system powered by a 12 Volt DC electric motor.

2.4. Analytical Procedures

2.4.1. Gravimetric Analysis

To monitor the ethanol production of a large number of fermentation media during the CCD-RSM, a gravimetric methodology was developed to quantify the amount of CO2 released during the fermentation procedure. Considering the alcoholic fermentation reaction (Equation (2)) that theoretically gives two moles of ethanol and two moles of CO2 per initial mole of glucose, the ethanol concentration could be indirectly calculated by following the production of CO2. This gravimetric technique is a simple and efficient tool to follow ethanol production kinetics, with the advantage to be less time- and resource- consuming than conventional methods. Moreover, this technique assumes that only CO2 and ethanol are produced during fermentation.
To validate this technique, a calibration curve was prepared by plotting “the ethanol calculated by mass loss” versus “the ethanol quantified by HPLC” (details in Section 2.4.2), which were referred to as Eml and Ehplc, respectively (Figure S1). The linear regression showed a coefficient of determination (R2) of 0.97 with Equation (3).
E hplc = 0.84 ×   E ml 9.95
All the ethanol results shown in this study, except for the ones obtained during the scale-up experiments, were calculated using the latest calibration curve.

2.4.2. Sugars and Ethanol Quantification

Although the gravimetric analysis is an alternative option to follow the fermentation development, it is still necessary the quantify monomeric sugars and other fermentation-related metabolites to ensure accurate results. To this purpose, a Dionex ICS-5000+ ion chromatography system was used but more specifically for sugars quantification. The system was equipped with a KOH eluent generator to provide a proper eluent concentration, an analytical gradient pump, a thermostatic AS-AP auto-sampler and an electrochemical detector. A 200 mM KOH post-injection with a Dionex GP 50 gradient pump was implemented to ensure signal stability. For this project, a Dionex CarboPac Sa10-4 μM column was used while the oven was set at 45 °C and the electrochemical detector was at 30 °C. The injection volume was 0.4 μL and elution was made with an aqueous solution of KOH at 1.25 mL/min at the following concentrations: 1 mM for 12 min, 10 mM for 5 min and 1 mM for 1 min. The calibration curve involved a concentration of standards varying from 10 ppm to 1000 ppm and involved the following standards: fructose 99%, glucose 99% and sucrose 99% which were all purchased from Sigma-Aldrich.
An Agilent 1100 series HPLC (Agilent Technologies Inc., Colorado Springs, CO, USA) equipped with a G1362A Refractive Index Detector was used to quantify ethanol. The system was operated at 40 °C with an isocratic elution method (2.5 mM). The HPLC set-up also had a G1322A Degasser and a G1311A Quaternary Pump. A G1313A Autosampler injected 40 μL of sample and the column used was a ROA-Organic Acid H+ (8%) at 65 °C. The elution was performed at a constant flow of 0.08 mL/min of a 0.01 M H2SO4 solution. A calibration curve from 10 ppm to 1000 ppm was performed using the following standards: L-lactic 99% (Alfa Aesar), acetic acid 99.9% (Sigma Aldrich), ethanol 99% (Sigma Aldrich) and glycerol 99% (Sigma Aldrich).

3. Results and Discussion

3.1. Ethanol Production Kinetics Overview

One of the main objectives of this study was to elucidate the effect of different operating fermentation parameters on the ethanol production process to develop a cost-effective and efficient strategy to valorise sugar beet molasses. In this sense, a CCD-RSM was designed and developed using three experimental process parameters (initial sugar, yeast and nutrient concentrations) investigated at three levels, using ethanol productivity as the main process response.
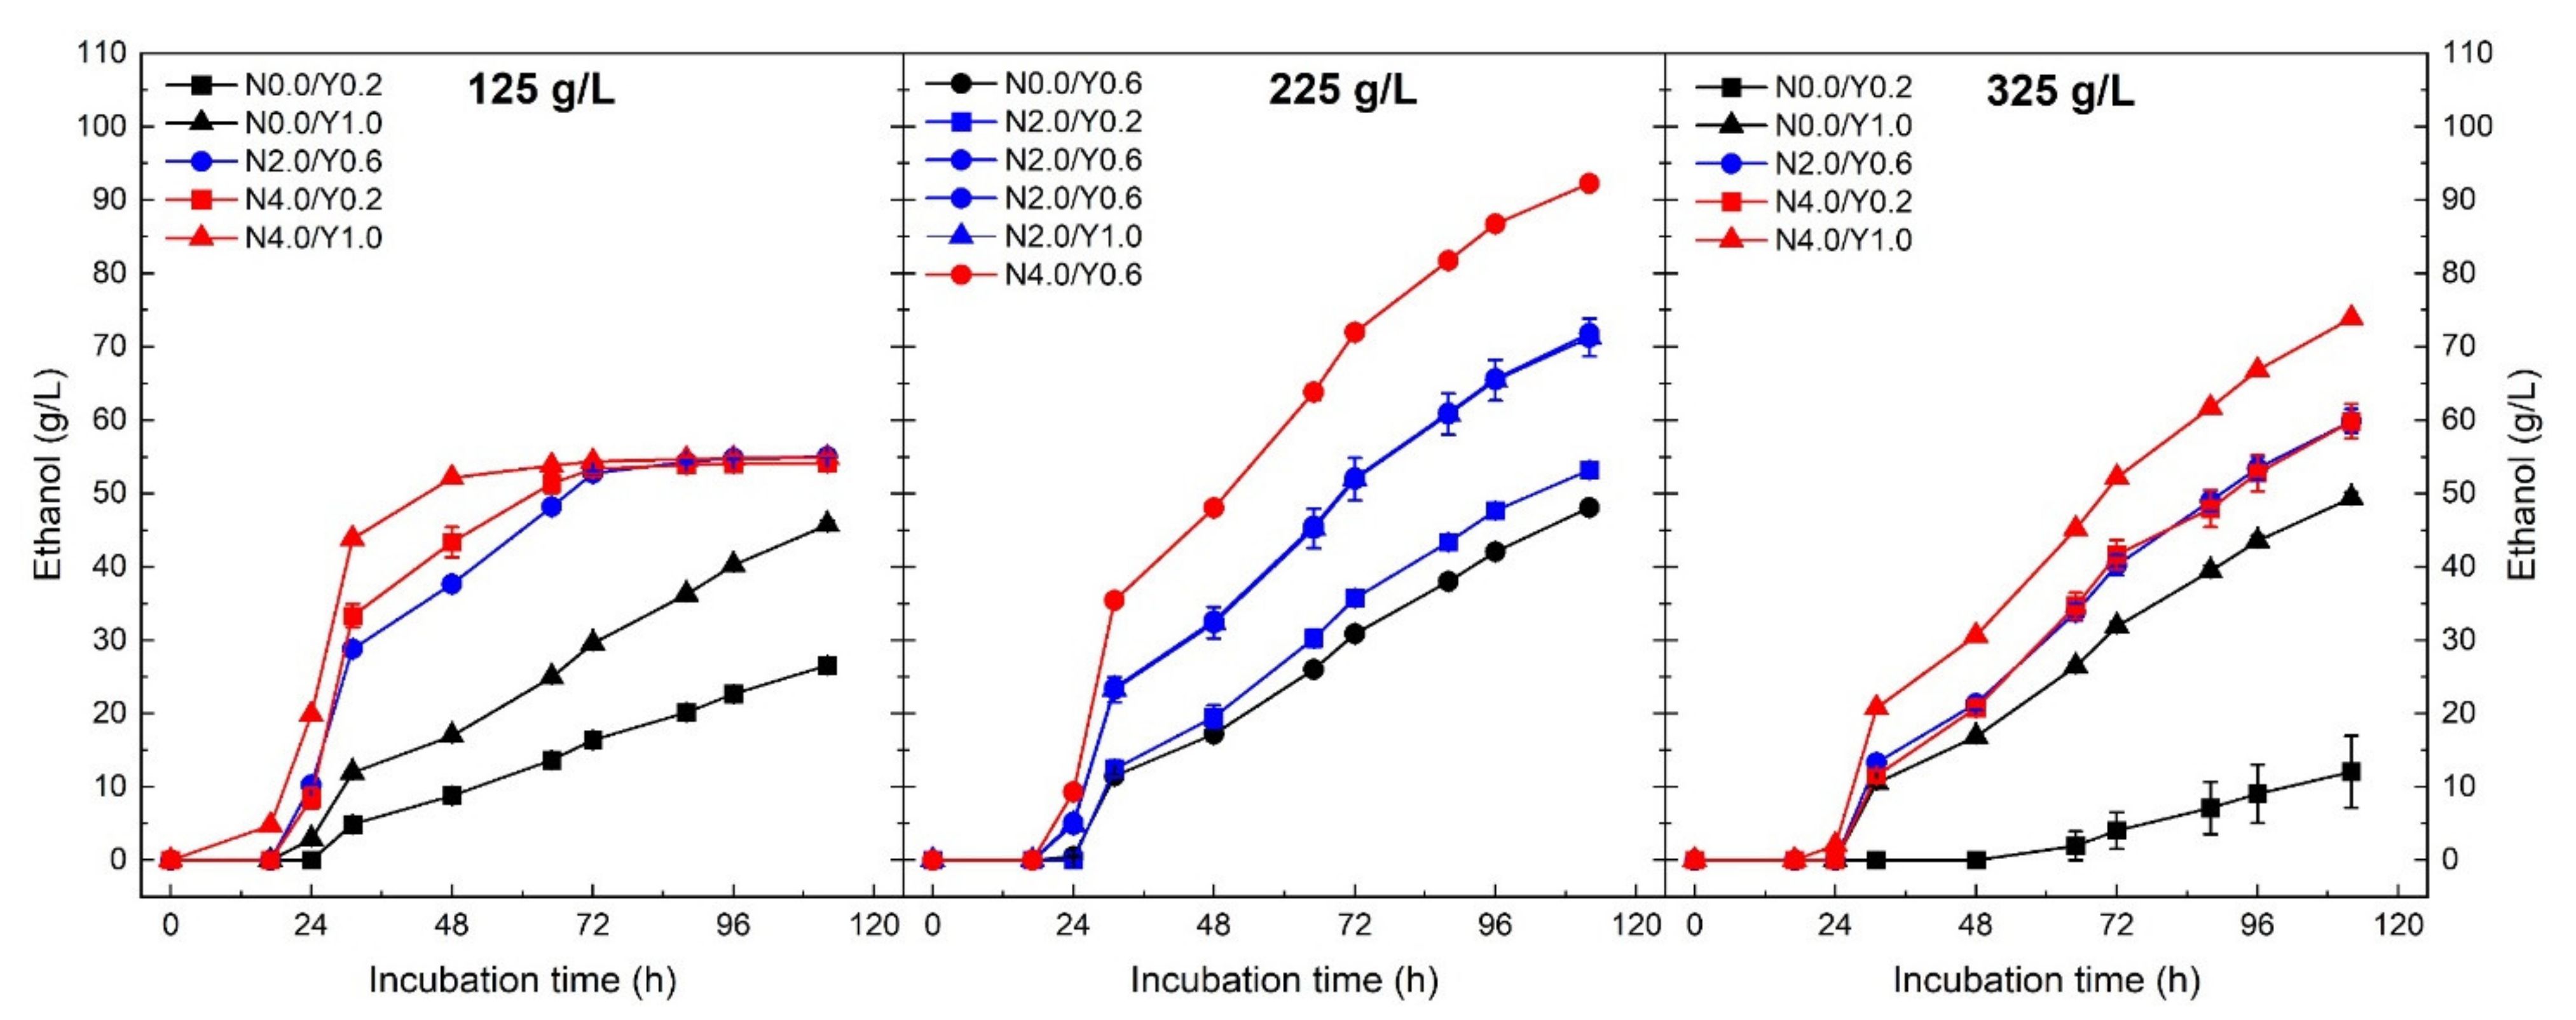
Ethanol production was strongly affected by the three investigated process parameters, which resulted in different fermentation kinetics among the 16 experiments of the CCD-RSM (Figure 2). For all the conditions, a short lag phase of approximately 24 h was noticed before measuring any production of ethanol. This period is probably due to the adaptation of yeast cells after their inoculation into the sugar-rich media. By the end of the incubation time, only three conditions with an initial sugar concentration of 125 g/L, various yeast (0.2, 0.6 and 1.0 g/L) and nutrient (2 and 4 g/L) concentrations reached a plateau with a constant ethanol concentration of 54 g/L. The highest ethanol production of 92 g/L was observed when the sugar beet molasses was diluted to 225 g/L of initial sugars combined with the use of 0.6 g/L and 4.0 g/L of yeast and nutrient, respectively. The positive effect of nutrient supplementation was highlighted by observing very slow fermentation kinetics for media not supplemented with nutrients compared with the ones with nutrients.

3.2. Design Matrix and Ethanol Productivity Analysis

The fermentation results obtained during the CCD-RSM were analysed by calculating the ethanol productivity of each experimental line, based on the maximum ethanol concentration achieved after a specific incubation time (Table 3). To quantify the fermentation performances and perform an in-depth comparison of the results, ethanol yields expressed as a percentage of the maximum theoretical ethanol yield were calculated and discussed in the following section.
As observed for the fermentation kinetics, various responses were detected among the experimental lines of the CCD-RSM, with ethanol productivity values ranging from 2.6 to 19.8 g/L/d with average productivity of 13.2 g/L. A total of 8 experiments achieved ethanol productivities higher than 15.0 g/L by the end of incubation time.
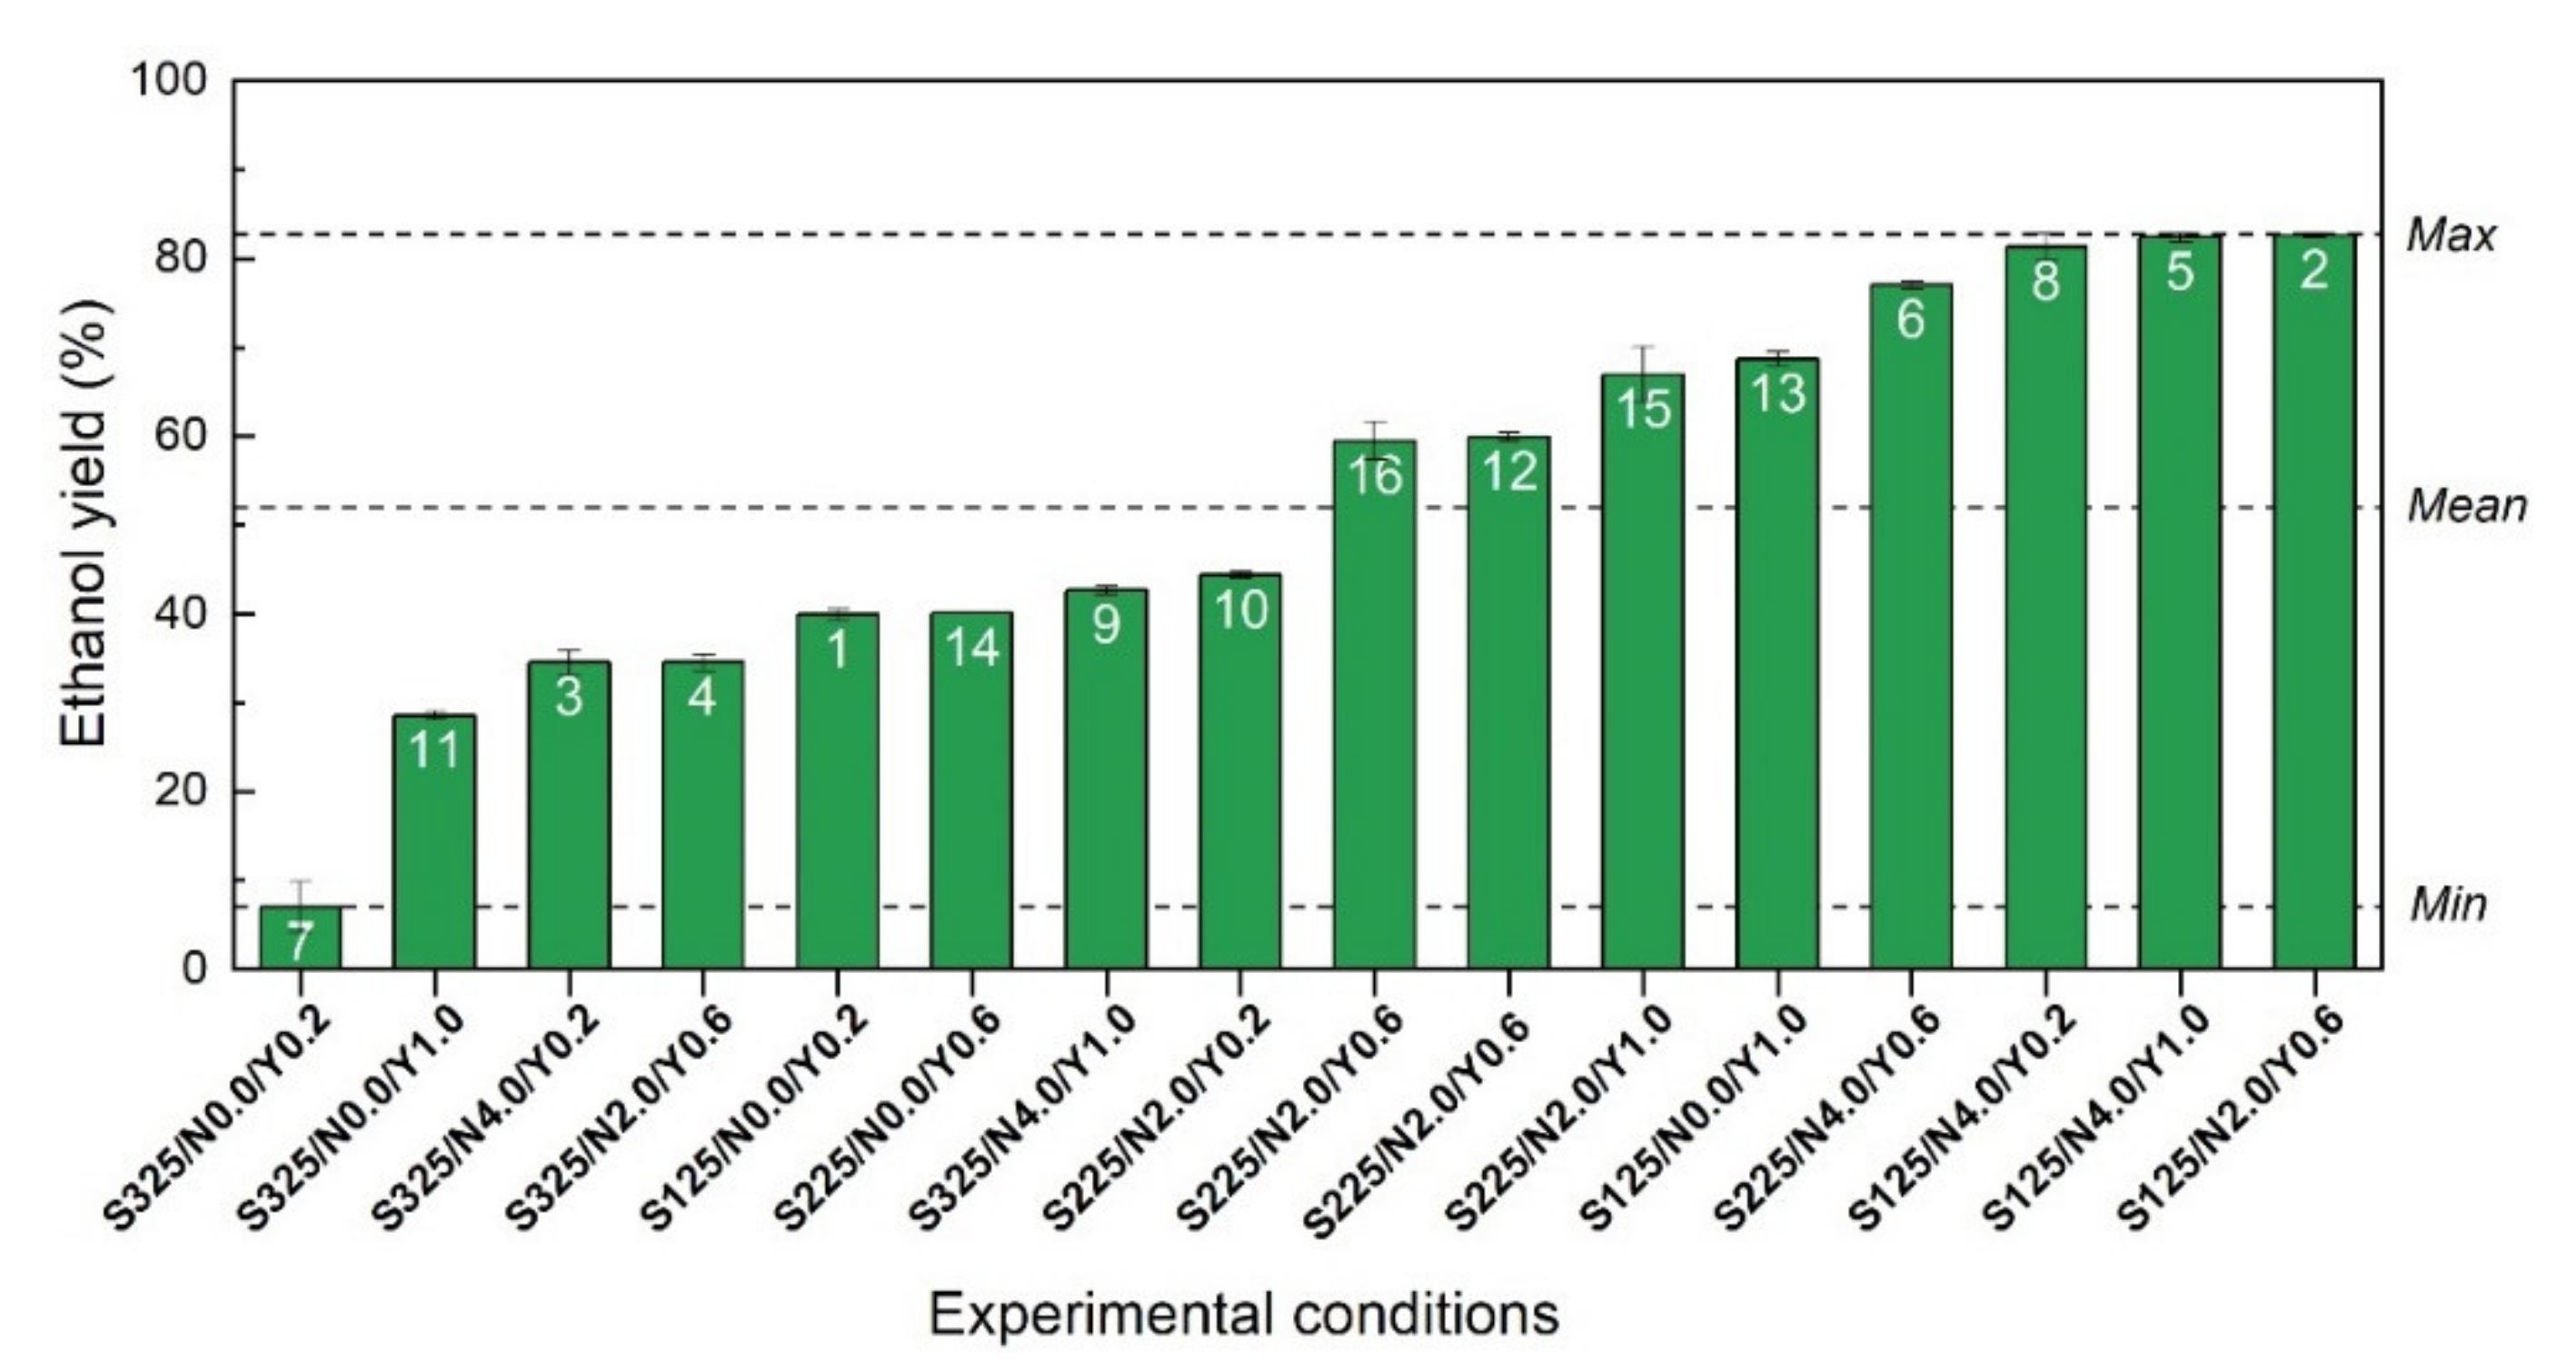
However, ethanol yields calculated for all the 16 experimental runs revealed that only a few numbers of conditions reached high ethanol yields (Figure 3). In fact, the initial sugar concentration had an important effect on the fermentation performances since only the experiments with sugar concentrations comprised between 125 and 225 g/L reached ethanol yields above 60%. In addition, the highest ethanol yields of 82% were generated for three experimental conditions (run 8, 5 and 2), where a minimum of 2 g/L of nutrient and 0.2 g/L of yeast were used, combined with an initial sugar concentration of 125 g/L. Finally, the lower ethanol yield of 7.0% was obtained for the fermentation media incubated without any nutrient supplementation combined with a low amount of yeast (0.2 g/L) and a high concentration of initial sugar (325 g/L).
The high ethanol volumetric productivity values obtained in our study, ranging from 15.0 to 19.8 g/L/d, were in agreement with the fermentation results previously presented by Razmovski et al. using sugar beet molasses [13]. The use of non-immobilised yeast cells generated ethanol volumetric productivities of 20.09, 19.82 and 13.51 g/L/d when using initial sugar concentration of 100, 150 and 300 g/L, respectively. Similarly, Vucurovic et al. noticed a significant reduction in ethanol performances including sugar utilization, ethanol productivity and yield when fermenting sugar beet molasses with sugar concentration higher than 175 g/L, using free yeast cells [23]. These observations were correlated with lower cell yeast viability, attributed to the presence of high sugar concentration as well as non-sugar compounds such as mineral salts which might affect yeast metabolism.
The analysis of experimental ethanol yields was useful to correlate the ethanol productivity values with actual ethanol performances based on the maximum theoretical ethanol yield. The latest parameter is often calculated considering 100% sugar utilization by yeast cells during fermentation. Such operational parameter must be evaluated when implementing a fermentation process in order to take full advantage of the initial sugars present in the feedstock for the production of ethanol. In this sense, sugar concentration between 125 and 225 g/L and the addition of nutrient should be carefully considered to achieve high ethanol yields while producing at least 15 g/L/d of ethanol.

3.3. Mathematical Model Analysis

The ethanol productivity results presented in the last section were subjected to an analysis of variance to evaluate if the mathematical model was significant (Table 4). p-values lower than 0.0500 showed that the model is significant while a Fit-value of 107.40 indicates there is only a 0.01% of chance that a Fit-value this large could occur due to noise. Similarly, A, B, C, AB, BC, A2, B2 model terms were statistically significant with p-values lower than 0.0006. Regarding the pure error, the Lack of Fit was considered as not significant with a Fit-value of 57.66 and a p-value of 0.0996. Thus, there is only a 9.96% chance that a Lack of Fit-value this large could occur due to noise.
In addition, the accuracy of the model and its ability to predict in the design space was verified by the close relationship between the predicted and the experimental values obtained for the ethanol productivity main response (Figure S2). The Predicted R2 of 0.9436 was found to be in reasonable agreement with the Adjusted R2 of 0.9846 since the difference was less than 0.2. A correlation between these two parameters was also confirmed by a coefficient of determination (R2) of 0.9938 when conducting a linear regression of the predicted and the experimental data. The signal to noise ratio of 36.9494 (“Adeq Precision”) was significantly higher than 4, indicating an adequate signal to navigate the design space. In addition, the very similar ethanol productivity of 15.4 and 15.3 g/L/d obtained for both centre points (run 12 and 16, respectively) confirmed the stability and the reproducibility of the results (Table 3).

3.4. RSM Optimization

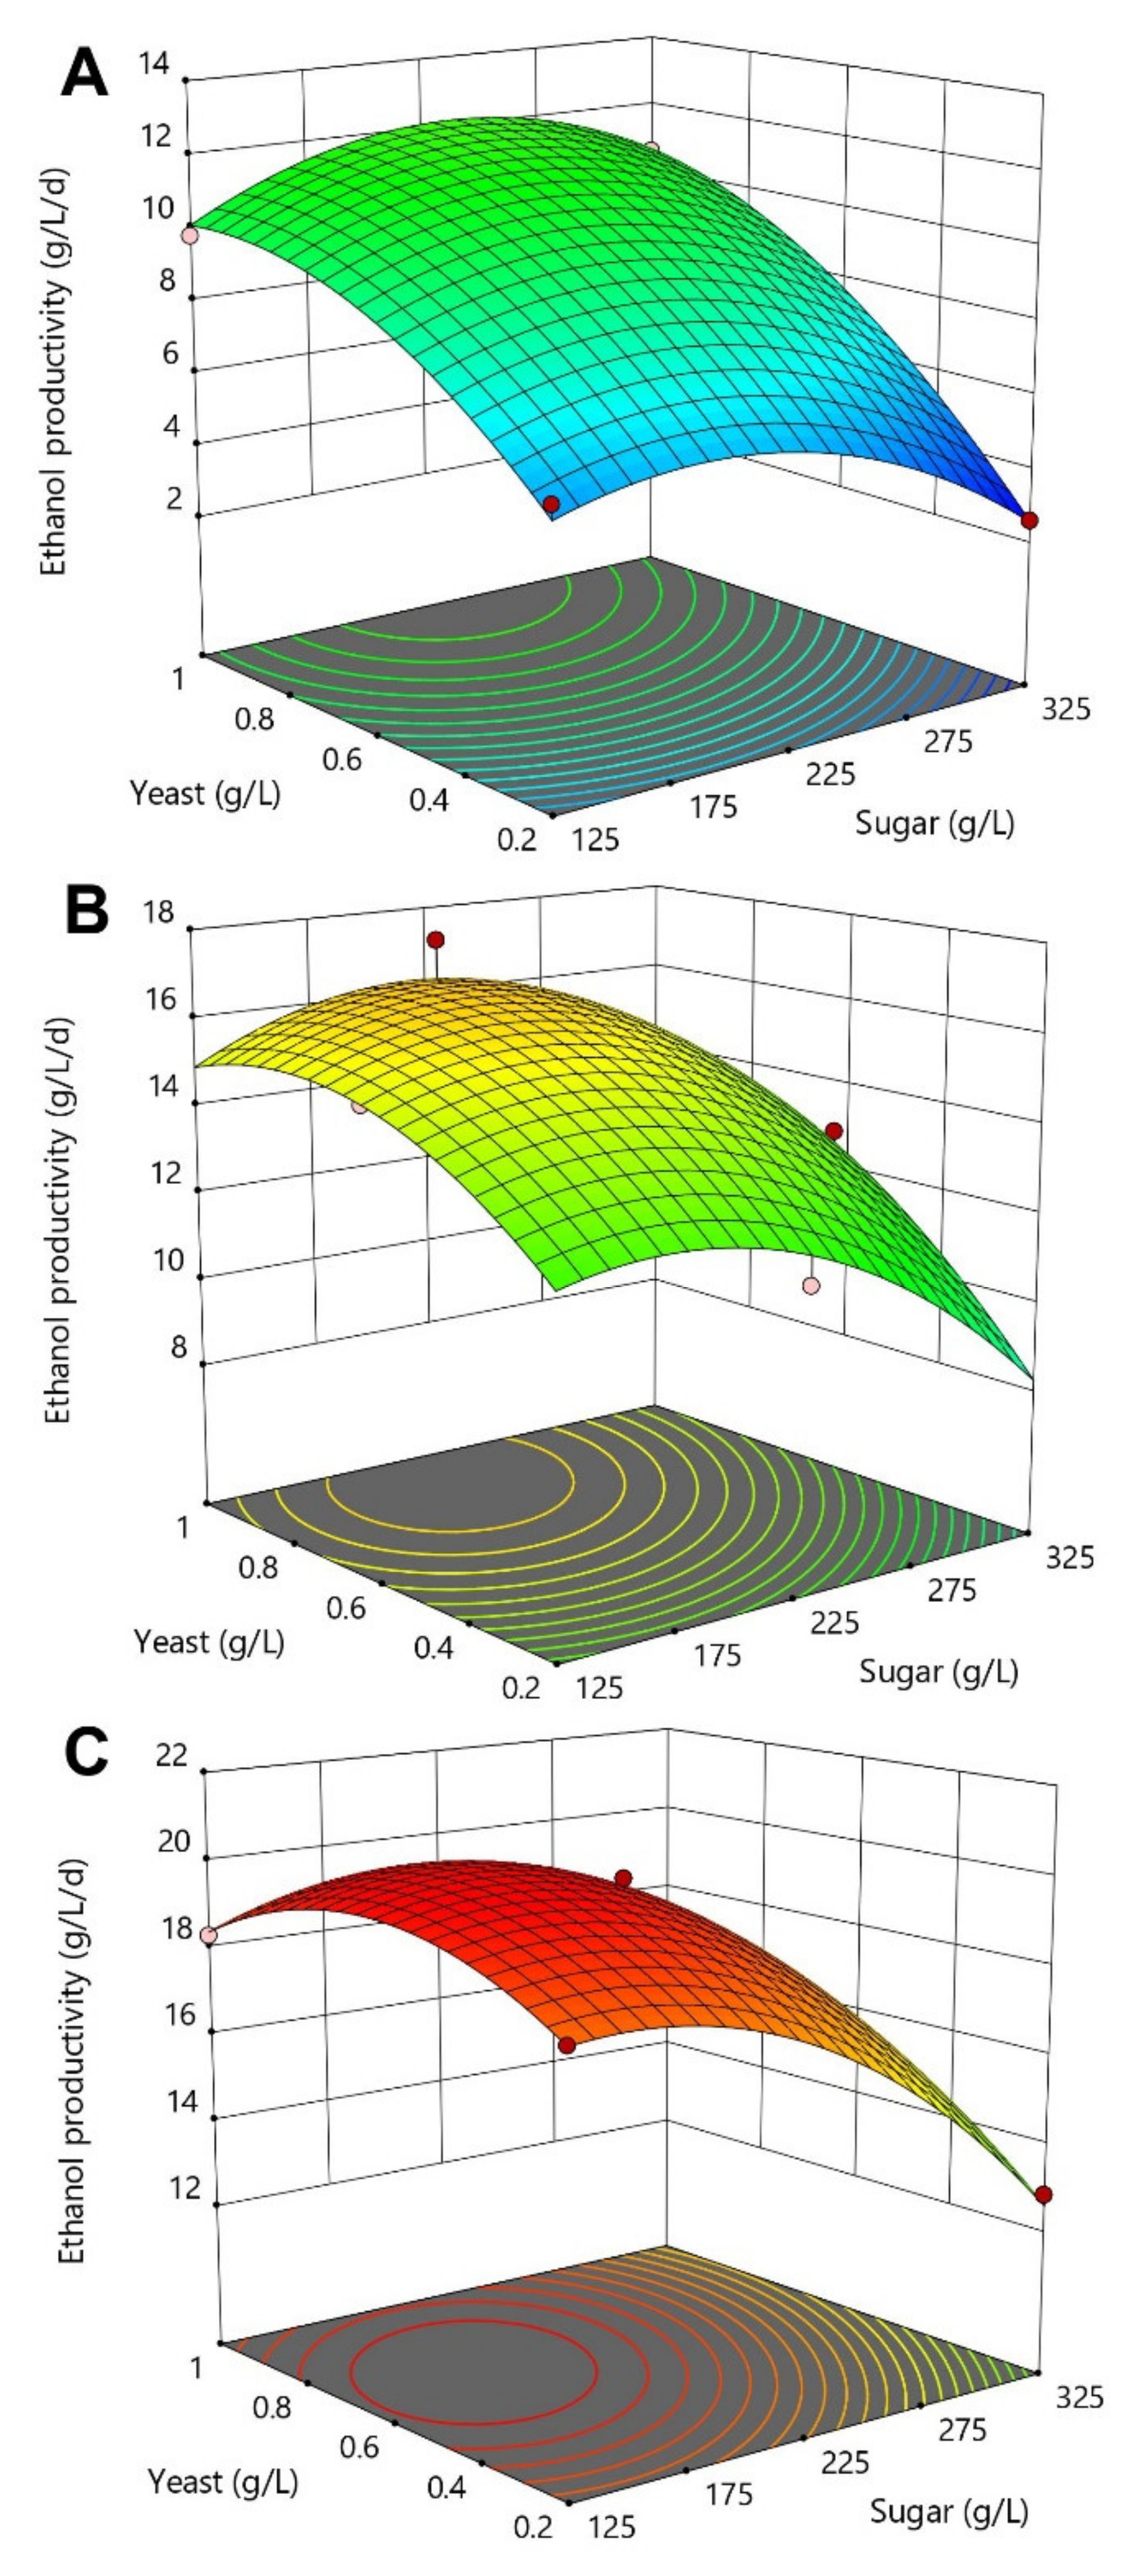
The RSM analysis highlighted the combined effect of the three fermentation process parameters on the ethanol productivity response (Figure 4). As observed previously, nutrient supplementation was one of the most influential variables, strongly affecting the fermentation performances. Optimal regions for maximizing the overall ethanol productivity (>15 g/L/d) were detected for a nutrient concentration of 4 g/L combined with an initial sugar concentration lower than 225 g/L and a minimum of 0.2 g/L of yeast (Figure 4C). In the absence of nutrient, ethanol production rates were very slow (<10.6 g/L/d), suggesting that the molasses feedstock alone did not offer a sufficient level of nutrient for S. cerevisiae yeast metabolism. These findings are slightly different from other studies reporting the efficient production of ethanol from sugar beet molasses without nutrient supplementation [13,23]. However, yeast cells used in these studies were previously grown in a nutrient-rich solution before inoculation, which was very different from our simple rehydration yeast preparation protocol.
In addition, ethanol productivity performances were negatively affected when increasing the amount of initial sugar present in the fermentation system, which was probably due to an increase in osmotic stress. This behaviour was similarly reported by Vučurović et al. when measuring S. cerevisiae yeast viability at the end of sugar beet molasses fermentation assays. In the absence of nutrient, the increase of initial sugar concentration from 100 to 300 g/L significantly decreased the viability of free cells from around 100 to 63.9% [17].

3.5. Validation Experiments

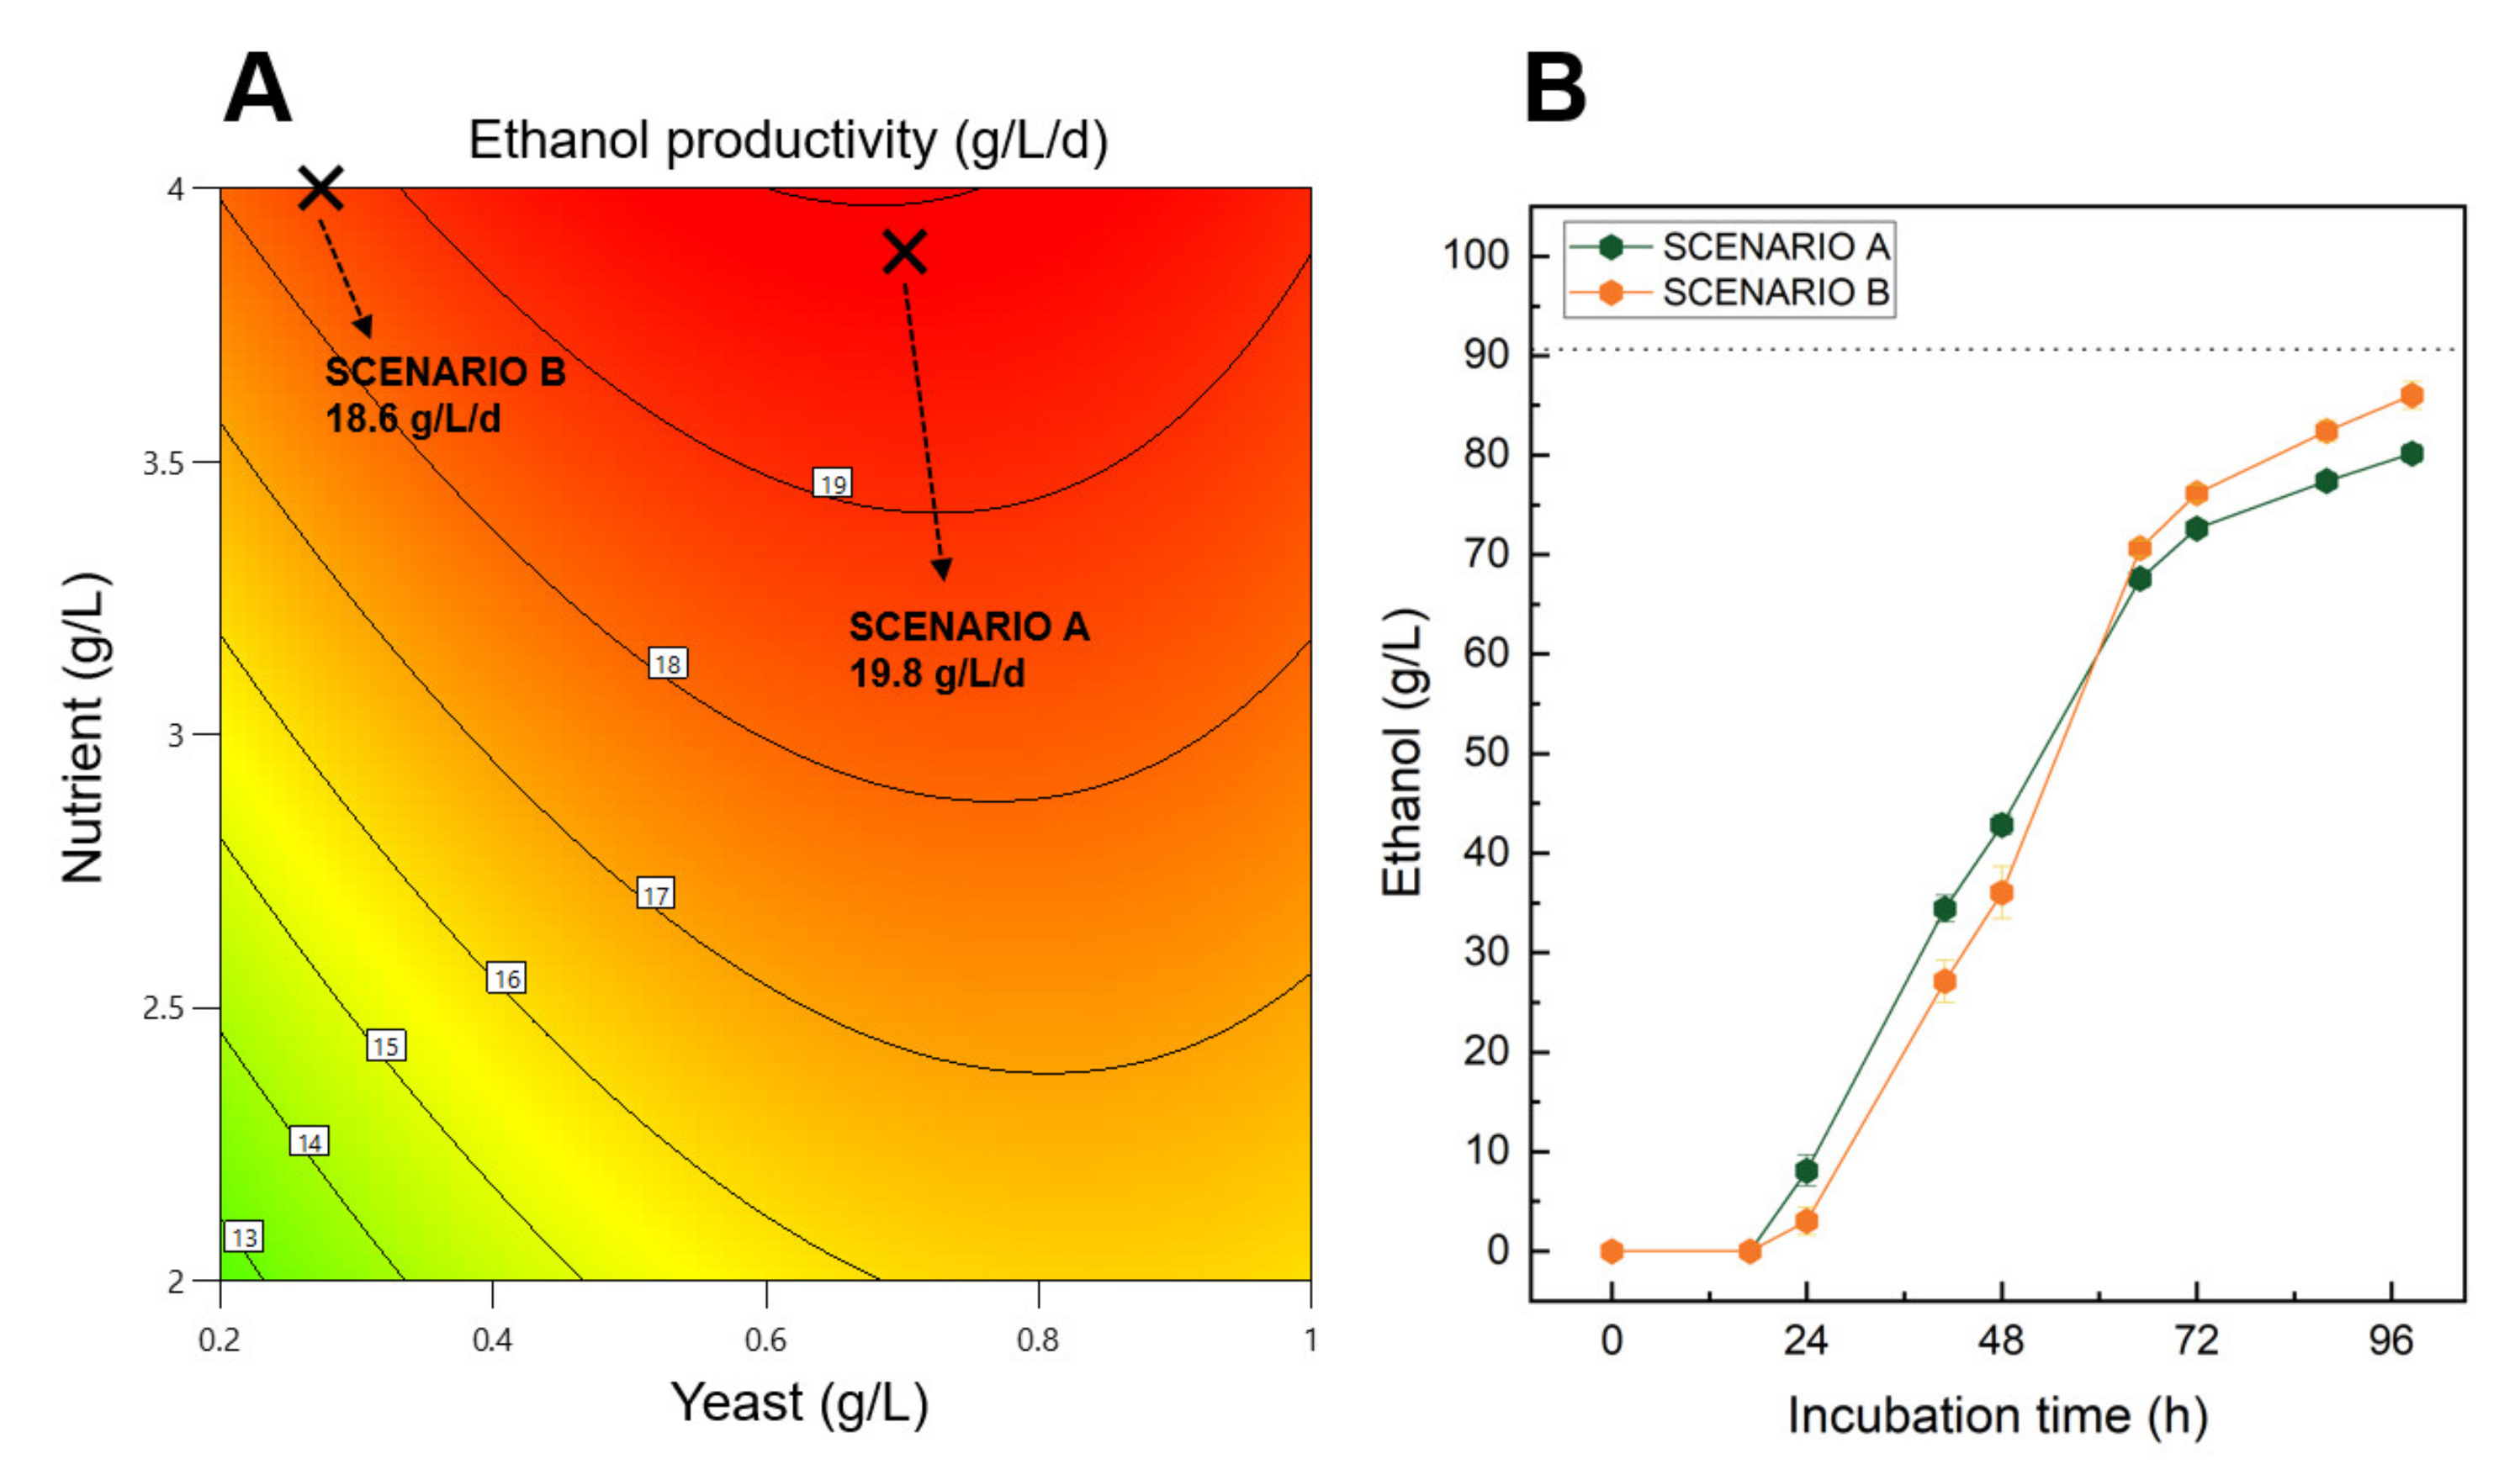
To confirm that the CCD-RSM model can be used to make accurate process predictions, validation experiments were performed at lab-scale using 50 mL vials based on the results presented in the first part of this study. Two process scenarios called respectively “scenario A” and “scenario B” were designed to maximise the ethanol productivity while taking into consideration specific operational process constraints. For both scenarios, the initial sugar concentration was kept between 125 and 225 g/L at a specific concentration of 170 g/L to trigger high ethanol yield and productivity responses. In addition, scenario B was designed to minimise the quantity of initial yeast while still trying to maximise the ethanol productivity response. Finally, the nutrient content was predicted within the design space with 3.9 and 4.0 g/L of initial nutrient concentration for scenario A and B, respectively.
Isoresponses curves predicting the ethanol productivity give valuable information regarding the combinatory effect of nutrient and yeast concentration on the process output, at a specific sugar concentration of 170 g/L (Figure 5A). Ethanol productivity performances higher than 19 g/L/d could be achieved by using a minimum of 3.5 g/L of nutrient during the fermentation. Interestingly, the quantity of yeast initially introduced in the system could be significantly lower to 0.2 g/L while still generating ethanol at a high production rate.
Confirmation experiments showed that after a first lag phase of 24 h, both scenarios continuously produced ethanol before reaching more than 70 g/L of ethanol after 72 h of incubation (Figure 5B). By the end of the fermentation, scenario A and B reached final ethanol concentrations of 80.2 and 86.0 g/L, which represent theoretical ethanol yields of 88.5% and 94.9%, respectively (Table S1). In addition, high ethanol productivities were achieved during the confirmation experimental assays with 19.5 and 21 g/L/d obtained for scenario A and B, respectively.
The mathematical model developed in this study was able to accurately predict the ethanol productivity response with an error lower than 12.9%, which we considered as statistically acceptable based on the challenges of reproducibility associated with the implementation of biotechnological processes such as the fermentation one. In addition, the confirmation experimental results highlighted the fact that the quantity of yeast can be considerably reduced while obtaining high ethanol productivity of 18.6 g/L/d (scenario B). This might have a major impact on the operating expenses of the fermentation process, reducing by 2.6-fold the cost related to the use of yeast.

3.6. Scale-Up Assays

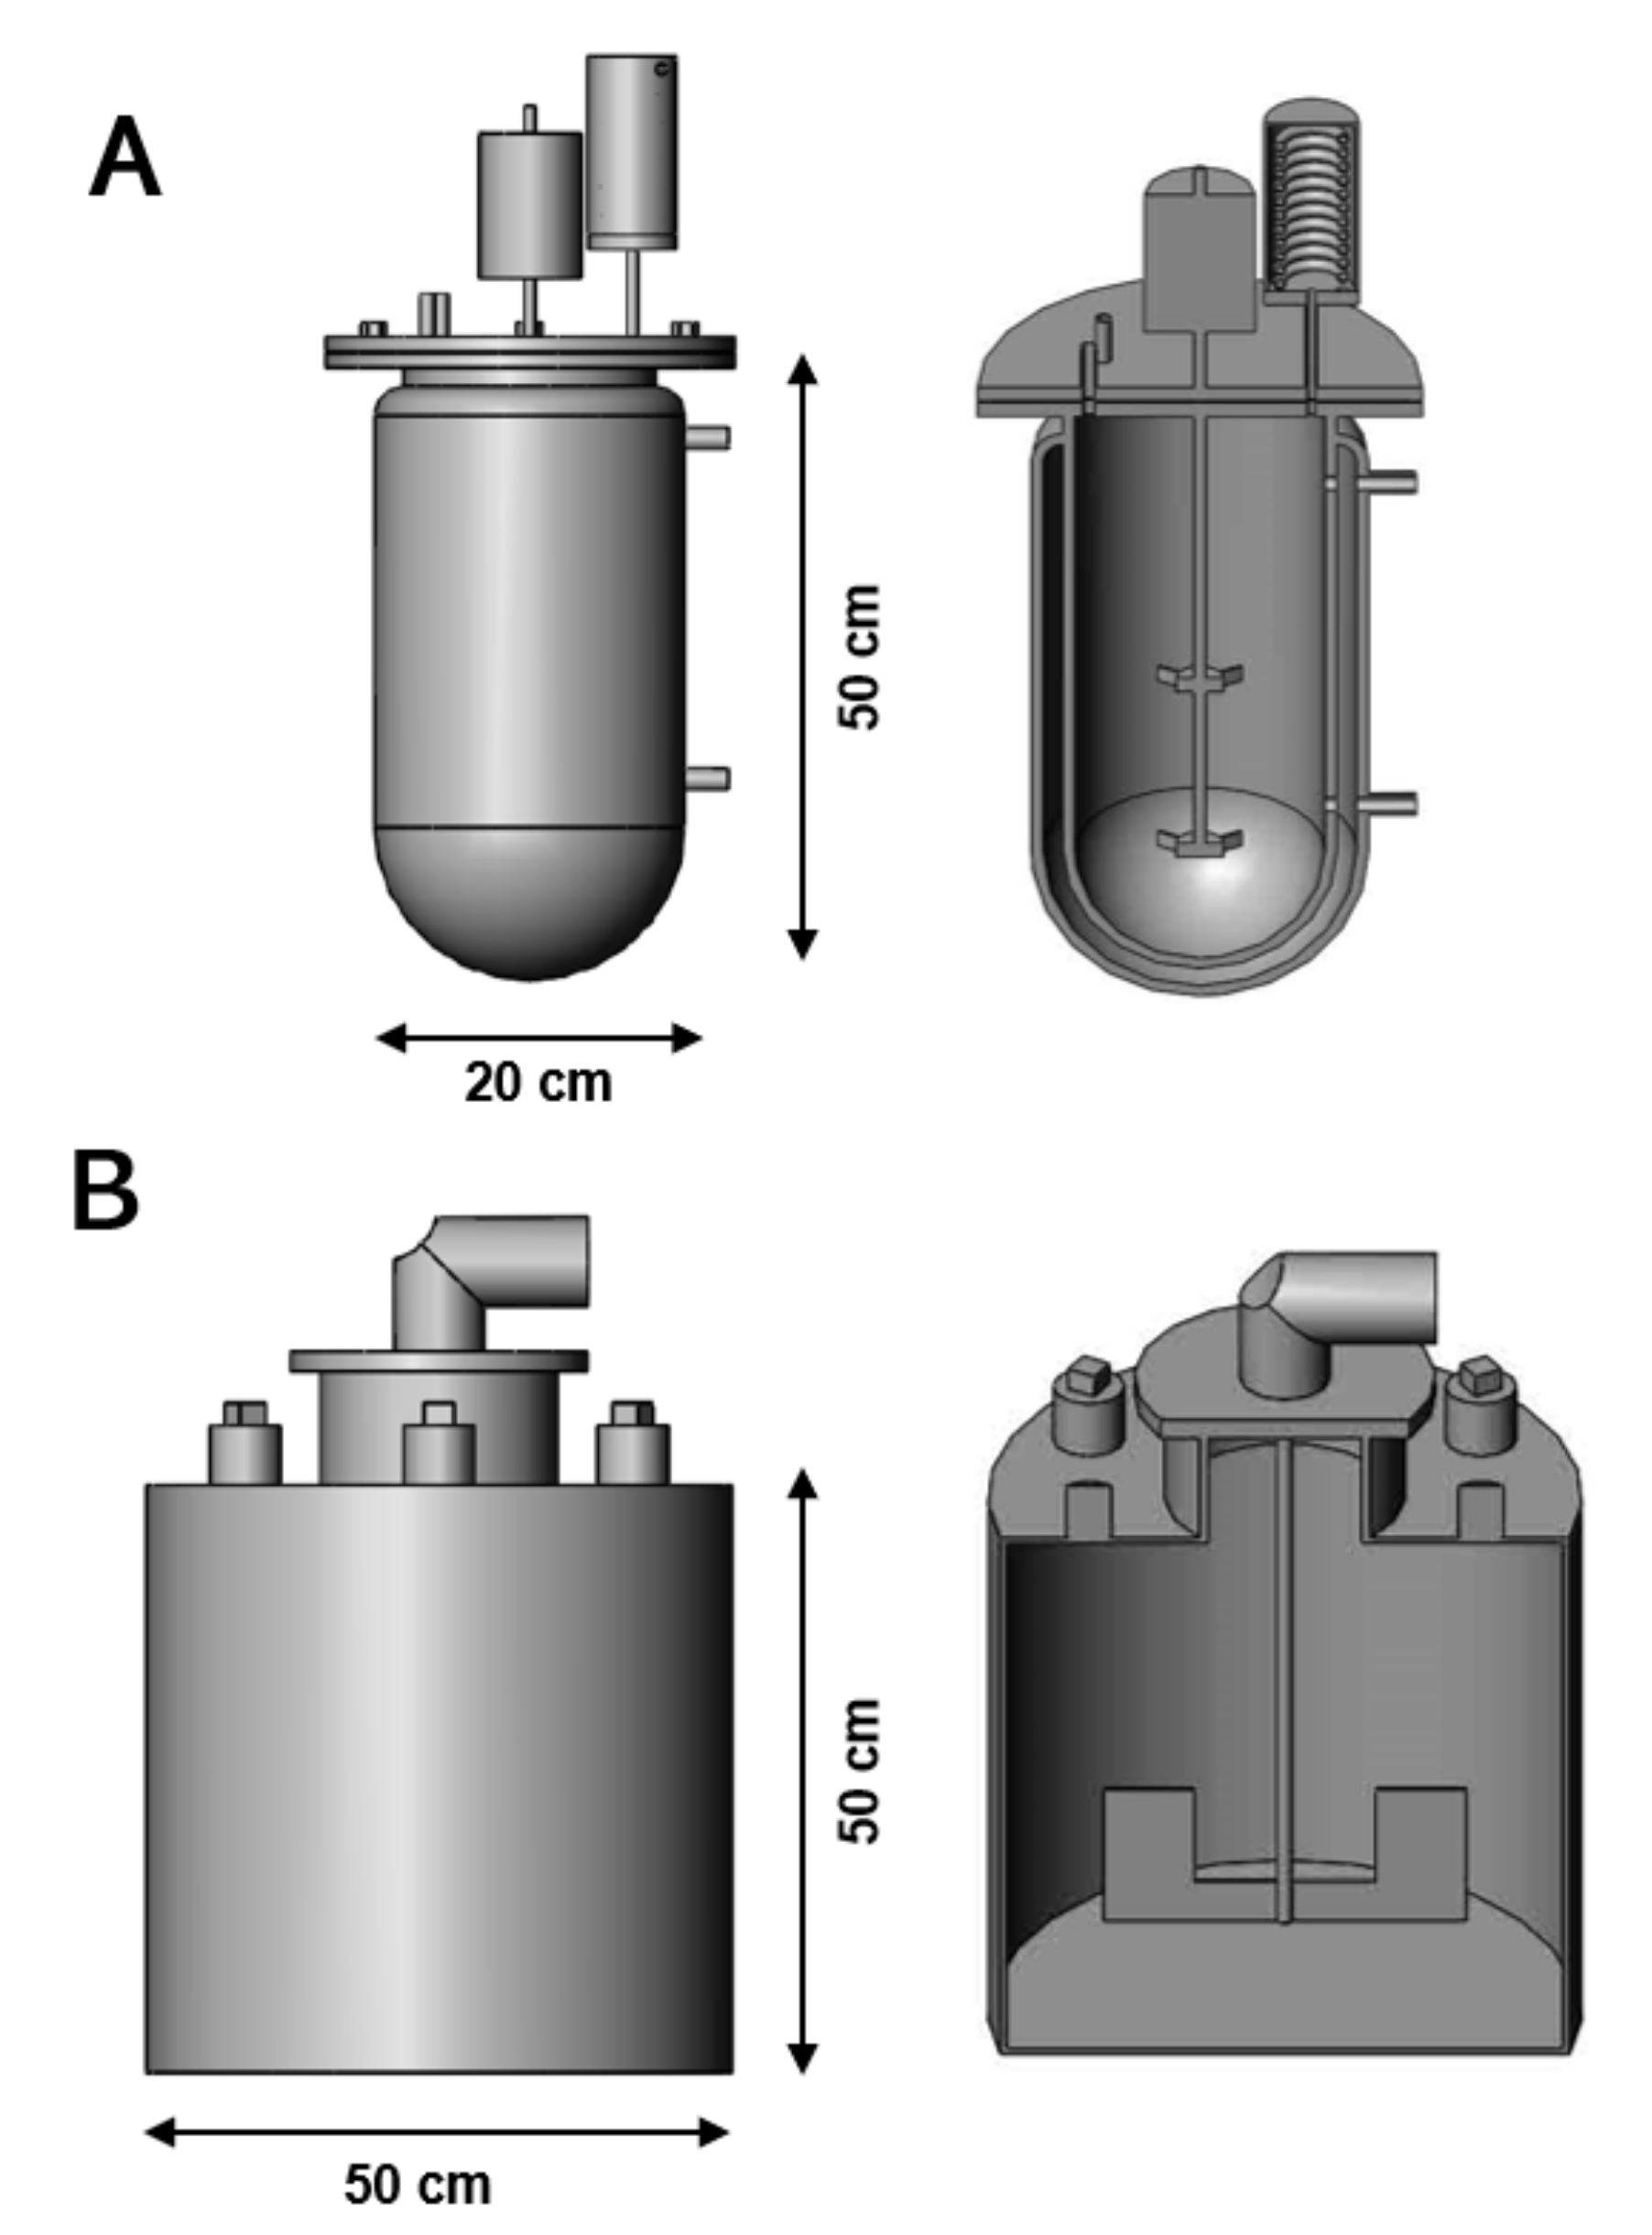
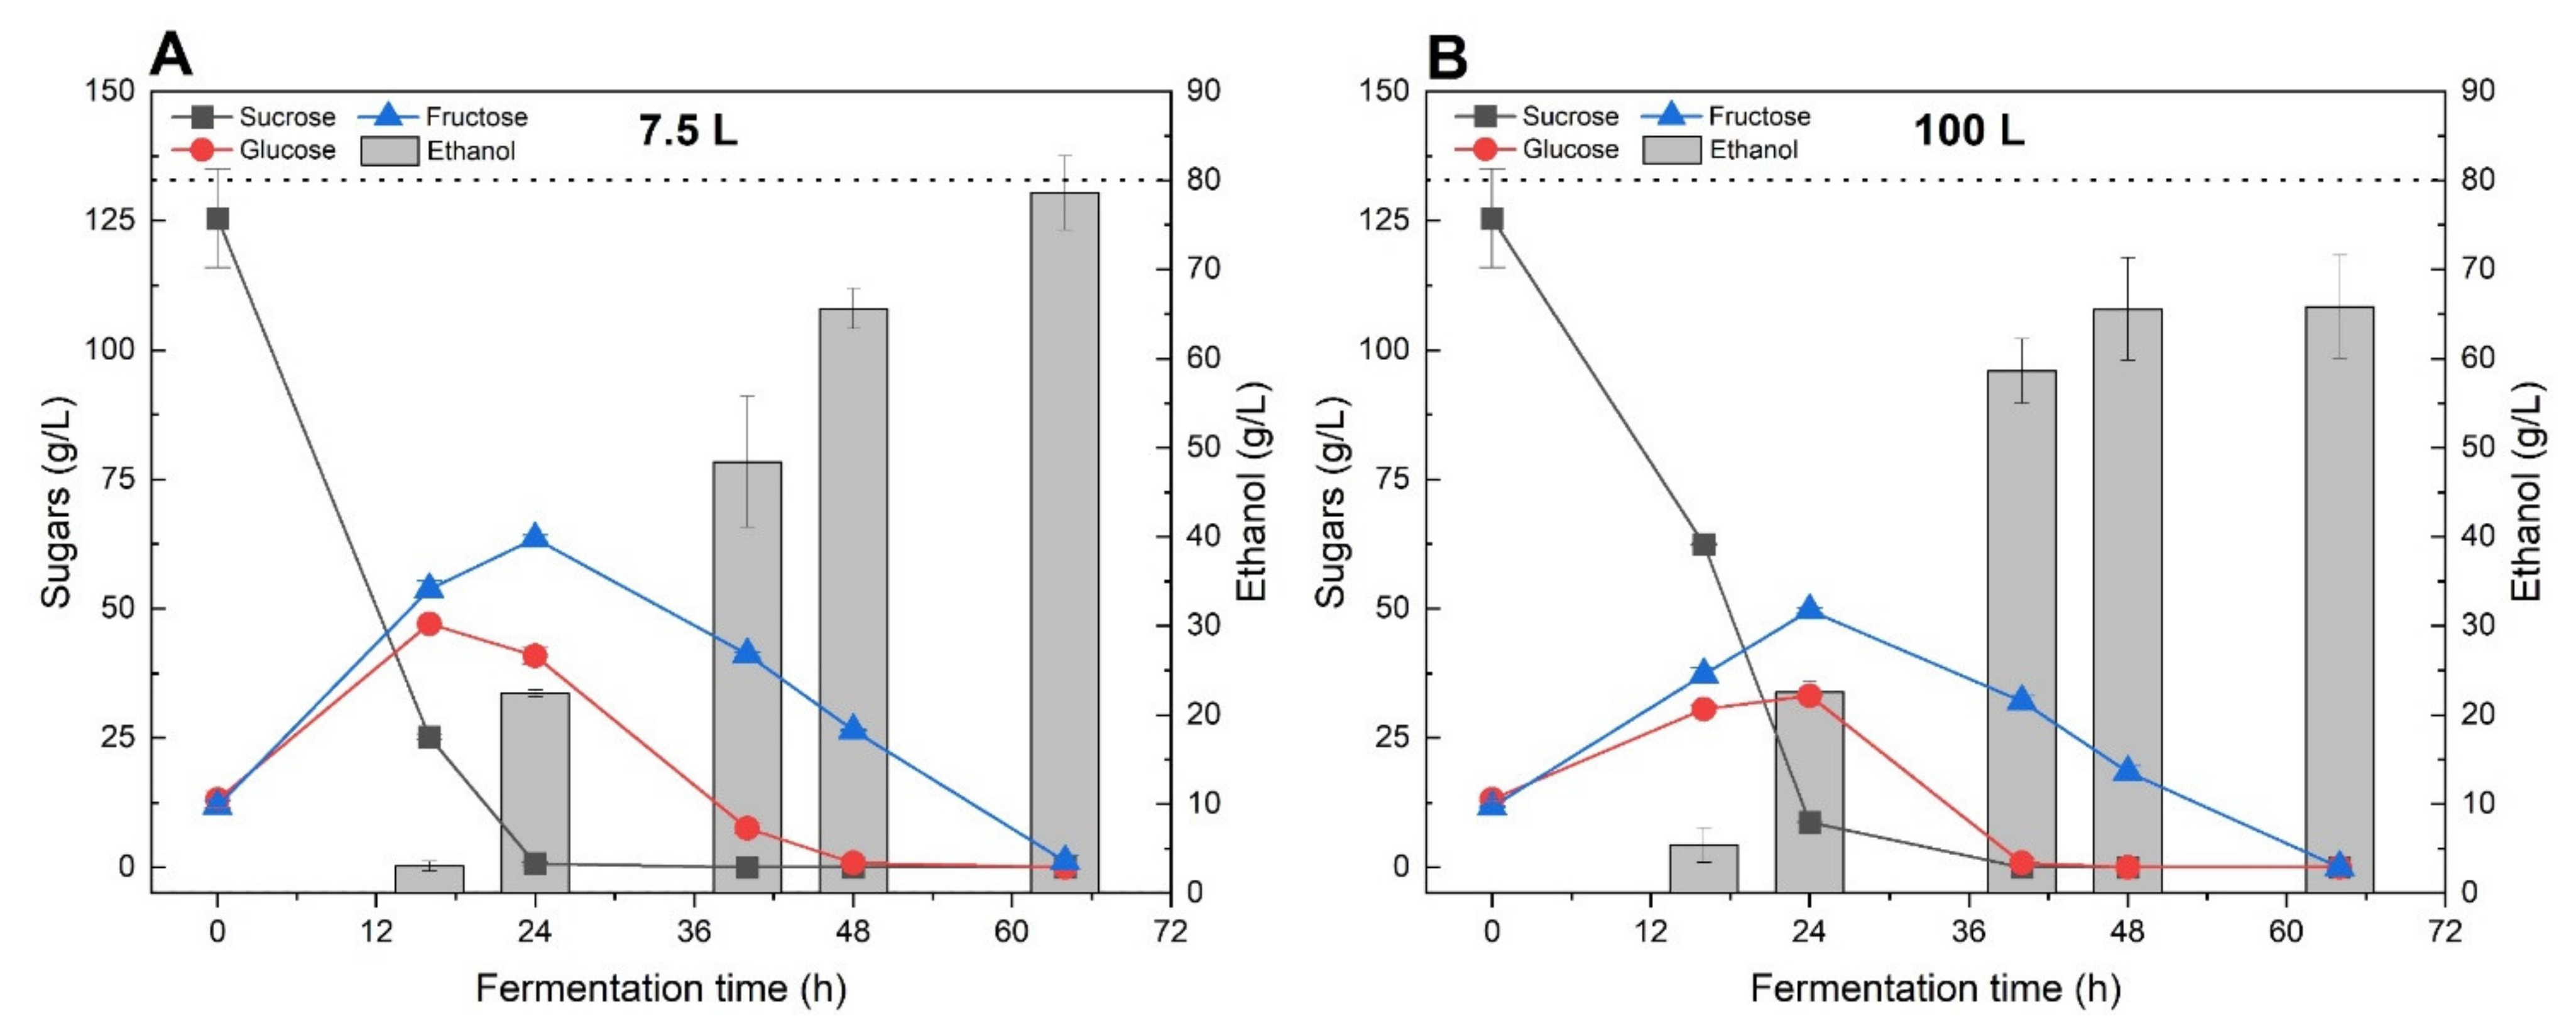
Scaling up biological processes such as the alcoholic fermentation process often requires further investigation at an intermediate scale to realise a smooth transition from bench-scale to pilot-scale. In this context, experimental results obtained in the first part of this study were used to design and perform fermentation assays at bioreactor-scale. Diluted sugar beet molasses, with an initial total sugar concentration of 150 g/L, were used as feedstock to perform batch fermentation using two bioreactors with total volumes of 7.5 and 100 L, respectively. Fermentation broths were regularly sampled to monitor the sugar and ethanol concentration throughout the experiment.
During the first 24 h of incubation, the diminution of sucrose concentration was correlated with the production of 22.5 g/L of ethanol as well as an increase of glucose and fructose concentrations, for both the 7.5 and 100 L bioreactors (Figure 6). The latter phenomena can certainly be attributed to the hydrolysis of sucrose by S. cerevisiae’s invertase enzyme [24]. It is worth mentioning that glucose was preferentially utilised by yeast cells, with a higher consumption rate than fructose. Then, the concentration of both reducing sugars continuously decreased over the fermentation and after 64 h of reaction, could not be detected anymore.
The two bioreactors presented slightly different behaviours in term of ethanol productivity as well as sugar utilization rate. For the 7.5 L bioreactor, ethanol concentration increased from 65.6 to 79.6 g/L between 48 and 64 h of fermentation, corresponding to a variation of ethanol yields from 81.9% and 99.5%, respectively. Interestingly, the ethanol concentration measured in the 100 L bioreactor remained similar between 48 and 64 h of incubation (around 65 g/L of ethanol), even if the fructose concentration decreased from 18.4 to 0 g/L, after 16 h. The latest observation suggests that some ethanol might have been produced during the last hours of incubation but directly escaped the fermentation broth due to evaporation. This situation could be explained by the fact that the 100 L bioreactor was not equipped with a water-cooled condenser system as compared to the 7.5 L bioreactor.
In terms of ethanol productivity, the 7.5 L bioreactor generated 29.9 g/L/d of ethanol compared with 23.7 g/L/d for the 100 L bioreactor when calculating the productivity after 64 h of incubation (Table 5). The lower fermentation performances observed for the 100 L bioreactor highlights the risk of ethanol evaporation during the scale-up of fermentation processes. In addition, analysis of the final fermentation broths showed very low levels of organic compounds such acetic and lactic acids, which confirmed that the scale-up experiments were not subjected to any major microbial contamination.
The ethanol productivity values obtained during the scale-up assays were found to be significantly higher than the ones obtained at lab-scale using the 50 mL vials, probably due to the difference of scale and reactor configuration. The most important difference between the incubator and bioreactor scales might be related to the mixing conditions, impacting the mass transfer between the yeast cells and the fermentation broth. The agitation performed in the incubator with the 50 mL fermentation vials was indirectly using an orbital shaker, which was certainly less efficient than the direct agitation maintained by a mechanical impeller, in the case of the 7.5 and 100 L reactors. In the case of the bioreactors, the microorganisms were continuously in suspension which could have significantly increased their contact with the molasses, resulting in a higher sugar utilization rate and ethanol productivity. In a recent study, the production of ethanol using raw cassava starch was investigated from a 5 L laboratory and a 200 L pilot scale up to a 3000 L industrial-scale system [25]. Although the technology and dimension of the three latter bioreactors were different, very comparable ethanol productivities and kinetics parameters were obtained for the three scales by adjusting the power input, also known as the energy dissipation rate per unit mass, to a specific value of 0.10 W/kg. Consequently, the agitation rates of the 5, 200 and 3000 L bioreactors were respectively fixed at 200, 125 and 55 rpm based on the fermenter dimension, impeller type and size.
In addition to the mixing differences, the fermentation vials used during the CCD-RSM were sealed and flushed with nitrogen while the bioreactors were let at atmospheric pressure without nitrogen sparging. Thus, the build-up of pressure accumulated within the small fermentation vials could have affected the yeast metabolism, lowering the ethanol production performances. Similar findings were reported when investigating the effect of different process parameters on the fermentation of apple pomace by co-culturing filamentous fungi with yeast [26]. At an inoculation rate of 4.0% (v/v) of S. cerevisiae combined with 4.0% (w/v) of T. harzianum and A. sojae, increasing the agitation speed from 0 to 200 rpm showed a significant increase in the ethanol production when employing non-sealed reactor vessels.
These results highlighted the challenges associated with the scale-up of fermentation processes from lab to bioreactor scales, especially regarding the impact of agitation speed and reactor dimension. In another study, the scale-up of bioethanol production from soybean molasses raised different problems, especially with the formation of foam and the risk of bacterial contamination at pilot and industrial scales [27].

4. Conclusions

This work highlighted the valorisation of agro-industrial by-products for the efficient production of ethanol by yeast fermentation. The CCD-RSM methodology was employed as a powerful statistical tool to optimise ethanol productivity while considering the specific techno-economical process constraints such as the cost of S. cerevisiae yeast. Experimental results suggested that the raw sugar beet molasses should be diluted between 125–250 g/L of initial sugar and supplemented with a high concentration of nutrient (4 g/L) to achieve high ethanol productivity and yield responses. In addition, the quantity of yeast present in the fermentation media was significantly reduced from 0.70 to 0.27 g/L while achieving high ethanol production performances. Assays performed in 7.5 and 100 L bioreactors suggested that the fermentation process has the potential to be implemented at pilot and industrial scales for the production of bioethanol in the context of the circular economy. In addition, a detailed techno-economic evaluation of the whole fermentation process could provide valuable information for the potential commercialization of this integrated biorefinery approach.

Supplementary Materials

The following are available online at https://0-www-mdpi-com.brum.beds.ac.uk/article/10.3390/fermentation7020086/s1, Figure S1: Linear regression between experimental ethanol concentrations calculated by mass loss and quantified by HPLC, Figure S2: “Predicted versus obtained” analysis of the ethanol productivity values generated through the CCD-RSM, Table S1: Fermentation performances of the confirmation experiments designed during the process optimization.

Author Contributions

J.-B.B.: conceptualization, methodology, investigation, formal analysis, writing—review and editing; J.M.d.M.D.: conceptualization, methodology, investigation, formal analysis, writing—review and editing; J.-M.L.: supervision, writing—review and editing, funding acquisition. All authors have read and agreed to the published version of the manuscript.

Funding

This research was funded by the Conseil de Recherches en Sciences Naturelles et en Génie du Canada (RDCPJ 531896-18) and the Consortium de Recherche et Innovations en Bioprocédés Industriels au Québec (2018-003-PR-C37).

Institutional Review Board Statement

Not applicable.

Informed Consent Statement

Not applicable.

Data Availability Statement

Not applicable.

Acknowledgments

The authors would like to thank Jean Provencher and Philippe Robert (Gestion P.A.S Inc., Coaticook, QC, Canada) for proving the industrial sugar beet molasses and valuable information regarding its production. Further acknowledgements go to the Analytical Chemistry Laboratory of the Biomass Technology Laboratory for its support with various samples analysis.

Conflicts of Interest

The authors declare no conflict of interest.

References

  1. Heede, R. Tracing anthropogenic carbon dioxide and methane emissions to fossil fuel and cement producers, 1854–2010. Clim. Chang. 2014, 122, 229–241. [Google Scholar] [CrossRef] [Green Version]
  2. Boden, T.A.; Andres, R.J.; Marland, G. Global, Regional, and National Fossil-Fuel CO2 Emissions; Carbon Dioxide Information Analysis Center, Oak Ridge National Laboratory, US Department of Energy: Oak Ridge, TN, USA, 2017. [CrossRef]
  3. Kumar, S.; Dheeran, P.; Singh, S.P.; Mishra, I.M.; Adhikari, D.K. Kinetic studies of ethanol fermentation using Kluyveromyces sp. IIPE453. J. Chem. Technol. Biotechnol. 2013, 88, 1874–1884. [Google Scholar] [CrossRef]
  4. Sydney, E.B.; Letti, L.A.J.; Karp, S.G.; Sydney, A.C.N.; Vandenberghe, L.P.S.; de Carvalho, J.C.; Woiciechowski, A.L.; Medeiros, A.B.P.; Soccol, V.T.; Soccol, C.R. Current analysis and future perspective of reduction in worldwide greenhouse gases emissions by using first and second generation bioethanol in the transportation sector. Bioresour. Technol. Rep. 2019, 7, 100234. [Google Scholar] [CrossRef]
  5. Mohd Azhar, S.H.; Abdulla, R.; Jambo, S.A.; Marbawi, H.; Gansau, J.A.; Mohd Faik, A.A.; Rodrigues, K.F. Yeasts in sustainable bioethanol production: A review. Biochem. Biophys. Rep. 2017, 10, 52–61. [Google Scholar] [CrossRef]
  6. Joelsson, E.; Erdei, B.; Galbe, M.; Wallberg, O. Techno-economic evaluation of integrated first- and second-generation ethanol production from grain and straw. Biotechnol. Biofuels 2016, 9, 1–16. [Google Scholar] [CrossRef] [PubMed] [Green Version]
  7. Ro, K.S.; Dietenberger, M.A.; Libra, J.A.; Proeschel, R.; Atiyeh, H.K.; Sahoo, K.; Park, W.J. Production of ethanol from livestock, agricultural, and forest residuals: An economic feasibility study. Environments 2019, 6, 97. [Google Scholar] [CrossRef] [Green Version]
  8. Tomei, J.; Helliwell, R. Food versus fuel? Going beyond biofuels. Land Use Policy 2015, 56, 320–326. [Google Scholar] [CrossRef]
  9. Prasoulas, G.; Gentikis, A.; Konti, A.; Kalantzi, S.; Kekos, D.; Mamma, D. Bioethanol production from food waste applying the multienzyme plasma at laboratory and bench-scale levels and its application as a starter culture in a meat product. Fermentation 2020, 6, 39. [Google Scholar] [CrossRef] [Green Version]
  10. Zheng, T.; Yu, H.; Liu, S.; Jiang, J.; Wang, K. Achieving high ethanol yield by co-feeding corncob residues and tea-seed cake at high-solids simultaneous saccharification and fermentation. Renew. Energy 2020, 145, 858–866. [Google Scholar] [CrossRef]
  11. Alfonsín, V.; Maceiras, R.; Gutiérrez, C. Bioethanol production from industrial algae waste. Waste Manag. 2019, 87, 791–797. [Google Scholar] [CrossRef] [PubMed]
  12. Naik, S.N.; Goud, V.V.; Rout, P.K.; Dalai, A.K. Production of first and second generation biofuels: A comprehensive review. Renew. Sustain. Energy Rev. 2010, 14, 578–597. [Google Scholar] [CrossRef]
  13. Razmovski, R.; Vučurović, V. Bioethanol production from sugar beet molasses and thick juice using Saccharomyces cerevisiae immobilized on maize stem ground tissue. Fuel 2012, 92, 1–8. [Google Scholar] [CrossRef]
  14. Palmonari, A.; Cavallini, D.; Sniffen, C.J.; Fernandes, L.; Holder, P.; Fagioli, L.; Fusaro, I.; Biagi, G.; Formigoni, A.; Mammi, L. Short communication: Characterization of molasses chemical composition. J. Dairy Sci. 2020, 103, 6244–6249. [Google Scholar] [CrossRef]
  15. Ghorbani, F.; Younesi, H.; Esmaeili Sari, A.; Najafpour, G. Cane molasses fermentation for continuous ethanol production in an immobilized cells reactor by Saccharomyces cerevisiae. Renew. Energy 2011, 36, 503–509. [Google Scholar] [CrossRef]
  16. Roukas, T.; Kotzekidou, P. Rotary biofilm reactor: A new tool for long-term bioethanol production from non-sterilized beet molasses by Saccharomyces cerevisiae in repeated-batch fermentation. J. Clean. Prod. 2020, 257, 120519. [Google Scholar] [CrossRef]
  17. Mangwanda, T.; Johnson, J.B.; Mani, J.S.; Jackson, S.; Chandra, S.; McKeown, T.; White, S.; Naiker, M. Processes, Challenges and Optimisation of Rum Production from Molasses—A Contemporary Review. Fermentation 2021, 7, 21. [Google Scholar] [CrossRef]
  18. Alcantara, G.U.; Nogueira, L.C.; de Stringaci, L.A.; Moya, S.M.; Costa, G.H.G. Brazilian “Flex Mills”: Ethanol from Sugarcane Molasses and Corn Mash. Bioenergy Res. 2020, 13, 229–236. [Google Scholar] [CrossRef]
  19. Darvishi, F.; Moghaddami, N.A. Optimization of an industrial medium from molasses for bioethanol production using the Taguchi statistical experimental-design method. Fermentation 2019, 5, 14. [Google Scholar] [CrossRef] [Green Version]
  20. Keskin Gündoğdu, T.; Deniz, I.; Çalişkan, G.; Şahin, E.S.; Azbar, N. Experimental design methods for bioengineering applications. Crit. Rev. Biotechnol. 2016, 36, 368–388. [Google Scholar] [CrossRef]
  21. Boboescu, I.; Gélinas, M.; Beigbeder, J.; Lavoie, J. A two-step optimization strategy for 2nd generation ethanol production using softwood hemicellulosic hydrolysate as fermentation substrate. Bioresour. Technol. 2017, 244, 708–716. [Google Scholar] [CrossRef]
  22. Pattanakittivorakul, S.; Lertwattanasakul, N.; Yamada, M.; Limtong, S. Selection of thermotolerant Saccharomyces cerevisiae for high temperature ethanol production from molasses and increasing ethanol production by strain improvement. Antonie van Leeuwenhoek Int. J. Gen. Mol. Microbiol. 2019, 112, 975–990. [Google Scholar] [CrossRef] [PubMed]
  23. Vučurović, V.M.; Puškaš, V.S.; Miljić, U.D. Bioethanol production from sugar beet molasses and thick juice by free and immobilised Saccharomyces cerevisiae. J. Inst. Brew. 2019, 125, 134–142. [Google Scholar] [CrossRef]
  24. Marques, W.L.; Raghavendran, V.; Stambuk, B.U.; Gombert, A.K. Sucrose and Saccharomyces cerevisiae: A relationship most sweet. FEMS Yeast Res. 2015, 16, 1–16. [Google Scholar] [CrossRef] [Green Version]
  25. Krajang, M.; Malairuang, K.; Sukna, J.; Rattanapradit, K.; Chamsart, S. Single-step ethanol production from raw cassava starch using a combination of raw starch hydrolysis and fermentation, scale-up from 5-L laboratory and 200-L pilot plant to 3000-L industrial fermenters. Biotechnol. Biofuels 2021, 14, 1–15. [Google Scholar] [CrossRef] [PubMed]
  26. Evcan, E.; Tari, C. Production of bioethanol from apple pomace by using cocultures: Conversion of agro-industrial waste to value added product. Energy 2015, 88, 775–782. [Google Scholar] [CrossRef] [Green Version]
  27. Siqueira, P.F.; Karp, S.G.; Carvalho, J.C.; Sturm, W.; Rodríguez-León, J.A.; Tholozan, J.L.; Singhania, R.R.; Pandey, A.; Soccol, C.R. Production of bio-ethanol from soybean molasses by Saccharomyces cerevisiae at laboratory, pilot and industrial scales. Bioresour. Technol. 2008, 99, 8156–8163. [Google Scholar] [CrossRef] [PubMed]
Figure 1. Schematic view of the 7.5 L (A) and 100 L (B) stirred-tank bioreactors used to perform the fermentation scale-up experiments. The optimal operating conditions determined during the CCD-RSM were utilised to maximise the production of ethanol from non-treated sugar beet molasses.
Fermentation 07 00086 g001
Figure 2. Ethanol production for the different initial sugar concentration of sugar beet molasses (125, 225 and 325 g/L) using Saccharomyces cerevisiae yeast. Colours are attributed to the initial nutrient concentration: black (0.0 g/L), blue (2.0 g/L) and red (4.0 g/L). Symbols are related to the initial yeast concentration: square (0.2 g/L), circle (0.6 g/L) and triangle (1.0 g/L).
Fermentation 07 00086 g002
Figure 3. Ethanol yields expressed as a percentage of the maximum theoretical ethanol concentration for all the investigated runs of the CCD-RSM (white label). Yields were sorted in ascending order for a better interpretation of the ethanol performances. Dashed lines show the lowest (Min), the highest (Max) and the average (Mean) ethanol yields.
Fermentation 07 00086 g003
Figure 4. 3D-response curves of the ethanol productivity as a function of yeast and sugar concentrations for the three investigated nutrient concentrations of 0 (A), 2 (B) and 4 g/L (C). Untreated sugar beet molasses, diluted at several initial sugar concentration, was used as the fermentation feedstock. Red dots within the response curves represent experimental design points obtained during the CCD-RSM while contour lines show prediction outputs calculated by the mathematical model.
Fermentation 07 00086 g004
Figure 5. (A)—Isoresponse curves predicting the ethanol productivity responses based on nutrient and yeast concentrations using non-treated sugar beet molasses diluted at 170 g/L of initial sugar. (B)—Experimental fermentation kinetics of the two investigated scenarios for an initial sugar concentration of 170 g/L. Both scenarios A and B were designed for maximizing ethanol productivity with a high (0.7 g/L) and low concentration (0.27) of yeast, respectively. In addition, 3.9 and 4.0 g/L of nutrient were respectively used for scenario A and B. The dashed line represents the theoretical maximum ethanol yield of both scenarios.
Fermentation 07 00086 g005
Figure 6. Ethanol and sugar concentration variations during fermentation scale-up assays performed in 7.5 L (A) and 100 L (B) batch bioreactors. Non-treated diluted sugar beet molasses with a total initial sugar concentration of 145 g/L was used for this experiment with 4.0 g/L of nutrient and 0.27 g/L of yeast. The dashed line refers to the theoretical maximum ethanol yield.
Fermentation 07 00086 g006
Table 1. Chemical and physical properties of the raw sugar beet molasses used for the RSM fermentation assays.
ParametersValues
pH6.36
Density (kg/L)1.30
Total sugars (g/L)655.18
Sucrose (g/L)560.95
Glucose (g/L)55.23
Fructose (g/L)39.00
Acetic acid (g/L)0.79
Lactic acid (g/L)11.28
Table 2. Experimental factors and their associated levels used during the development of the CCD-RSM for the fermentation of diluted sugar beet molasses using Saccharomyces cerevisiae yeast.
FactorsSymbolsLevels
−10+1
Sugar concentration (g/L)A125225325
Yeast concentration (g/L)B0.20.61.0
Nutrient concentration (g/L)C024
Table 3. Experimental design matrix of the CCD-RSM study presenting the different experimental lines as well as the investigated response generated during the molasses fermentation optimization.
RunFactor AFactor BFactor CResponse Y1
Sugar ConcentrationYeast ConcentrationNutrient ConcentrationEthanol Productivity ± SD
g/Lg/Lg/Lg/L/d
11250.205.7 ± 0.1
21250.6215.0 ± 0.0
33250.2412.8 ± 0.1
43250.6212.8 ± 0.0
51251418.3 ± 0.1
62250.6419.8 ± 0.8
73250.202.6 ± 1.0
81250.2417.9 ± 0.2
93251415.8 ± 0.1
102250.2211.4 ± 0.1
113251010.6 ± 0.8
122250.6215.4 ±0.2
13125109.8 ± 0.1
142250.6010.3 ± 0.1
152251217.2 ± 0.6
162250.6215.3 ± 0.3
Table 4. ANOVA table of CCD-RSM used to optimise the fermentation of diluted sugar beet molasses using S. cerevisiae yeast.
SourceSum of SquaresdfMean SquareF-Valuep-Value 1
Model325.15936.13107.40<0.0001
A—Sugar concentration14.78114.7843.940.0006
B—Yeast concentration44.81144.81133.20<0.0001
C—Nutrient concentration209.711209.71623.45<0.0001
AB5.5515.5516.510.0066
AC3.5813.5810.650.0172
BC9.7919.7929.100.0017
A28.3718.3724.870.0025
B25.1615.1615.340.0078
C21.1511.153.400.1146
Residual2.0260.3364
Lack of Fit2.0150.402357.660.0996
Pure Error0.007010.0070
Cor Total327.1715
1  p-values ˂ 0.0500 represent significant model terms.
Table 5. Fermentation performances and by-products concentrations measured after 64 h of incubation at 7.5 and 100 L bioreactors scale using diluted sugar beet molasses (170 g/L of initial sugar) together with 0.27 g/L of Saccharomyces cerevisiae and 4.0 g/L of nutrient.
Parameters7.5 L100 L
Process performances
 Ethanol (g/L)79.6 ± 0.763.2 ± 1.1
 Ethanol productivity (g/L/d)29.9 ± 0.423.7 ± 0.4
 Ethanol yield (%)99.5 ± 0.978.9 ± 1.4
 Sugar utilization (%)99.2 ± 0.8100.0 ± 0.0
By-products
 Glycerol (g/L)8.7 ± 0.26.5 ± 0.2
 Lactic acid (g/L)3.8 ± 0.13.4 ± 0.2
 Acetic acid (g/L)0.8 ± 0.10.2 ± 0.0
Publisher’s Note: MDPI stays neutral with regard to jurisdictional claims in published maps and institutional affiliations.

