Article

Valorization of Bread Waste to a Fiber- and Protein-Rich Fungal Biomass

by
Sofie E. Svensson
1,*,
Ludmila Bucuricova
1,
Jorge A. Ferreira
1,
Pedro F. Souza Filho
2,
Mohammad J. Taherzadeh
1 and
Akram Zamani
1,*
1
Swedish Centre for Resource Recovery, University of Borås, 50190 Borås, Sweden
2
Laboratory of Biochemical Engineering, Chemical Engineering Department, Federal University of Rio Grande do Norte, 59078-970 Natal, Brazil
*
Authors to whom correspondence should be addressed.
Submission received: 6 May 2021 / Revised: 29 May 2021 / Accepted: 31 May 2021 / Published: 3 June 2021
(This article belongs to the Special Issue Biodegradation in Fermentation)

Abstract

:
Filamentous fungi can be used for the valorization of food waste as a value-added product. The goal of this study was the valorization of bread waste through fungal cultivation and the production of value-added products. The fungal cultivation was verified for upscaling from shake flasks to a bench-scale bioreactor (4.5 L) and a pilot-scale bioreactor (26 L). The fungus showed the ability to grow without any additional enzymes or nutrients, and it was able to consume a bread concentration of 4.5% (w/v) over 48 h. The biomass concentration in the shake flasks was 4.1 g/L at a 2.5% bread concentration, which increased to 22.5 g/L at a 15% bread concentration. The biomass concentrations obtained after 48 h of cultivation using a 4.5% bread concentration were 7.2–8.3 and 8.0 g/L in 4.5 and 26 L bioreactors, respectively. Increasing the aeration rate in the 4.5 L bioreactor decreased the amount of ethanol produced and slightly reduced the protein content of the fungal biomass. The initial protein value in the bread was around 13%, while the protein content in the harvested fungal biomass ranged from 27% to 36%. The nutritional value of the biomass produced was evaluated by analyzing the amino acids and fatty acids. This study presents the valorization of bread waste through the production of a protein- and fatty-acid-rich fungal biomass that is simultaneously a source of microfibers.

1. Introduction

Food waste is generated in many steps of the food supply chain—from the producer to the consumer—and causes economic losses as well as the depletion of natural resources. In the European Union, it is estimated that 89 million tons of food are wasted per year, representing around 20% of the total amount of food produced [1]. In a food waste study carried out by Brancoli et al. [2] in a Swedish supermarket, bread represented a large contribution to the entire food waste—roughly a third of the total mass.
The valorization of food waste that is generated is crucial for reducing environmental impacts and for contributing to a circular economy. A strategy that has a high potential for the valorization of food waste is biological conversion, where microorganisms can convert the nutrients in food waste into a variety of valuable products. Due to developments in biotechnology, filamentous fungi are increasingly utilized in industries for the manufacture of a wide array of products. Edible fungal biomass is widespread in the food industry—for example, to prepare fermented foods, which are often rich in protein [3]. Mycoprotein (the protein from fungal biomass) is increasingly used in the food industry as a meat replacement [3]. Mycoprotein has the potential of being a source of protein and energy for both food and feed applications; mycoprotein from Fusarium venenatum is a well-established product for human consumption [4,5,6], and its health benefits have been assigned to the low levels of fat and the high content of protein and fiber [7,8,9]. Other strains of filamentous fungi, such as Aspergillus oryzae and Neurospora intermedia, have also been reported for the production of mycoprotein [10].
The ability of filamentous fungi, such as zygomycetes and ascomycetes, to grow on a broad range of low-cost substrates, such as crop residues and food waste [11], makes many approaches to biorefining possible, leading to a diverse range of possible products. The fermentation of yeast on starch-rich substrates is commonly conducted with the addition of hydrolyzing enzymes (e.g., amylases) in order to achieve liquefaction and to therefore support the digestion of starch [12,13,14,15,16]. However, filamentous fungi and, in particular, zygomycete fungi, such as Rhizopus, are known for their production of enzymes [17], including different amylases, which can be used for the shortening of starch. This ability could be advantageous for their cultivation on bread waste in order to generate a fungal biomass that is rich in both protein and the biodegradable fibrous polysaccharides that are present in the fungal cell walls [18]. Much of the work on the valorization of bread waste using fungi has been focused on the production of ethanol, often by including yeasts [13,19]. Other examples of end products from the valorization of waste bread are organic acids and enzymes [20]. Bread waste is also a suitable substrate for solid-state fermentation, with which products such as enzymes [21], protein, and pigments [22] have been reported. Zygomycetes are a group of filamentous fungi that have historically been used in the production of fermented foods and that have promising features for modern biotechnological applications, such as the production of lactic acid, ethanol, fish feed, enzymes, chitin, and chitosan [18].
In this study, bread waste was valorized in a scalable fungal cultivation process using the zygomycete fungus Rhizopus delemar. The fungal biomass produced not only had a high nutritional value but is also a promising source of chitin and chitosan, e.g., for textile fiber production [23]. The bread waste was dried, milled, and mixed with water as a substrate for the growth of the filamentous fungus without any addition of enzymes. The cultivation was performed with an upscaling consisting of three stages: shake flask cultivation, a 4.5 L bioreactor, and finally, a 26 L bioreactor. The effects of substrate concentration, cultivation time, and aeration rate were investigated. The biomass was analyzed for its nutritional profile in terms of protein with its amino acid profile as well as its crude fat content with its fatty acid profile.

2. Material and Methods

2.1. Substrate

The bread was collected from a local supermarket, cut into pieces, and dried at room temperature for 2–3 days. Thereafter, it was milled into breadcrumbs with a rotor beater mill (SM 100, Retsch Technology GmbH, Haan, Germany, with a sieve pore size of 3 mm) and manually mixed to achieve a homogeneous distribution of the different types of bread obtained from the supermarket. The prepared bread powder was then stored in a freezer (−18 °C) until use.

2.2. Microorganism

The strain Rhizopus delemar CBS 145940 (previously Rhizomucor sp. CCUG 61147), which was obtained from the Centraalbureau voor Schimmelcultures (Westerdijk Institute, Utrecht, the Netherlands), was originally isolated from banana leaves used for the preparation of a traditional Indonesian and Malaysian fermented food specialty called tempe/tempeh [24]. The fungus was grown on agar plates containing 17 g/L of agar, 20 g/L of glucose, and 4 g/L of peptone at a pH of 5.5 for 7 days at 30 °C. The spore suspension was prepared by adding 20 mL of sterile Milli-Q water to each agar plate and by releasing the spores with a sterile L-shaped plastic spreader.
The fungus was first tested for its ability to grow in the bread substrate media without the addition of hydrolyzing enzymes, such as amylases. The bread media were prepared in duplicate by adding 10 g of dried and milled bread to 200 mL of Milli-Q water, followed by sterilization in an autoclave (Systec, Linden, Germany) for 20 min at 121 °C (in 500 mL Erlenmeyer flasks). The flasks were inoculated with 4 mL of the spore suspension and incubated in a shaking water bath at 35 °C for 2 days. As fungal growth was observed, further cultivations were carried out without any further addition of hydrolyzing enzymes.

2.3. Batch and Fed-Batch Cultivation in Shake Flasks

To determine a suitable substrate concentration, batch cultivations were conducted in shake flasks. For each cultivation run, a specific amount of the milled bread was mixed with Milli-Q water. The media were prepared with an initial pH of 5.5 and bread concentrations (in w/v) of 2.5%, 5.0%, 7.5%, 10.0%, 12.5%, and 15.0% (Table 1). All pH adjustments were made with 0.2 M H2SO4 and 2 M NaOH. The cotton-plugged Erlenmeyer flasks (500 mL) with the bread–water suspension (200 mL) were autoclaved (20 min, 121 °C), and 4 mL of the spore suspension was added after cooling to room temperature. The effect of the initial pH was tested in the bread concentration of 7.5% at the values of 6.5 (not adjusted) and the initial pH (5.6). The fungus was cultivated at 35 °C in a water bath (Grant OLS-Aqua pro, Cambridge, UK) while shaking at 100 rpm for 48, 72, or 96 h.
The fed-batch cultivation was carried out similarly with a working volume of 200 mL and an initial bread concentration of 1.5% at a pH of 5.5. After 24 h, a 1.5% concentration of bread was added under sterile conditions in order to reach a total bread concentration of 3.0% in the cultivation flask. Then, at 32, 48, and 56 h, a 1.5% concentration of bread was added to reach a final concentration of added bread of 7.5%. The total duration of the cultivation was 72 h. The effect of bread sterilization was investigated by adding non-sterilized bread, autoclaved bread (20 min, 121 °C), or UV-sterilized bread (UV chamber, 60 min).

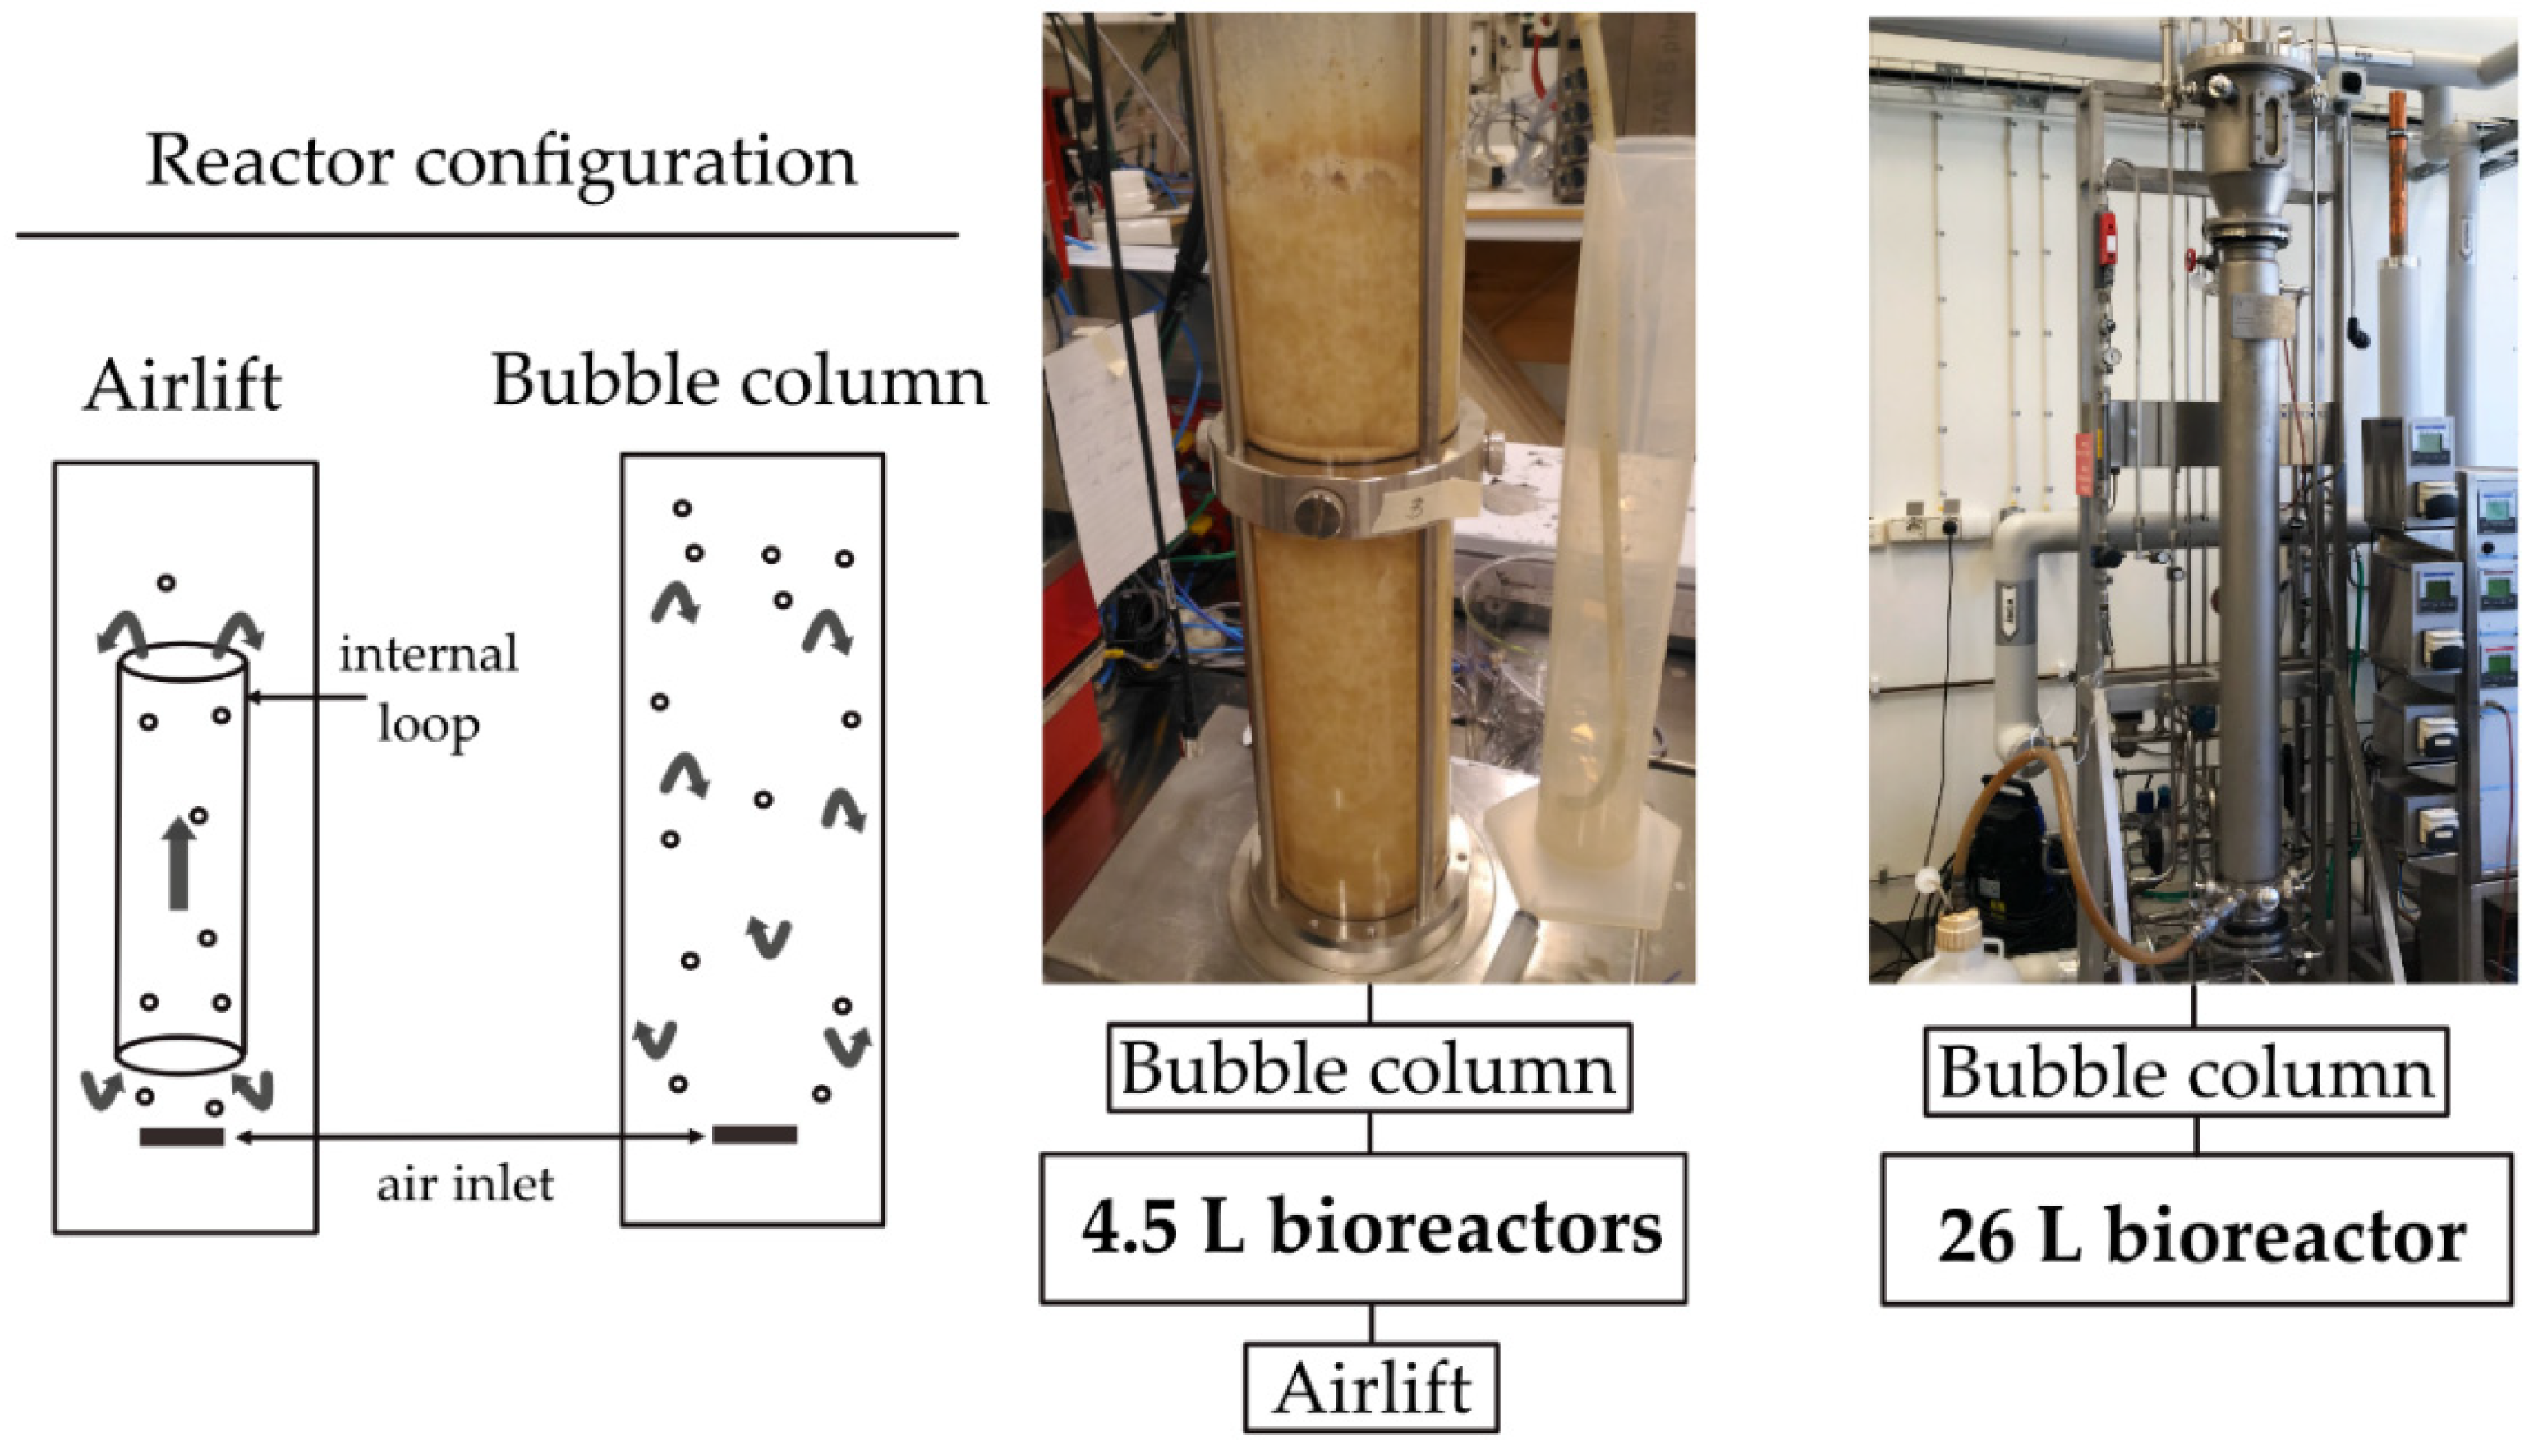
2.4. Fed-Batch Cultivation in 4.5 L Bioreactors

After the experiments with the shake flasks, fed-batch cultivations were performed in bench-scale 4.5 L bioreactors (Belach Bioteknik AB, Skogås, Sweden) with a working volume of 3.5 L and according to the operation modes given in Table 1. The bioreactors were run with two different designs: bubble column and airlift. The cultivation time was 48 or 72 h with an aeration rate of 1 vvm (volume of air per volume of liquid per minute) at 35 °C and a non-adjusted initial pH (~pH 5.6). The bioreactors, which contained a 1.5% bread–water suspension, were sterilized before cultivation in an autoclave at 121 °C for 20 min. The feeding was performed at 24, 32, 48, and 56 h. Each time, 52.5 g (1.5%) of bread (non-sterilized) was added to achieve the final concentration of 7.5% at 56 h. Finally, the effect of aeration in the bubble column reactor was tested (0.61, 1.0, or 1.42 vvm) for a total cultivation time of 48 h. In the trials with pH control and different aeration rates, the feeding was performed after 24 h and with 105 g of bread (3%), and the pH was controlled through the addition of 2 M NaOH during the course of cultivation.

2.5. Batch and Fed-Batch in a 26 L Bubble Column Bioreactor

In the final stage, the process was scaled up to a 26 L bubble column bioreactor (Bioengineering, Wald, Switzerland). The substrate concentration was set to 4.5% or 7.5%. Prior to inoculation, the bread was sterilized in an autoclave for 20 min at 121 °C, and four 5 L bottles of Milli-Q water were sterilized for 2 h at 121 °C. The sterilized bread and water were mixed with 300 mL of pre-inoculum of Rhizopus delemar CBS 145940 and grown for 24 h in three shake flasks containing 100 mL of the water–bread suspension each. The medium was transferred to the reactor, and the cultivation was run for 48 h at 35 °C in either the batch or fed-batch mode (Table 1). All pH adjustments were made manually with 10 M NaOH. The aeration was set to either 1 or 1.42 vvm.

2.6. Characterizations

The size distribution of the milled bread used during cultivation was determined by sieving the bread through meshed sieves with openings with sizes of 0.075–2 mm and by weighing the fraction left in each sieve.
The bread was analyzed for its starch content with a total starch HK Assay Kit, K-TSHK (Megazyme, Bray, Ireland) in triplicate samples. Before the analysis, the bread was milled in a ball mill (Retsch Technology GmbH, Haan, Germany) and passed through a sieve with a pore size of 0.5 mm. The ash content of the bread was determined by calcinating at 550 °C in a muffle furnace (Gallenkamp, London, UK) with triplicate measurements.
The nitrogen content in the fungal biomass (likely a mixture of fungal filaments entangled with the remaining bread particles) was analyzed using the Kjeldahl method with an InKjel P digester and a Behrotest S1 distiller (Behr Labor-Technik, Dusseldorf, Germany). The protein content was calculated using a nitrogen-to-protein conversion factor of 5.49, as described by Mariotti et al. [25]. The amino acid profiles were determined according to the SS-EN ISO 13903:2005 standard [26]. The samples that were analyzed for their amino acid profiles were simultaneously analyzed for their crude protein content by using the Dumas method with a Trumac N nitrogen determinator and a protein conversion factor of 6.25 [27].
The analysis of the crude fat content and fatty acid composition was performed according to Karlshamn’s analysis methods (Nr. 2.5.1 and Nr. 2.5.2) and the A.O.C.S. Recommended Practice Cd 1c-85. The fungal biomass from the cultivations in the 26 L reactor—which was analyzed for amino acids and fatty acids—was representative of all three cultivations conducted in the 26 L bioreactor.
Metabolites (glucose, ethanol, lactic acid, and acetic acid) from the fungal cultivations were analyzed by using high-performance liquid chromatography (HPLC) with a hydrogen-based ion-exchange column (Aminex HPX-87H, Bio-Rad, Hercules, CA, USA) at 60 °C with 0.6 mL/min of 5 mM H2SO4 as an eluent. Samples were taken from the liquid fraction of the submerged cultivations, centrifuged, and stored in a freezer. Before the HPLC analysis, the samples were thawed and filtered through 0.2 µm syringe filters.
Microscopic pictures of the fungal biomass were captured with automated time-lapse microscopy using the FluidScope™ scanning technology with the oCelloScope (BioSense Solutions ApS, Farum, Denmark). For the curation of the images, the wet biomass was dispersed in distilled water by using a kitchen blender for 1 min. The default settings for a 24-well plate were used.

2.7. Statistical Analysis

The error values and bars represent two times the standard deviation unless otherwise indicated. The experiments were conducted in duplicate unless otherwise stated. Statistical analysis was performed with the MINITAB®17 software (Minitab Ltd., Coventry, UK) with an analysis of variance (ANOVA) and general linear models. Statistically significant differences were considered at p value < 0.05.

3. Results and Discussion

Bread residue, a food waste fraction that is generated in large volumes [2], has a high content of carbohydrates and other nutrients; therefore, it is a suitable substrate for fungal cultivation and the development of different products. In this study, the utilization of bread waste enabled the production of a value-added product in the form of a fungal biomass that was rich in proteins, lipids, and microfibers. To examine the scalability of the process, the cultivation of R. delemar was conducted in three stages; pictures of the 4.5 and 26 L bioreactors are shown in Figure 1. The final biomass product from the 26 L cultivation was compared to bread in terms of its nutritional value and composition.

3.1. Substrate Analysis

The amount of starch available in the bread waste provided by a local supermarket was 52.5% (Table 2). In addition to starch, the bread contained crude fat (4.9%), total nitrogen (2.3%), and ash (2.4%). The protein content was calculated using the total nitrogen content obtained from the Kjeldahl analysis; this resulted in 12.8% protein, which differed from the protein content obtained with the Dumas method by less than 1% (13.4% protein). For the protein content in the fungal biomass (Section 3.5), the Kjeldahl method was used to analyze the biomass from the lowest concentration of bread (2.5%), while the Dumas method was used for all other samples.
The size distribution of the bread generated after the milling was determined by sieving the bread through meshed sieves. The fraction left in each sieve was weighed, and the resulting fractions were 0.8% (2 mm), 25.8% (1 mm), 45.6% (0.5 mm), 19.9% (0.25 mm), 6.1% (0.125 mm), and 1.8% (≤0.075 mm).

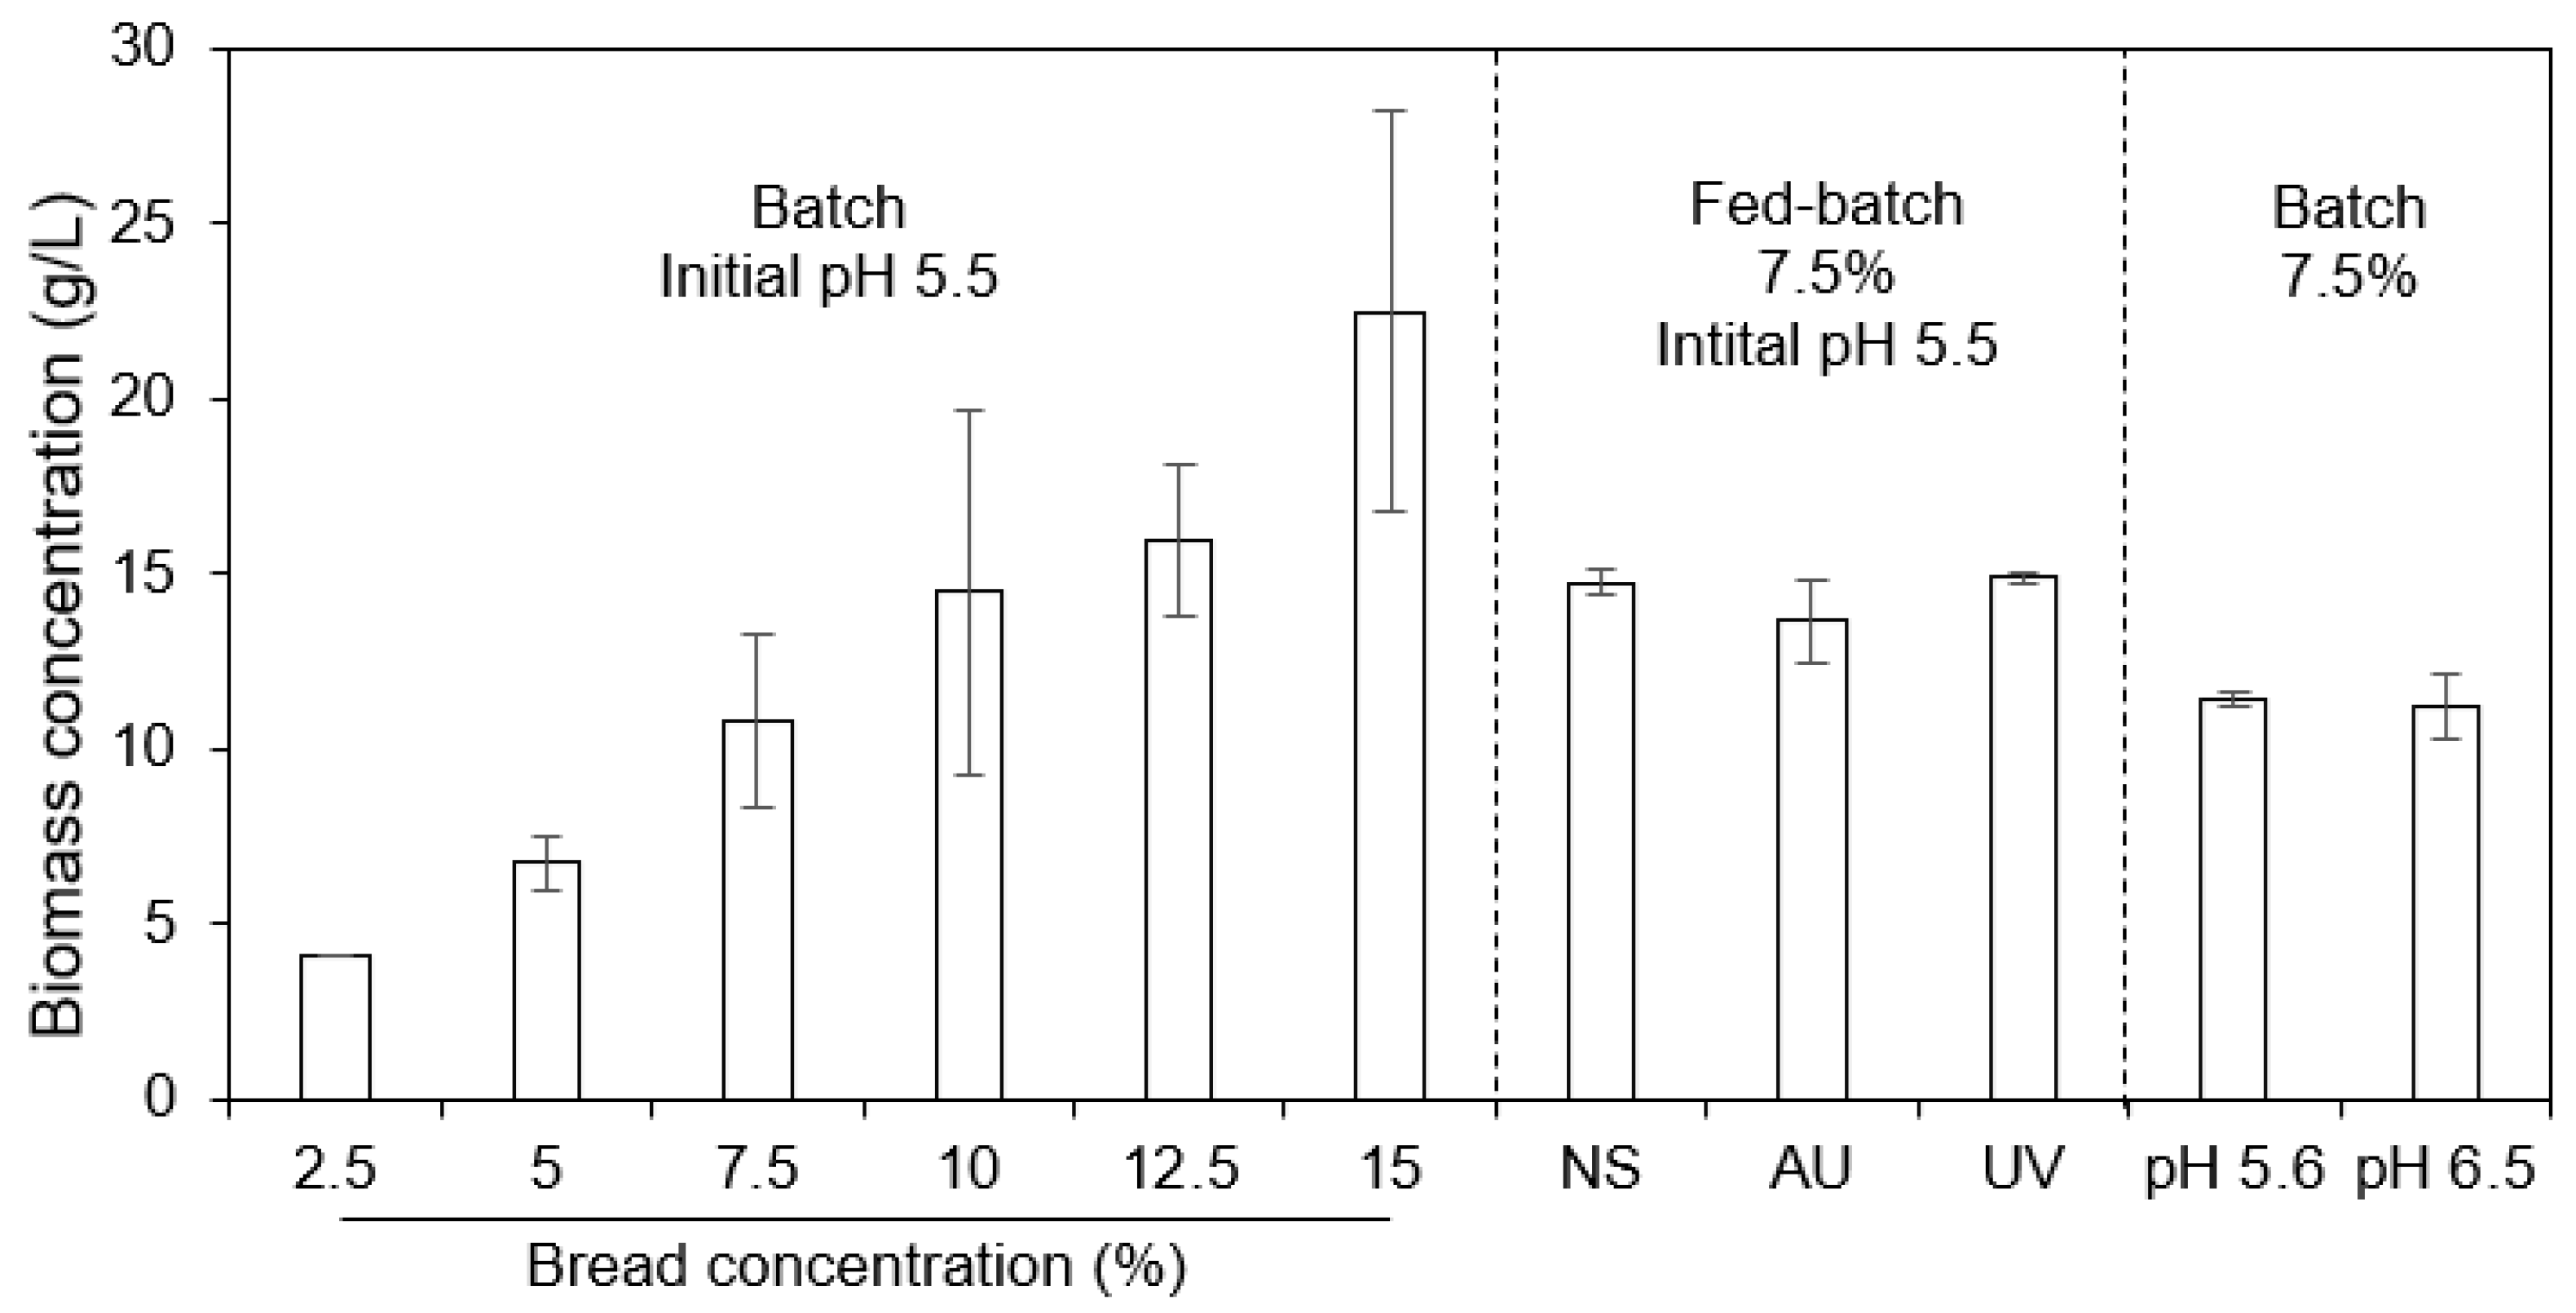
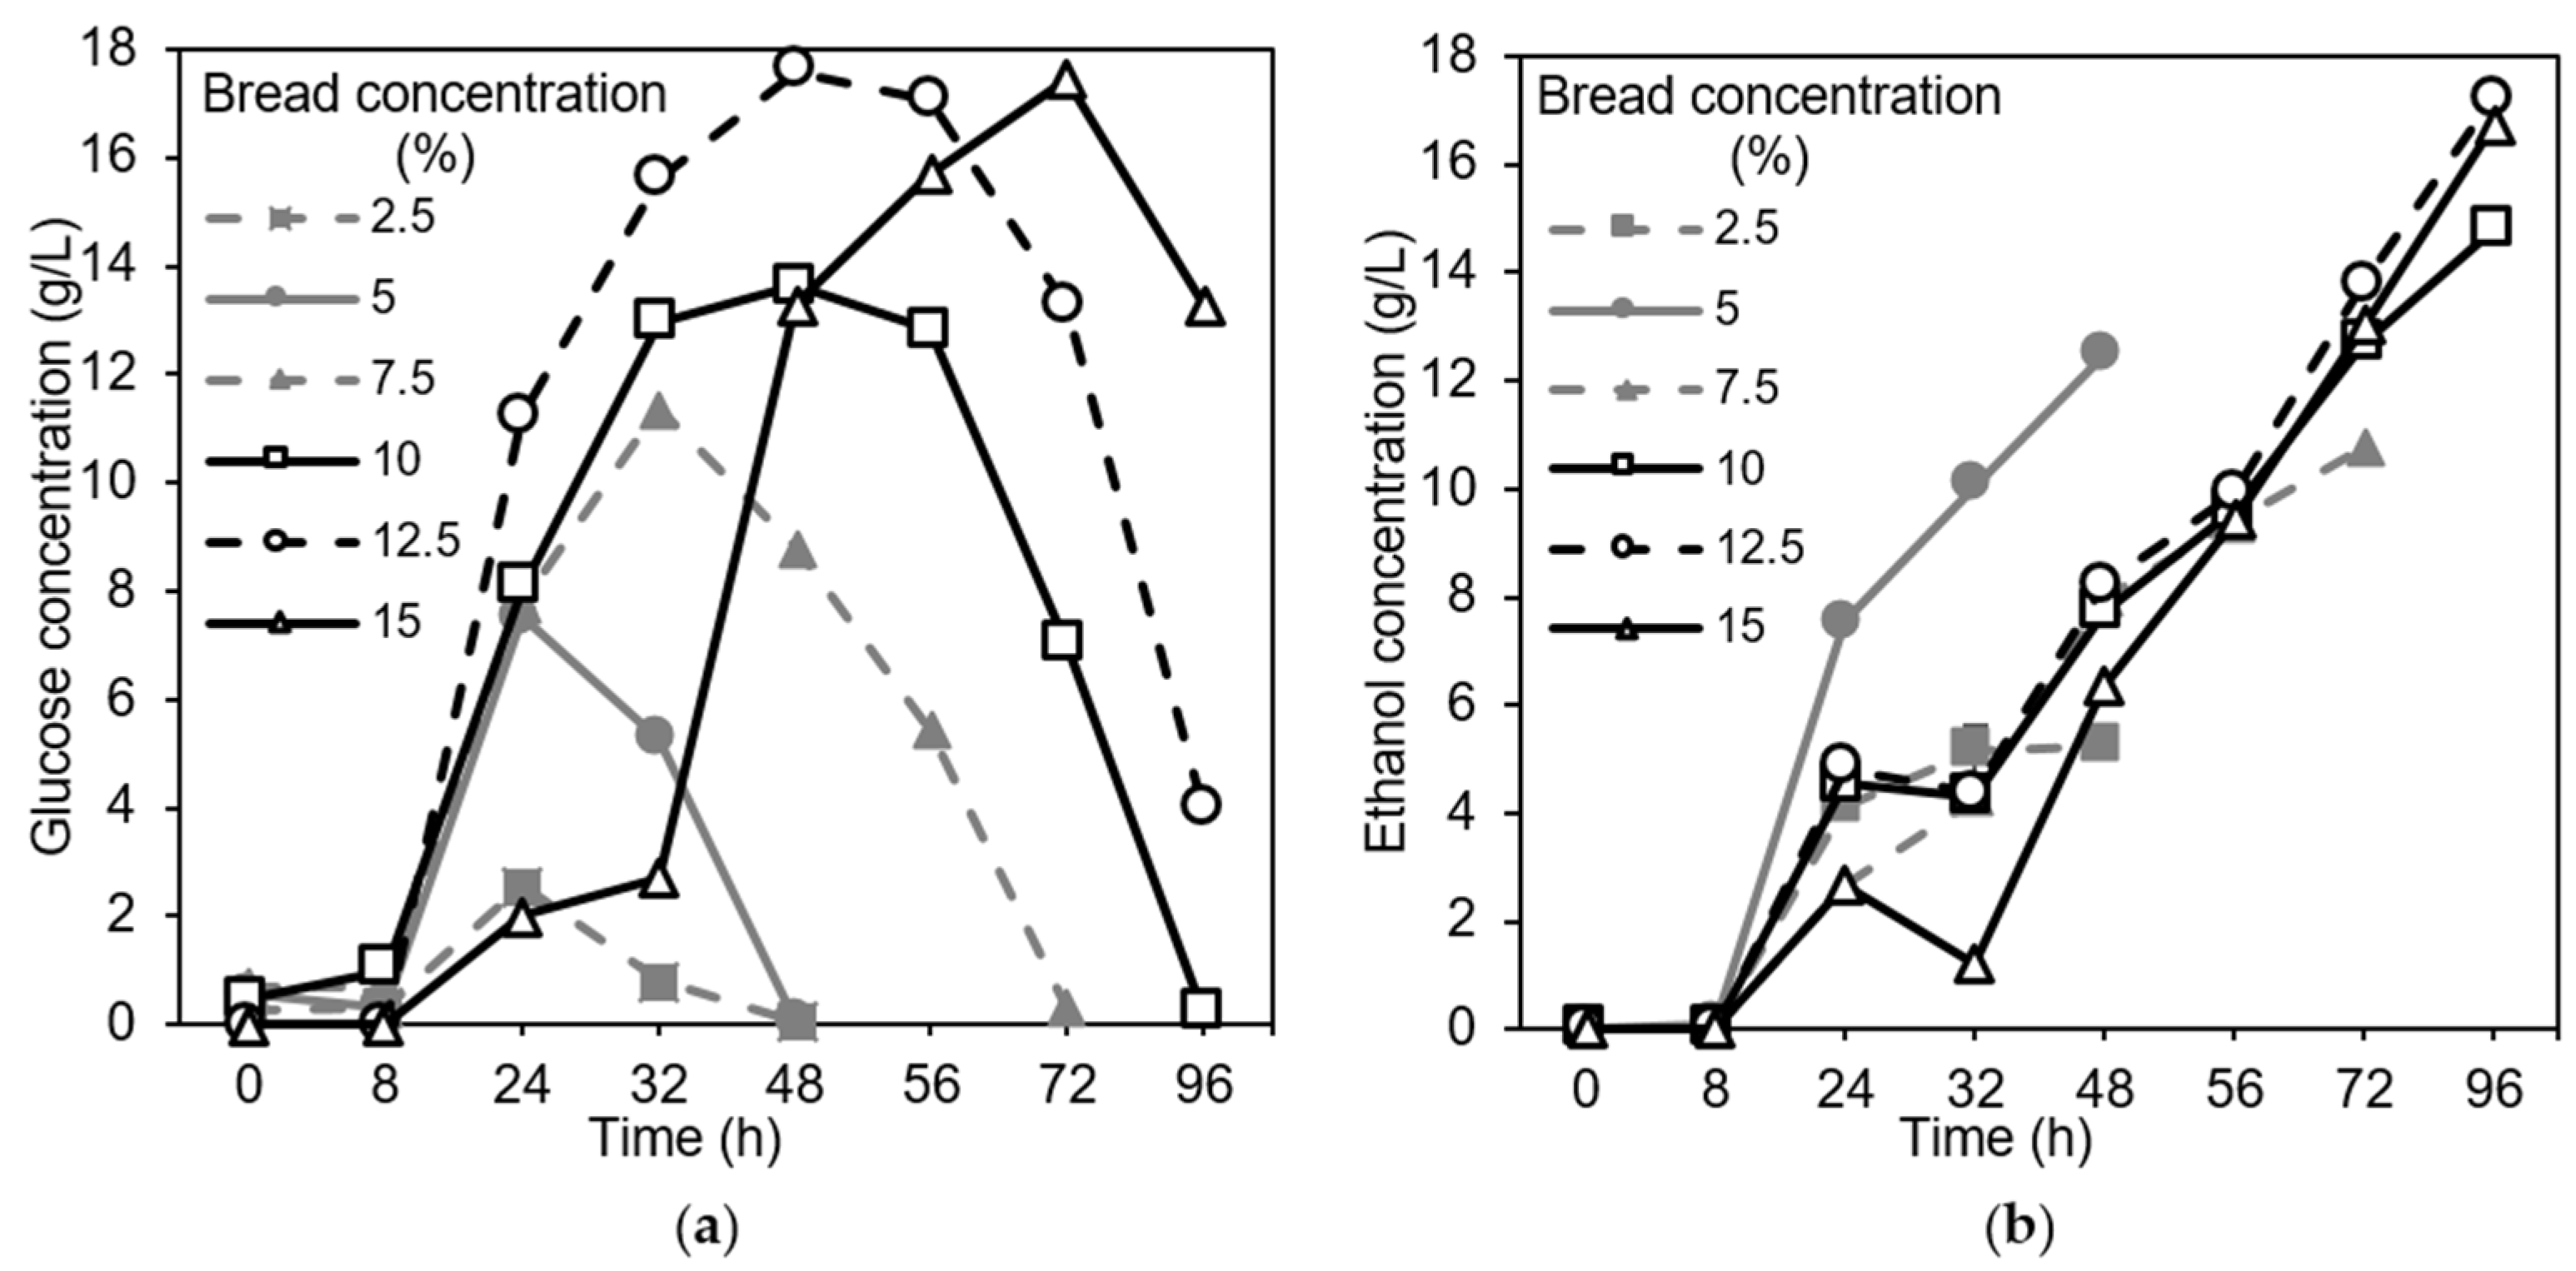
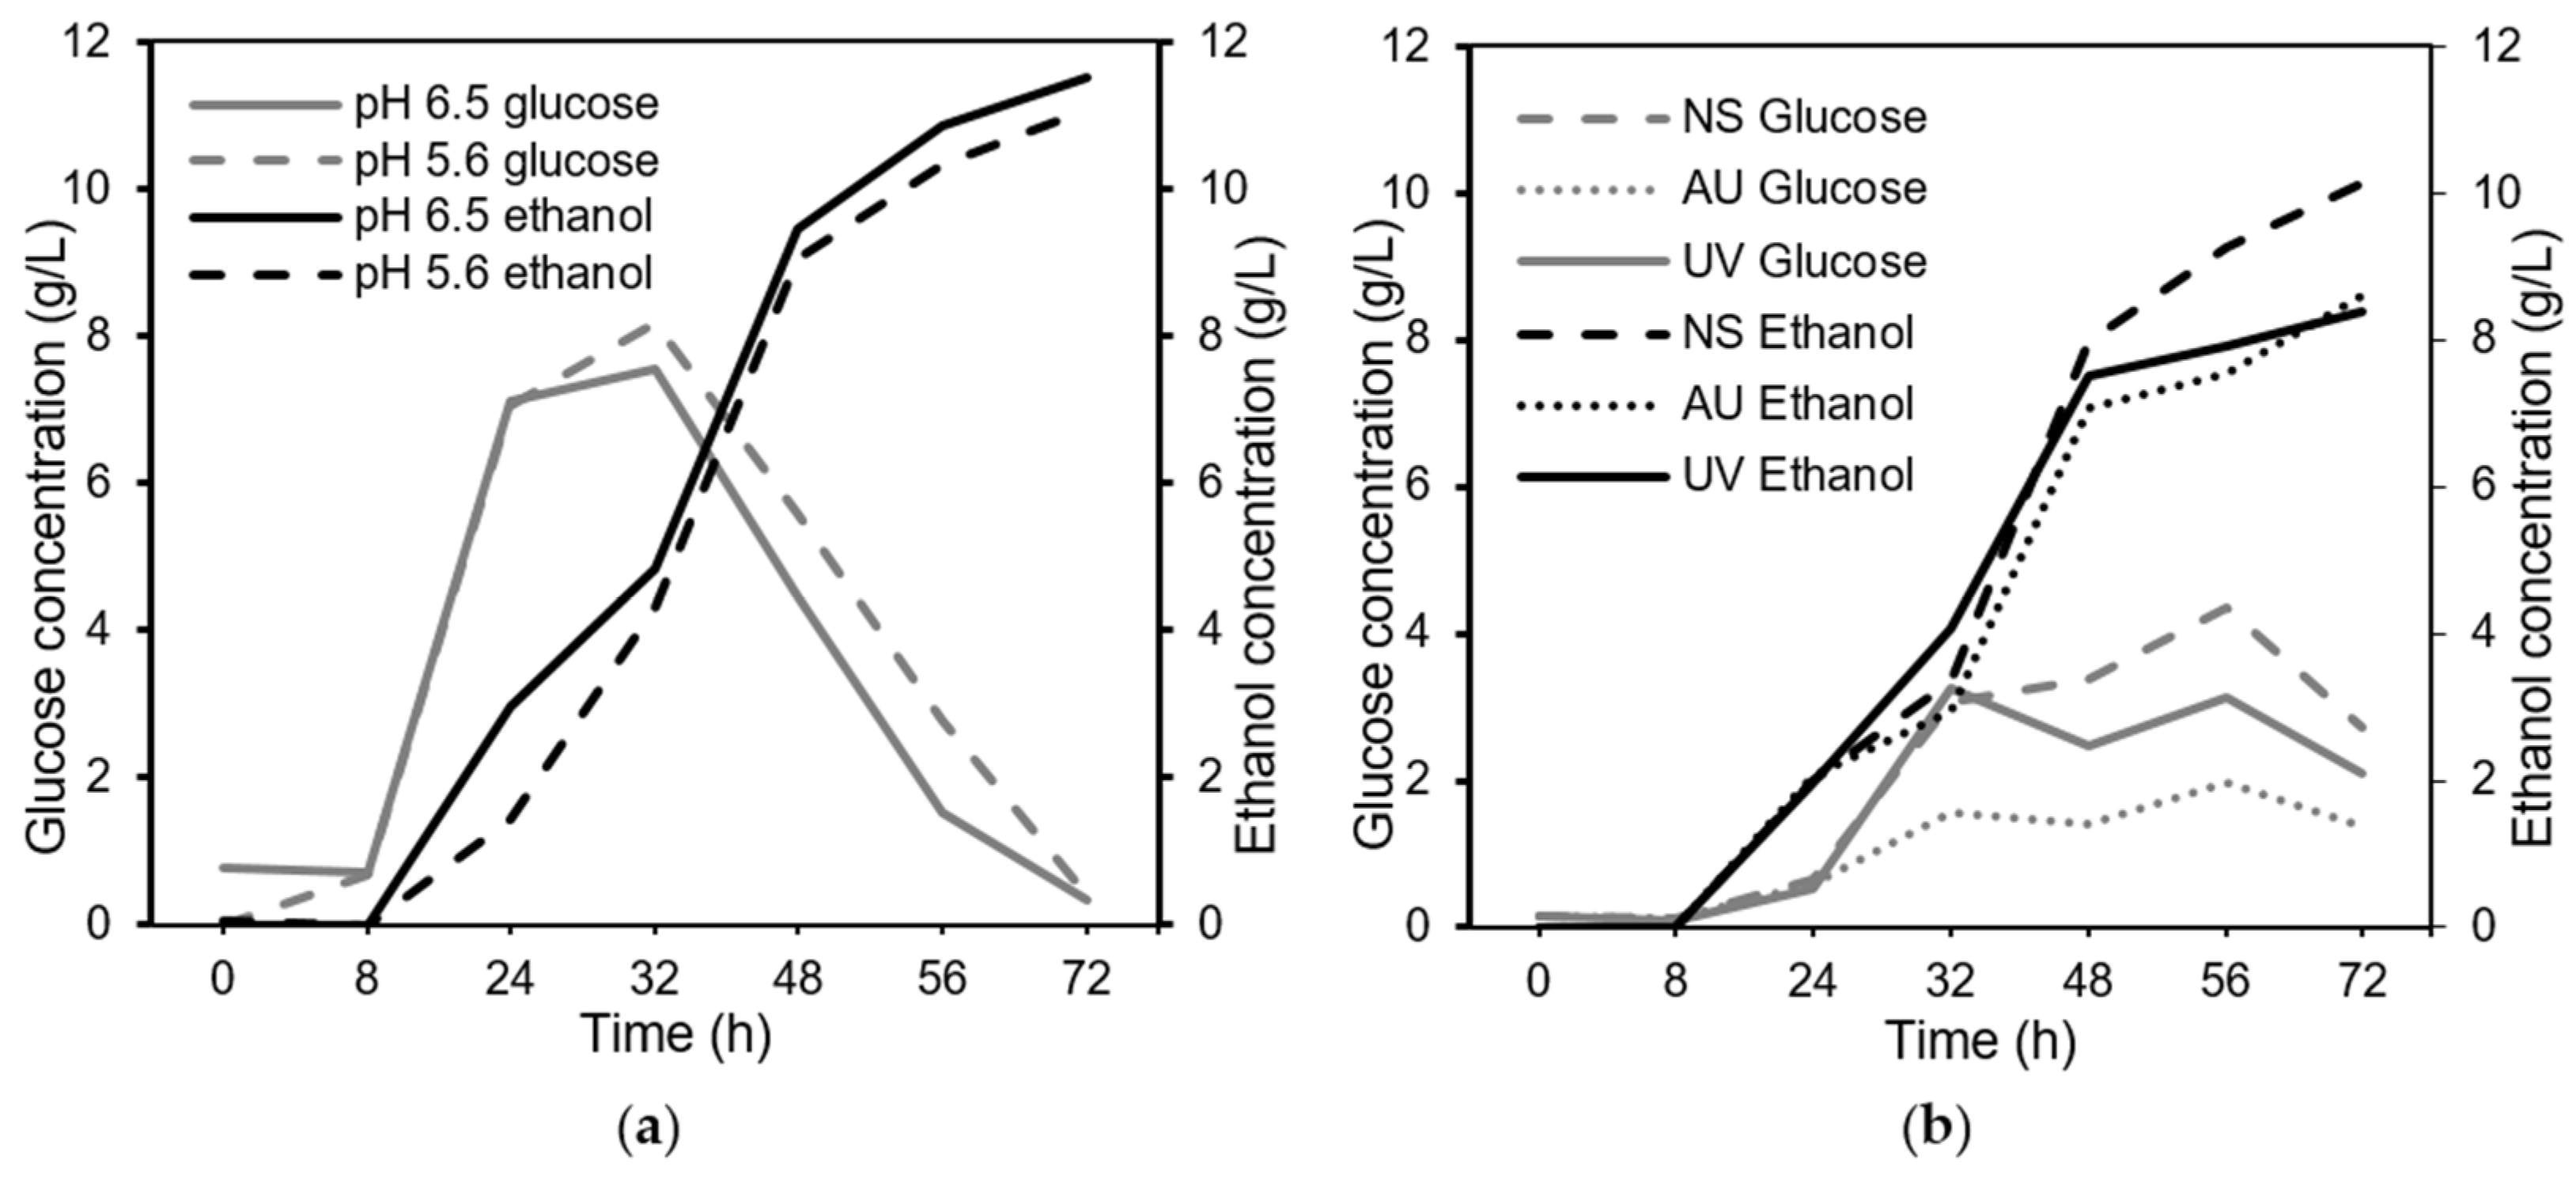
3.2. Effects of pH, Substrate Concentration, and Bread Sterilization on Fungal Growth in Shake Flasks

Given that the main goal of this study was to produce a fungal biomass, it was investigated how the substrate concentration influenced the biomass yield, the growth rate, and the ethanol yield. To establish a suitable substrate concentration in the submerged cultivation of Rhizopus delemar, a series of small-scale experiments were conducted, in which a variety of bread concentrations were used for fungal growth in shake flasks under batch conditions. At this stage, the influence of pH and the ability of the fungus to produce enzymes were also investigated. The growth of the fungus was noticeable after approximately 8 h of cultivation; therefore, no enzymatic supplementation was required. At harvest, the biomass was found to be entangled with residual bread particles; therefore, the biomass yields could have been affected by the fact that the fungus did not consume all of the substrate.
The analysis of the metabolites with HPLC showed the formation of glucose in the early stage of growth (around 24–32 h) as a consequence of the starch hydrolysis initiated by the fungus. In the later stage of the growth, the fungus consumed the glucose, and the main metabolite produced by the fungus was identified as ethanol. Therefore, the profiles of ethanol and glucose during the cultivations can provide a better picture of the actual growth rather than the apparent biomass yield. When working with suspended solid substrates, there is often difficulty in the estimation of the actual pure mycelium yield because the substrate is incorporated into the mycelium, and the fungus might grow while attached to the solid particles [28]. Acetic acid and lactic acid were not detected during the fungal cultivations.
As the substrate concentration increased, a similar trend in the increase in biomass concentration (g/L) was noticed (Figure 2).
As the concentration of the substrate increased, a longer time was required for the fungus to consume the available glucose (Figure 3a). For the concentrations of 2.5% and 5%, the glucose was consumed quickly—after 48 h. Increasing the concentration to 7.5% resulted in the consumption of the available glucose after 72 h, and for the higher concentrations (10–15%), this occurred after 96 h.
There were no statistically significant differences in the yield of the biomass (in average, 0.14 ± 0.03 g/g bread) for the different bread concentrations (p = 0.224). The lowest bread concentration, 2.5%, had the highest yield: 0.16 g/g bread. However, the fungus was able to consume 5% of the substrate within 48 h; therefore, a higher bread concentration was sought in order to achieve a higher biomass concentration (g/L) and, consequently, a higher biomass productivity. The bread concentration of 7.5% generated a relatively low ethanol concentration (Figure 3b) (only the lowest substrate concentration of 2.5% generated a lower ethanol concentration) compared to the other concentrations, and at this concentration, the glucose was consumed relatively quickly (after 72 h) (Figure 3a). Given this information, the 7.5% substrate concentration was chosen for further investigations in the shake flasks. The medium containing a 7.5% bread concentration initially had a pH value of 5.6. Another initial pH value was also tested on the 7.5% substrate concentration (pH 6.5). No major influences of the initial pH on biomass production were observed (Figure 2). Therefore, adjusting the initial pH was not necessary; this finding could also be concluded based on the glucose and ethanol profiles (Figure 4a), as all of the glucose was consumed in the cultivations with an initial pH of 6.5 and 5.6, and the ethanol concentration remained steady.
The use of a bread substrate with no need for sterilization eases the upscaling of the process and, thereby, leads to reduced energy needs and overall costs. Three different strategies for the fed-batch approach were evaluated: no sterilization (directly adding bread to the shake flasks), sterilization in an autoclave (autoclaved bread was added), and sterilization by UV (the bread was sterilized in a UV hood). The initial bread-water suspension with a concentration of 1.5% was autoclaved before starting the cultivation. The results revealed that there were no major impacts on the outcome of the cultivation in terms of biomass yield (p = 0.078); however, autoclaving the bread led to a slightly lower biomass yield of 0.18 g/g bread compared to 0.20 g/g bread for the unsterilized bread and 0.20 g/g bread for the UV-sterilized bread. The production of metabolites (Figure 4b) showed that the ethanol concentration did not differ among the different sterilization strategies (p = 0.196).
There were no statistically significant differences in the ethanol production in the fed-batch mode compared to that of the batch mode of cultivation (p = 0.066); the batch cultivation with 7.5% bread generated 10.8 g/L of ethanol, and the fed-batch cultivation resulted in 8.4–10.1 g/L of ethanol. In addition, the biomass yield showed a significant increase (p < 0.001) from 0.13 g/g bread (with 7.5%, batch mode, 72 h) to 0.18–0.20 g/g bread for the fed-batch cultivation.

3.3. Cultivation in 4.5 L Bioreactors: Effects of Reactor Design and Aeration Rate

As higher biomass concentrations were achieved in the fed-batch mode in the shake flasks, for the second stage of cultivation, the fed-batch approach was further evaluated in 4.5 L bioreactors. Two bioreactor designs were tested (Figure 1), airlift (with an internal loop) and bubble column (without the internal loop). Both designs included an air sparger in the reactor, which caused aeration and mixing in the cultivation media.
In the airlift mode, clusters of fungal biomass were formed on the walls of the inner part of the bioreactor, which inhibited homogeneous mixing. In contrast, the bubble column design showed a better air flow and fungal biomass dispersion. Furthermore, bread accumulation was observed at the bottom of the reactor during feeding. Therefore, different approaches to decrease the accumulation were tested. The first approach was lowering the position of the air sparger, the second was letting the fungal biomass sediment before the feeding (achieved by having no air flow for 1 h prior to feeding), and the third was feeding with a longer time interval (24 h) and doubling the amount in each feeding (105 g, 3%). From this, it was shown that the best approach was that of keeping the air sparger at a lower position for improved mixing while feeding with a longer interval. This approach was chosen in order to continue to evaluate the influence of the pH control and aeration rate.
Controlling the pH at 5.5 resulted in a slightly lower biomass concentration (Table 3). However, less unconsumed bread was noticed in the pH-controlled cultivation, which implied that the higher biomass concentration in the cultivation without pH control was influenced by the unconsumed bread (see Section 3.5).
The impact of varying the aeration was investigated with 48 h of cultivation and a final bread concentration of 4.5%, as the fungus was shown to consume this concentration of bread over 48 h. The aeration was varied between 0.61, 1.0, and 1.42 vvm, resulting in a significant difference in the ethanol concentration (p = 0.048). The lowest rate caused poor mixing of the medium, high ethanol production (8.8 g/L), and difficulties in controlling the temperature because of hindered heat transfer. In contrast, at the highest aeration rate (1.42 vvm), a lower ethanol concentration (around 1.5 g/L) was observed, while at the 1.0 vvm aeration rate, 4.0 g/L of ethanol was produced. After 48 h, the cultivation with an aeration rate of 0.61 vvm resulted in a greater amount of visible unconsumed bread than the other aeration rates. The entrapment of the unconsumed bread with the 0.61 vvm aeration rate (which was collected together with the biomass during the sieving) resulted in a relatively high biomass concentration (Table 3). Lowering ethanol production by increasing aeration has been shown to be correlated with a higher biomass yield [29]; therefore, the ethanol concentration can be controlled with respect to the biomass yield by varying this factor depending on the type of product desired. However, increased aeration also entails consideration of economic aspects. Generally, in the cultivations without pH control, the pH was lowered from the initial value (5.5) during the cultivation and, after approximately 24 h, it was stabilized at a pH of 3–3.5.

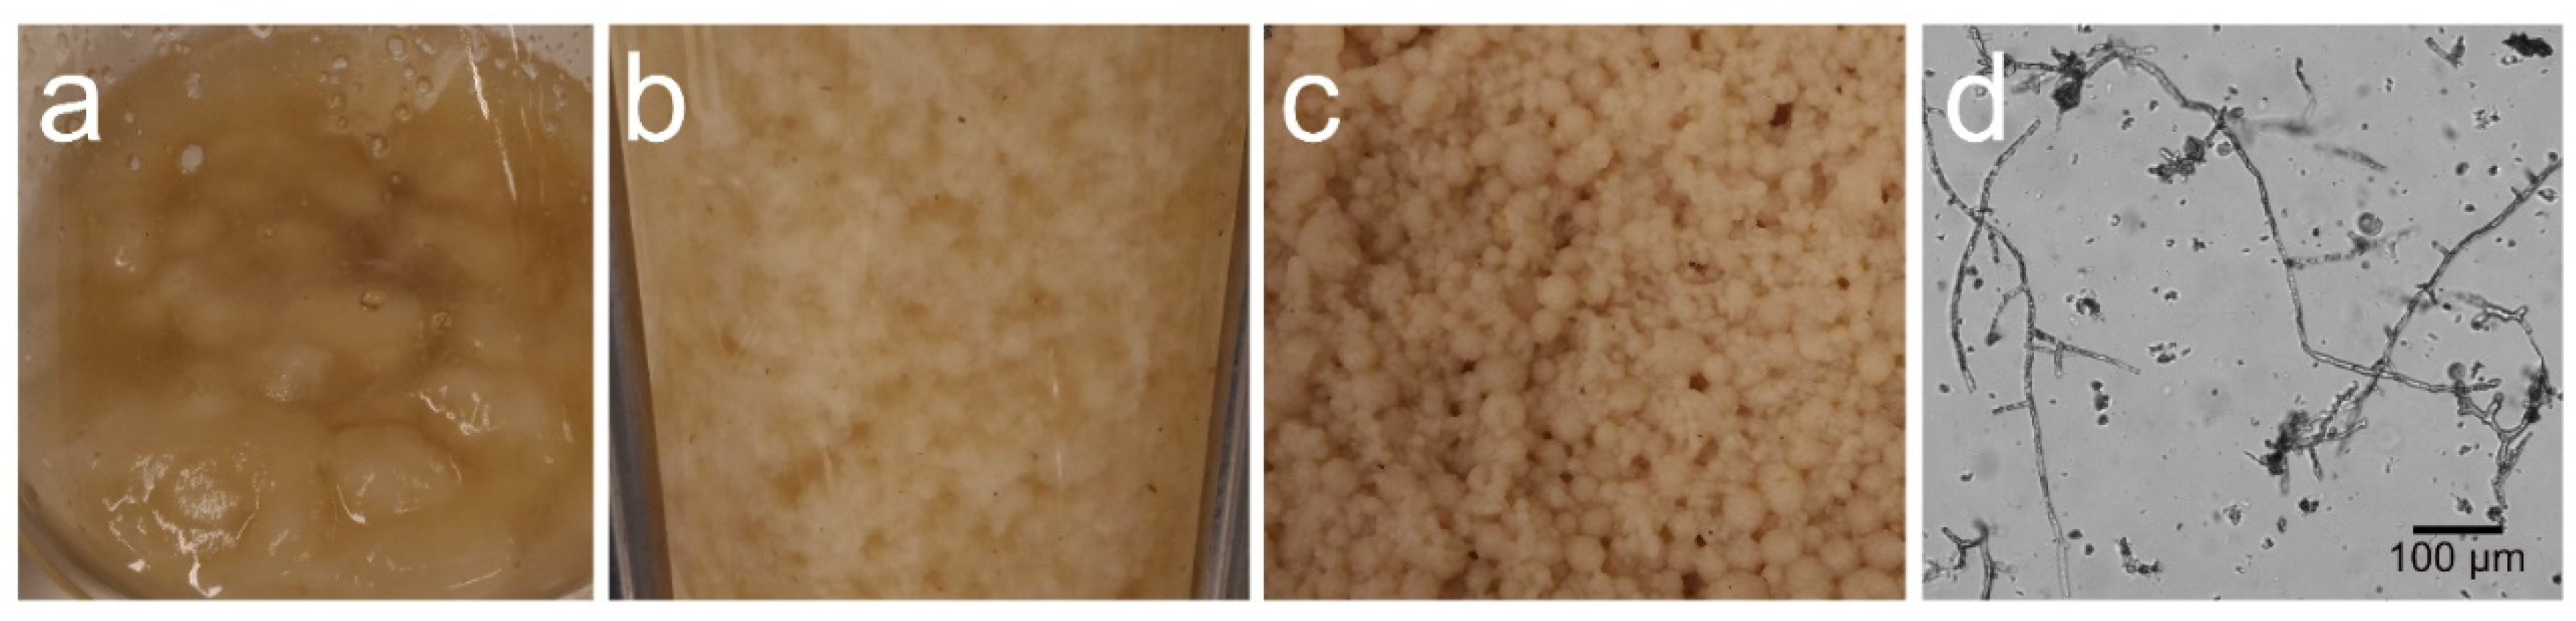
3.4. Fungal Biomass Production in a 26 L Bioreactor

Finally, the fungal cultivation was scaled up to a 26 L bioreactor. The conclusions from the first and second stages of the cultivation of Rhizopus delemar on bread waste were used to test three different conditions in a 26 L bioreactor (i.e., bread concentration, pH control, and mode of operation). The bubble column was chosen as the reactor design because of the poor mixing observed when using the airlift design in the 4.5 L bioreactors. The cultivations were initiated at a pH of 5.5; similarly to the previous cultivations, without any pH control, the pH was lowered to 3–3.5 after 24 h. The cultivation with a bread concentration of 7.5% resulted in a greater amount of visible unconsumed substrate compared to the runs with a 4.5% bread concentration. The use of the fed-batch approach with a 4.5% bread concentration did not affect the final biomass concentration (8.0 g/L) compared to the batch mode (7.9 g/L) (Table 4). The runs with 4.5% bread concentration were not conducted in duplicate. On the 4.5 L scale and with identical conditions, the fed-batch cultivation resulted in a biomass concentration in the same range (8.3 g/L). Similarly, the cultivation in the batch mode without pH control and using a 7.5% bread concentration and 1 vvm in the 4.5 L reactors resulted in 12.3 ± 2.5 g/L of biomass, which is comparable to the 11.73 ± 1.6 g/L of biomass obtained using the 26 L reactor.
The morphology of the fungal biomass grown in the 26 L bioreactor was that of spherical pellets; however, in the 4.5 L bioreactors, a dispersed mycelium growth was observed, and in the shake flasks, growth of clumps was observed (Figure 5). The formation of pellets could improve the mixing and oxygen supply compared to dispersed mycelium growth [30], and the larger volume and increased shear forces seemed to be beneficial for achieving pellet formation.
In a previous study, we reported an analysis of the cell wall of the fungal biomass produced using a 7.5% bread concentration during 48 h [23]; the cell wall was found to contain 36% glucosamine and 23% N-Acetyl glucosamine. Chitin and chitosan, the polysaccharides present in the cell wall, have valuable properties, such as biodegradability, non-toxicity, and biocompatibility; thus, they represent a promising resource for the development of renewable products, such as textiles [23]. The microfibers that constituted the cell wall of the fungal biomass can be seen in Figure 5d.

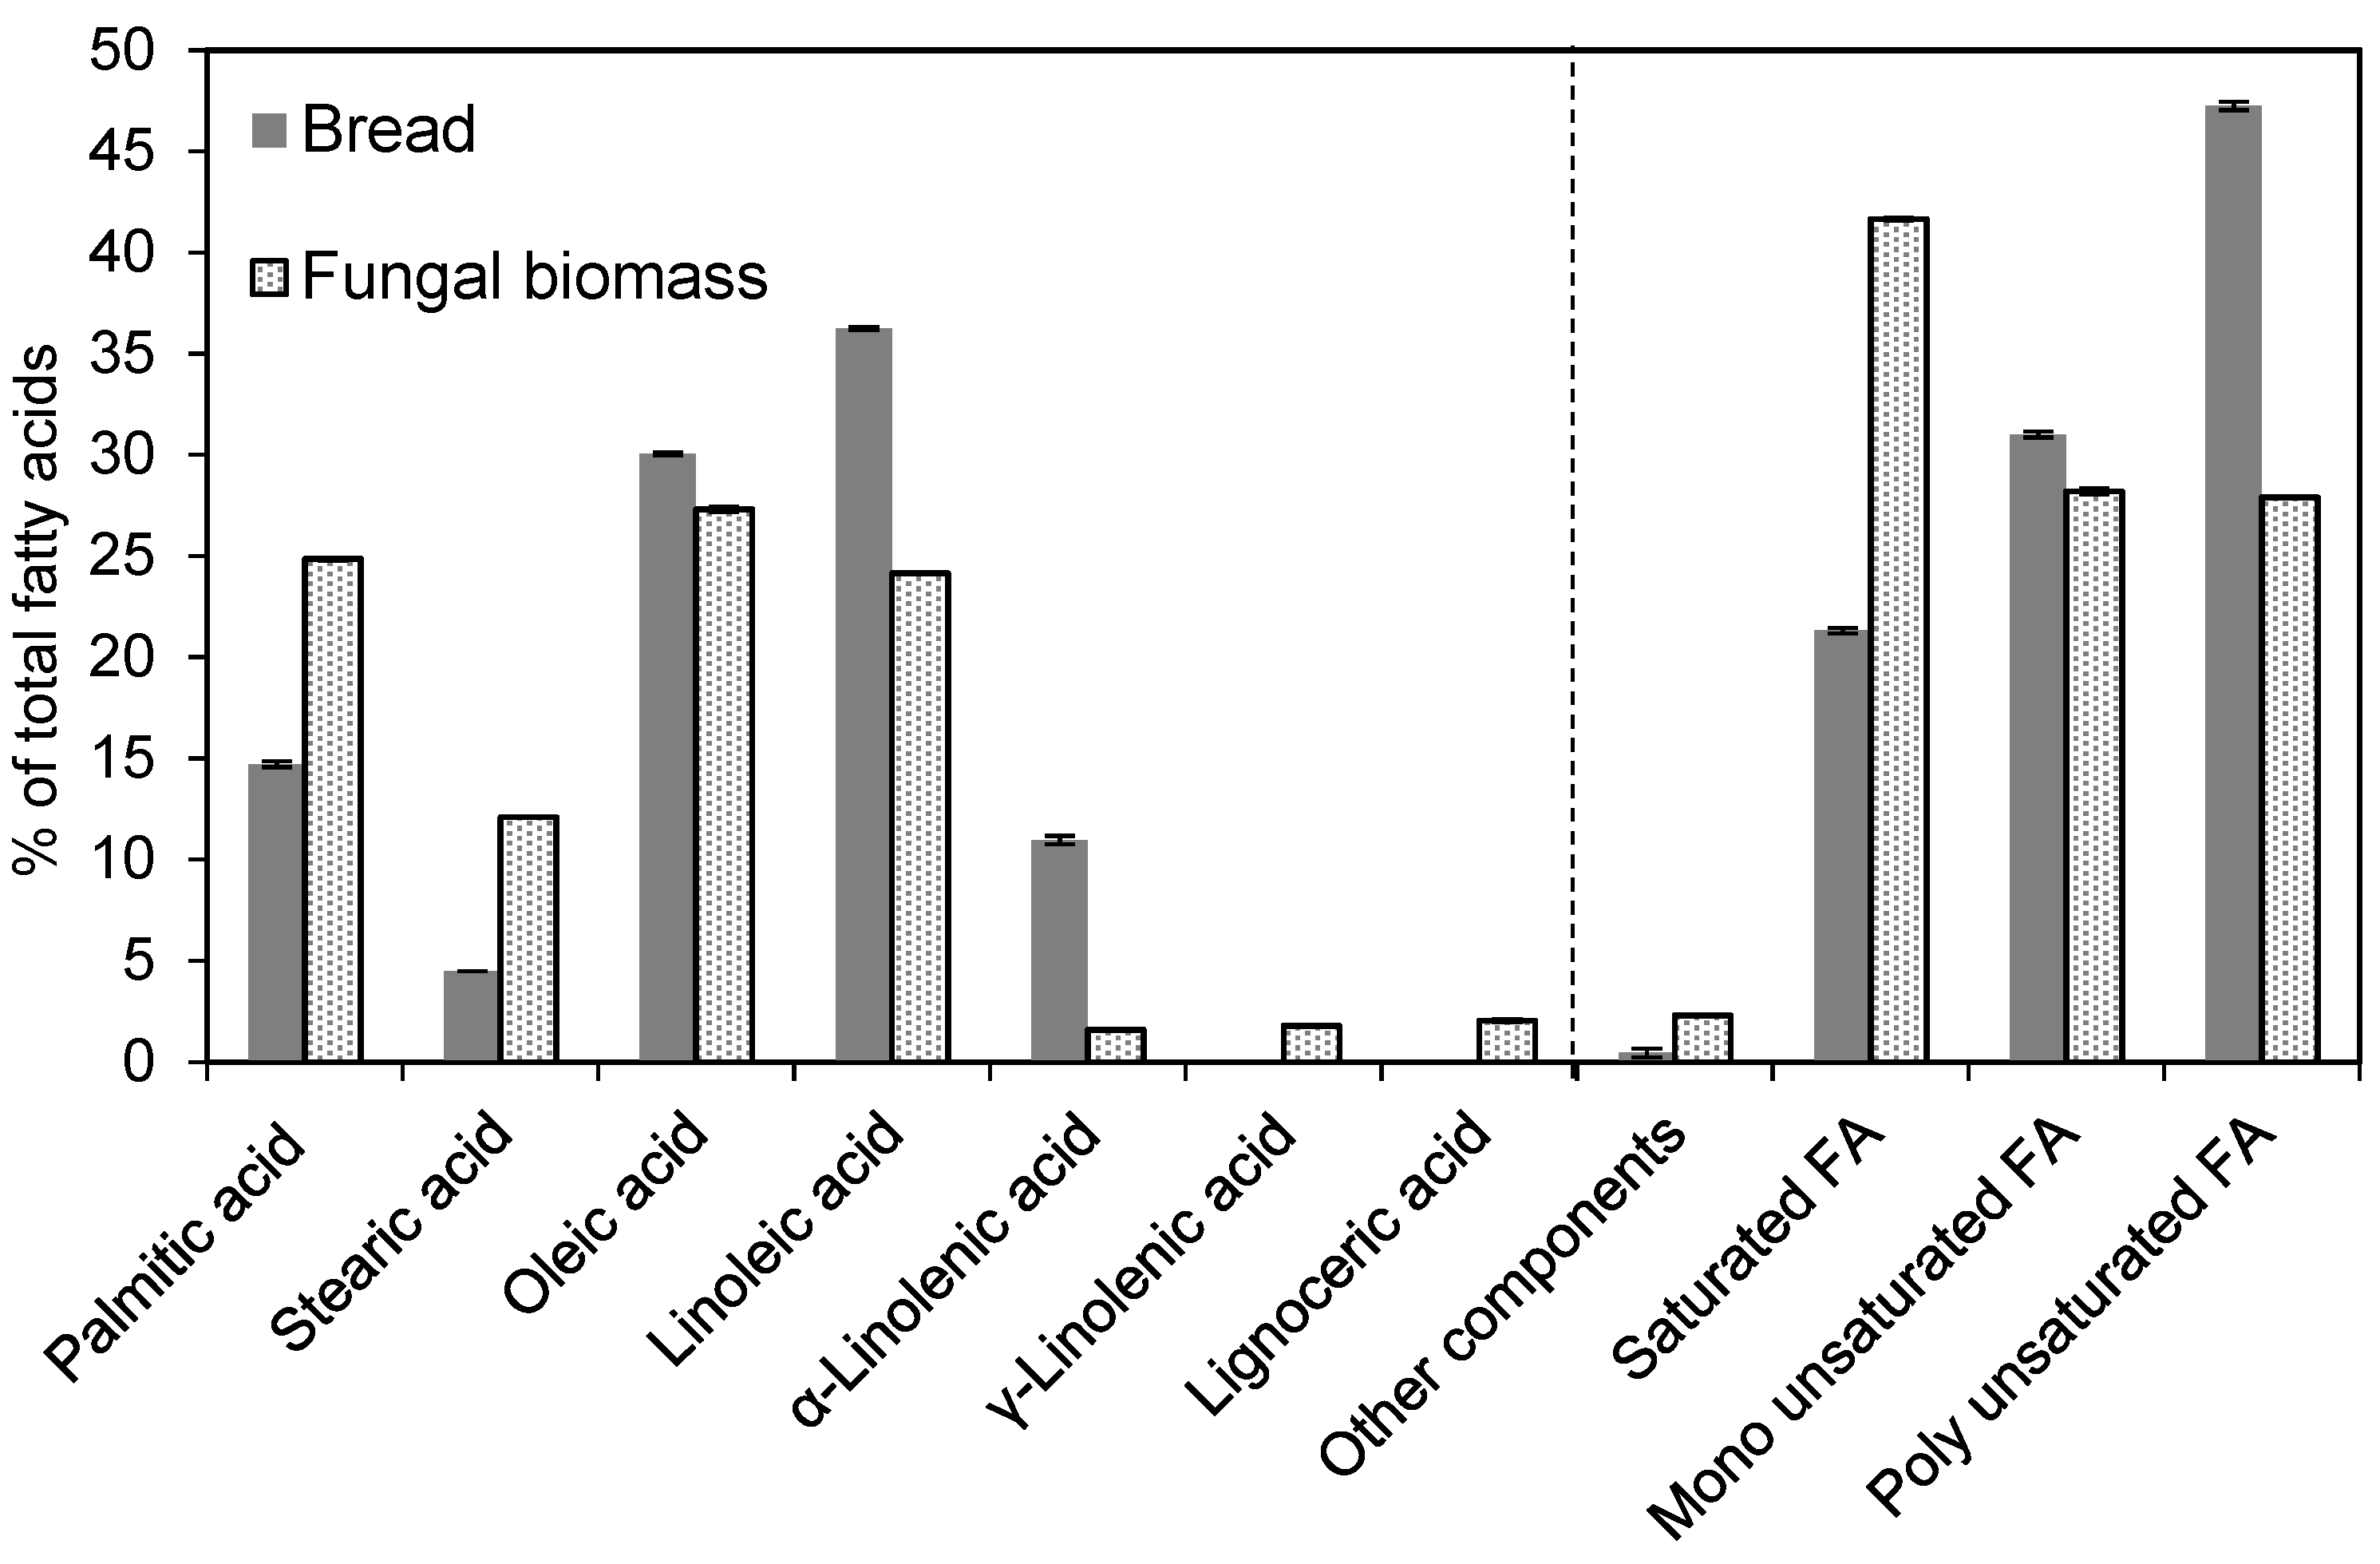
3.5. Nutritional Value of the Produced Biomass: Evaluating the Amino Acid and Fatty Acid Profiles

The biomass harvested from the cultivations at different scales was analyzed for its protein content, as shown in Table 5. The sample from the 26 L bioreactor was representative of all three runs. The protein content of the bread was 13%, which was increased to around 30% in the fungal biomass, indicating an increase in the nutritional value in terms of protein content. For the cultivations in the shake flasks that were conducted with different concentrations of bread, there was a slight increase in protein content with bread concentrations of 2.5% to 10%, followed by a slight decrease until a concentration of 15%. The decrease in the protein content of the fungus obtained with the 10–15% substrate concentration could be attributed to the increased entrapment of unconsumed bread in the harvested biomass, which resulted in a considerable fraction of bread and, consequently, a lower protein value.
The different aeration rates used for the cultivations in the 4.5 L bioreactors resulted in statistically different protein concentrations (p = 0.033). Higher aeration rates resulted in lower protein values; for the rate of 1.42 vvm, a protein concentration of 31.2% was achieved compared to 33% for 1.0 vvm and 35.8% for 0.61 vvm. The relation of the lowered protein value with the increased aeration rate has previously been reported for Rhizopus sp. [31].
From a nutritional perspective, for edible fungal biomass, the protein and fat contents need to be considered in order to evaluate the suitability of the biomass for human diets or as a product in feed applications. The mycoproteins present in the fungal biomass were analyzed for their content of essential amino acids, which are crucial for human nutrition; their inclusion is necessary for a balanced diet. The amino acid profile of the bread waste and the biomass produced in the final stage of cultivation in the 26 L bioreactor is shown in Figure 6. The values are given as the percentage of each amino acid compared with the total amino acids. The total protein content of the biomass per unit of dry weight and its fraction of essential amino acids were higher than the corresponding values for the bread.
A comparison was made between the bread and the biomass in order to show how the food waste was utilized to obtain a value-added product. The biomass included eight of the nine essential amino acids (tryptophan was not measured); increased values were obtained for all essential amino acids compared to the initial content in the bread waste (Figure 6).
The crude fat content of the bread (4.9%) increased to 15.9% when measured for the biomass. The fatty acid profiles of the fungal biomass and bread are shown in Figure 7; the major constituents of the biomass were oleic acid (omega-9, 27.3%), palmitic acid (24.9%), linolenic acid (24.2%), and stearic acid (12.1%). Minor amounts of lignoceric acid (2.1%), γ-linolenic acid (omega-6, 1.8%), and α-linolenic acid (omega-3, 1.6%) were also present.
A fungal mycelium from R. oryzae that was grown for 5 days on PDA plates was characterized by Oliveira et al. [32], and it showed the following fatty acid profile: oleic acid (33.6%), palmitic acid (29.3%), linoleic acid (14.6%), and stearic acid (8.3%), which resembles the fatty acid profile of R. delemar when grown on bread waste, except for some differences in the proportions of the fatty acids. Submerged fermentation of Rhizopus sp. grown on various substrates also yielded oleic acid, palmitic acid, linoleic acid, and stearic acid as the major fatty acids in the fungal biomass [33]. However, in the same study, it was also reported that the amounts of poly-unsaturated fatty acids differed depending on the substrate.
Fermentation of N. intermedia in a 26 L bubble column reactor [29] resulted in a fungal biomass with a fatty acid profile in which the three major lipids were linoleic acid (47.6%), palmitic acid (20.5%), and oleic acid (15.3%). The initial lipid content of the substrate was 7.7%, and the lipid content of the fungal biomass was 11.6%.
In this study, during the cultivation of R. delemar on bread waste, the fungus produced and stored lipids in the form of palmitic acid and stearic acid rather than linoleic acid and oleic acid (Figure 7). Therefore, the balance between poly-unsaturated acids and saturated fatty acids shifted from a majority of poly-unsaturated fatty acids in the substrate to a majority of saturated fatty acids in the resulting fungal biomass.

4. Conclusions

Using filamentous fungi for the valorization of food waste is a sustainable approach to lowering the environmental impacts of food waste and subsequently produce value-added products. R. delemar showed excellent growth ability on bread waste, and the fungus was able to consume 4.5% (w/v) bread concentration after 48 h of cultivation without the aid of supplemental nutrients or enzymes. The nutritional properties of the fungal biomass included a proportion of crude protein of around 30%, which contained nearly all essential amino acids, while the lipid content constituted around 16% of the fungal biomass. Additionally, the fungal biomass was suggested as a source of microfibers. This study demonstrated the viability of the cultivation of R. delemar by using solely bread waste as a substrate. The process was successfully scaled up from shake flasks to 4.5 L bioreactors and, finally, to the pilot scale with a 26 L bioreactor.

Author Contributions

Conceptualization, J.A.F. and A.Z.; investigation, S.E.S., L.B., J.A.F., and P.F.S.F.; methodology, L.B., J.A.F., and A.Z.; supervision, J.A.F., M.J.T., and A.Z.; visualization, S.E.S. and L.B.; writing—original draft, S.E.S.; writing—review and editing, L.B., J.A.F., P.F.S.F., M.J.T., and A.Z. All authors have read and agreed to the published version of the manuscript.

Funding

This research was funded by Vinnova, Sweden, reference number: 2018-04093, and by Åforsk, Sweden, reference number: 18-449.

Conflicts of Interest

The authors declare no conflict of interest.

References

  1. European Commission. Food Waste. Available online: https://ec.europa.eu/food/safety/food_waste_en (accessed on 28 February 2021).
  2. Brancoli, P.; Rousta, K.; Bolton, K. Life cycle assessment of supermarket food waste. Resour. Conserv. Recycl. 2017, 118, 39–46. [Google Scholar] [CrossRef]
  3. Souza Filho, P. Fungi-based biorefinery model for food industry waste: A progress towards circular economy. In Skrifter Från Högskolan i Borås; Högskolan i Borås: Borås, Sweden, 2018. [Google Scholar]
  4. Wiebe, M.G. Myco-protein from Fusarium venenatum: A well-established product for human consumption. Appl. Microbiol. Biotechnol. 2002, 58, 421–427. [Google Scholar] [CrossRef] [PubMed]
  5. Wiebe, M.G. QuornTM Myco-protein—Overview of a successful fungal product. Mycologist 1999, 18, 17–20. [Google Scholar] [CrossRef]
  6. Hosseini, S.M.; Khosravi-Darani, K.; Mohammadifar, M.A.; Nikoopour, H. Production of Mycoprotein by Fusarium venenatum Growth on Modified Vogel Medium. Asian J. Chem. 2009, 21, 4017–4022. [Google Scholar]
  7. Denny, A.; Aisbitt, B.; Lunn, J. Mycoprotein and health. Nutr. Bull. 2008, 33, 298–310. [Google Scholar] [CrossRef]
  8. Dunlop, M.V.; Kilroe, S.P.; Bowtell, J.L.; Finnigan, T.J.A.; Salmon, D.L.; Wall, B.T. Mycoprotein represents a bioavailable and insulinotropic non-animal-derived dietary protein source: A dose–response study. Br. J. Nutr. 2017, 118, 673–685. [Google Scholar] [CrossRef] [PubMed]
  9. Finnigan, T.J.A. 13—Mycoprotein: Origins, production and properties. In Handbook of Food Proteins; Williams, P.A., Ed.; Woodhead Publishing: Cambridge, UK, 2011; pp. 335–352. [Google Scholar]
  10. Filho, P.F.S.; Nair, R.B.; Andersson, D.; Lennartsson, P.R.; Taherzadeh, M.J. Vegan-mycoprotein concentrate from pea-processing industry byproduct using edible filamentous fungi. Fungal Biol. Biotechnol. 2018, 5, 1–10. [Google Scholar] [CrossRef]
  11. Troiano, D.; Orsat, V.; Dumont, M. Status of filamentous fungi in integrated biorefineries. Renew. Sustain. Energy Rev. 2020, 117, 109472. [Google Scholar] [CrossRef]
  12. Benabda, O.; Kasmi, M.; Kachouri, F.; Hamdi, M. Valorization of the powdered bread waste hydrolysate as growth medium for baker yeast. Food Bioprod. Process. 2018, 109, 1–8. [Google Scholar] [CrossRef]
  13. Kawa-Rygielska, J.; Pietrzak, W.; Czubaszek, A. Characterization of fermentation of waste wheat-rye bread mashes with the addition of complex enzymatic preparations. Biomass Bioenergy 2012, 44, 17–22. [Google Scholar] [CrossRef]
  14. Srichuwong, S.; Fujiwara, M.; Wang, X.; Seyama, T.; Shiroma, R.; Arakane, M.; Mukojima, N.; Tokuyasu, K. Simultaneous saccharification and fermentation (SSF) of very high gravity (VHG) potato mash for the production of ethanol. Biomass Bioenergy 2009, 33, 890–898. [Google Scholar] [CrossRef]
  15. Kłosowski, G.; Mikulski, D.; Czupryński, B.; Kotarska, K. Characterisation of fermentation of high-gravity maize mashes with the application of pullulanase, proteolytic enzymes and enzymes degrading non-starch polysaccharides. J. Biosci. Bioeng. 2010, 109, 466–471. [Google Scholar] [CrossRef]
  16. Kumar, J.V.; Mathew, R.; Shahbazi, A. Bioconversion of solid food wastes to ethanol. Analyst 1998, 123, 497–502. [Google Scholar] [CrossRef]
  17. Lennartsson, P.; Taherzadeh, M.; Edebo, L. Rhizopus. In Encyclopedia of Food Microbiology; Elsevier: Amsterdam, The Netherlands, 2014; pp. 284–290. [Google Scholar]
  18. Ferreira, J.A.; Lennartsson, P.R.; Edebo, L.; Taherzadeh, M.J. Zygomycetes-based biorefinery: Present status and future prospects. Bioresour. Technol. 2013, 135, 523–532. [Google Scholar] [CrossRef] [PubMed] [Green Version]
  19. Ebrahimi, F.; Khanahmadi, M.; Roodpeyma, S.; Taherzadeh, M. Ethanol production from bread residues. Biomass Bioenergy 2008, 32, 333–337. [Google Scholar] [CrossRef]
  20. Melikoglu, M.; Webb, C. 4—Use of Waste Bread to Produce Fermentation Products. In Food Industry Wastes: Assessment and Recuperation of Commodities; Kosseva, M.R., Webb, C., Eds.; Elsevier Science & Technology: San Diego, CA, USA, 2013; pp. 63–76. [Google Scholar]
  21. Melikoglu, M.; Lin, C.S.K.; Webb, C. Stepwise optimisation of enzyme production in solid state fermentation of waste bread pieces. Food Bioprod. Process. 2013, 91, 638–646. [Google Scholar] [CrossRef]
  22. Gmoser, R.; Sintca, C.; Taherzadeh, M.J.; Lennartsson, P.R. Combining submerged and solid state fermentation to convert waste bread into protein and pigment using the edible filamentous fungus N. intermedia. Waste Manag. 2019, 97, 63–70. [Google Scholar] [CrossRef]
  23. Svensson, S.E.; Ferreira, J.A.; Hakkarainen, M.; Adolfsson, K.H.; Zamani, A. Fungal textiles: Wet spinning of fungal microfibers to produce monofilament yarns. Sustain. Mater. Technol. 2021, 28, e00256. [Google Scholar] [CrossRef]
  24. Wikandari, R.; Millati, R.; Lennartsson, P.R.; Harmayani, E.; Taherzadeh, M.J. Isolation and Characterization of Zygomycetes Fungi from Tempe for Ethanol Production and Biomass Applications. Appl. Biochem. Biotechnol. 2012, 167, 1501–1512. [Google Scholar] [CrossRef]
  25. Mariotti, F.; Tomé, D.; Mirand, P.P. Converting Nitrogen into Protein—Beyond 6.25 and Jones’ Factors. Crit. Rev. Food Sci. Nutr. 2008, 48, 177–184. [Google Scholar] [CrossRef]
  26. Swedish Institute for Standards. Animal Feeding Stuffs—Determination of Amino Acids Content (ISO 13903:2005); Swedish Standards Institute: Stockholm, Sweden, 2005. [Google Scholar]
  27. Hames, B.; Scarlata, C.; Sluiter, A. Determination of Protein Content in Biomass; National Renewable Energy Laboratory: Golden, CO, USA, 2008; pp. 1–5. [Google Scholar]
  28. Filho, P.F.S.; Zamani, A.; Taherzadeh, M.J. Edible Protein Production by Filamentous Fungi using Starch Plant Wastewater. Waste Biomass Valorization 2018, 10, 2487–2496. [Google Scholar] [CrossRef] [Green Version]
  29. Ferreira, J.A.; Lennartsson, P.R.; Taherzadeh, M.J. Production of ethanol and biomass from thin stillage byNeurospora intermedia: A pilot study for process diversification. Eng. Life Sci. 2015, 15, 751–759. [Google Scholar] [CrossRef] [Green Version]
  30. Papagianni, M. Fungal morphology and metabolite production in submerged mycelial processes. Biotechnol. Adv. 2004, 22, 189–259. [Google Scholar] [CrossRef]
  31. Ferreira, J. Spent sulphite liquor for cultivation of an edible Rhizopus sp. Bioresources 2012, 7, 173–188. [Google Scholar]
  32. Oliveira, M.D.S.; Feddern, V.; Kupski, L.; Cipolatti, E.; Badiale-Furlong, E.; de Souza-Soares, L.A. Changes in lipid, fatty acids and phospholipids composition of whole rice bran after solid-state fungal fermentation. Bioresour. Technol. 2011, 102, 8335–8338. [Google Scholar] [CrossRef] [PubMed] [Green Version]
  33. Ibarruri, J.; Hernández, I. Valorization of cheese whey and orange molasses for fungal biomass production by submerged fermentation with Rhizopus sp. Bioprocess Biosyst. Eng. 2019, 42, 1285–1300. [Google Scholar] [CrossRef] [PubMed]
Figure 1. General diagram of the airlift and bubble column configurations and images of the 4.5 and 26 L bioreactors.
Fermentation 07 00091 g001
Figure 2. Biomass concentrations for cultivation in shake flasks under the batch, fed-batch, and varied initial pH conditions. The sterilization mode of the substrate (final concentration of 7.5%) under the fed-batch condition is indicated with NS: no sterilization, AU: sterilization in an autoclave, and UV: sterilization with UV.
Fermentation 07 00091 g002
Figure 3. Profiles of (a) glucose and (b) ethanol at different concentrations of the substrate in the shake flask experiments. The standard deviations for glucose and ethanol were 0.0–1.8% and 0.0–3.8%, respectively.
Fermentation 07 00091 g003
Figure 4. (a) The glucose and ethanol profiles are shown for different initial pH values with the 7.5% substrate concentration. (b) The glucose and ethanol profiles are shown for different sterilization methods with the added substrate under fed-batch conditions. The standard deviations for glucose and ethanol were 0.0–1.2% and 0.0–2.0%, respectively.
Fermentation 07 00091 g004
Figure 5. Photos of the morphology of the biomass in the (a) shake flasks, (b) 4.5 L bioreactor, and (c) 26 L bioreactor. (d) Picture of the biomass from the 26 L reactor captured with the oCelloscope to show the fungal microfibers.
Fermentation 07 00091 g005
Figure 6. Contents of amino acids in the substrate (bread) and final biomass obtained through cultivation in the 26 L bioreactor. The error bars represent ± one standard deviation. Asterisks (*) indicate essential amino acids.
Fermentation 07 00091 g006
Figure 7. Fatty acid profiles. FA stands for fatty acid. Fatty acids with concentrations of <1% were omitted. The error bars represent ± one standard deviation.
Fermentation 07 00091 g007
Table 1. Summary of the cultivation conditions.
Operation ModeConfigurationSubstrate Concentration (%)Aeration (vvm *)Time (h)
Shake flasks (200 mL working volume)
Batch 2.5, 5.0, 7.5, 10.0, 12.5, 15.0n/a48, 72, 96
Fed-batch 7.5 a 72
Bioreactor (3.5 L working volume)
Fed-batchAirlift7.5 a172
Bubble column7.5 a172
Bubble column pH control7.5 b172
Bubble column pH control4.5 c1.0, 1.42, 0.6148
Bioreactor (20 L working volume)
BatchBubble column7.51.048
BatchBubble column pH control4.51.4248
Fed-batchBubble column pH control4.5 c1.4248
a A 1.5% initial concentration and a 1.5% concentration of autoclaved bread was added at 24, 32, 48, and 56 h. b A 1.5% initial concentration and a 3.0% concentration of autoclaved bread was added at 24 and 48 h. c A 1.5% initial concentration and a 3.0% concentration of autoclaved bread was added at 24 h. * volume of air per volume of liquid per minute n/a: not applicable.
Table 2. Composition of the substrate.
Componentg/100 g Dry Bread
Starch52.5 ± 3.5
Ash2.4 ± 0.01
Total Kjeldahl nitrogen2.3 ± 0.02
Protein a12.8 ± 0.1
Protein b13.4 ± 0.1
Crude fat4.9 ± 0.1
a Calculated from the Kjeldahl nitrogen value using a 5.49 conversion factor. b Calculated from the nitrogen value obtained with the Dumas method using a 6.25 conversion factor.
Table 3. Biomass and ethanol concentrations for the fed-batch cultivations in 4.5 L reactors. The values presented are the final concentrations of the biomass and ethanol at 72 or 48 h.
Reactor DesignpH ControlAeration Rate (vvm)Cultivation Time (h)Biomass Concentration (g/L)Ethanol Concentration (g/L)
Airliftno1.072 a12.4 ± 2.88.1 ± 2.5
Bubble columnno1.072 a12.3 ± 2.58.6 ± 0.6
yes1.072 a10.9 ± 0.18.8 ± 3.5
yes0.6148 b7.9 ± 0.18.8 ± 5.3
yes1.048 b7.2 ± 0.44.0 ± 1.4
yes1.4248 b8.3 ± 0.51.5 ± 1.9
a Final bread concentration of 7.5%. b Final bread concentration of 4.5%.
Table 4. Biomass concentrations after 48 h of cultivation in the 26 L bioreactor.
Bread Concentration (%)ModeAeration (vvm)Biomass Concentration
(g/L)
7.5Batch, without pH control1.011.73 ± 1.6
4.5Batch, with pH control1.427.9
4.5Fed-batch, with pH control1.428.0
Table 5. Protein content of the harvested biomass.
Cultivation ScaleBread Concentration (%)Aeration Rate (vvm)Protein (%)
Shake flasks2.5 27.4 a ± 1.8
5 29.6 b ± 0.3
7.5n/a32.3 b ± 1.0
10 32.0 b ± 0.6
12.5 31.3 b ± 1.0
15 30.0 b ± 1.4
4.5 L bioreactor4.50.6135.8 b ± 1.8
4.51.033.0 b ± 1.4
4.51.4231.2 b ± 2.1
26 L bioreactor4.5–7.51.0–1.4230.7 b ± 0.3
a Kjeldahl method. b Dumas method. n/a: not applicable.
Publisher’s Note: MDPI stays neutral with regard to jurisdictional claims in published maps and institutional affiliations.

