Article

Incorporation of Fermented Brewers Spent Grain in the Production of Sourdough Bread

1
Department of Food Technology and Innovation, Harper Adams University, Edgmond TF10 8NB, UK
2
Department of Food Innovation, HAS University of Applied Science, 5223 DE Den Bosch, The Netherlands
3
State Key Laboratory of Chemical Resource Engineering, Beijing University of Chemical Technology, Beijing 100029, China
*
Author to whom correspondence should be addressed.
Submission received: 5 May 2021 / Revised: 9 June 2021 / Accepted: 9 June 2021 / Published: 10 June 2021
(This article belongs to the Special Issue Innovations in Sourdough Bread Making)

Abstract

:
The utilisation of food production by-products back into food production within a circular food economy is one of the driving examples to improve sustainability within the food industry. Brewers spent grain is the most abundant by-product from the brewing industry, with currently most of it being used as animal feed. In this study, we utilised brewers spent grain as a substrate in a solid-state fermentation in order to produce a Type-3 sourdough culture. Sourdough bread is becoming increasingly popular throughout the western world. The use of fermented brewers spent grain in the production of sourdough bread yielded sourdough bread that was acceptable by consumers. We also investigated the production and presence of the main organic acids in sourdough during the proofing process and the baking process. The baking trials showed that there was a reduction in both lactic and acetic acid content during the actual baking process. The reduction in the concentration of both organic acids appears to be at the heart of the observation that for both organic acids, there is typically a lower concentration in the crust compared to the crumb of the sourdough breads, which was observed in our sourdough breads and those commercially available.

1. Introduction

The brewing industry in the United Kingdom (UK) produces approximately 0.5 million tons of brewers spent grains (BSG) annually as a by-product of beer production, which equates to 85% of the produced by-products [1,2]. For brewers, utilising or disposing of BSG is a serious challenge and is driven mainly by environmental and business pressures [3], but also by challenging distribution channels and lack of disposal outlets [4,5,6]. Larger breweries often sell it for animal feed at low costs [7,8], whereas smaller breweries often have a wider range of outlets e.g., research, animal feed, bakeries, etc., depending on location and demand [9].
Globally, there is a drive to reduce food waste whilst retaining profits in today’s food and drinks industry; thus, utilising products (including by-products) as much as possible is key to a 360° sustainable industry [10]. In recent years, much research has focused on the applications of BSG into products, for example bread, cookies, and snacks [11,12], as a way to utilise the by-product in a circular economy whilst gaining an economic benefit and also potentially increasing the nutrition content of the products [13]. For bread products, sourdough containing BSG is a recent phenomenon [14,15,16,17,18], marked by the aim of incorporating BSG to add flavour, support the bread-making process, and increase palatability of the grains. Furthermore, BSG is also a source of various nutrients, including minerals, antioxidants, proteins, and fibre [3,13,16,18,19], in excess of their presence in bread-making flour [13,19] resulting in a nutritional fortification. BSG incorporation in bread is recommended to be 10% for most products [4,13,20], to ensure a consistent quality and retain product acceptability.
Sourdough is becoming increasingly popular throughout the UK [21], while previously struggling to gain popularity in some European countries [14]. Sourdoughs are typified by a co-fermentation of a bread dough with both yeast and lactobacilli [17,22]. While the yeast retains the role as the principal leavening agent, and the lactic acid bacteria are responsible for the sour-related flavour production [23], the characteristics of sourdough go beyond the principal roles that we can associate with the various components of the sourdough microflora [24]. It has been very clearly established that both the yeast and the lactic acid bacteria interact in a sourdough environment in a mutually beneficial cooperation [23,24]. Typical sourdough contains no or fewer additives and/or preservatives than normal bread [17,22], giving it an “all-natural” perspective [25] that appears to be driving the surge in popularity. Depending upon the production method, sourdoughs are often categorised into three main types: Type 1, a slow traditional process, using a previous ferment to restart fermentation; Type 2, a more industrial process, usually in a liquid format, added to start the fermentation more quickly compared to Type 1; and Type 3, a high-throughput industrial process, usually in a dried form containing a previously fermented product, imparting sourdough characteristics [23,26].
In this study we investigated the possibility of creating a “Type 3” style of sourdough starter utilising sourdough starter cultures grown on BSG through solid-state fermentation (SSF), and of incorporating that into the sourdough production system.

2. Material and Methods

2.1. Bread Related Materials

Brewers spent grain (BSG) was obtained from Rowton Brewery in Shropshire, UK, following the production of a “Hands Free Hectare” Golden Ale (abv 4.2%). Baking ingredients were obtained from local suppliers as follows: strong baking flour (Carr’s, Kirkcaldy, UK), Fermipan dried yeast (LeSaffre, Worcester, UK), and Mad Millie sourdough culture (Ellesmere Port, UK).

2.1.1. Solid State Fermentation and Processing of Brewers Spent Grain

The BSG was autoclaved (121 °C for 30 min) within 12 h of the end of the mashing step in the production of the “Hands Free Hectare” Golden Ale beer. Ten kg of autoclaved BSG was thoroughly mixed with 40 g of dried Mad Millie sourdough culture and incubated for 96 h at 30 °C in a climate control chamber (Binder, model MK240, Tuttlingen, Germany).
Following the completion of the SSF, the fermented BSG (FBSG) was dried in a fan-forced oven (Rational, model SCC101E, Luton, UK) at 60 °C for 6 h, by which time the moisture content was reduced to <2% and the bacterial cultures retained a high level of viability. The dried FBSG was ground using a Robot Coupe R101 blender to reduce the particle size, and only the fractions that could pass through a 500 μm sieve were used in the baking experiments.

2.1.2. Bread Making

The basic formula for the production of bread was as follows: strong bread making flour (3 kg), water (65% of flour weight), salt (2% of flour weight) and dried yeast (1% of flour weight). In experiments where FBSG was added, the FBSG was expressed as a percentage of the flour plus FBSG weight. A control sourdough bread was produced, without the addition of FBSG, but with the addition of Mad Millie sourdough culture according the manufacturer’s specifications. All breads were made according to the AACC 10-10.03 method as described by Upadhyay et al. [27], but with an additional moulding step to ensure a finer crumb. The dough was mixed in a Fimar 22lt single-speed Spiral Mixer (Luxia, Bolton, UK) and kneaded for 8–10 min until dough formed and an elastic window was observed. The dough temperature at the end of kneading was between 22 and 24 °C. Once formed, dough was rested for 30 min before dividing into 200 g dough pieces and rested for a further 20 min, after which the dough was knocked back and rested again for another 30 min. A final mould was facilitated to create small baguette shapes, which were given a final proof at 35 °C at 95% RH. Following the processing of the dough into baguette shapes, the fully proved dough was baked into bread in a compacta two-deck oven (Tom Chandley, Manchester, UK) at 230 °C. The breads were cooled rapidly within 1 h and packed in plastic bags ready for a range of quality and sensory tests and HPLC analysis.

2.1.3. Sourcing of Commercially Available Sourdough Breads

In order to assess whether the sourdough breads produced in this study contained the typical fermentation products associated with sourdough breads, we carried out a series of organic acid analyses, focusing on lactic acid and acetic acid. We sourced 33 commercially available sourdough breads; 13 of the sourdough breads were obtained from a range of large supermarkets, while 19 sourdough loaves were sourced from artisan bakehouses from throughout the UK. In one instance a sourdough bread from a supermarket was produced by an artisan bakehouse and was excluded from our analyses to avoid confusion.

2.2. Analysis

2.2.1. Quality and Sensorial Analysis

Texture analysis (TA) of the bread samples was conducted using a Stable Microsystems TA.HD.plus Texture Analyser (Godalming, UK). A hardness compression reading was obtained by measuring compression force, which determines firmness of sample. A P/20 mm cylinder probe and 30 kg load cell were used for testing purposes. Test speed was 1.0 mm/s for 15 s with a distance of 8 mm; each test was repeated 5 times.
Colour of bread samples was measured using a Minolta-CR-400 Chroma Meter (Konica, Warrington, UK). Samples were placed on a white tile each time to ensure the background was consistent and the L * a * b * readings were recorded [28]. Measurements were taken on the day of baking, and each day after until day 5, with 5 replications daily for crumb colour.
Cross-sections of the breads produced were scanned on an HP ENVY 4500 Series printer/scanner to 1200 dpi using two A4 squared grids: one 5 mm × 5 mm squared grid to determine height, width, and area of rolls, and the second 10 mm × 10 mm squared grid to document and evidence crumb structure of rolls.
The sensory evaluation was carried out using untrained consumer panels. For each sensory panel, panellists used descriptive analysis to assess the bread for texture (spring and hardness), colour, crumb structure (as expected for sourdough bread), bite (ease of biting and pulling to remove a morsel), odour (reminiscent of sourdough bread), taste (as expected for sourdough bread), and overall acceptability using a 7-point hedonic scale from “extremely dislike/disagree” to “extremely like/agree” [29]. Samples were coded with a random 3-digit number to avoid bias [30] and water was freely available during the sensory sessions. Where appropriate, a triangle test was incorporated to determine whether consumers could tell a difference between 2 samples that were not visibly different (difference test), and was in accordance with ISO 2004c standards [30,31]. Consumer panels were conducted 3 to 6 h following baking except for one batch of bread where the sensory panel was repeated 3 days following the baking to assess the influence of the FBSG on staling. Consumers were recruited from the local area with the only stipulation that they “liked” sourdough bread and had no gluten intolerance. The number of consumers in the various trials varied between 15 and 42.

2.2.2. Microbial Analysis

The viability of bacterial cultures following SSF was monitored on MRS agar (Oxoid) following appropriate serial dilutions in peptone water. The plates were incubated at 30 °C for 3 days. All microbial analyses were carried out in triplicate.

2.2.3. Organic Acid Analysis

All organic acids were analysed on an Agilent 1100 series HPLC fitted with a refractive index detector, using a Rezex organic acid column (30 cm × 4.6 mm) maintained at 50 °C, using an aqueous mobile phase containing 0.5 mM H2SO4 at a flow rate of 1 mL/min.
Solid samples were prepared by taking 10 g of sample (wet weight) and placed in a stomacher bag containing 40 mL of HPLC mobile phase. The samples were stomachered in a Stomacher® 400 (Camlab, Seward, Worthing, UK) for 1 min at high speed, and a proportion of the extraction liquid centrifuged at high speed for 10 min (Sigma Microfuge v. 1-14, Osterode am Harz, Germany). All centrifuged samples were passed through a filtered syringe (0.2 µm) prior to analysis.

2.2.4. Statistical Analysis

IBM SPSS Statistics 25 and Microsoft Excel 2019 were utilised for statistical analysis. Statistical tests applied to the data were limited; however, they included Student’s t-tests (p < 0.05) and Pearson’s R and R2 correlations (including p < 0.05).

3. Results and Discussion

3.1. Bacterial Solid-State Fermentation of Brewers Spent Grain

At the completion of the solid-state fermentation of the BSG, the microbial count of the FBSG was approximately 2 × 10⁹ CFU/g (wb) and contained 53.56 and 22.67 mmol/kg lactic acid and acetic acid, respectively (Table 1). Immediately following the completion of the SSF, the FBSG was dried at 60 °C to aid in the preservation of the fermented spent grain while at the same time retaining a viable sourdough culture on the dried grains. The dried grains were ground in order to make it easier to incorporate the FBSG into a dough and improve the palatability of the subsequent sourdough breads.
The viability of the bacterial culture in the dried FBSG was 2 × 10⁸ CFU/g, which gradually declined to 8 × 10⁵ CFU/g over the first 5 weeks under ambient conditions, after which the viability remained steady for at least another 5 weeks (Figure 1).

3.2. Sourdough Production with Fermented Brewers Spent Grain

3.2.1. Rate of FBSG Incorporation for the Production of Sourdough

Dried FBSG was incorporated into the bread formulation ranging from 0% to 20% based on the combined flour plus FBSG weight. We found that over the entire range of rates of addition, the cross-sectional area of the baked loaves decreased (Figure 2A) compared to the control (0% FBSG), with an R value of −0.728 (p = 0.007). Our results agree with those reported elsewhere [13,18,32]; however, the cross-sectional area increased somewhat at an FBSG addition of 5%, which agrees with the observation by Waters et al. [13]. Whereas the reduction in the cross-sectional area of the bread is likely to be due to the physical disruption the BSG fibres impose on the gluten matrix [33,34,35], the slight increase in the cross-sectional area at the lower inclusion of BSG might be due to the nutritional enrichment of the dough in the form of readily fermentable sugars, which could promote yeast activity [36], but outweighs the disruptive influence of the BSG fibres. The colour of the sourdough bread crumb changed and became darker with the addition of FBSG, which is represented by a decrease in the L * values and a concurrent increase in both the a * and b * values (Figure 2B). The increase in darkness (decrease in L *) in our application of FBSG agrees with the findings of Brochetti et al. [37] and Ktenioudaki et al. [20], who reported that the crumb colour became darker as the level of spent grain increased.
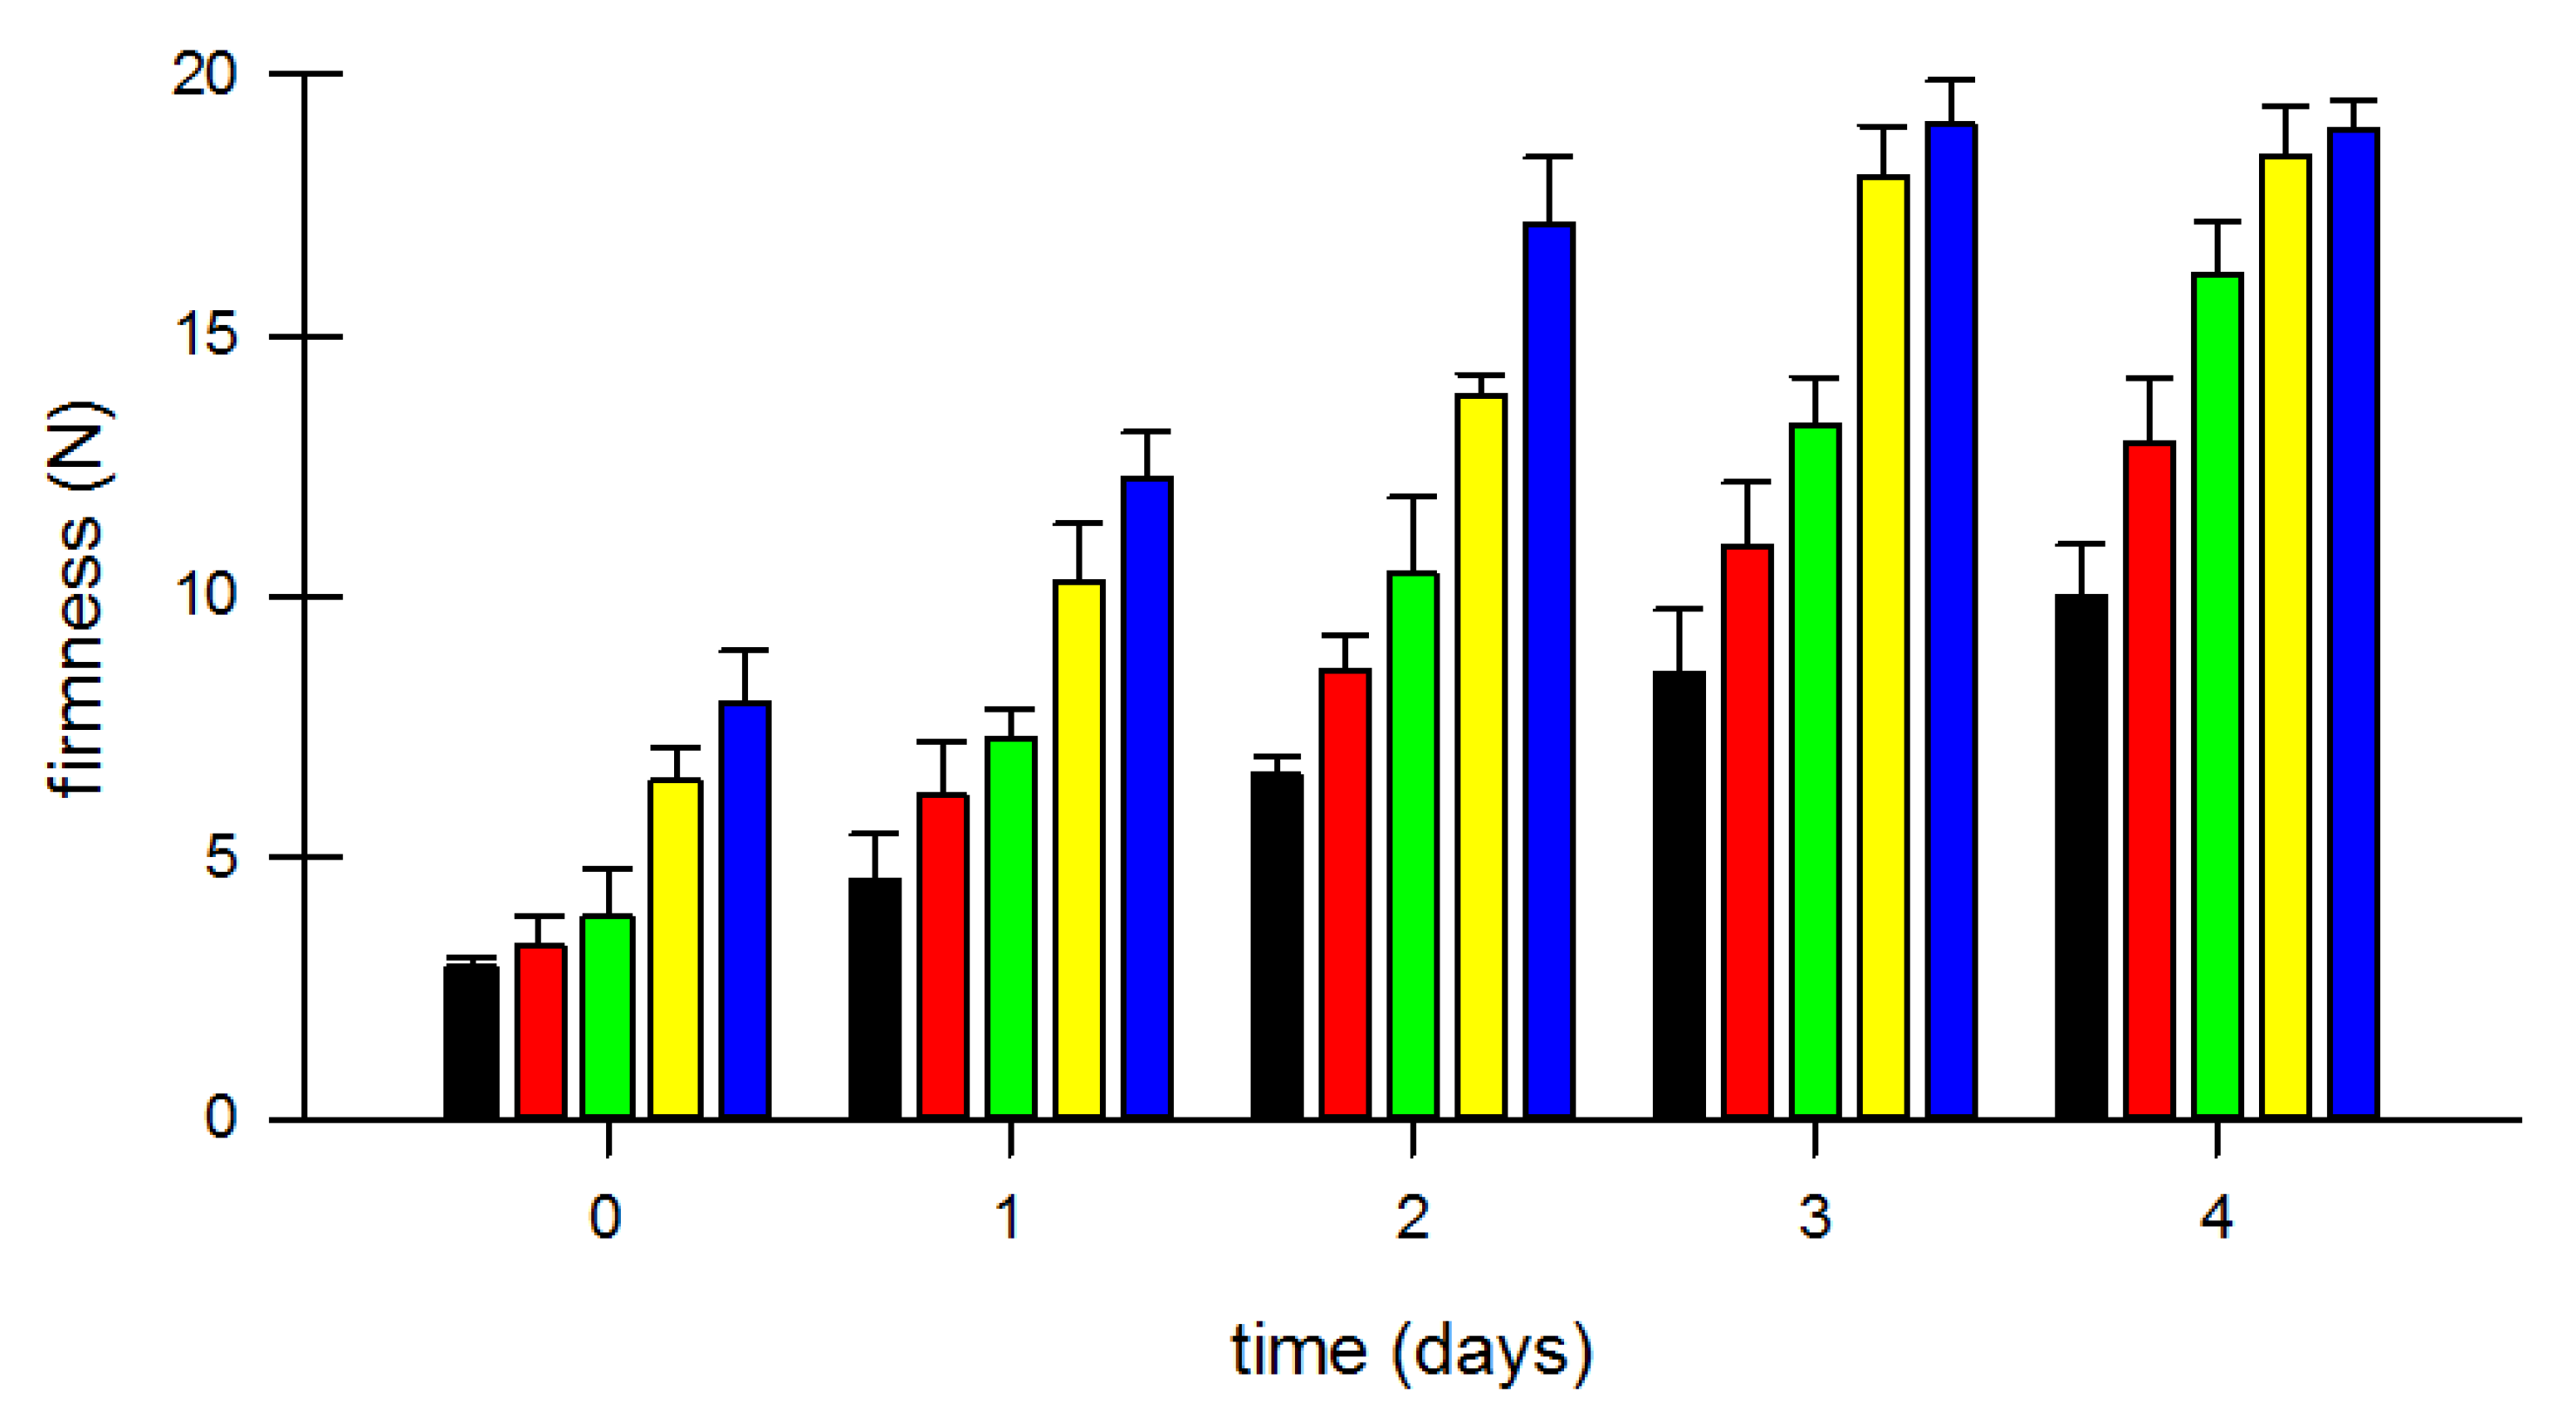
The addition of FBSG markedly increased the firmness of crumb of the sourdough breads at all levels of incorporation (p < 0.05) (Figure 3, day zero). All breads (control and FBSG additions) gradually became firmer over time in an initial linear fashion (R = 0.997, p = 0.0004) (Figure 3), which is to be expected for any bread without commercial additives to retard staling of bread [38].

3.2.2. Sensory Perception of Sourdough Bread Made with FBSG

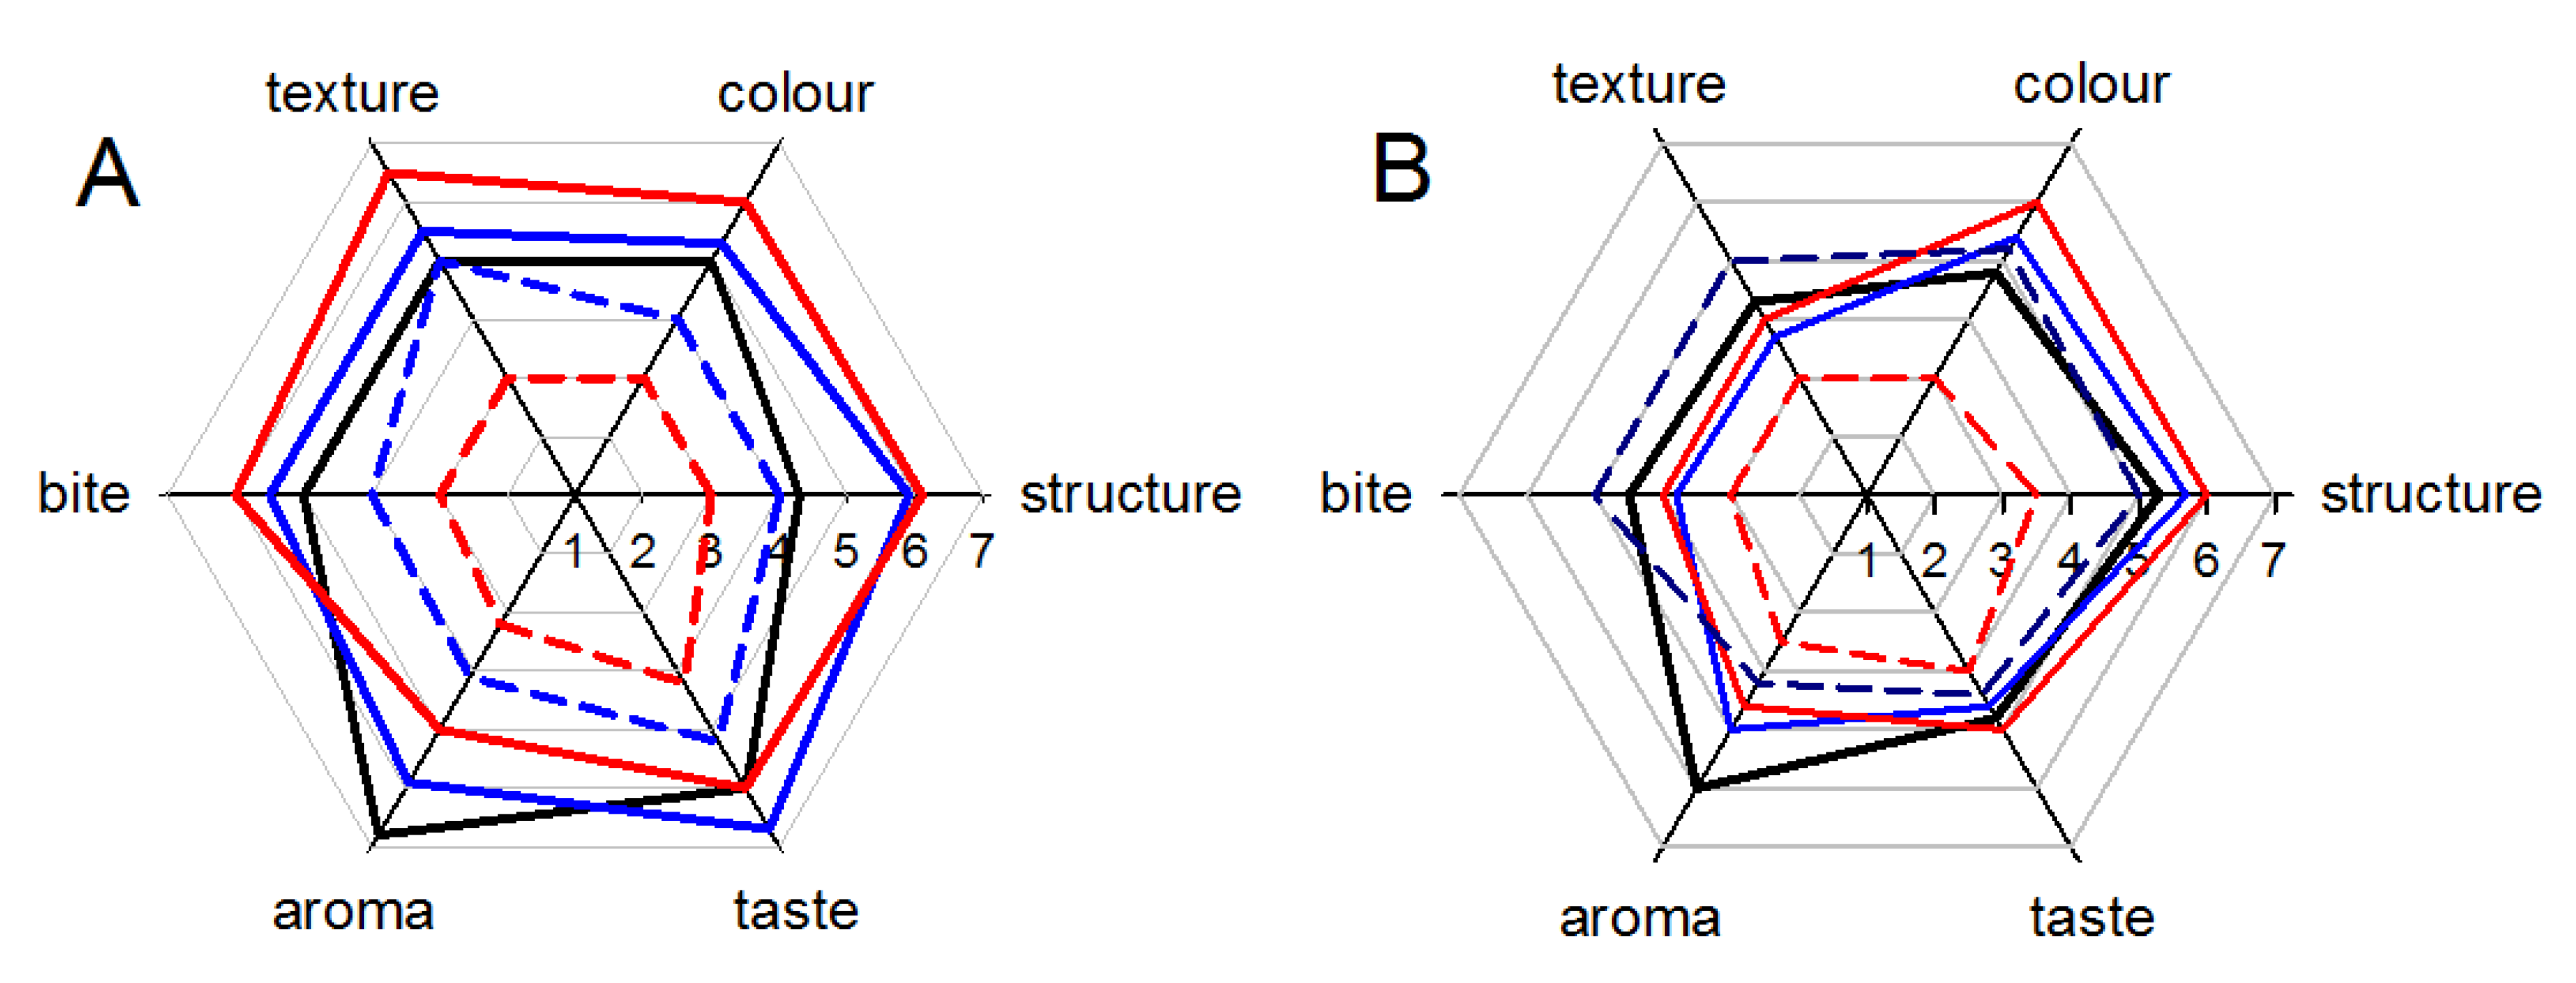
Freshly baked sourdough bread with the inclusion of FBSG was assessed using a sensory panel (n = 17). With regards to almost all sensory attributes, the sourdough breads with 5 and 10% FBSG inclusion performed better than the control sourdough breads (Figure 4A). The sourdough breads with a 10% FBSG inclusion scored best with regards to texture, colour, and bite, whereas with regards to sourdough aroma, the control sourdough breads scored best with an incremental decrease in appreciation of the aroma with an increase in FBSG. With regards to sourdough taste, the sourdough breads with a 5% FBSG inclusion scored best, whereas the 0% control and the 10% FBSG sourdough breads scored equal second. The inclusion of 15 and 20% FBSG did not obtain favourable sensory assessments and scored the lowest on all six attributes.
Much of the sourdough bread is neither sold nor consumed on the day of production [39,40]; instead, sourdough is often consumed many days post-production. We also facilitated a sensory evaluation of the same sourdough breads 3 days post-production (Figure 4B). All sensory attributes scored lower after 3 days compared to the fresh bread. Sourdough aroma of the non-FBSG sourdough breads was still the most appealing to the panellists, while the 10% FBSG inclusion scored best with regards to colour, structure, and taste after 3 days. The notion that texture and bite were markedly affected at 3 days post-production aligns with most studies regarding staling of bread [38,39,40,41]. The reduction in bite, texture, and structure over time (as assessed by a sensory panel) corresponds with the increase in firmness of the sourdough breads over time (compare Figure 3 with Figure 4A,B), which agrees with the findings of Ahlborn and co-workers [42] and Marinopoulou and co-workers [43].

3.2.3. Acid Profile of Sourdough Made with FBSG

In order to assess the production of lactic acid and acetic acid by the lactic acid bacteria involved in sourdough cultures, we analysed the main organic acids produced during sourdough bread production with different inclusion rates of FBSG during the sourdough fermentation and the baking process. As already shown in Table 1, the dried FBSG contained both acetic acid and lactic acid at quite substantial levels. We also determined the acid profiles of the various sourdough breads produced in this study (Table 2). We applied both a positive and a negative control with regards to sourdough breads without the addition of FBSG. The negative control contained no bacterial culture, while the positive contained the same bacterial culture that was added to the SSF of the BSG. The negative control contained no detectable levels of either lactic acid or acetic acid; while the positive control contained relatively low levels of both lactic acid and acetic acid at a fermentation quotient (FQ) molar ratio of 3.17 (Table 2). An increase in the addition of FBSG resulted in an increase in both lactic and acetic acids.
However, with an increase in inclusion of FBSG, there was a greater increase in acetic acid compared to lactic acid. The FQ nearly halved at 20% FBSG inclusion compared to the positive control, resulting in a near-linear decrease in the FQ at an R2 value of 0.962 (p = 0.003). This despite the fact that the FBSG used in all formulations was identical at a FQ of 2.50 (Table 1). The principal driver for the decrease in FQ appears to be a diminishing rate of lactic acid production during the dough fermentation at higher FBSG inclusions. The increase in the inclusion of FBSG was nearly linear with the relative increase in acetic acid, i.e., a doubling in the FBSG resulted in a near-doubling of acetic acid. However, the lactic acid content only increased 1.46 times for every doubling of the FBSG inclusion. These results confirm that lactic acid production is negatively affected at higher FBSG inclusion rates. The variation in lactic acid and acetic acid reflects the previously reported lactic and acetic acid values in sourdough breads [44,45]. This is very likely due to the use of different bacterial cultures and/or different combinations of bacteria and yeasts, but could also be attributed to different raw ingredients and processing conditions of the dough through to the final baked product [44,46,47].
As shown in Figure 5, for sourdough production with a 10% inclusion of FBSG, both the dough fermentation and the baking process influenced the acid content of the sourdough. At the completion of the moulding of the dough, the acetic acid content of the dough was 41.67 mmol/kg, which increased to 51.5 mmol/kg after 2 h of proofing. The lactic acid content at the completion of the moulding of the dough was 81.11 mmol/kg and increased to 87.78 mmol/kg after 2 h of proofing. The lactic/acetic acid ratio changed from 1.94 to 1.70 over those 2 h. In our experiments we baked the dough after 2 h of final proofing; however, if the dough was allowed to continue proofing for up to 7 h (Figure 5A), the acetic acid content in the dough increased to 75 mmol/kg and the lactic acid content increased to 103 mmol/kg, which represents a lactic/acetic acid ratio of 1.38. The average rate of lactic acid production was lower than the average rate of acetic acid production during the proofing stage, at 0.182 mmol/kg/h and 0.257 mmol/kg/h, respectively. As such, variations in the final proofing time have a marked impact on the lactic/acetic acid ratio. The baking process itself also has a marked impact on the acid content of the sourdough bread. We baked our bread after a 2-h final proofing at an FQ of 1.66. During the baking process, the lactic acid content diminished at a greater rate compared to the acetic acid content (Figure 5B). The rate of lactic acid loss during baking was 61 mmol/kg/h compared to an average loss of acetic acid at 47 mmol/kg/h. At the completion of the baking process, our sourdough breads with 10% FBSG contained 28.5 mmol/kg acetic acid and 62.4 mmol/kg lactic acid, representing an FQ of 2.19. In contrast to our findings, Gobbetti et al. [46] reported that both lactic acid and acetic acid concentrations did not substantially change during the baking process of sourdough breads.
A multitude of reports exist on acidification rates of sourdough bacteria grown on a wide range of substrates in liquid culture; however, an extensive search of the literature did not reveal any comparable reports on the rate of acid production and/or loss during the proofing and/or baking stages of bread to compare our results to. Hence, we have already commenced research into the active biochemistry of sourdough breads during the sourdough fermentation and the baking stages of sourdough bread production.
In order to assess whether the sourdough breads produced in this study contained the typical fermentation products of the lactic acid bacteria involved in sourdough cultures, we carried out a series of organic acid analyses, focusing on lactic acid and acetic acid. We analysed the crumb of 32 commercially available sourdough breads for the presence of both lactic acid and acetic acid. We obtained 13 of the sourdough breads from a range of large supermarkets and 19 sourdough loaves from artisan bakehouses. The amount of lactic acid across all commercial sourdough breads ranged from 5.67 mmol/kg (dw) to 74.22 mmol/kg (dw), whereas acetic acid ranged from 4.67 mmol/kg (dw) to 74.83 mmol/kg (dw) (Table 3). We found that the average lactic acid concentration was higher in the artisan sourdough breads (p(lactic) = 0.01), while the average acetic acid concentration in the crumb was higher in supermarket sourdough breads compared to the artisan sourdough breads. However, that difference was not significant (p(acetic) = 0.71). As mentioned before, our sourdough bread with a 10% inclusion of FBSG was deemed to be the most acceptable in our consumer panels. The lactic acid and acetic acid content of the 10% FBSG sourdough breads exceeded the average of organic acids found in commercially available sourdough loaves, but remained within the ranges of lactic and acetic acids (compare Table 2 and Table 3).
It has been accepted that sourdough fermentation produces flavours in crumb and that baking imparts flavours to the crust portion of bread [23]. Upon further investigation of our sourdough breads, we found that the crust of the sourdough breads contained lower concentrations of both lactic acid and acetic acid compared to the crumb (Figure 6). There were significant differences within the organic acid range of data obtained from artisanal sourdough loaves: (p(lactic artisanal crumb/crust) < 0.000) and (p(acetic artisanal crumb/crust) = 0.012) for lactic acid and acetic acid, respectively. The differences in lactic acid and acetic acid content between the crumb and crust of supermarket-bought sourdough loaves were also significant (p(lactic supermarket crumb/crust) < 0.000) and (p(acetic supermarket crumb/crust) > 0.000). The lower content of organic acids in the crust compared to the crumb can be attributed to the volatile nature of these acids, which could disappear faster from the crust compared to the crumb. This agrees with previous findings where lower organic acid concentrations were observed in the crust compared to the crumb of breads [48,49]. It is also possible that the organic acids are driven off by the co-migration of water from the crumb of the bread during baking [44]. Further studies into the cause of differences in organic acid concentration between the bread crumb and crust are currently underway.

4. Conclusions

In this study, we were able to utilise brewers spent grain as a solid-state substrate for the cultivation of sourdough cultures. We were then able to process the fermented brewers spent grain in order to preserve the sourdough culture and retain a steady viability at approximately 106 CFU per gram of dried FBSG in excess of 10 weeks. The FBSG was used in a series of experimental baking trials, during which we showed that both lactic acid and acetic acid productivity were retained during the dough fermentation (proofing) period. This was followed up by using the FBSG to produce sourdough breads that were acceptable in a consumer-based study through which we determined that an FBSG loading of 10% (based on flour weight) provided the most satisfactory loaves. The use of 10% FBSG to produce sourdough bread yielded an organic acid profile of our sourdough bread well within the range of the acetic and lactic acid profiles determined in commercially available sourdough breads.
During the baking trials, we showed that there was a reduction in both lactic and acetic acid content during the actual baking process. The reduction in the concentration of both organic acids appears to be at the heart of the observations that for both organic acids there is typically a lower concentration in the crust compared to the crumb of sourdough breads. Whether this phenomenon is due to the volatile nature of these acids, or due to a co-migration with water from the crumb towards the crust during the baking process, is currently being investigated.

Author Contributions

Conceptualization, F.V.; methodology, F.V. and A.H.; investigation, A.H., P.P. and N.v.d.H.; data curation and analysis, F.V.; supervision, F.V.; writing—original draft, A.H. and F.V.; writing—review and editing, F.V., A.Z. and H.L. All authors have read and agreed to the published version of the manuscript.

Funding

This research received no external funding.

Institutional Review Board Statement

The study was approved by Research Ethics Committee of Harper Adams University (project number 0085-201901) on 29 January 2019.

Informed Consent Statement

Not applicable.

Data Availability Statement

Data will be made available up on request to the corresponding author.

Acknowledgments

We would like to thank Amjad Ali and Clare Hutchinson for their technical support during this work.

Conflicts of Interest

The authors declare no conflict of interest.

References

  1. Stojceska, V. Brewer’s spent grain from by-product to health: A rich source of functional ingredients. In Flour and Breads and Their Fortification in Health and Disease Prevention, 2nd ed.; Preedy, V.R., Watson, R.R., Eds.; Academic Press: Cambridge, MA, USA, 2019; pp. 189–198. [Google Scholar]
  2. Gastl, M.; Kupetz, M.; Becker, T. Determination of Cytolytic Malt Modification–Part II: Impact on Wort Separation. J. Am. Soc. Brew. Chem. 2021, 79, 66–74. [Google Scholar]
  3. Charlton, P.; Vriesekoop, F. Brewery by-Products. In Handbook of Brewing, 3rd ed.; Stewart, G.G., Russell, I., Anstruther, A., Eds.; CRC Press: London, UK, 2017; pp. 567–589. [Google Scholar]
  4. Mussatto, S.I.; Dragone, G.; Roberto, I.C. Brewers’ spent grain: Generation, characteristics and potential applications. J. Cereal Sci. 2006, 43, 1–14. [Google Scholar] [CrossRef]
  5. Steinmacher, N.C.; Honna, F.A.; Gasparetto, A.V.; Anibal, D.; Grossmann, M.V. Bioconversion of brewer’s spent grains by reactive extrusion and their application in bread-making. LWT 2012, 46, 542–547. [Google Scholar] [CrossRef]
  6. Buffington, J. The economic potential of brewer’s spent grain (BSG) as a biomass feedstock. Adv. Chem. Eng. Sci. 2014, 4, 308–318. [Google Scholar] [CrossRef] [Green Version]
  7. Bochmann, G.; Drosg, B.; Fuchs, W. Anaerobic digestion of thermal pretreated brewers’ spent grains. Environ. Prog. Sustain. Energy 2015, 34, 1092–1096. [Google Scholar] [CrossRef]
  8. Nassary, E.K.; Nasolwa, E.R. Unravelling disposal benefits derived from underutilized brewing spent products in Tanzania. J. Environ. Manag. 2019, 242, 430–439. [Google Scholar] [CrossRef]
  9. Kerby, C.; Vriesekoop, F. An overview of the utilisation of brewery by-products as generated by british craft breweries. Beverages 2017, 3, 24. [Google Scholar] [CrossRef] [Green Version]
  10. Nayak, A.; Bhushan, B. An overview of the recent trends on the waste valorization techniques for food wastes. J. Environ. Manag. 2019, 233, 352–370. [Google Scholar] [CrossRef]
  11. Mussatto, S.I. Brewer’s spent grain: A valuable feedstock for industrial applications. J. Sci. Food Agric. 2014, 94, 1264–1275. [Google Scholar] [CrossRef] [Green Version]
  12. Garcia-Garcia, G.; Woolley, E.; Rahimifard, S. Optimising industrial food waste management. Procedia Manuf. 2017, 8, 432–439. [Google Scholar] [CrossRef] [Green Version]
  13. Waters, D.M.; Jacob, F.; Titze, J.; Arendt, E.K.; Zannini, E. Fibre, protein and mineral fortification of wheat bread through milled and fermented brewer’s spent grain enrichment. Eur. Food Res. Technol. 2012, 235, 767–778. [Google Scholar] [CrossRef]
  14. Katina, K.; Heiniö, R.L.; Autio, K.; Poutanen, K. Optimization of sourdough process for improved sensory profile and texture of wheat bread. LWT 2006, 39, 1189–1202. [Google Scholar] [CrossRef]
  15. Katina, K.; Liukkonen, K.H.; Kaukovirta-Norja, A.; Adlercreutz, H.; Heinonen, S.M.; Lampi, A.M.; Pihlava, J.M.; Poutanen, K. Fermentation-induced changes in the nutritional value of native or germinated rye. J. Cereal Sci. 2007, 46, 348–355. [Google Scholar] [CrossRef]
  16. Poutanen, K.; Flander, L.; Katina, K. Sourdough and cereal fermentation in a nutritional perspective. Food Microbiol. 2009, 26, 693–699. [Google Scholar] [CrossRef] [PubMed]
  17. Denkova, R.; Ilieva, S.; Denkova, Z.; Georgieva, L.; Yordanova, M.; Nikolova, D.; Evstatieva, Y. Production of wheat bread without preservatives using sourdough starters. Biotechnol. Biotechnol. Equip. 2014, 28, 889–898. [Google Scholar] [CrossRef]
  18. Aprodu, I.; Simion, A.B.; Banu, I. Valorisation of the Brewers’ Spent Grain through Sourdough Bread Making. Int. J. Food Eng. 2017, 13, 20170195. [Google Scholar] [CrossRef]
  19. Ktenioudaki, A.; O’Shea, N.; Gallagher, E. Rheological properties of wheat dough supplemented with functional by-products of food processing: Brewer’s spent grain and apple pomace. J. Food Eng. 2013, 116, 362–368. [Google Scholar] [CrossRef]
  20. Ktenioudaki, A.; Chaurin, V.; Reis, S.F.; Gallagher, E. Brewer’s spent grain as a functional ingredient for breadsticks. Int. J. Food Sci. Technol. 2012, 47, 1765–1771. [Google Scholar] [CrossRef] [Green Version]
  21. Mintel. Bread–UK–September 2018–Executive Summary. Mintel. 2018. Available online: http://0-academic-mintel-com.brum.beds.ac.uk/display/917730/?highlight#hit1 (accessed on 5 May 2021).
  22. Plessas, S. Innovations in Sourdough Bread Making. Fermentation 2021, 7, 29. [Google Scholar] [CrossRef]
  23. Sakandar, H.A.; Hussain, R.; Kubow, S.; Sadiq, F.A.; Huan, W.; Imran, M. Sourdough bread: A contemporary cereal fermented product. J. Food Process. Preserv. 2019, 43, e13883. [Google Scholar] [CrossRef]
  24. Sieuwerts, S.; Bron, P.A.; Smid, E.J. Mutually stimulating interactions between lactic acid bacteria and Saccharomyces cerevisiae in sourdough fermentation. LWT 2018, 90, 201–206. [Google Scholar] [CrossRef]
  25. Do Nascimento, K.D.O.; Paes, S.D.N.D.; Augusta, I.M. A review “Clean Labeling”: Applications of natural ingredients in bakery products. J. Food Nutr. Res. 2018, 6, 285–294. [Google Scholar] [CrossRef]
  26. Chavan, R.S.; Chavan, S.R. Sourdough technology—a traditional way for wholesome foods: A review. Compr. Rev. Food Sci. Food Saf. 2011, 10, 169–182. [Google Scholar] [CrossRef]
  27. Upadhyay, R.; Ghosal, D.; Mehra, A. Characterization of bread dough: Rheological properties and microstructure. J. Food Eng. 2012, 109, 104–113. [Google Scholar] [CrossRef]
  28. Rasco, B.A.; Hashisaka, A.E.; Dong, F.M.; Einstein, M.A. Sensory evaluation of baked foods incorporating different levels of distillers’ dried grains with solubles from soft white winter wheat. J. Food Sci. 1989, 54, 337–342. [Google Scholar] [CrossRef]
  29. Lawless, H.T. Laboratory Exercise for Sensory Evaluation; Springer: New York, NY, USA, 2013. [Google Scholar]
  30. Meilgaard, M.C.; Civille, G.V.; Carr, B.T. Sensory Evaluation Techniques, 5th ed.; CRC Press, Taylor Francis Group: Boca Raton, FL, USA, 2016. [Google Scholar]
  31. Lawless, H.T.; Heymann, H. Sensory Evaluation of Food, 2nd ed.; Springer: New York, NY, USA, 2010. [Google Scholar]
  32. Roth, M.; Döring, C.; Jekle, M.; Becker, T. Mechanisms behind distiller’s grains impact on wheat dough and bread quality. Food Bioprocess Technol. 2016, 9, 274–284. [Google Scholar] [CrossRef]
  33. Sullivan, P.; O’Flaherty, J.; Brunton, N.; Arendt, E.; Gallagher, E. The utilisation of barley middlings to add value and health benefits to white breads. J. Food Eng. 2011, 105, 493–502. [Google Scholar] [CrossRef]
  34. Seyer, M.È.; Gélinas, P. Bran characteristics and wheat performance in whole wheat bread. Int. J. Food Sci. Technol. 2009, 44, 688–693. [Google Scholar] [CrossRef]
  35. Wang, J.; Rosell, C.M.; de Barber, C.B. Effect of the addition of different fibres on wheat dough performance and bread quality. Food Chem. 2002, 79, 221–226. [Google Scholar] [CrossRef]
  36. Miafo, A.P.T.; Koubala, B.B.; Kansci, G.; Muralikrishna, G. Free sugars and non-starch polysaccharides–phenolic acid complexes from bran, spent grain and sorghum seeds. J. Cereal Sci. 2019, 87, 124–131. [Google Scholar] [CrossRef]
  37. Brochetti, D.; Penfield, M.P.; Heim-Edelman, F. Yeast bread containing distillers’ dried grain: Dough development and bread quality. J. Food Qual. 1991, 14, 331–344. [Google Scholar] [CrossRef]
  38. Fadda, C.; Sanguinetti, A.M.; Del Caro, A.; Collar, C.; Piga, A. Bread staling: Updating the view. Compr. Rev. Food Sci. Food Saf. 2014, 13, 473–492. [Google Scholar] [CrossRef] [Green Version]
  39. Brancoli, P.; Lundin, M.; Bolton, K.; Eriksson, M. Bread loss rates at the supplier-retailer interface–analysis of risk factors to support waste prevention measures. Resour. Conserv. Recycl. 2019, 147, 128–136. [Google Scholar] [CrossRef]
  40. Gmose, R.; Fristedt, R.; Larsson, K.; Undeland, I.; Taherzadeh, M.J.; Lennartsson, P.R. From stale bread and brewers spent grain to a new food source using edible filamentous fungi. Bioengineered 2020, 11, 582–598. [Google Scholar] [CrossRef]
  41. Curti, E.; Carini, E.; Tribuzio, G.; Vittadini, E. Effect of bran on bread staling: Physico-chemical characterization and molecular mobility. J. Cereal Sci. 2015, 65, 25–30. [Google Scholar] [CrossRef]
  42. Ahlborn, G.J.; Pike, O.A.; Hendrix, S.B.; Hess, W.M.; Huber, C.S. Sensory, mechanical, and microscopic evaluation of staling in low-protein and gluten-free breads. Cereal Chem. 2005, 82, 328–335. [Google Scholar] [CrossRef]
  43. Marinopoulou, A.; Papadakis, D.; Petridis, D.; Papageorgiou, M. Monitoring Staling of Packaged Sliced Pan Breads: Physicochemical Properties, Sensory Evaluation, and Consumer Preference. J. Culin. Sci. Technol. 2019, 18, 396–412. [Google Scholar] [CrossRef]
  44. Fujimoto, A.; Ito, K.; Narushima, N.; Miyamoto, T. Identification of lactic acid bacteria and yeasts, and characterization of food components of sourdoughs used in Japanese bakeries. J. Biosci. Bioeng. 2019, 27, 575–581. [Google Scholar] [CrossRef]
  45. Buksa, K. Effect of pentoses, hexoses, and hydrolyzed arabinoxylan on the most abundant sugar, organic acid, and alcohol contents during rye sourdough bread production. Cereal Chem. 2020, 97, 642–652. [Google Scholar] [CrossRef]
  46. Gobbetti, M.; Simonetti, M.S.; Corsetti, A.; Santinelli, F.; Rossi, J.; Damiani, P. Volatile compound and organic acid productions by mixed wheat sour dough starters: Influence of fermentation parameters and dynamics during baking. Food Microbiol. 1995, 12, 497–507. [Google Scholar] [CrossRef]
  47. Gobbetti, M.; De Angelis, M.; Corsetti, A.; Di Cagno, R. Biochemistry and physiology of sourdough lactic acid bacteria. Trends Food Sci. Technol. 2005, 16, 57–69. [Google Scholar] [CrossRef]
  48. Sui, X.; Yap, P.Y.; Zhou, W. Anthocyanins during baking: Their degradation kinetics and impacts on color and antioxidant capacity of bread. Food Bioprocess Technol. 2015, 8, 983–994. [Google Scholar] [CrossRef]
  49. Jensen, S.; Oestdal, H.; Skibsted, L.H.; Larsen, E.; Thybo, A.K. Chemical changes in wheat pan bread during storage and how it affects the sensory perception of aroma, flavour, and taste. J. Cereal Sci. 2011, 53, 259–268. [Google Scholar] [CrossRef]
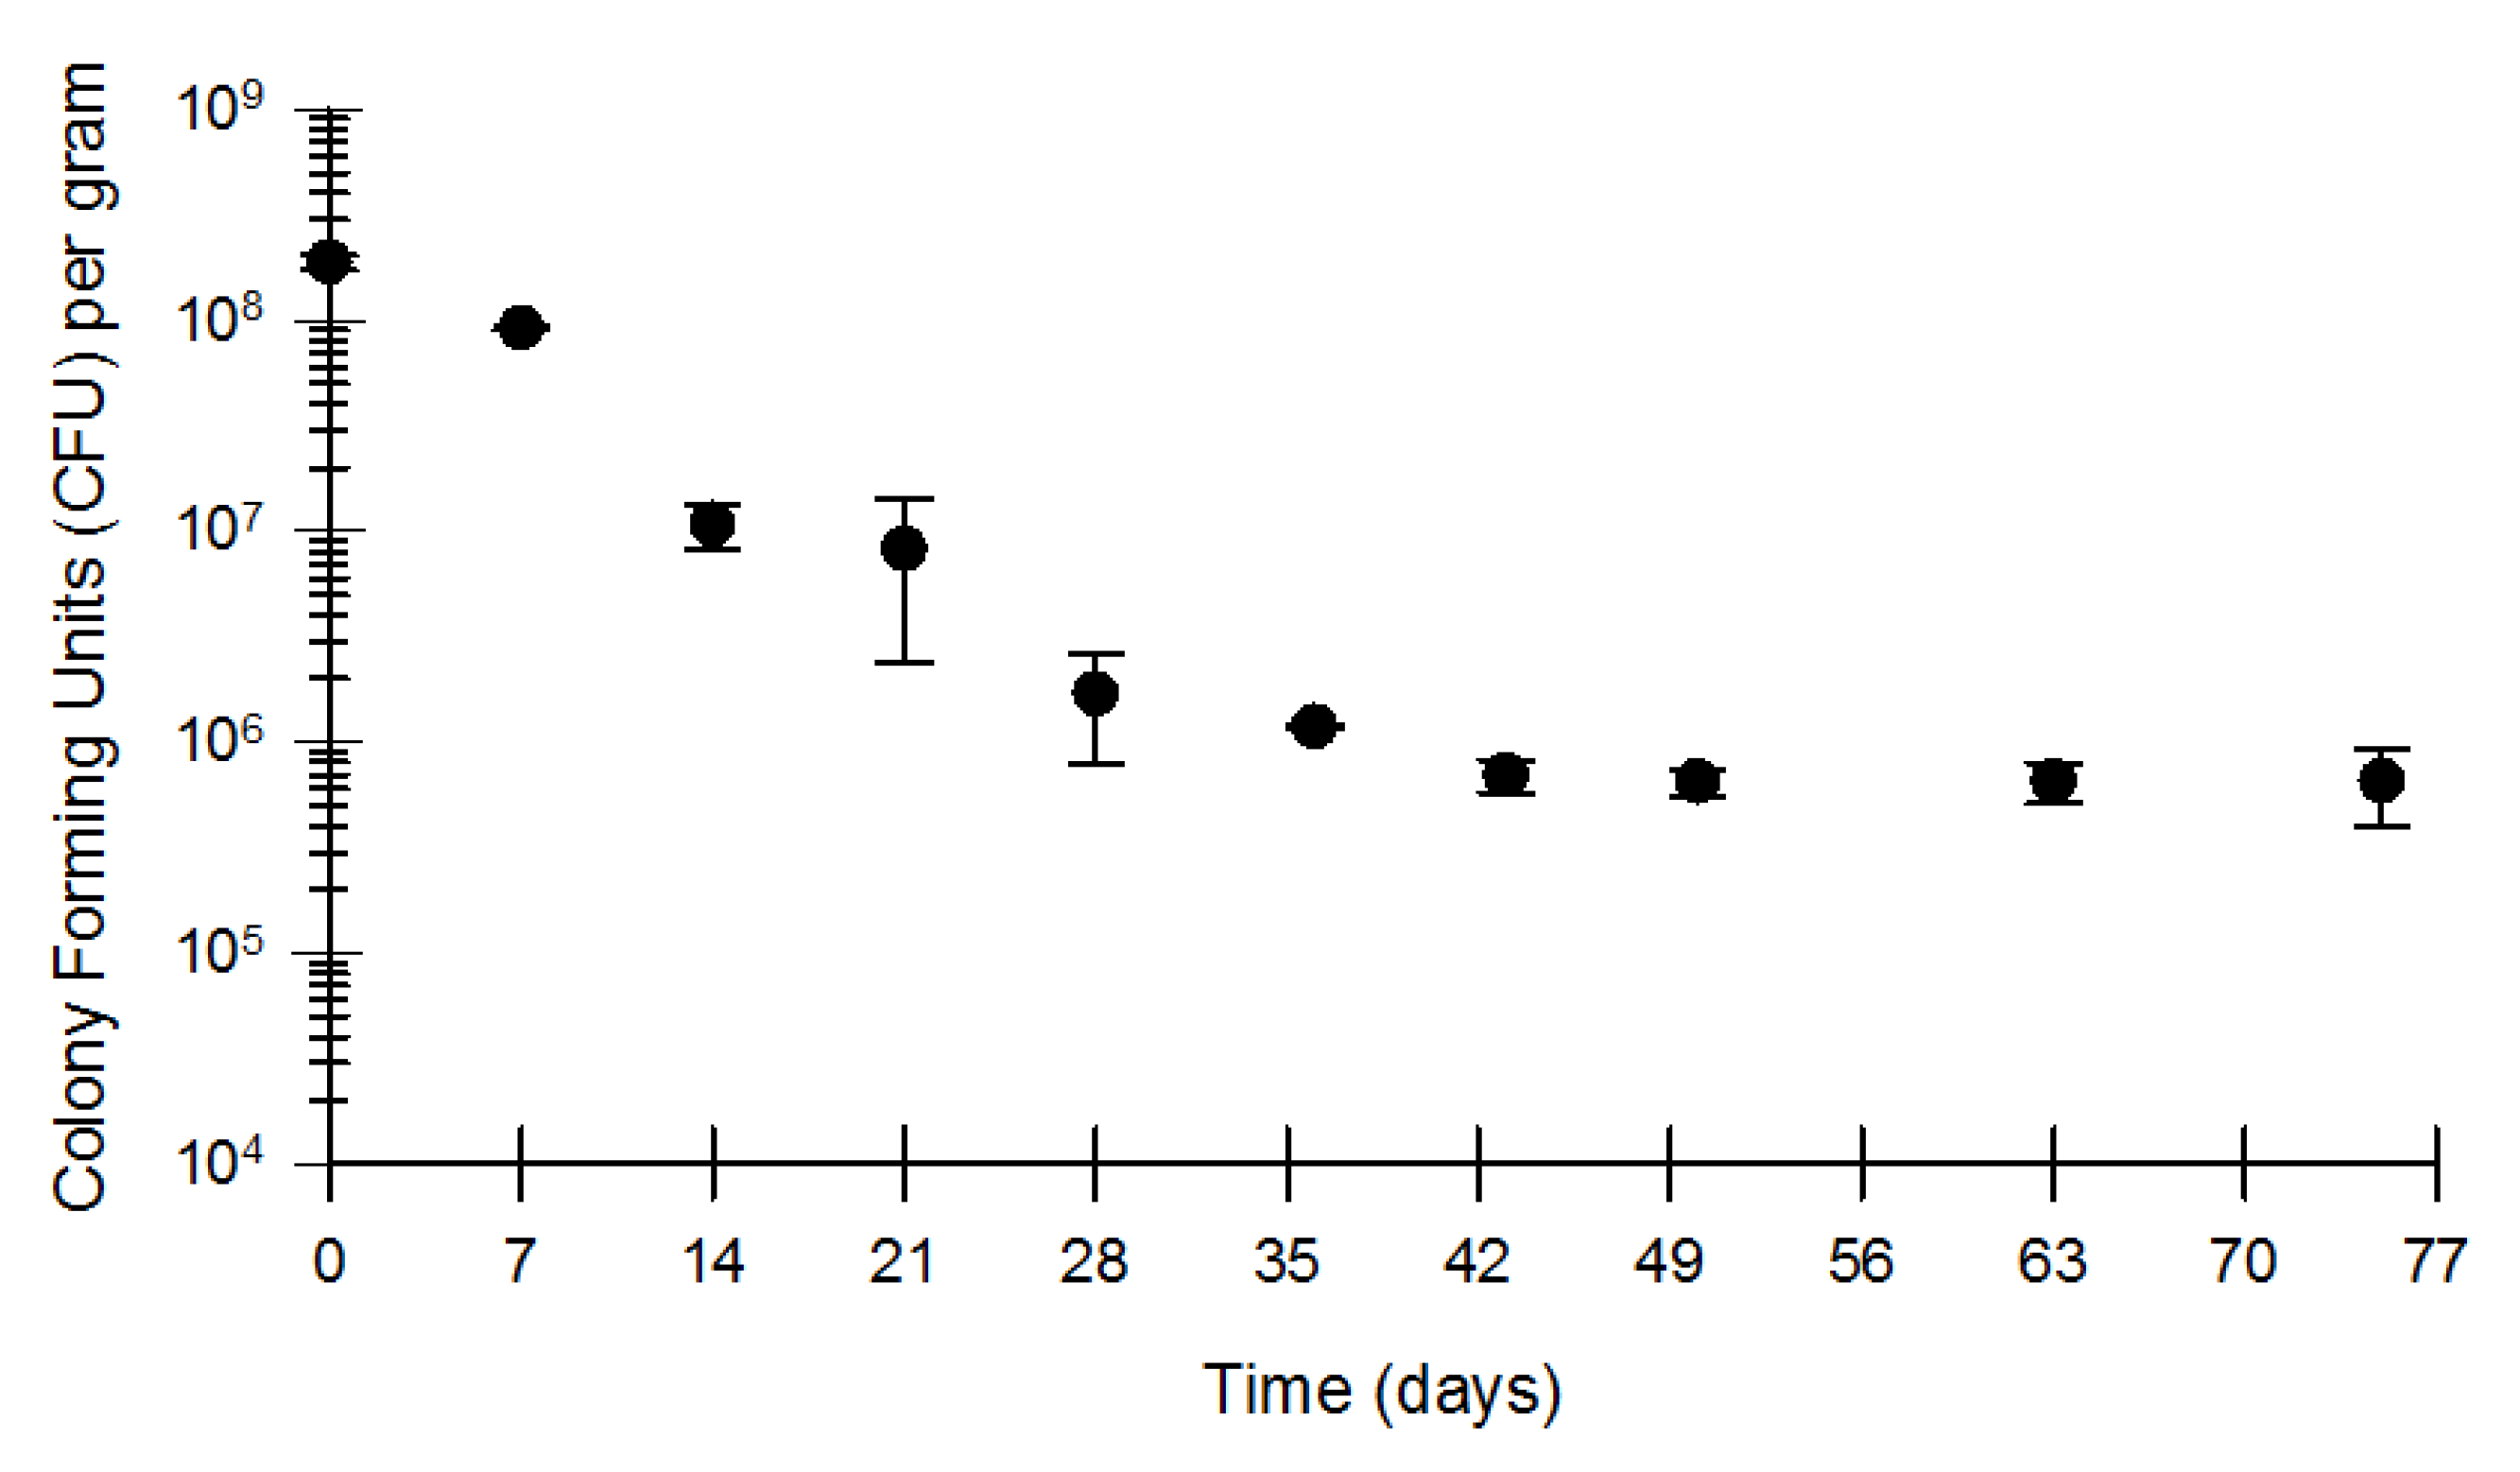
Figure 1. Viability of bacterial sourdough culture on dried, fermented brewers spent grain. The data shown are the average and standard deviation of triplicate determinations.
Fermentation 07 00096 g001
Figure 2. The influence of dried fermented brewers spent grain (FBSG) on the physical appearance of the baked breads. (A) Cross-sectional areas of sourdough breads (n = 3 determinations). (B) L-a-b colour of sourdough bread crumb, white bars (L * values), black bars (a * values), grey bars (b * values) (n = 10 determinations).
Fermentation 07 00096 g002
Figure 3. The impact of the inclusion of fermented brewers spent grain on the firmness of sourdough bread over time. Black bars represent the control sourdough bread with no FBSG; red bars represent the sourdough bread with 5% FBSG; green bars represent the sourdough bread with 10% FBSG; yellow bars represent the sourdough bread with 15% FBSG; blue bars represent the sourdough bread with 20% FBSG. All data shown are the average and standard deviation (error bars) of triplicate determinations. Zero time (0) indicates the day of sourdough bread production.
Fermentation 07 00096 g003
Figure 4. The influence of the inclusion of fermented brewers spent grain on a number of sensory attributes of sourdough breads over time. (A) represents the responses on the day of production (n = 17); (B) represents the responses on the third day following production (n = 15). Solid black lines represent the control sourdough bread with no FBSG; solid blue lines represent the sourdough bread with 5% FBSG; solid red lines represent the sourdough bread with 10% FBSG; dotted blue lines represent the sourdough bread with 15% FBSG; dotted red lines represent the sourdough bread with 20% FBSG.
Fermentation 07 00096 g004
Figure 5. Lactic acid and acetic acid content of sourdough with an inclusion of FBSG at 10% during dough fermentation (A) and baking of sourdough (B). ☐ lactic acid, ○ acetic acid, ● lactic acid to acetic acid ratio. The greyed-out area in (A) represent an extended proofing period (>2 h) of the dough beyond the samples represented in (B), which were baked following a final proofing of 2 h. The data shown are the average and standard deviation of triplicate samples. The standard deviations are indicated with whiskers that are barely visible.
Fermentation 07 00096 g005
Figure 6. Lactic acid and acetic acid content, and lactic/acetic acid ratios in the crumb and the crust of sourdough of artisanal (n = 19) and supermarket (n = 13) bought loaves. The data are represented in box plots, with the box representing the central 50% of the data ranges and the whiskers representing the upper and lower 25% quartiles of the data ranges. The dots (●) represent the extent of the outlying data. (A1) Organic acid content in artisanal sourdough breads. The grey boxes represent the data from the crumb, whereas the white boxes represent the data from the crust. (A2) Lactic/acetic ratios in artisanal sourdough breads. The red boxes represent data from the crumb, blue boxes represent data from the crust. (B1), organic acid content in supermarket bought sourdough breads. The grey boxes represent the data from the crumb, while the white boxes represent the data from the crust. (B2) Lactic/acetic ratios in supermarket bought sourdough breads. The red boxes represent data from the crumb, and blue boxes represent data from the crust.
Fermentation 07 00096 g006
Table 1. Concentrations of lactic acid and acetic acid in fermented brewers spent grain.
SampleOrganic Acidmmol/kg, avg ± SDFermentation Quotient (FQ) *
Brewers spent grainLactic acidND **NA ***
Acetic acidND
Fermented brewers spent grain (wet)Lactic acid53.56 ± 2.442.36
Acetic acid22.67 ± 1.49
Fermented brewers spent grain (dry)Lactic acid692.01 ± 99.22 2.50
Acetic acid277.01 ± 103.33
Values are reported as average and standard deviation (SD) of triplicate determinations. * (FQ) = fermentation quotient = molar lactic/acetic ratio; ** (ND) = not detected; *** (NA) = not applicable.
Table 2. Lactic acid and acetic acid content of sourdough breads produced in this study.
Sourdough SampleOrganic Acidmmol/kg
avg ± SD
QF *
Negative control (0% FBSG and no bacterial starter culture).Lactic acidND **NA ***
Acetic acidND
Positive control (0% FBSG, but with the inclusion of the bacterial starter culture)Lactic acid11.11 ± 0.223.17
Acetic acid3.50 ± 0.17
5% added FBSGLactic acid43.44 ± 4.892.83
Acetic acid15.33 ± 1.49
10% added FBSGLactic acid62.44 ± 4.442.19
Acetic acid28.49 ± 3.83
15% added FBSGLactic acid77.67 ± 4.551.81
Acetic acid43.01 ± 7.17
20% added FBSGLactic acid93.44 ± 1.221.66
Acetic acid56.17 ± 2.17
Values are reported as average and standard deviation (SD) of triplicate determinations. * (FQ) = fermentation quotient = molar lactic/acetic acid ratio; ** (ND) = not detected; *** (NA) = not applicable.
Table 3. Lactic acid and acetic acid content in the crumb of commercial sourdough breads.
Source of Sourdough BreadsOrganic Acidmmol/kg * (avg ± SD) **Range (mmol/kg)
Full range of sourdough breads (n = 32)Lactic acid45.05 ± 19.565.67 ↔ 74.22
Acetic acid21.83 ± 10.504.67 ↔ 42.83
Supermarket sourdough breads (n = 13)Lactic acid36.04 ± 17.895.67 ↔ 31.22
Acetic acid23.33 ± 11.164.67 ↔ 42.83
Artisan sourdough breads (n = 19)Lactic acid53.22 ± 16.1122.78 ↔ 74.22
Acetic acid22.81 ± 7.5110.83 ↔ 37.17
* All weights are reported as mmol of organic acids per kg of bread in dry weight. ** Values are reported as average and standard deviation (SD) of triplicate determinations.
Publisher’s Note: MDPI stays neutral with regard to jurisdictional claims in published maps and institutional affiliations.