
Effect of Aeration on Yeast Community Structure and Volatile Composition in Uninoculated Chardonnay Wines

 , , and
Abstract
:1. Introduction
2. Materials and Methods
2.1. Fermentation
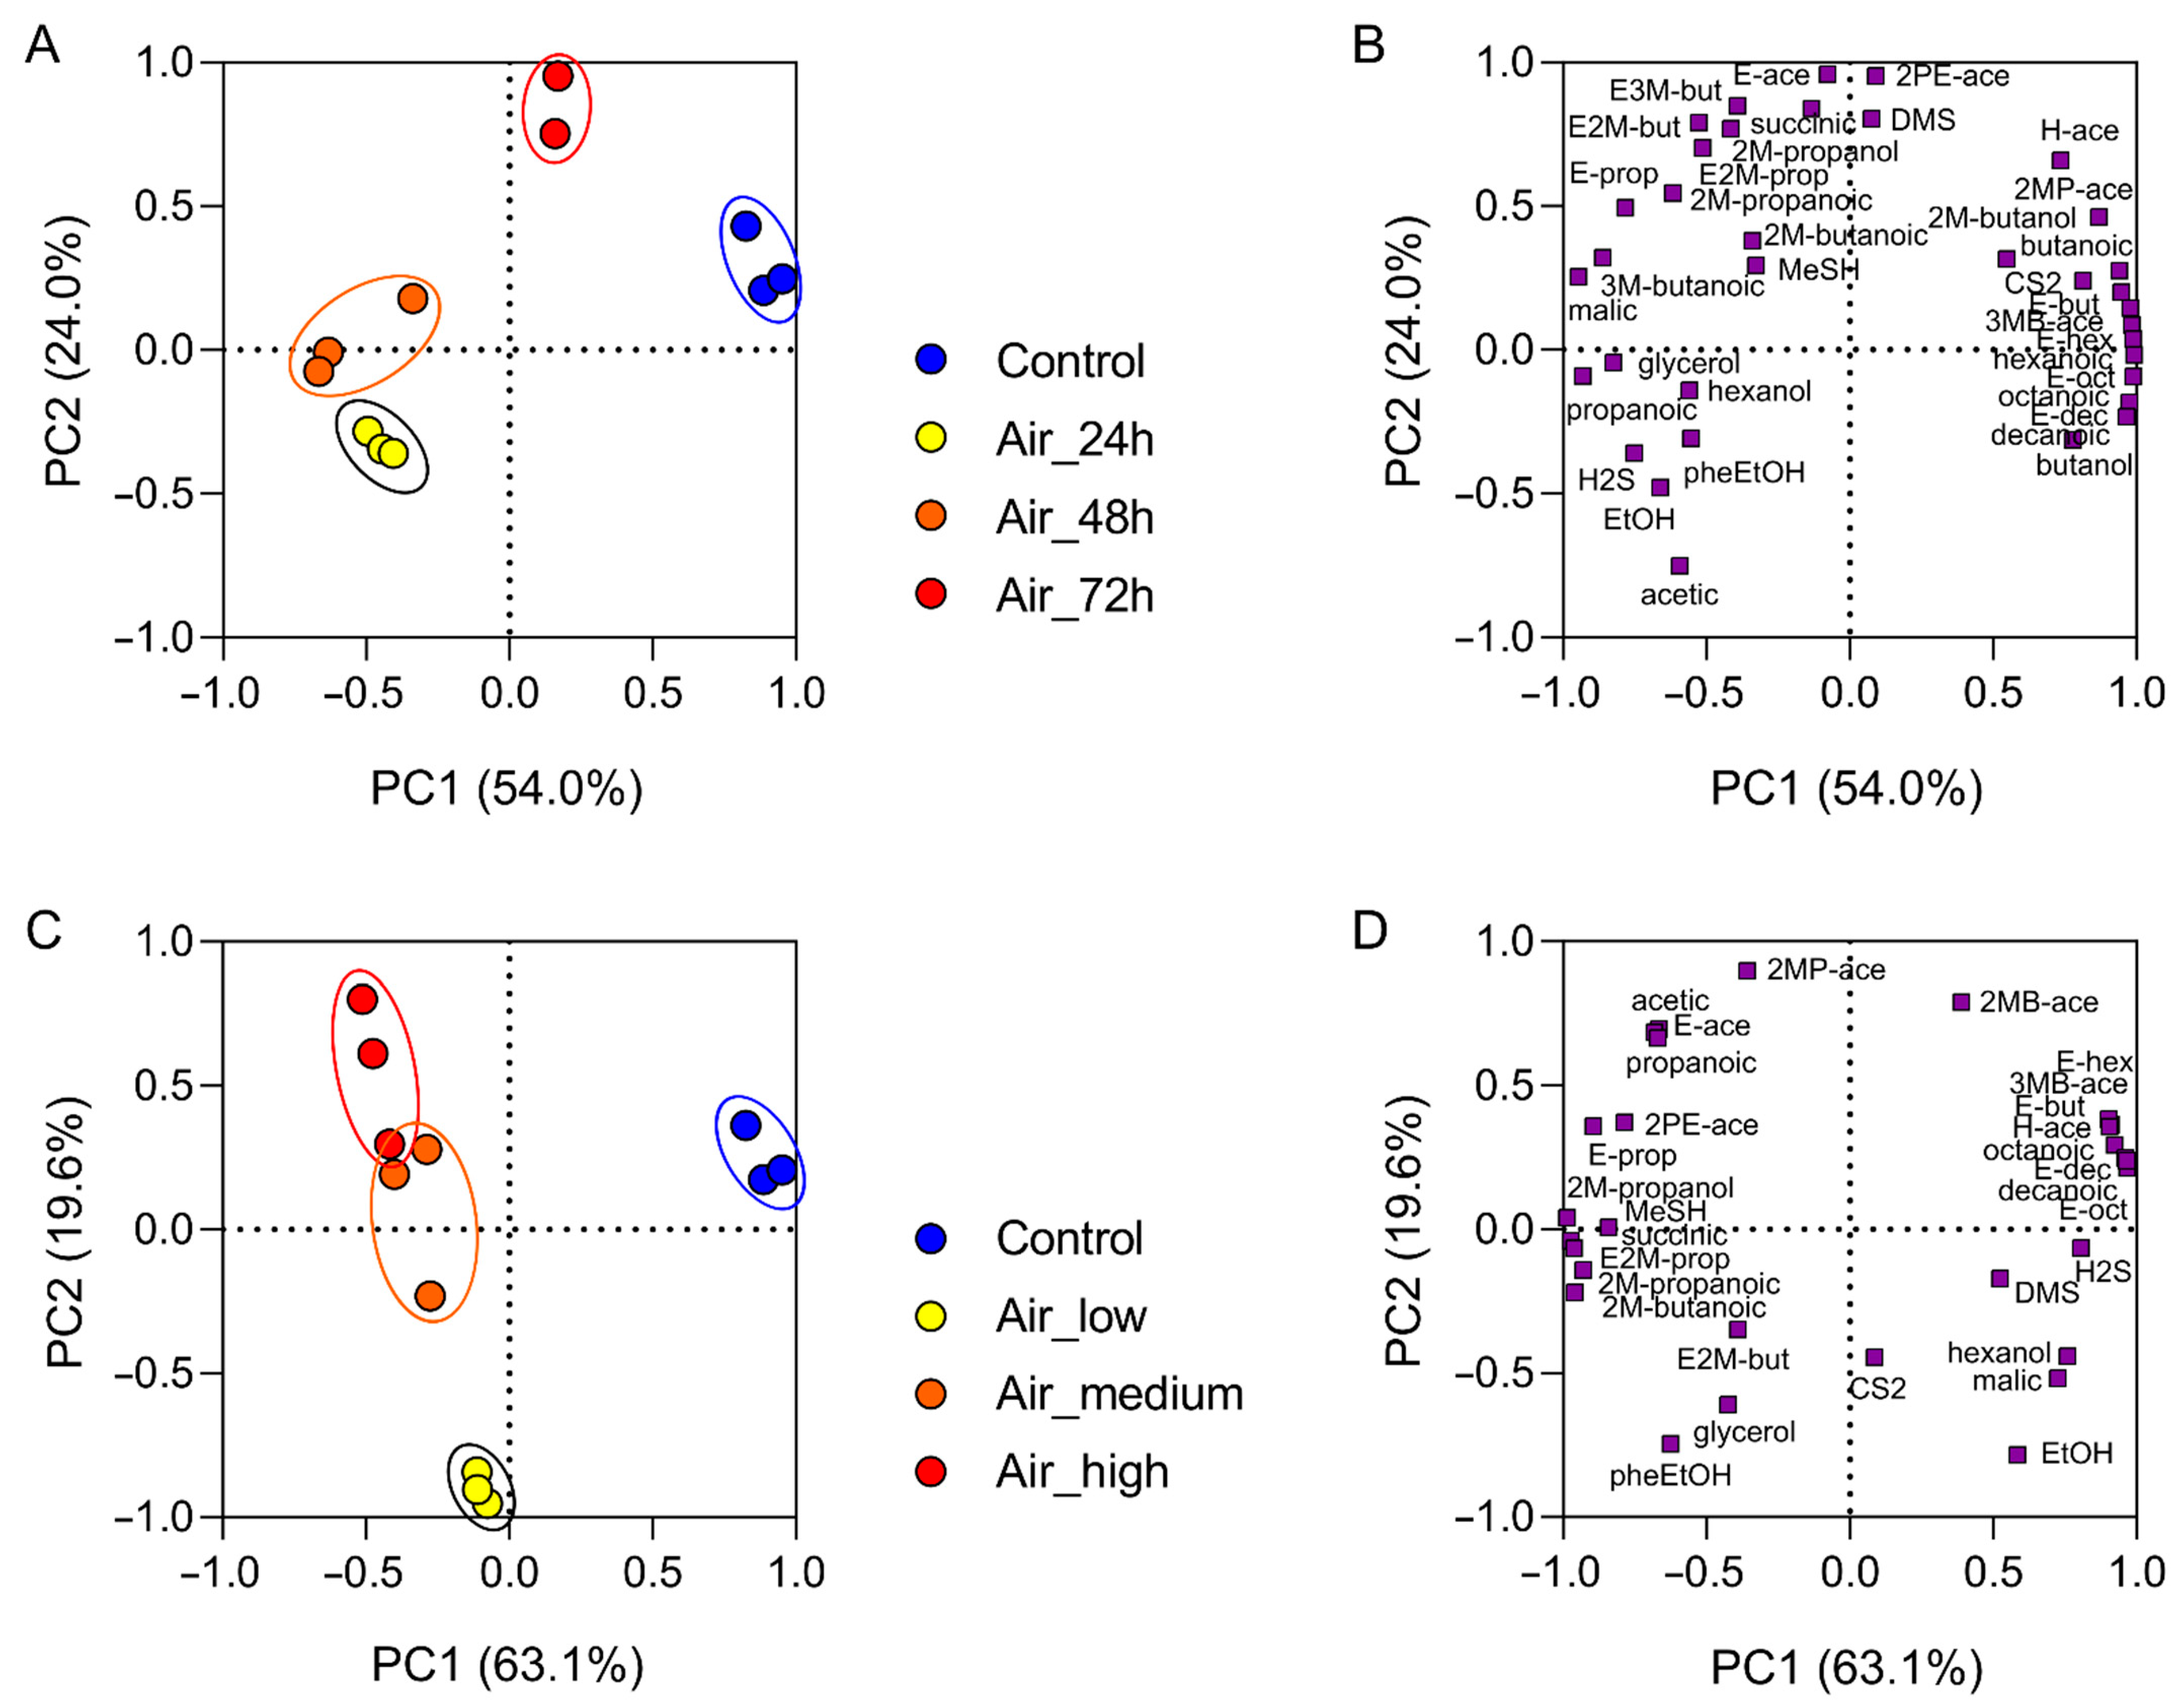
- Control, no aeration provided.
- Air_24 h, aeration at 6 mL/min 24 h after crushing, aeration continued for 24 h.
- Air_48 h, aeration at 6 mL/min 48 h after crushing, aeration continued for 24 h.
- Air_72 h, aeration at 6 mL/min 72 h after crushing, aeration continued for 24 h.
- Control, no aeration provided.
- Air_low, 24 h after crushing, aeration at 18 mL/min for 48 h.
- Air_medium, 24 h after crushing, aeration at 25 mL/min for 24 h and then 35 mL/min for another 24 h.
- Air_high, 24 h after crushing, aeration at 50 mL/min for 24 h and then 70 mL/min for another 24 h.
2.2. Analytical Techniques
2.3. Determination of Microbial Populations
2.4. Data Analysis
3. Results
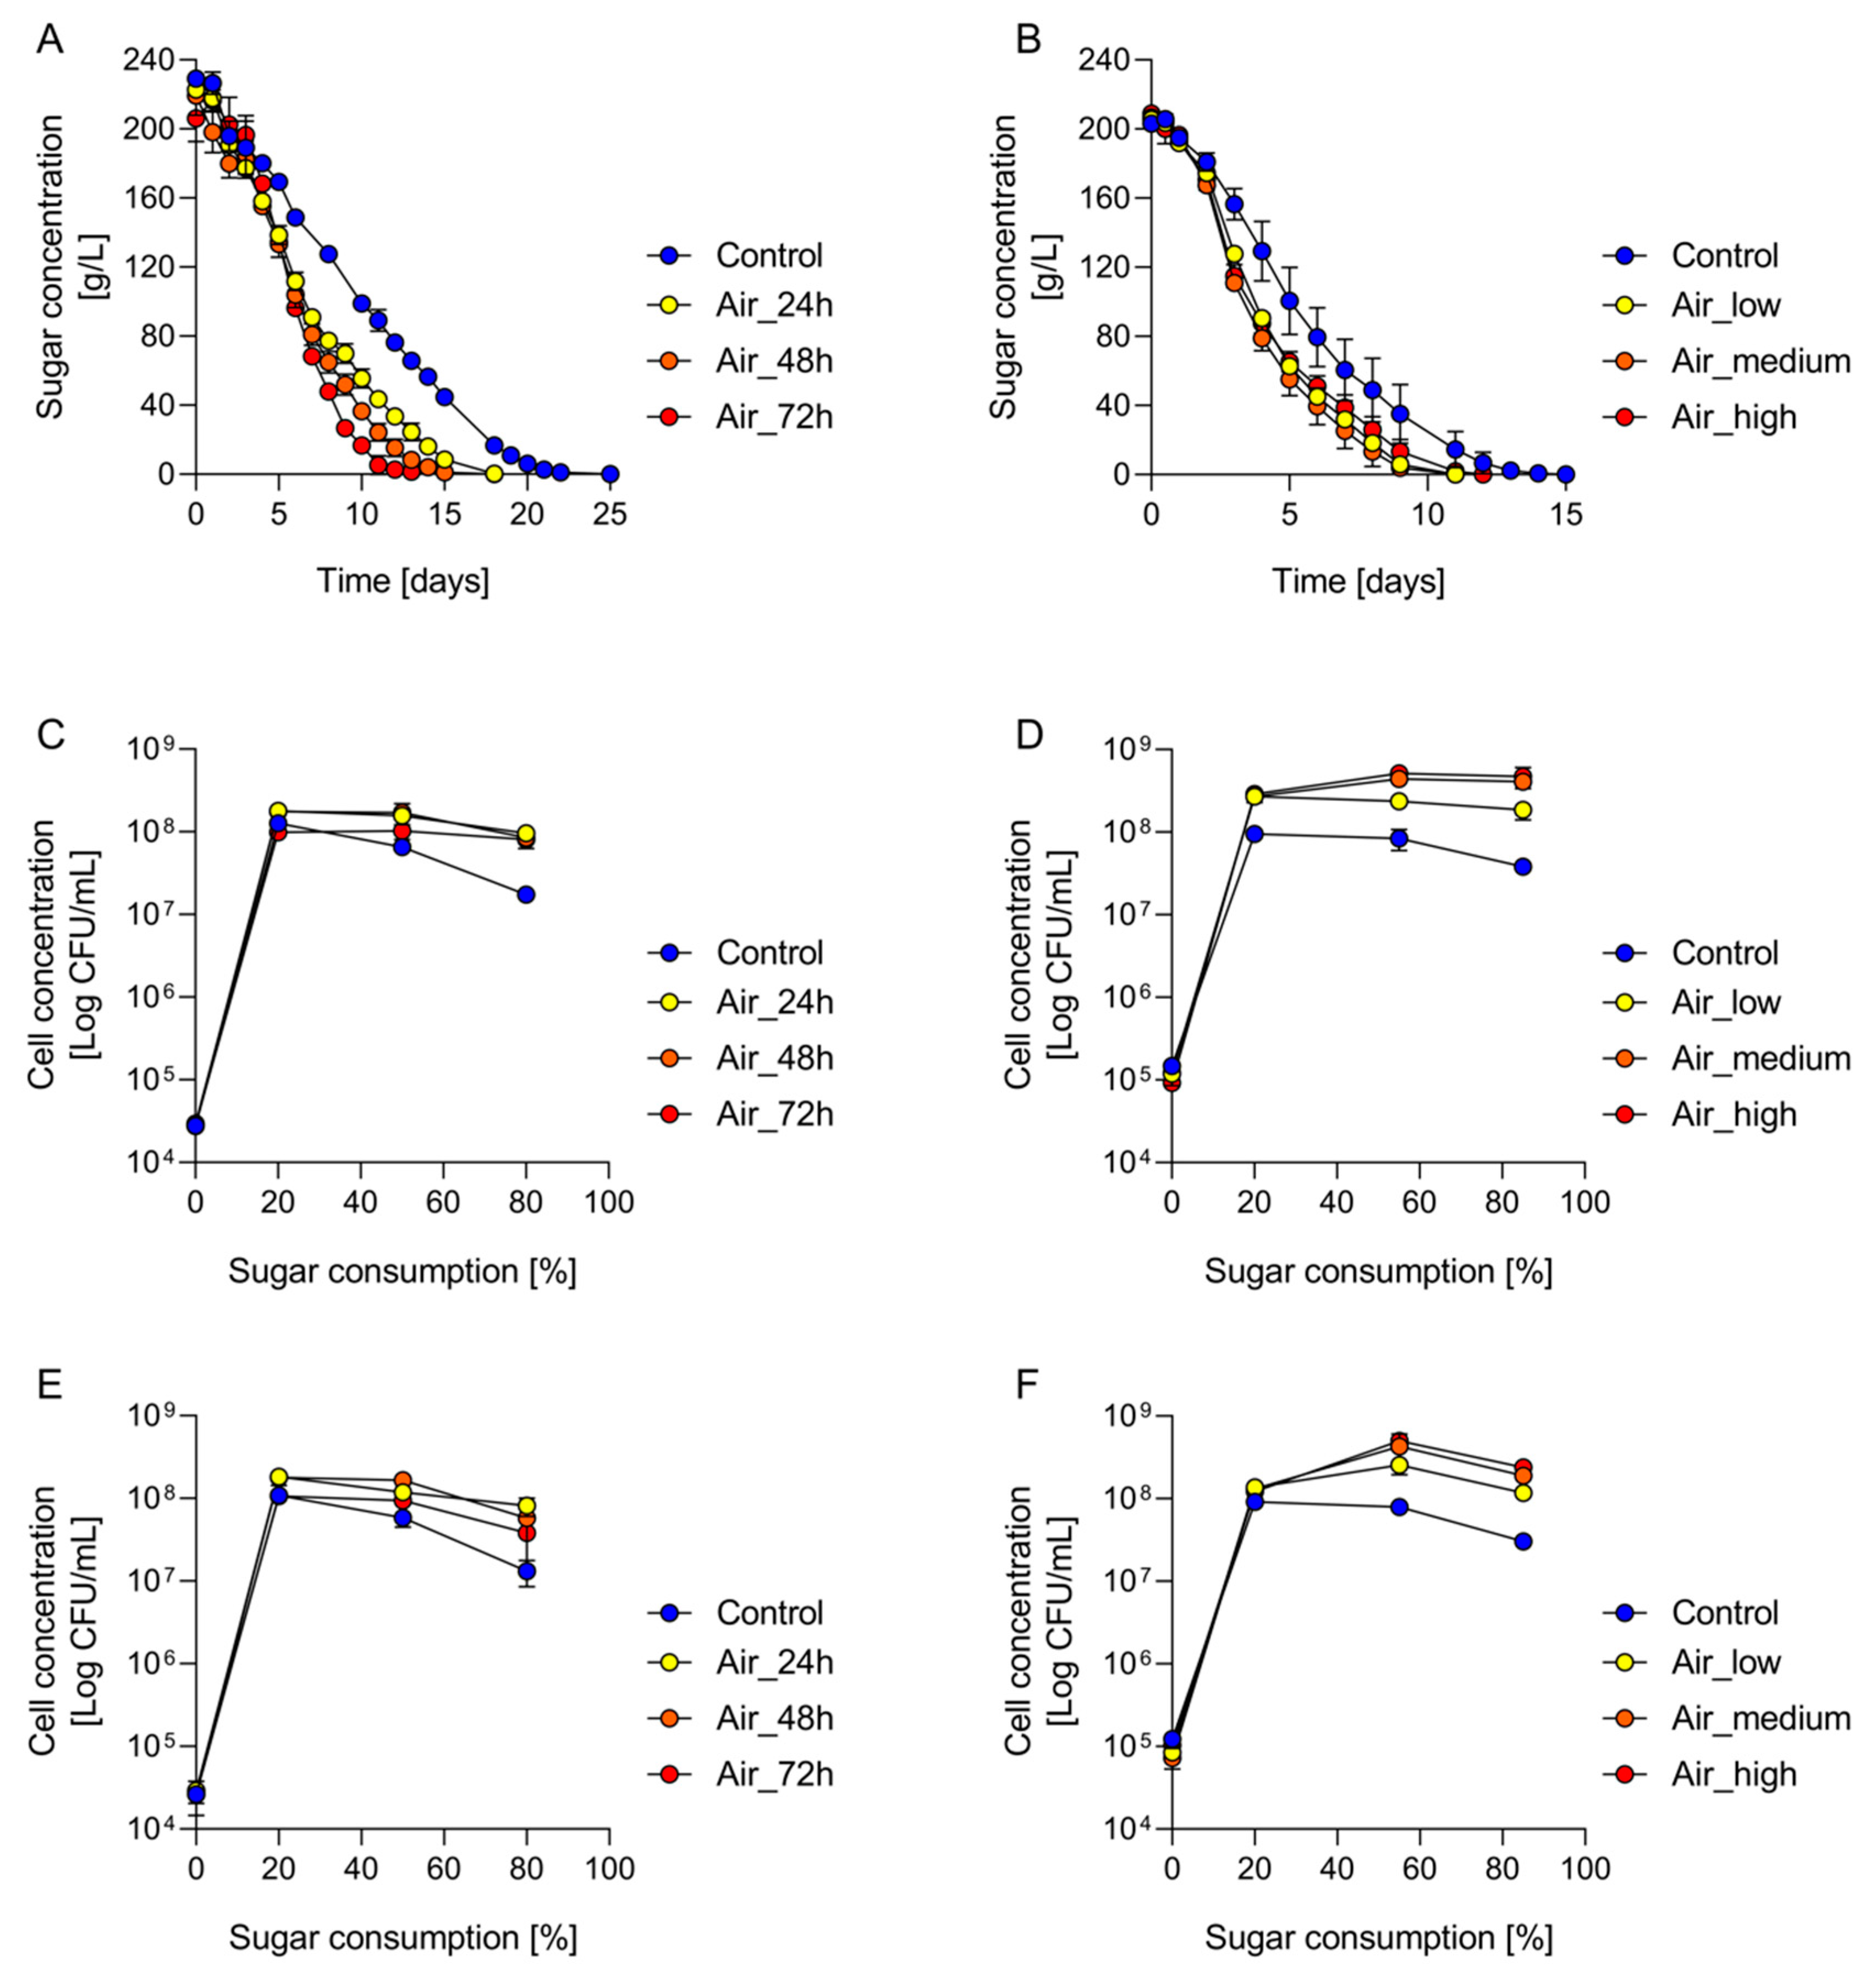
3.1. Aeration Reduces the Duration of Fermentation
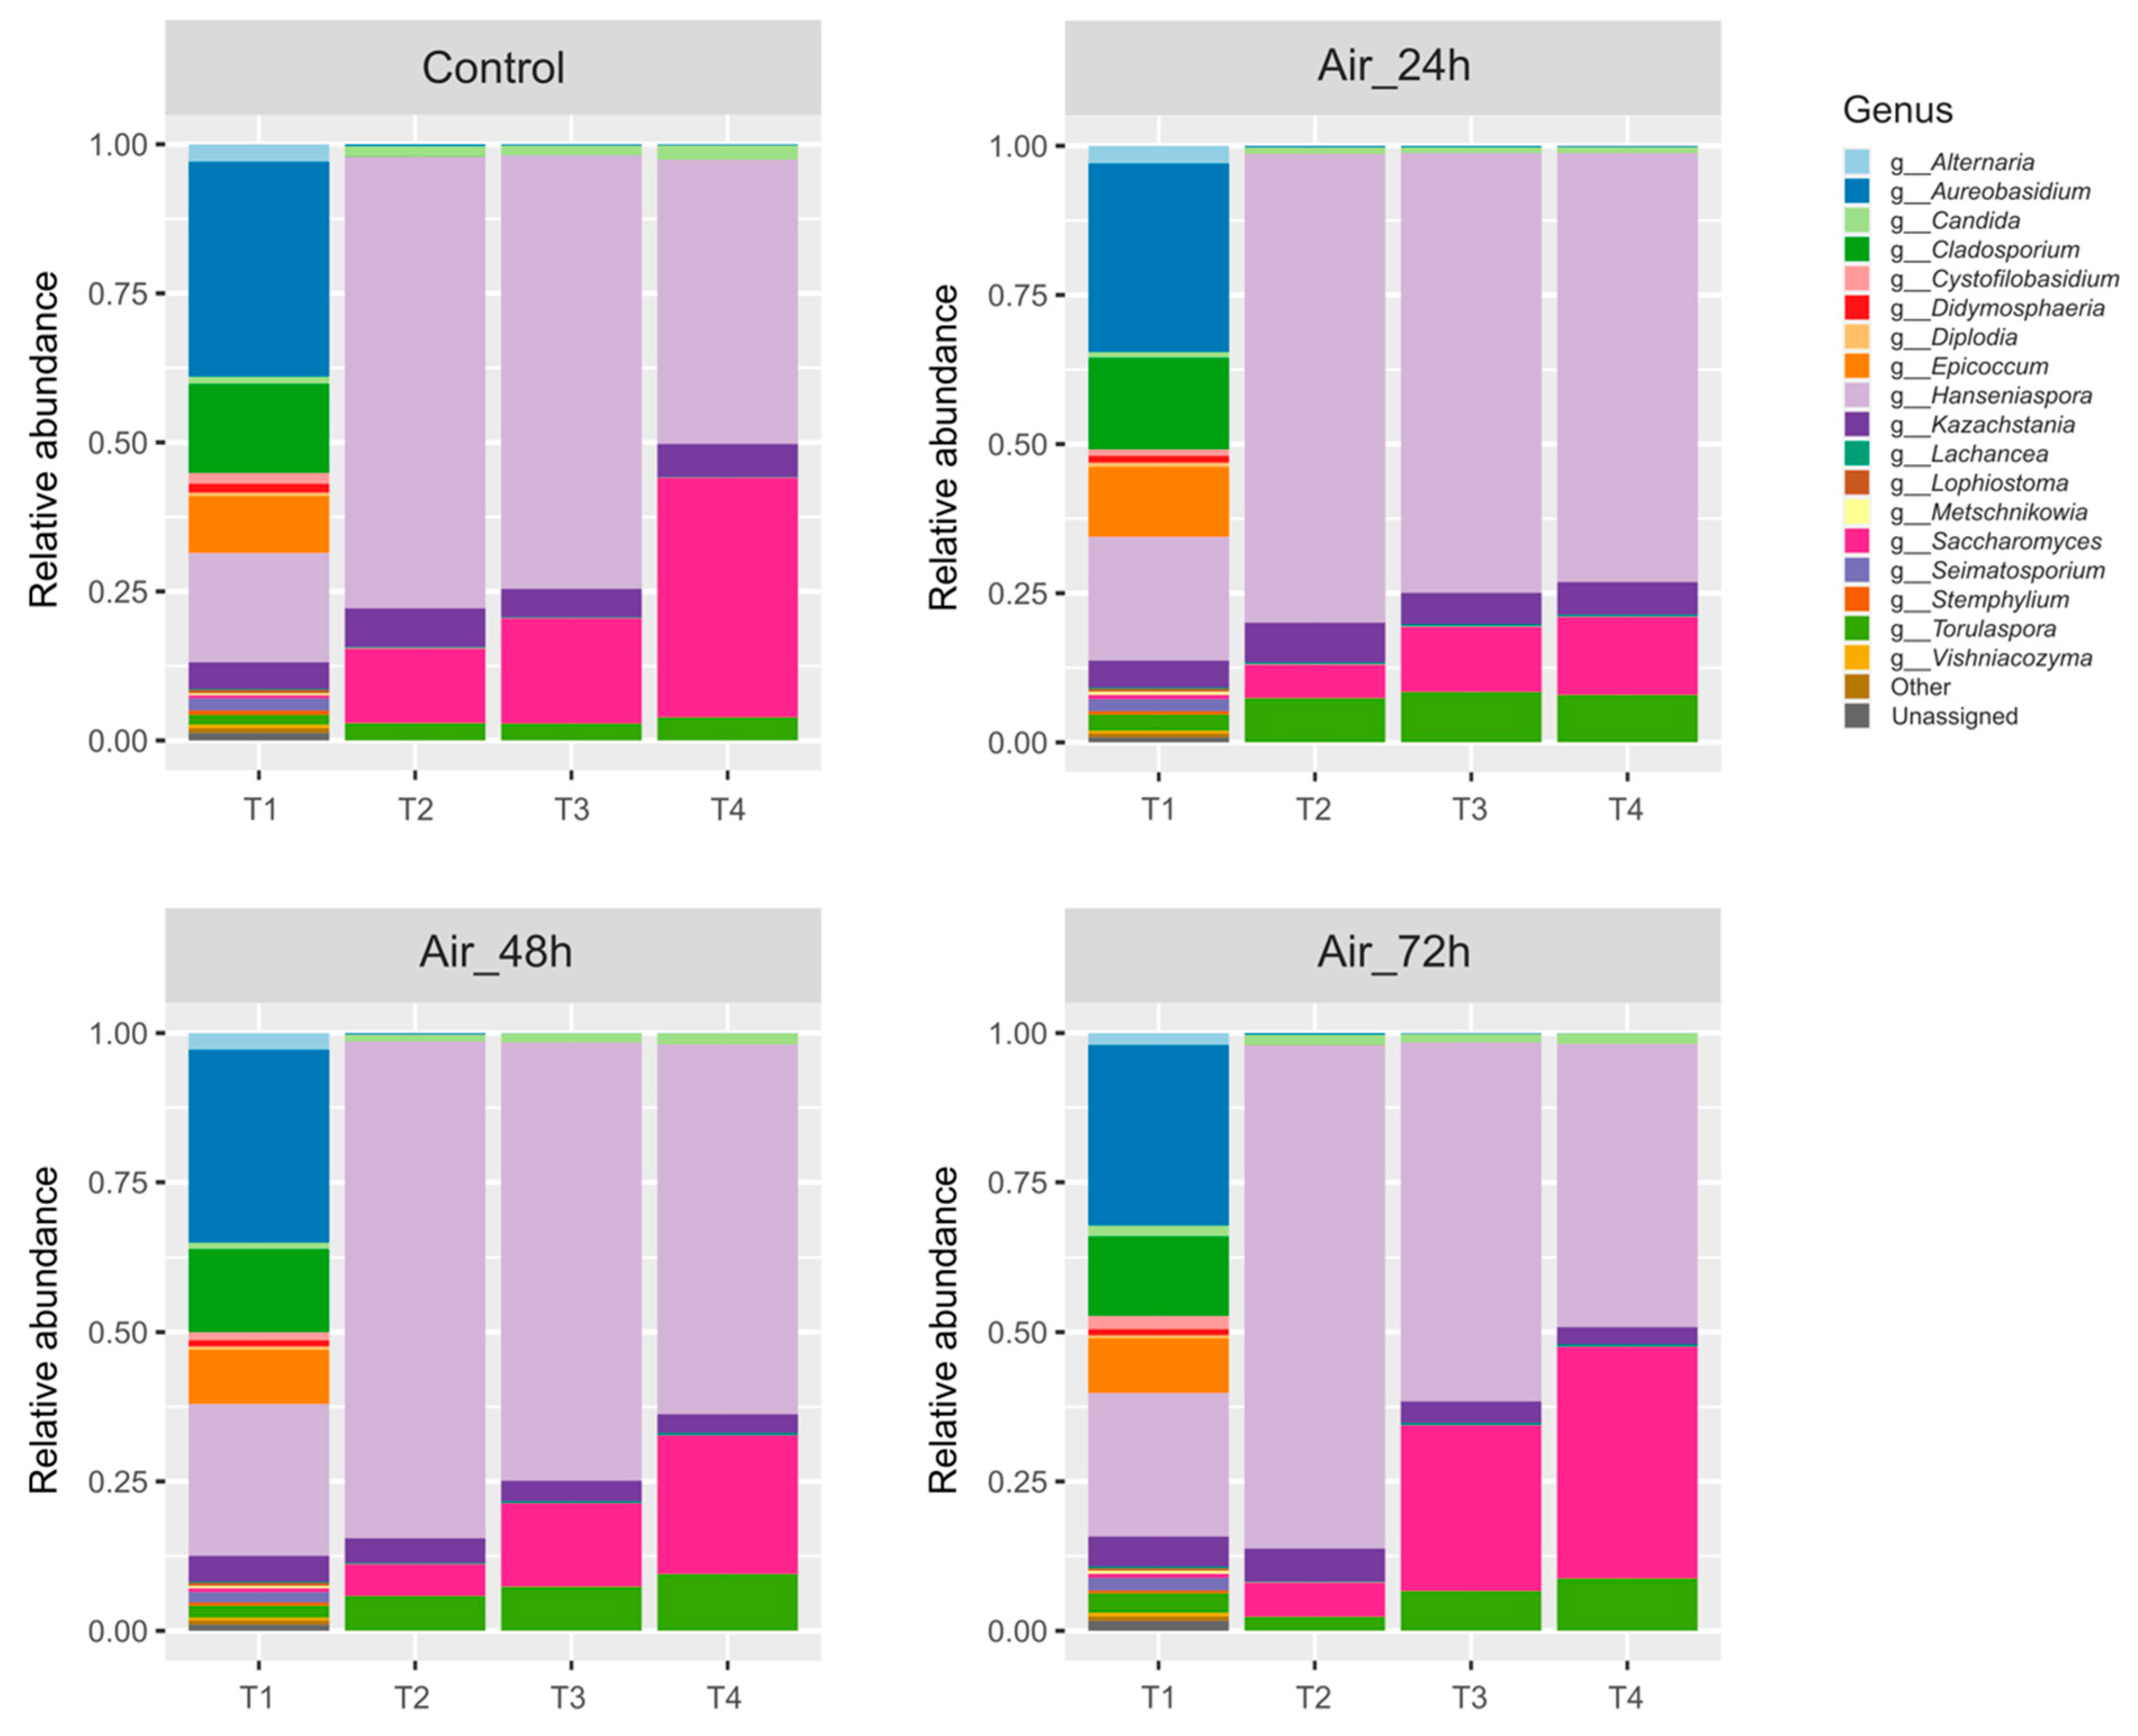
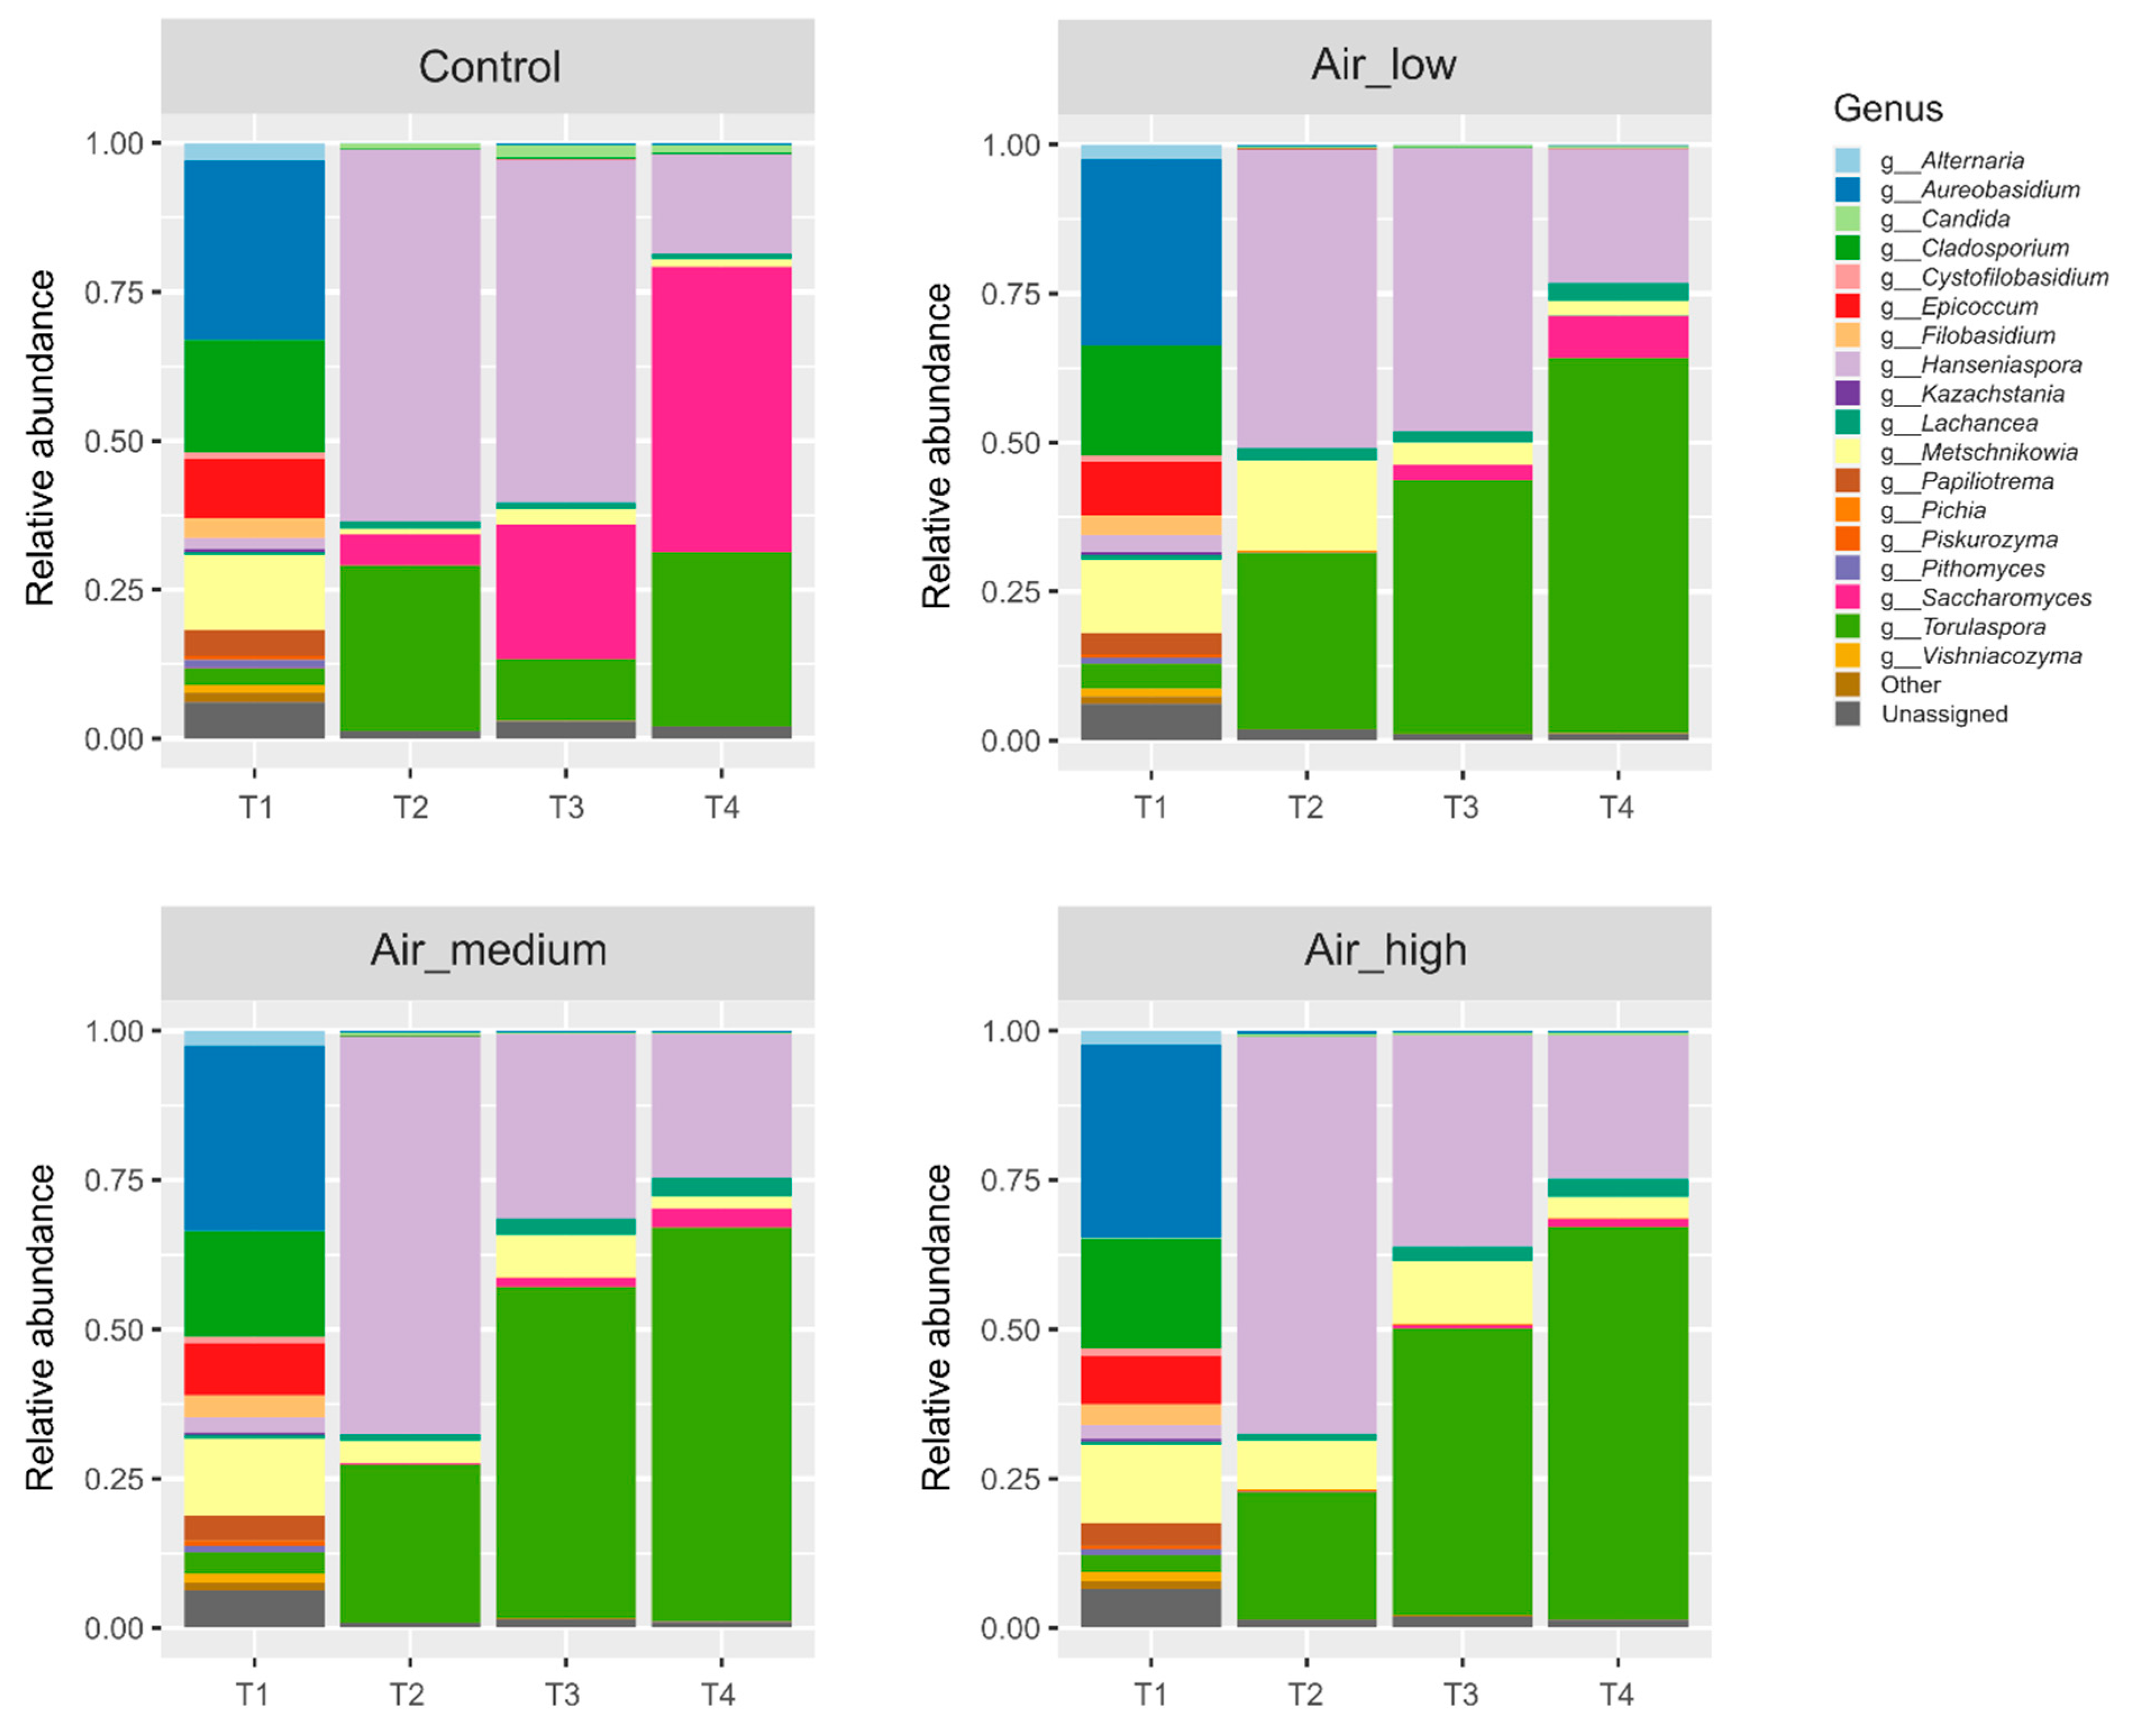
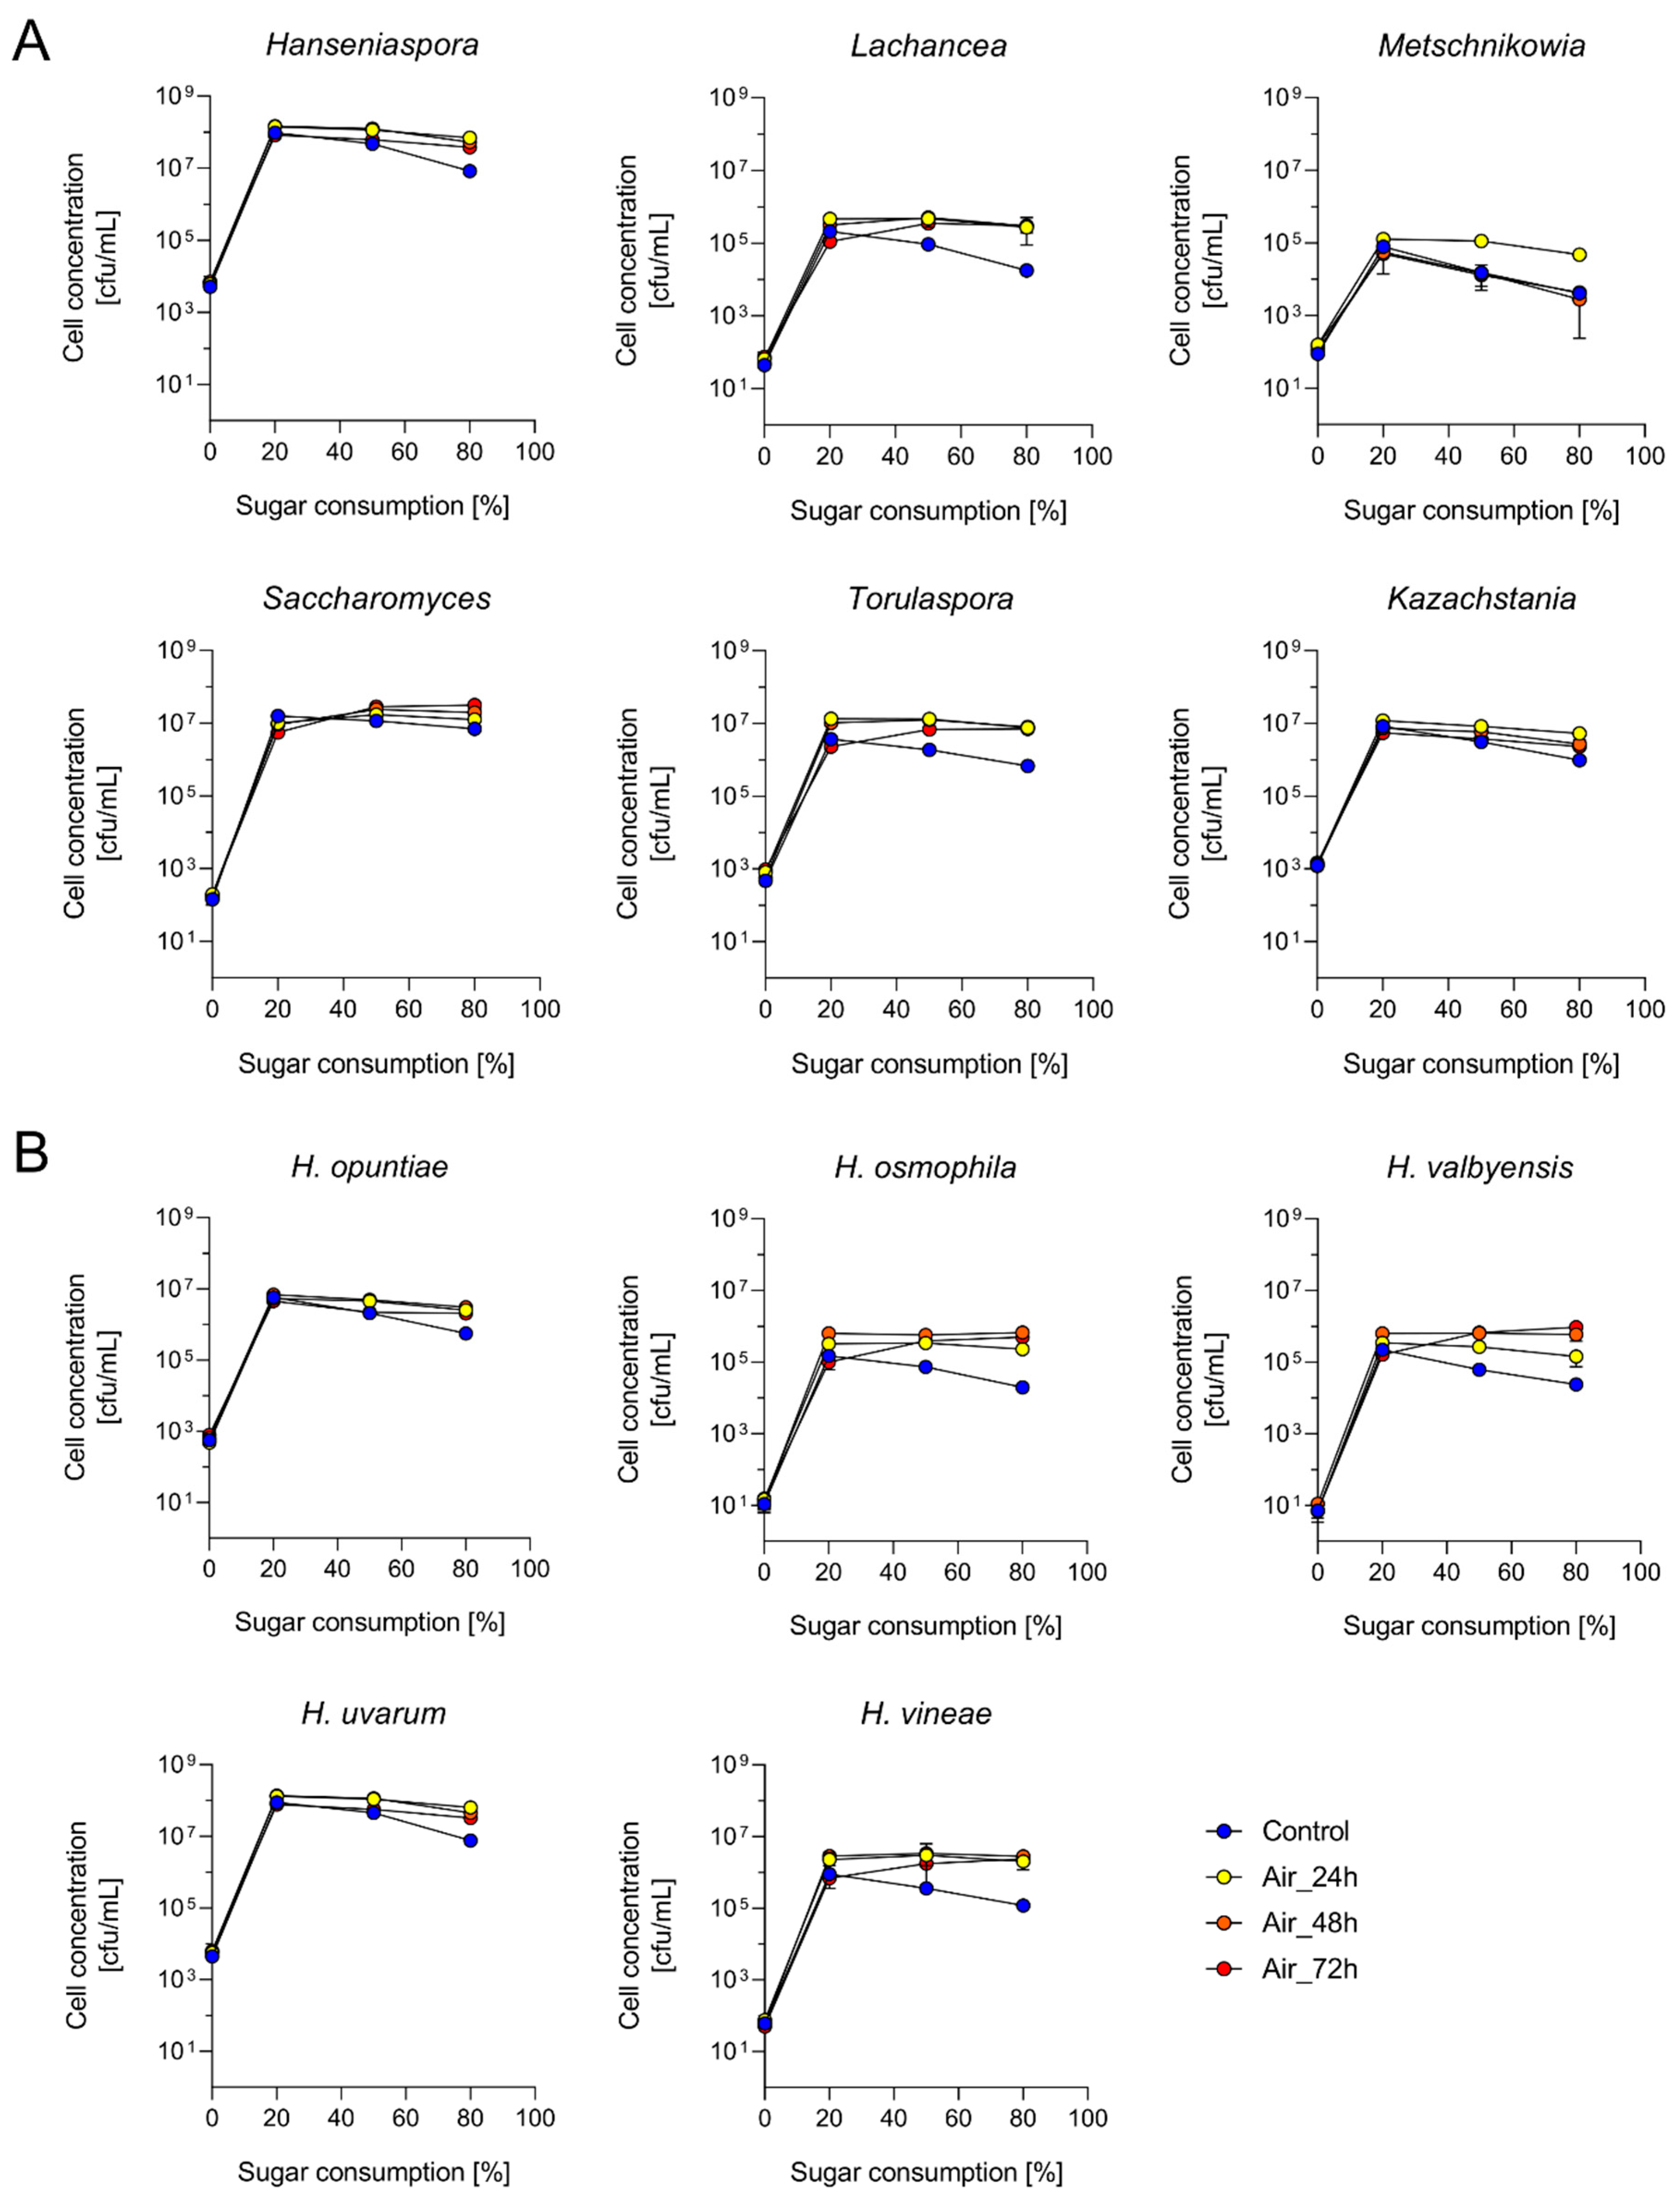
3.2. Yeast Populations Are Subtly Shaped by the Timing of Aeration
3.3. Chemical Composition and Volatile Profile
4. Discussion
Supplementary Materials
Author Contributions
Funding
Institutional Review Board Statement
Informed Consent Statement
Data Availability Statement
Acknowledgments
Conflicts of Interest
References
- Jolly, N.P.; Varela, C.; Pretorius, I.S. Not your ordinary yeast: Non-Saccharomyces yeasts in wine production uncovered. FEMS Yeast Res. 2014, 14, 215–237. [Google Scholar] [CrossRef] [Green Version]
- Medina, K.; Boido, E.; Farina, L.; Gioia, O.; Gomez, M.E.; Barquet, M.; Gaggero, C.; Dellacassa, E.; Carrau, F. Increased flavour diversity of Chardonnay wines by spontaneous fermentation and co-fermentation with Hanseniaspora vineae. Food Chem. 2013, 141, 2513–2521. [Google Scholar] [CrossRef]
- Uzkuc, N.M.C.; Sisli, B.; Ay, M.; Togay, S.O.; Yuceer, Y.K.; Bayhan, A.; Toklucu, A.K. Effects of spontaneous fermentation on Karalahna and Cabernet Sauvignon young red wines: Volatile compounds, sensory profiles and identification of autochthonous yeasts. Eur. Food Res. Technol. 2020, 246, 81–92. [Google Scholar] [CrossRef]
- Varela, C.; Siebert, T.; Cozzolino, D.; Rose, L.; McLean, H.; Henschke, P.A. Discovering a chemical basis for differentiating wines made by fermentation with ’wild’ indigenous and inoculated yeasts: Role of yeast volatile compounds. Aust. J. Grape Wine Res. 2009, 15, 238–248. [Google Scholar] [CrossRef]
- Fleet, G.H. Wine yeasts for the future. FEMS Yeast Res. 2008, 8, 979–995. [Google Scholar] [CrossRef] [PubMed] [Green Version]
- Fleet, G.; Prakitchaiwattana, C.; Beh, S.; Heard, G. The yeast ecology of wine grapes. In Biodiversity and Biotechnology of Wine Yeast; Ciani, M., Ed.; Research Signpost: Kerala, India, 2002; pp. 1–17. [Google Scholar]
- Heard, G. Novel yeasts in winemaking-looking to the future. Food Aust. 1999, 51, 347–352. [Google Scholar]
- Romano, P.; Fiore, C.; Paraggio, M.; Caruso, M.; Capece, A. Function of yeast species and strains in wine flavour. Int. J. Food Microbiol. 2003, 86, 169–180. [Google Scholar] [CrossRef]
- Beltran, G.; Torija, M.J.; Novo, M.; Ferrer, N.; Poblet, M.; Guillamon, J.M.; Rozes, N.; Mas, A. Analysis of yeast populations during alcoholic fermentation: A six year follow-up study. Syst. Appl. Microbiol. 2002, 25, 287–293. [Google Scholar] [CrossRef] [PubMed]
- Combina, M.; Elia, A.; Mercado, L.; Catania, C.; Ganga, A.; Martinez, C. Dynamics of indigenous yeast populations during spontaneous fermentation of wines from Mendoza, Argentina. Int. J. Food Microbiol. 2005, 99, 237–243. [Google Scholar] [CrossRef]
- Fleet, G.H.; Heard, G.M. Yeasts: Growth during fermentation. In Wine Microbiology and Biotechnology; Fleet, G.H., Ed.; Harwood Academic: Chur, Switzerland, 1993; pp. 27–54. [Google Scholar]
- Fleet, G.H.; Lafonlafourcade, S.; Ribereaugayon, P. Evolution of yeasts and lactic acid bacteria during fermentation and storage of Bordeaux wines. Appl. Environ. Microbiol. 1984, 48, 1034–1038. [Google Scholar] [CrossRef] [Green Version]
- Albertin, W.; Miot-Sertier, C.; Bely, M.; Marullo, P.; Coulon, J.; Moine, V.; Colonna-Ceccaldi, B.; Masneuf-Pomarede, I. Oenological prefermentation practices strongly impact yeast population dynamics and alcoholic fermentation kinetics in Chardonnay grape must. Int. J. Food Microbiol. 2014, 178, 87–97. [Google Scholar] [CrossRef] [PubMed]
- Bagheri, B.; Bauer, F.F.; Setati, M.E. The diversity and dynamics of indigenous yeast communities in grape must from vineyards employing different agronomic practices and their influence on wine fermentation. S. Afr. J. Enol. Vitic. 2015, 36, 243–251. [Google Scholar] [CrossRef] [Green Version]
- Bokulich, N.A.; Thorngate, J.H.; Richardson, P.M.; Mills, D.A. Microbial biogeography of wine grapes is conditioned by cultivar, vintage, and climate. Proc. Natl. Acad. Sci. USA 2014, 111, E139–E148. [Google Scholar] [CrossRef] [Green Version]
- Morgan, S.C.; Scholl, C.M.; Benson, N.L.; Stone, M.L.; Durall, D.M. Sulfur dioxide addition at crush alters Saccharomyces cerevisiae strain composition in spontaneous fermentations at two Canadian wineries. Int. J. Food Microbiol. 2017, 244, 96–102. [Google Scholar] [CrossRef] [PubMed]
- Morrison-Whittle, P.; Lee, S.A.; Goddard, M.R. Fungal communities are differentially affected by conventional and biodynamic agricultural management approaches in vineyard ecosystems. Agric. Ecosyst. Environ. 2017, 246, 306–313. [Google Scholar] [CrossRef]
- Bagheri, B.; Bauer, F.F.; Cardinali, G.; Setati, M.E. Ecological interactions are a primary driver of population dynamics in wine yeast microbiota during fermentation. Sci. Rep. 2020, 10, 1–2. [Google Scholar] [CrossRef] [Green Version]
- Egli, C.M.; Edinger, W.D.; Mitrakul, C.M.; Henick-Kling, T. Dynamics of indigenous and inoculated yeast populations and their effect on the sensory character of Riesling and Chardonnay wines. J. Appl. Microbiol. 1998, 85, 779–789. [Google Scholar] [CrossRef] [PubMed]
- Morgan, S.C.; Tantikachornkiat, M.; Scholl, C.M.; Benson, N.L.; Cliff, M.A.; Durall, D.M. The effect of sulfur dioxide addition at crush on the fungal and bacterial communities and the sensory attributes of Pinot gris wines. Int. J. Food Microbiol. 2019, 290, 1–14. [Google Scholar] [CrossRef]
- Cuijvers, K.; Van den Heuvel, S.; Varela, C.; Rullo, M.; Solomon, M.; Schmidt, S.; Borneman, A. Alterations in yeast species composition of uninoculated wine ferments by the addition of sulphur dioxide. Fermentation 2020, 6, 62. [Google Scholar] [CrossRef]
- Blateyron, L.; Sablayrolles, J. Stuck and slow fermentations in enology: Statistical study of causes and effectiveness of combined additions of oxygen and diammonium phosphate. J. Biosci. Bioeng. 2001, 91, 184–189. [Google Scholar] [CrossRef]
- Fornairon-Bonnefond, C.; Aguera, E.; Deytieux, C.; Sablayrolles, J.M.; Salmon, J.M. Impact of oxygen addition during enological fermentation on sterol contents in yeast lees and their reactivity towards oxygen. J. Biosci. Bioeng. 2003, 95, 496–503. [Google Scholar] [CrossRef]
- Larue, F.; Lafon-Lafourcade, S.; Ribéreau-Gayon, P. Relationship between the sterol content of yeast cells and their fermentation activity in grape must. Appl. Environ. Microbiol. 1980, 39, 808–811. [Google Scholar] [CrossRef] [Green Version]
- Mauricio, J.C.; Moreno, J.; Zea, L.; Ortega, J.M.; Medina, M. The effects of grape must fermentation conditions on volatile alcohols and esters formed by Saccharomyces cerevisiae. J. Sci. Food Agric. 1997, 75, 155–160. [Google Scholar] [CrossRef]
- Blateyron, L.; Aguera, E.; Dubois, C.; Gerland, C.; Sablayrolles, J.M. Control of oxygen additions during alcoholic fermentations. Vitic. Enol. Sci. 1998, 53, 131–135. [Google Scholar]
- Sablayrolles, J.M.; Dubois, C.; Manginot, C.; Roustan, J.L.; Barre, P. Effectiveness of combined ammoniacal nitrogen and oxygen additions for completion of sluggish and stuck wine fermentations. J. Ferment. Bioeng. 1996, 82, 377–381. [Google Scholar] [CrossRef]
- Delfini, C.; Conterno, L.; Giacosa, D.; Cocito, S.; Ravaglia, S.; Bardi, L. Influence of clarification and suspended solid contact on oxygen demand and long-chain fatty acid contents of free run, macerated and pressed grape musts, in relation to acetic acid production. Vitic. Enol. Sci. 1992, 47, 69–75. [Google Scholar]
- Valero, E.; Moyano, L.; Millan, M.C.; Medina, M.; Ortega, J.M. Higher alcohols and esters production by Saccharomyces cerevisiae. Influence of the initial oxygenation of the grape must. Food Chem. 2002, 78, 57–61. [Google Scholar] [CrossRef]
- Varela, C.; Torrea, D.; Schmidt, S.A.; Ancin-Azpilicueta, C.; Henschke, P.A. Effect of oxygen and lipid supplementation on the volatile composition of chemically defined medium and Chardonnay wine fermented with Saccharomyces cerevisiae. Food Chem. 2012, 135, 2863–2871. [Google Scholar] [CrossRef] [PubMed]
- McRae, J.M.; Day, M.P.; Bindon, K.A.; Kassara, S.; Schmidt, S.A.; Schulkin, A.; Kolouchova, R.; Smith, P.A. Effect of early oxygen exposure on red wine colour and tannins. Tetrahedron 2015, 71, 3131–3137. [Google Scholar] [CrossRef]
- Bekker, M.Z.; Day, M.P.; Holt, H.; Wilkes, E.; Smith, P.A. Effect of oxygen exposure during fermentation on volatile sulfur compounds in Shiraz wine and a comparison of strategies for remediation of reductive character. Aust. J. Grape Wine Res. 2016, 22, 24–35. [Google Scholar] [CrossRef]
- Varela, C.; Pizarro, F.; Agosin, E. Biomass content governs fermentation rate in nitrogen-deficient wine musts. Appl. Environ. Microbiol. 2004, 70, 3392–3400. [Google Scholar] [CrossRef] [Green Version]
- Bizaj, E.; Cordente, A.G.; Bellon, J.R.; Raspor, P.; Curtin, C.D.; Pretorius, I.S. A breeding strategy to harness flavor diversity of Saccharomyces interspecific hybrids and minimize hydrogen sulfide production. FEMS Yeast Res. 2012, 12, 456–465. [Google Scholar] [CrossRef]
- Siebert, T.E.; Solomon, M.R.; Pollnitz, A.P.; Jeffery, D.W. Selective determination of volatile sulfur compounds in wine by gas chromatography with sulfur chemiluminescence detection. J. Agric. Food Chem. 2010, 58, 9454–9462. [Google Scholar] [CrossRef]
- Bokulich, N.A.; Mills, D.A. Improved selection of internal transcribed spacer-specific primers enables quantitative, ultra-high-throughput profiling of fungal communities. Appl. Environ. Microbiol. 2013, 79, 2519–2526. [Google Scholar] [CrossRef] [Green Version]
- Sternes, P.R.; Lee, D.; Kutyna, D.R.; Borneman, A.R. A combined meta-barcoding and shotgun metagenomic analysis of spontaneous wine fermentation. Gigascience 2017, 6, gix040. [Google Scholar] [CrossRef] [Green Version]
- Bolger, A.M.; Lohse, M.; Usadel, B. Trimmomatic: A flexible trimmer for Illumina sequence data. Bioinformatics 2014, 30, 2114–2120. [Google Scholar] [CrossRef] [Green Version]
- Martin, M. Cutadapt removes adapter sequences from high-throughput sequencing reads. EMBnet. J. 2011, 17, 10–12. [Google Scholar] [CrossRef]
- Magoc, T.; Salzberg, S.L. FLASH: Fast length adjustment of short reads to improve genome assemblies. Bioinformatics 2011, 27, 2957–2963. [Google Scholar] [CrossRef]
- Edgar, R.C. Search and clustering orders of magnitude faster than BLAST. Bioinformatics 2010, 26, 2460–2461. [Google Scholar] [CrossRef] [PubMed] [Green Version]
- Mahe, F.; Rognes, T.; Quince, C.; de Vargas, C.; Dunthorn, M. Swarm: Robust and fast clustering method for amplicon-based studies. PeerJ 2014, 2, e593. [Google Scholar] [CrossRef] [Green Version]
- Caporaso, J.G.; Kuczynski, J.; Stombaugh, J.; Bittinger, K.; Bushman, F.D.; Costello, E.K.; Fierer, N.; Pena, A.G.; Goodrich, J.K.; Gordon, J.I.; et al. QIIME allows analysis of high-throughput community sequencing data. Nat. Methods 2010, 7, 335–336. [Google Scholar] [CrossRef] [PubMed] [Green Version]
- McMurdie, P.J.; Holmes, S. Phyloseq: An R package for reproducible interactive analysis and graphics of microbiome census data. PLoS ONE 2013, 8, e61217. [Google Scholar] [CrossRef] [Green Version]
- Oksanen, J.; Blanchet, G.; Friendly, M.; Kindt, R.; Legendre, P.; McGlinn, D.; Minchin, P.; O’Hara, R.; Simpson, G.; Solymos, P.; et al. Vegan: Community Ecology Package. R Package Version 2.5.4. Available online: https://CRAN.R-project.org/package=vegan (accessed on 30 June 2019).
- Lahti, L.; Shetty, S. Tools for Microbiome Analysis in R. Version 1.9.1. Available online: http://microbiome.github.com/microbiome (accessed on 30 June 2019).
- Wickham, H. Ggplot2: Elegant Graphics for Data Analysis; Springer: New York, NY, USA, 2009. [Google Scholar]
- R Core Team. R: A Language and Environment for Statistical Computing. Available online: http://www.R-project.org/ (accessed on 3 March 2018).
- De Mendiburu, F.; Yaseen, M. Agricolae: Statistical Procedures for Agricultural Research. Available online: https://myaseen208.github.io/agricolae/https://cran.r-project.org/package=agricolae (accessed on 12 November 2020).
- Lê, S.; Josse, J.; Husson, F. FactoMineR: An R package for multivariate analysis. J. Stat. Softw. 2008, 25, 1–18. [Google Scholar] [CrossRef] [Green Version]
- Dowle, M.; Srinivasan, A. Data. Table: Extension of ‘Data.frame’. Available online: https://CRAN.R-project.org/package=data.table (accessed on 12 November 2020).
- Liland, K.H.; Almøy, T.; Mevik, B.H. Optimal choice of baseline correction for multivariate calibration of spectra. Appl. Spectrosc. 2010, 64, 1007–1016. [Google Scholar] [CrossRef] [PubMed]
- Denney, W.; Duvvuri, S.; Buckeridge, C. Simple, automatic noncompartmental analysis: The PKNCA R package. J. Pharm. Pharm. 2015, 42, 11–107. [Google Scholar]
- Day, M.P.; Espinase Nandorfy, D.; Bekker, M.Z.; Bindon, K.A.; Solomon, M.; Smith, P.A.; Schmidt, S.A. Aeration of Vitis vinifera Shiraz fermentation and its effect on wine chemical composition and sensory attributes. Aust. J. Grape Wine Res. 2021. [Google Scholar] [CrossRef]
- Day, M.P.; Schmidt, S.A.; Smith, P.A.; Wilkes, E.N. Use and impact of oxygen during winemaking. Aust. J. Grape Wine Res. 2015, 21, 693–704. [Google Scholar] [CrossRef]
- Restrepo, S.; Espinoza, L.; Ceballos, A.; Urtubia, A. Production of fatty acids during alcoholic wine fermentation under selected temperature and aeration conditions. Am. J. Enol. Vitic. 2019, 70, 169–176. [Google Scholar] [CrossRef]
- Yan, G.L.; Zhang, B.Q.; Joseph, L.; Waterhouse, A.L. Effects of initial oxygenation on chemical and aromatic composition of wine in mixed starters of Hanseniaspora vineae and Saccharomyces cerevisiae. Food Microbiol. 2020, 90, 103460. [Google Scholar] [CrossRef]
- Englezos, V.; Cravero, F.; Torchio, F.; Rantsiou, K.; Ortiz-Julien, A.; Lambri, M.; Gerbi, V.; Rolle, L.; Cocolin, L. Oxygen availability and strain combination modulate yeast growth dynamics in mixed culture fermentations of grape must with Starmerella bacillaris and Saccharomyces cerevisiae. Food Microbiol. 2018, 69, 179–188. [Google Scholar] [CrossRef]
- Hansen, E.H.; Nissen, P.; Sommer, P.; Nielsen, J.C.; Arneborg, N. The effect of oxygen on the survival of non-Saccharomyces yeasts during mixed culture fermentations of grape juice with Saccharomyces cerevisiae. J. Appl. Microbiol. 2001, 91, 541–547. [Google Scholar] [CrossRef]
- Shekhawat, K.; Bauer, F.F.; Setati, M.E. Impact of oxygenation on the performance of three non-Saccharomyces yeasts in co-fermentation with Saccharomyces cerevisiae. Appl. Microbiol. Biotechnol. 2017, 101, 2479–2491. [Google Scholar] [CrossRef] [PubMed]
- Bagheri, B.; Bauer, F.F.; Setati, M.E. The impact of Saccharomyces cerevisiae on a wine yeast consortium in natural and inoculated fermentations. Front. Microbiol. 2017, 8, 1988. [Google Scholar] [CrossRef] [PubMed]
- Wang, C.; Mas, A.; Esteve-Zarzoso, B. The Interaction between Saccharomyces cerevisiae and Non-Saccharomyces yeast during alcoholic fermentation is species and strain specific. Front. Microbiol. 2016, 7, 502. [Google Scholar] [CrossRef] [Green Version]
- Ciani, M.; Beco, L.; Comitini, F. Fermentation behaviour and metabolic interactions of multistarter wine yeast fermentations. Int. J. Food Microbiol. 2006, 108, 239–245. [Google Scholar] [CrossRef]
- Harle, O.; Legrand, J.; Tesniere, C.; Pradal, M.; Mouret, J.R.; Nidelet, T. Investigations of the mechanisms of interactions between four non-conventional species with Saccharomyces cerevisiae in oenological conditions. PLoS ONE 2020, 15, e0233285. [Google Scholar] [CrossRef]
- Shekhawat, K.; Porter, T.J.; Bauer, F.F.; Setati, M.E. Employing oxygen pulses to modulate Lachancea thermotolerans-Saccharomyces cerevisiae Chardonnay fermentations. Ann. Microbiol. 2018, 68, 93–102. [Google Scholar] [CrossRef]
- Bertrand, A.; Torresalegre, V. Influence of oxygen added to grape must on the synthesis of secondary products of the alcoholic fermentation. Sci. Des Aliment. 1984, 4, 45–64. [Google Scholar]
- Farina, L.; Medina, K.; Urruty, M.; Boido, E.; Dellacassa, E.; Carrau, F. Redox effect on volatile compound formation in wine during fermentation by Saccharomyces cerevisiae. Food Chem. 2012, 134, 933–939. [Google Scholar] [CrossRef]
- Plata, C.; Mauricio, J.C.; Millan, C.; Ortega, J.M. Influence of glucose and oxygen on the production of ethyl acetate and isoamyl acetate by a Saccharomyces cerevisiae strain during alcoholic fermentation. World J. Microbiol. Biotechnol. 2005, 21, 115–121. [Google Scholar] [CrossRef]
- Tronchoni, J.; Curiel, J.A.; Saenz-Navajas, M.P.; Morales, P.; de-la-Fuente-Blanco, A.; Fernandez-Zurbano, P.; Ferreira, V.; Gonzalez, R. Aroma profiling of an aerated fermentation of natural grape must with selected yeast strains at pilot scale. Food Microbiol. 2018, 70, 214–223. [Google Scholar] [CrossRef] [PubMed]


| Vintage 2019 | ||||||
|---|---|---|---|---|---|---|
| Compound | Control | Air_24 | Air_48 | Air_72 | F Value | p Value |
| Alcohol [% v/v] | 14.4 ± 0.1 | 14.7 ± 0.2 | 14.9 ± 0.3 | 14.2 ± 0.4 | 4.4 | 0.048 |
| Residual sugar [g/L] | 0.0 ± 0.0 | 0.4 ± 0.3 | 0.0 ± 0.0 | 0.0 ± 0.0 | 2.8 | 0.120 |
| Glycerol [g/L] | 7.9 ± 0 b | 9.9 ± 0.2 a | 9.6 ± 0.8 a | 8.7 ± 0.4 a,b | 10.6 | 0.005 |
| Malic acid [g/L] | 0.4 ± 0 c | 2.6 ± 0.1 a | 2.6 ± 0.1 a | 2.2 ± 0.1 b | 419.8 | 0.000 |
| Succinic acid [g/L] | 0.6 ± 0.1 c | 0.8 ± 0 b | 0.7 ± 0.1 b,c | 1.3 ± 0.1 a | 37.6 | 0.000 |
| Acetic acid [mg/L] | 335 ± 15 b | 464 ± 49 a | 413 ± 39 a,b | 227 ± 9 c | 21.2 | 0.001 |
| Ethyl acetate [mg/L] | 124 ± 7 b | 136 ± 7 b | 160 ± 23 b | 252 ± 13 a | 37.9 | 0.000 |
| Total esters [mg/L] 1 | 1.9 ± 0.0 a | 0.9 ± 0.0 b | 1.1 ± 0.1 b | 1.8 ± 0.1 a | 94.0 | 0.000 |
| Total higher alcohols [mg/L] | 199 ± 15 | 209 ± 3 | 199 ± 23 | 231 ± 10 | 2.2 | 0.173 |
| Total volatile acids [mg/L] 2 | 8.5 ± 0.1 a | 6.3 ± 0.2 c | 6.8 ± 0.1 c | 7.8 ± 0.4 b | 59.2 | 0.000 |
| Total LMWSC [µg/L] | 32 ± 1 | 19 ± 5 | 22 ± 6 | 29 ± 9 | 3.8 | 0.066 |
| Vintage 2020 | ||||||
|---|---|---|---|---|---|---|
| Compound | Control | Air_Low | Air_Medium | Air_High | F Value | p Value |
| Alcohol [% v/v] | 12.7 ± 0.1 a | 12.8 ± 0.1 a | 12.4 ± 0.1 b | 12.2 ± 0.1 c | 25.2 | 0.000 |
| Residual sugar [g/L] | 0.0 ± 0.0 | 0.0 ± 0.0 | 0.0 ± 0.0 | 0.0 ± 0.0 | 0.0 | 1.000 |
| Glycerol [g/L] | 7.9 ± 0.3 | 9 ± 0.2 | 8.3 ± 0.5 | 8.5 ± 0.4 | 3.4 | 0.073 |
| Malic acid [g/L] | 2.3 ± 0.2 a | 2.2 ± 0.4 a | 1.3 ± 0.2 b | 1.3 ± 0.1 b | 16.7 | 0.001 |
| Succinic acid [g/L] | 0.5 ± 0 b | 0.8 ± 0 a | 0.8 ± 0.1 a | 0.8 ± 0.1 a | 46.5 | 0.000 |
| Acetic acid [mg/L] | 293 ± 48 b | 255 ± 46 b | 589 ± 46 a | 685 ± 82 a | 41.4 | 0.000 |
| Ethyl acetate [mg/L] | 229 ± 27 c | 195 ± 26 c | 573 ± 146 b | 879 ± 128 a | 32.0 | 0.000 |
| Total esters [mg/L] 1 | 6.8 ± 0.6 a | 3.4 ± 0.3 b | 4.5 ± 0.1 b | 5.7 ± 0.5 a | 36.6 | 0.000 |
| Total higher alcohols [mg/L] | 93 ± 3 b | 193 ± 10 a | 181 ± 6 a | 190 ± 2 a | 179.5 | 0.000 |
| Total volatile acids [mg/L] 2 | 75 ± 2 | 76 ± 4 | 98 ± 27 | 104 ± 4 | 3.5 | 0.070 |
| Total LMWSC [µg/L] | 6.2 ± 1.2 b | 7.4 ± 0.5 a,b | 8.5 ± 0.9 a | 7.1 ± 0.2 a,b | 4.2 | 0.046 |
Publisher’s Note: MDPI stays neutral with regard to jurisdictional claims in published maps and institutional affiliations. |
© 2021 by the authors. Licensee MDPI, Basel, Switzerland. This article is an open access article distributed under the terms and conditions of the Creative Commons Attribution (CC BY) license (https://creativecommons.org/licenses/by/4.0/).
Share and Cite
Varela, C.; Cuijvers, K.; Van Den Heuvel, S.; Rullo, M.; Solomon, M.; Borneman, A.; Schmidt, S. Effect of Aeration on Yeast Community Structure and Volatile Composition in Uninoculated Chardonnay Wines. Fermentation 2021, 7, 97. https://0-doi-org.brum.beds.ac.uk/10.3390/fermentation7020097
Varela C, Cuijvers K, Van Den Heuvel S, Rullo M, Solomon M, Borneman A, Schmidt S. Effect of Aeration on Yeast Community Structure and Volatile Composition in Uninoculated Chardonnay Wines. Fermentation. 2021; 7(2):97. https://0-doi-org.brum.beds.ac.uk/10.3390/fermentation7020097
Chicago/Turabian StyleVarela, Cristian, Kathleen Cuijvers, Steven Van Den Heuvel, Mark Rullo, Mark Solomon, Anthony Borneman, and Simon Schmidt. 2021. "Effect of Aeration on Yeast Community Structure and Volatile Composition in Uninoculated Chardonnay Wines" Fermentation 7, no. 2: 97. https://0-doi-org.brum.beds.ac.uk/10.3390/fermentation7020097