Article

Quinoa Flour, the Germinated Grain Flour, and Sourdough as Alternative Sources for Gluten-Free Bread Formulation: Impact on Chemical, Textural and Sensorial Characteristics

by
Wendy Franco
1,2,*,
Katherine Evert
1 and
Carina Van Nieuwenhove
3,4
1
Departamento de Ingeniería Química y Bioprocesos, Pontificia Universidad Católica de Chile, Santiago 7820436, Chile
2
Departamento de Ciencias de la Salud, Nutrición y Dietética, Pontificia Universidad Católica de Chile, Santiago 7820436, Chile
3
Centro de Referencia para Lactobacilos (CERELA-CONICET), Chacabuco 145, San Miguel de Tucumán 4000, Argentina
4
Facultad de Ciencias Naturales e IML-Universidad Nacional de Tucumán, Miguel Lillo 205, San Miguel de Tucumán 4000, Argentina
*
Author to whom correspondence should be addressed.
Submission received: 31 May 2021 / Revised: 25 June 2021 / Accepted: 6 July 2021 / Published: 15 July 2021
(This article belongs to the Special Issue Innovations in Sourdough Bread Making)

Abstract

:
The demand for gluten-free breads has increased in the last years, but important quality and nutritional challenges remain unsolved. This research evaluated the addition of quinoa in whole quinoa grain flour, germinated quinoa flour, and quinoa sourdough, as a functional ingredient in the formulation of a rice flour-based bread. Twenty percent (w/w) of the rice flour was replaced with quinoa flour alternatives in bread formulations. The chemical composition, shelf-life, and sensory attributes of the rice-quinoa breads were analyzed. The addition of quinoa in sourdough resulted in breads with a significantly improved protein content at 9.82%, relative to 2.70% in the control breads. The amino acid content in quinoa sourdough breads also was also 5.2, 4.4, 2.6, 3.0, and 2.1 times higher in arginine, glutamic acid, leucine, lysine, and phenylalanine, respectively, relative to control breads with rice flour only. The addition of quinoa sourdough in rice breads also improved the texture, color, and shelf-life (up to 6 days), and thus they became moderately accepted among consumers. Although the germinated quinoa flour addition also resulted in a higher protein (9.77%) and amino acid content, they had a reduced shelf-life (4 days). Similarly, the addition of quinoa flour resulted in a higher protein content (9.61%), but the breads had poor texture attributes and were the least preferred by the consumers.

1. Introduction

Increased attention has been given in recent years to alternative ingredients for the formulation of food products with enhanced nutritional content. Pseudo-cereal, which are grains that belong to the Dicotyledonae family with starch rich seeds, can be used like cereals from the Monocotyledonae family with a substantial nutritional content and functional properties. Quinoa (Chenopidium quinoa Willd) is an ancient Andean pseudo-cereal, known by the Incas as the mother of all grains, that is widely distributed and frequently consumed in the region between Colombia and Argentina. The quinoa’s protein content, which can reach up to 15%, is similar to that of wheat and oat and higher than that of corn, rice, and barley [1]. Of interest to consumers is the fact that quinoa is rich in lysine, threonine, and methionine, which are amino acids not found in other cereals [1]. The intrinsic content of vitamins, minerals (as calcium and iron), fibers, phenolic compound, and essential fatty acids (linolenic acid, C18:3 n-3) is also remarkable in the grain [1]. The content of carbohydrates, such as fructose and glucose, is high in quinoa flour, with a low glycemic index [2]. In addition, quinoa flour does not contain the peptides sequences responsible for gluten intolerance, resulting in a suitable ingredient for the formulation of gluten-free (GF) baked products.
While people with celiac disease need special GF diet to avoid digestive problems, consumers around the globe are opting daily for healthier products that are simple to digest. In general, GF baked products are elaborated with refined flours or starch from potato and corn which have a low content of quality proteins, fiber, calcium, and iron [3]. Therefore, the inclusion of quinoa in the manufacture of GF bread represents an attractive alternative that can compensate the nutritional deficiencies in existing GF products. Breads are a staple worldwide food, as evidenced by the 83,000 million Kg consumed in 2017. Breads have a compound annual growth rate forecast of 1.43% from 2019 to 2024 [4]. Among the bread types of highest demand, functional and green label products are on the rise [4]. The fortification of bread with quinoa is expected to generate premium products due to the nutritional composition of the grain [5].
The fortification of wheat breads with the pseudo-cereal has been carried out at varied proportions. Inclusion of quinoa in wheat breads has resulted in enhanced nutritional value and good acceptability by consumers. Advantageously, the inclusion of up to 20% quinoa in wheat breads was harmless to the rheological properties and texture [6]. Similarly, the incorporation of quinoa flour in GF breads improved the textural and nutritional attributes. The replacement of up to 50% potato starch with whole quinoa flour resulted in breads with softer crumbs, as well as higher protein, mineral, vitamin E, and phenolic compound contents [7]. In contrast to results reported for wheat breads, higher portions of the GF flours can be replaced in GF breads without affecting technological attributes. The replacement of 50% of the rice flour and corn starch with quinoa flour resulted in breads with higher specific volume, homogenous crumb, and little effect in flavor [8].
Sourdough fermentation is a technological process that improves the nutritional, functional, and sensorial properties of breads [9]. Sourdough fermentations are characterized by the conversion of sugars to organic acids and/or ethanol, primarily by lactic acid bacteria (LAB). Recently, we isolated and fully characterized an exopolysaccharide-producer LAB from quinoa dough through spontaneous fermentation [10] This compound has been associated with the improvement of textural attributes due to its hydrocolloidal effect [11,12,13,14]. The use of autochthonous LAB as a starter culture enabled uniform fermentations capable of sustaining maximum growth rates, resulting in complete fermentations. Quinoa sourdough (QSD) has been used to replace gluten-containing wheat flour for the formulation of fortified white bread. Rizzello et al. (2016) reported that the inclusion of 40% QSD in produced breads had enhanced free amino acids, soluble fibers, total phenols content, and a higher antioxidant activity. Other studies have reported that up to 20% replacement did not affect flavor or other sensorial attributes of quinoa-based breads [15,16]. However, little information is available about the impact of quinoa sourdough in gluten-free formulations. Few studies report that sourdough positively impacts volume, texture, and flavor [16,17,18], increases shelf life [19,20], and improves the overall acceptance of breads in comparison to control breads made only with GF flours or starches [17].
Recently, the use of germinated pseudo-cereals has been explored as an alternative to further improve the nutritional content of food products. Cereal germination or malting allows for the enzymatic breakdown of macromolecules in the seeds with an enhanced nutrient bioavailability of different compounds, including vitamins, minerals, and amino acids, and the loss of antinutritional factors, among others [21]. A previous study reported that the formulation of a quinoa-based milk-like beverage with germinated grains resulted in reduced lipid, ash, and starch content, and increased protein concentration (about 1.6 to 4 times) [22]. Miranda-Villa et al. (2018) reported that GF muffins elaborated with germinated quinoa grains had improved protein, minerals, and amino acid concentrations [23]. The addition of the germinated seeds did not affect textural or rheological attributes, and they had a higher overall acceptance than muffins elaborated just with GF flours [23].
Although pseudo-cereals have been studied for the making of GF bread, little information has been reported for the use of quinoa as an ingredient, to our knowledge. Therefore, in this study we aimed to further characterize the inclusion of different forms of quinoa in the GF bread formulation. This study aimed at evaluating the use of whole grain quinoa flour, germinated quinoa flour, and quinoa sourdough in the production of gluten-free bread made with rice flour, potato, and corn starches. It was an additional objective to assess the influence of the quinoa derivatives on the nutritional composition, texture, and sensory attributes of the gluten-free breads.

2. Materials and Methods

2.1. Quinoa Flour

Scarified, de-saponified, and dried quinoa cereal grains were obtained from a local producer at Paredones, Cardenal Caro, Chile (Latitude: −34.6514, Longitude: −71.8997 34°39′5″ South, 71°53′59″ West). Flour was obtained by milling the quinoa seeds in a hammer mill (Model D-7319 electric, sieve size 0.5 mm, Dietz-motoren GrnbH & Co. KG, Dettingen unter Teck, Germany). The resulting flour was stored in airtight sterile containers at room temperature until experimentation.

2.2. Germinated Quinoa Flour

Separately, a portion of the same batch of quinoa seeds were steeped for 2 h at 20 °C. Excess water was then removed, and wet grains were placed in a single layer on a plastic tray before being incubated at 25 °C for 24 h (Memmert incubator, IN-55, Büchenbach, Germany) without sunlight exposure to allow the grains’ germination [23]. The germinated grains were cooled down to 10 °C and then dried (Memmert incubator) at 50 ± 2 °C for 48 h. After this, the germinated grains were milled, as described in Section 2.2.

2.3. Quinoa Sourdough

Pediococcus pentosaceus QB17, an exopolysaccharide-producing LAB recently isolated from quinoa spontaneous sourdough [10], was used as single starter culture. Thus, cells were harvested from MRS overnight activated cultures at 30 ± 2 °C [15], and then centrifuged at 12,000× g for 10 min at 5 °C (Centrifuge 5810; Eppendorf, Hamburg, Germany). They were then washed twice in 0.9% NaCl sterile buffer (pH 7.0) and resuspended in 0.1% peptone water (Sigma Aldrich, Darmstadt, Germany). An initial inoculum of 6 log CFU/g was added to the quinoa/water (DY 200) mixture (1:1), manually mixed, and fermented at 30 ± 2 °C for 16 h. At regular 2 h intervals, samples were taken to evaluate pH (Accumet® Research 25 pH meter, Fisher Scientific, Carlsbad, CA, USA) and for platting to determine LAB colony using deMan, Rogosa, and Sharpe (MRS, Oxoid, Hampshire, United Kingdom) agar. Serial dilutions were performed with peptone water (1%) and spread plated. The MRS agar plates were incubated (Memmert) at 30 ± 2 °C for 48 h.
The titratable acidity of the resulting sourdough were represented as the amount of 0.1 M NaOH (mL, Sigma-Aldrich, Saint Louis, MO, USA) needed to achieve a pH of 8.5. The sourdoughs’ chemical composition (glucose and fructose, and organic acids) were determined by high-performance liquid chromatography (HPLC) using a 30-cm HPX-87 H column (Bio-Rad Laboratories, Hercules, Califonia), as described by McFeeters and Barish (2003) [24]. Samples were prepared for HPLC analysis, as described by Lattanzi et al. (2013) [25].

2.4. Bread Making

Gluten-free (GF) breads were produced following the formulations, as described in Table 1. Dry ingredients were first mixed for 45 s in a Moulinex blender (Moulinex, model QA506GB1, Jiangsu, China) at low speed (70 rpm), tap water at 25 °C was slowly added, and the batter was mixed for 2 min at a medium speed (120 rpm). The mixture was separated in 900 g portions, placed in baking pans (12 cm × 8 cm × 30 cm), and proofed in an oven (UNIQUE, Santiago, Chile) at 30 °C for 2 h. The breads were baked at 190 °C for 45 min with steam during the first 10 min. The bread loaves were cooled at room temperature for an hour and immediately kept in a polyethylene package at room temperature for further analysis. Three independent batches were elaborated, each one composed by three bread loafs.

2.5. Breads’ Proximal Composition Analysis

The cooled breads were analyzed for moisture, total protein, lipid, and ash contents according to the AACC approved methods 44-15A, 46-11A, 30-10.01, 08-01 [26], respectively. Total dietary fiber was determined following the AOAC 991.43 enzymatic-gravimetric method [27]. The total carbohydrate content was calculated by difference (100 − (proteins + lipids + moisture + ash)).

2.6. Breads’ Attributes

The bread attributes were determined after 24 h of bread making, as described below.

2.6.1. Determination of pH and Titrable Acidity

The sourdough and bread pH was determined with a pH-meter (Accumet® Research 25 pH meter, Fisher Scientific, Carlsbad, CA, USA). The total titratable acidity (TTA) was calculated based on the amount of 0.1 M NaOH mL (Sigma-Aldrich, Saint Louis, MO, USA) added to achieve a pH value of 8.5.

2.6.2. Bake Loss

The percentage of bake loss was estimated by using the following formula:
B a k e   l o s s   ( % ) = ( i n i t i a l   b a t t e r   w e i g h t b r e a d   w e i g h t   a f t e r   c o o l i n g ) i n i t i a l   b a t t e r   w e i g h t × 100

2.6.3. Color

The bread was cut in a wooden cut box to obtain slices of 20 mm thickness, and color was measured on the crust and the crumb using a portable colorimeter model CR400 (Konica Minolta Chroma Meters, Tokyo, Japan) using illuminant D65 with a 10° observer. CIE L *-, a *- and b *-values were obtained at five random points of the crust and crumb surfaces.

2.6.4. Texture

The instrumental textural crumb evaluation was performed according to the AACC method 74–09 [26] by using a universal testing machine (QChaida, Dongguan, China). The bread slices were compressed to 40% of their original height with a 35 mm aluminum cylindrical probe. Three loaves and three central slices were evaluated for each bread type. The force was obtained using the software TM2101 (Qchaida) which reported the hardness in Newtons (N). The bread’s texture was determined on the same day of bread making, once the breads were cooled to room temperature.

2.6.5. Shelf-Life and Microbial Quality

The shelf life of the breads was monitored throughout the mold environmental challenge method, as reported by Dal Bello et al. (2007) [28]. Briefly, bread slices were separately packed into polyethylene bags (Ziplock®, SC Johnson, Racine, WI, USA), lightly hand pressed to release oxygen excess, and then closed. The breads were examined for any mold growth during a storage period of 14 days at 25 ± 2 °C. Mold growth was evaluated based on the percentage of the total surface area of each slice where fungal outgrowth occurred. Moldy slices were visibly rated as “<10% moldy”, “10–24% moldy”, “25–49% moldy”, and “>50% moldy”. No visible molds were qualified as “mold free”. Three loaves and three central slices were evaluated for each bread type.

2.6.6. Amino Acids Composition

For amino acid determination, the methods reported by Miranda-Villa (2019) and El-Sohaimy (2019) were followed. Briefly, 10 g samples were hydrolyzed with 6 M HCl for 24 h at 110 °C (Memmert). The excess of HCl was then removed from the 1 mL hydrolyzed samples under vacuum at 80° C with the occasional addition of distilled water, and then evaporated to dryness. The HCl free residue was dissolved in 2 mL of loading buffer (6.2 M, pH 2.2). The prepared samples were analyzed by high performance liquid chromatography (HPLC) with an Amimez C18 column (Bio/Rad Laboratories, Hercules, CA, USA). A flow rate of 0.5 mL/min at 60 °C was used for the separation of components coupled with a UV-Detector (Perkin Elmer R 600 series), after which the derivatization of amino acids with diethyl ethoxymethyllenemalonate was conducted. External standardization of the detector was performed using the amino acid standards (AAS18, Fluka Analytical, Sigma Aldrich, Darmstadt, Germany) [23,29].

2.6.7. Sensory Analysis

Sensory properties of GF breads were examined by 30 untrained panelists (22 female and 8 male, with ages ranging from 30 to 45 years old) who consumed GF breads at least once a week. After a day of bread making, bread slices were presented to the panelists on white plates randomly coded with a three-digit number. Different plates and codes were used for both sensory attributes and acceptability/preference analysis. The panelists were seated in separated tasting boxes which were evenly illuminated with electric bulbs and had free access to water and green apples to cleanse their palate between samples.
The elasticity, crust and crumb color, acid taste and flavor, salty, sweetness, dryness, and aroma were considered as sensory attributes with a scale from 0 to 10, with 10 being the highest score. In order to evaluate the acceptability, a 9-point hedonic scale, where 1 = dislike extremely, 5 = neither like nor dislike, and 9 = like extremely, was used. The sensory scores were obtained by averaging the individual scores for each sub-sample.

2.7. Statistical Analysis

All experiments were carried out in triplicate in two independent assays. Results were analyzed by the analysis of variance (ANOVA) with the Statistical Analysis Systems version 9.0 software (Statistical Analysis System, SAS Institute, Cary, NC, USA). Significant differences were assessed by the Tukey test, including at p < 0.05. In order to evaluate the preferred samples after the sensory analysis, the Friedman test for nonparametric variance analysis with a two-way classification was used.

3. Results and Discussion

3.1. Flours’ Proximal Composition

Table 2 describes the flours’ proximal composition. The quinoa and germinated quinoa flours presented similar moisture content, with a value of 13.71% and 13.76%, respectively, which were significantly lower than the control flour (14.31%). Significant differences were also determined for protein, lipid, ash, carbohydrate, and fiber contents within the three flours evaluated. As expected, the total protein content of both quinoa (15.3%) and germinated quinoa (14.8%) flours were similar but significantly higher than rice flour (9.75%). The lipid content was approximately eight times lower in rice than quinoa flours; however, the carbohydrate value was higher in rice (89.5%) than the quinoa (77.9%) and germinated quinoa (76.4%) flours. While the measured lipid and protein content for quinoa and germinated quinoa flours were in accordance with the values reported by Contreras-Jiménez et al. (2019), slightly higher contents for moisture and carbohydrate were observed [30]. The lowest soluble fiber content was determined for germinated quinoa flour, whereas the lowest insoluble fiber content was determined in rice flour.

3.2. Sourdough Development

The autochthonous P. pentosaceous QB17 strain, which was used as a single starter culture for quinoa sourdough, showed an increase in 2.24 log CFU/g after 16 h of fermentation (Table 3). As the fermentation progressed, the pH decreased from 6.01 to 3.88 as a function of fermentation.
Quinoa sourdough presented a concentration of 18.4 mM of lactic acid and 21.6 mM of acetic acid after 16 h of incubation (Table 4), with a fermentation quotient of 8.52 ± 0.75. Similar values were reported in quinoa sourdough by using the indigenous starter formed by L. plantarum T6B10 and L. rossiae T0A16 [15]. The sourdough proximal characterization showed that the fermentation process did not affect the protein and lipid content when compared to quinoa flour (Table 1 and Table 4). However, as was expected, after fermentation, the carbohydrate content decreased from 77.9 ± 1.52 (in the quinoa flour) to 70.1 ± 1.13% in the sourdough. Changes in total carbohydrate concentrations were expected, as the microbial consortium that drives the sourdough fermentation used the sugars present in the flours. In addition, sourdough fermentation allowed the solubilization of fibers contained in the cereal flours [32]. In our results, a decrease in insoluble fibers from 7.31 ± 0.13% in quinoa flour to 5.50 ± 0.13% in the fermented dough was observed, which corresponded to an increase in soluble fibers from 3.15 ± 0.05% in quinoa flour to 4.50 ± 0.20% in the quinoa sourdough (Table 2 and Table 4).

3.3. Gluten-Free Breads Characterization

The characteristics obtained for different GF bread formulations are given in Table 5.

3.3.1. Color Analysis

In descending order and by visual observation, the crust of QSD bread was more intense than QF and GQ breads (Figure 1). This was corroborated by the L * a * b * analysis, in which QF bread showed the lowest lightness (L *) mean value (61.02) in comparison with GQ and QSD breads, which were 70.01 and 71.65, respectively. In the crust, L * and a * (redness) values were significantly different among quinoa-based breads with a similar b * (yellowness) value. The white’s crumb was also determined for the QF bread (Figure 1, Table 5). Similar changes in color parameters were previously reported when 20% quinoa sourdough was added to the white bread formulation [15].

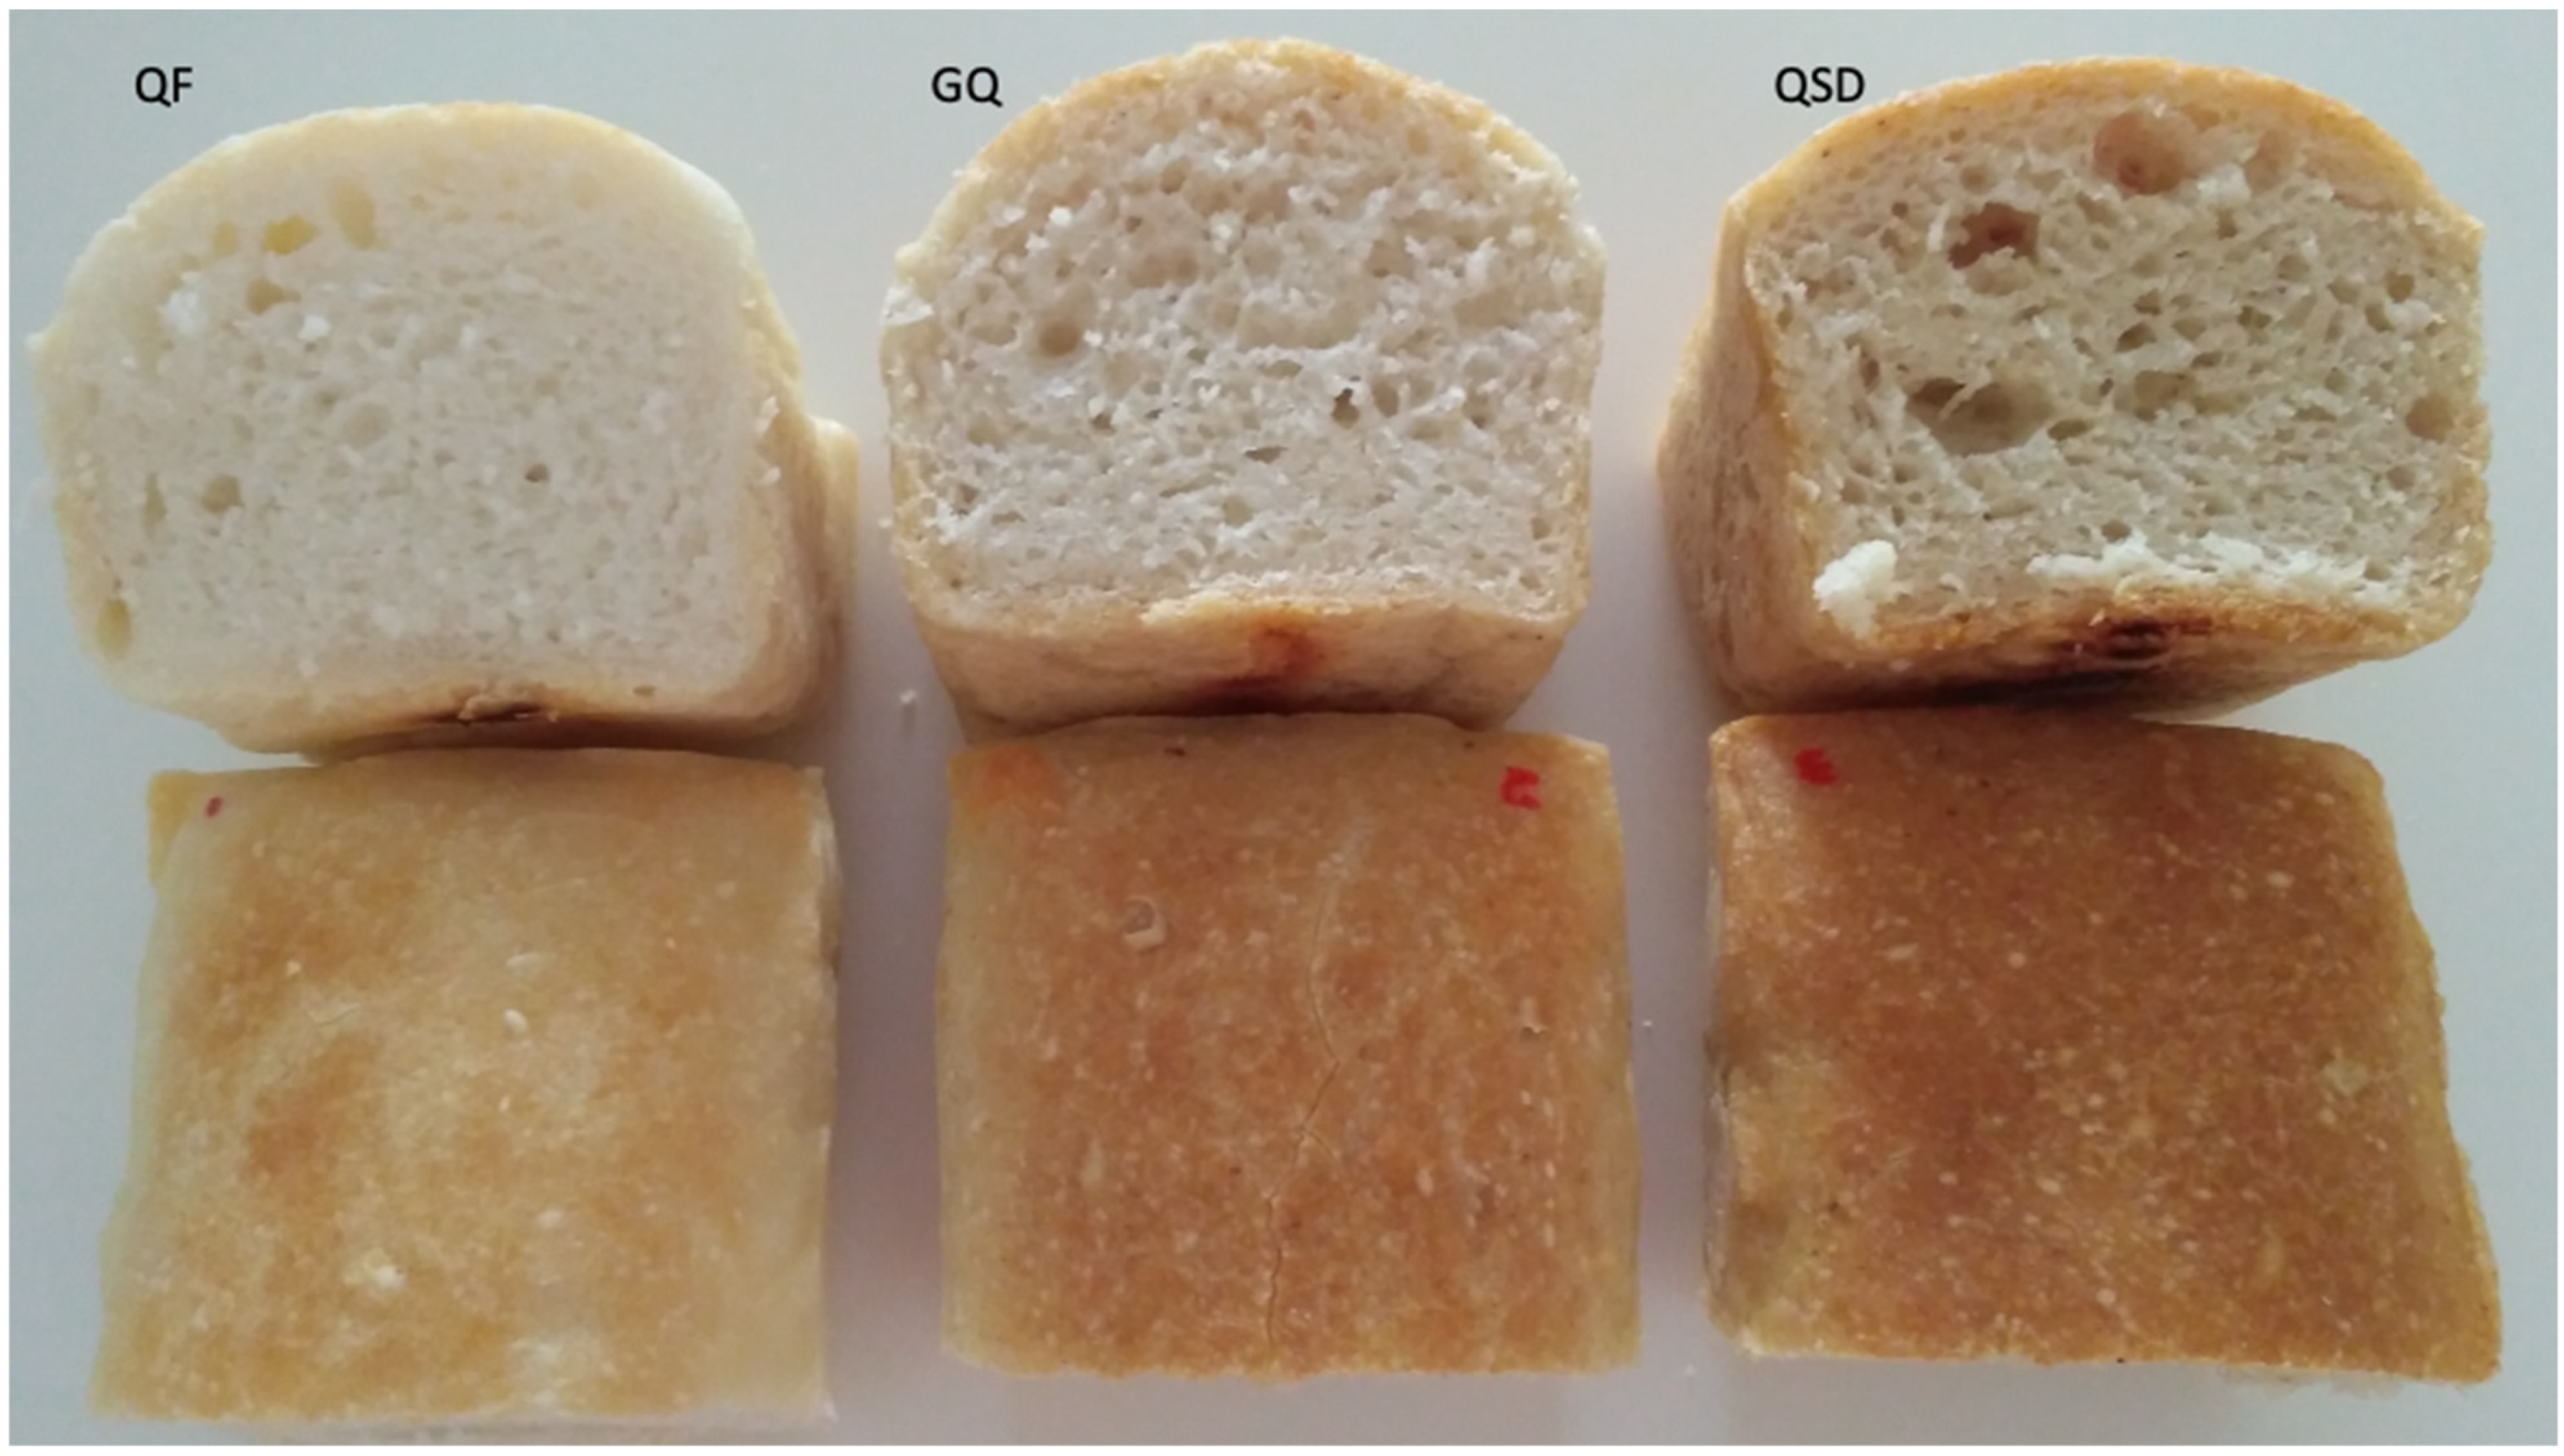
3.3.2. Crumb Analysis

Regarding firmness, the control bread showed the lowest value (22.3 N), while QF bread showed the highest one (59.86 N) (Table 5). Saadat et al. (2020) reported that the replacement of GF flours with quinoa flour affected the hardness of the resulting breads, making the bread harder as the percentage of quinoa flour used increased [33]. Similar results were observed when 30% quinoa flour was used in the formulation of rice-based muffins, which showed firmness values almost twice as high as the control muffins made without the quinoa replacement [23]. The bread firmness is associated with the ability of the dough ingredients to form a carbohydrate–protein network with viscoelastic attributes. In wheat-based breads, the network is easily formed thanks to the gluten proteins; however, in GF flours, the network formation is poor mostly due to the starch properties [34], resulting in breads with tighter crumbs, as is shown in Figure 1 for the quinoa flour bread.
On the other hand, and as reported before, the addition of QSD produced a softened bread structure and only 21.09 N was determined for firmness. This was also reflected in the crumb structure that showed more air bubbles in comparison with QF and GQ breads (Figure 1), both of which had a compacted crumb and therefore a poor gas retention [23]. Decreases in bread hardness are susceptible to the amount of sourdough added to the formulation; however, even small replacements result in lower hardness, as reported by Jagelaviciute and Cizeikiene (2020) who added 5% quinoa sourdough to a bread formulated with rice and corn flours [16]. In white breads, a significant hardness decrease was previously reported after 20% sourdough quinoa flour was added [15].
The acidification of the dough during the fermentation induces the formation of a starch–proteins network that mimics gluten and therefore improves the bread texture [7]. However, the mentioned effect is dependent on the starter culture strain used. The P. pentosaceous QB17 starter culture used in this study was isolated from spontaneous quinoa flour fermentation and chosen for its ability to produce exopolysaccharides [10]. These molecules are natural hydrocolloids that aid in the formation of a protein network and thus improve the texture of breads [35]. The positive effect of EPS-producing bacteria in GF bread formulation has been reported before. When W. cibaria [36] and Lactobacillus buchneri FUA3154 [11] were used for the formulation of gluten-free sorghum-based bread, higher specific volumes were reported which correlated with decreases in the crumb hardness.
Montemurro, Pontonio, and Rizzello (2021) reported that quinoa is an interesting flour to promote exopolysaccharide production, since it has a sugar content higher than other protein-rich flours [37]. Moreover, the use of a strain isolated from the same food matrix improves its chances to better perform as a starter culture in the sourdough fermentation [38]. Thus, the superior crumb attributes observed in the QSD breads might be associated with the starter culture utilized.
Similarly, the addition of GQ flour resulted in a lower firmness value compared with QF bread (55.62 vs. 59.86, respectively). The crumb structure of the GQ breads showed more air bubbles than the QF bread (Figure 1), corroborating its softness. Seed germination, which is associated with the alpha-amylase activity, positively affects the baking properties of GF breads, thus allowing the formation of softer crumbs and crusts [39].

3.3.3. Chemical Composition

As expected, the QSD bread showed the lowest pH (4.47) and the highest TTA (8.51 mL NaOH) (Table 5), likely as a result of the heterolactic fermentation by P. pentosaceous QB17. The bread formulated with GQ flour also showed a low pH, possibly due to a spontaneous fermentation process during the germination of the seeds, with the consequent increment of organic acids [40].
Minimal differences were observed with respect to the moisture of breads, with the sourdough bread showing the highest values (41.65%) (Table 5). Moisture values observed in our study were similar to those previously reported by Jagelaviclute and Cizeikiene (2020) for breads made with rice and corn flours with 5% of quinoa sourdough added. Nevertheless, they were about 50% higher than those reported for muffins formulated with rice flour and germinated quinoa [23], and for white breads formulated with 20% quinoa flour sourdough [15]. The moisture content of the three breads were also elevated when compared to the 30–40% standard moisture of gluten-free breads [41]. This, coupled with the pH values above 4 units, might impact the stability of the formulated breads in terms of mold outgrowth.
The addition of quinoa in the gluten-free formulation increased the protein content about three times (Table 5), which is something expected and related to the protein content in the different quinoa additions. The germinated quinoa bread showed the highest lipid content (0.78%), while the lowest was observed for the control bread (0.34) [Table 5]. Although carbohydrate content did not vary within the evaluated breads, the highest value was observed for the germinated quinoa sourdough bread (59.09%). No differences were observed in ash content. The proportion of the values observed in our study were in correlation to those reported by Rizzello et al. (2016) for white breads in which quinoa flour and sourdough quinoa were used as replacement for the gluten-containing flour. Similarly, the chemical composition observed in our study correlates to what has been reported for gluten-free bread formulated with corn and rice flours (Jagelaviclute and Cizeikiene, 2020). However, compared to the study carried out by El-Sohaimy et al. (2019), flat quinoa bread made with 20% flour replacement were similar for ash (2.70) content, but higher for protein (15.15), lipid (2.02), fiber (1.31), and carbohydrate (78.83) content [29].
The bake loss for all quinoa-based breads were around 9 and 10.5%, results that were nearly half of the value of 18.1% reported by a previous study for flat bread with 20% of quinoa flour replacement [29].

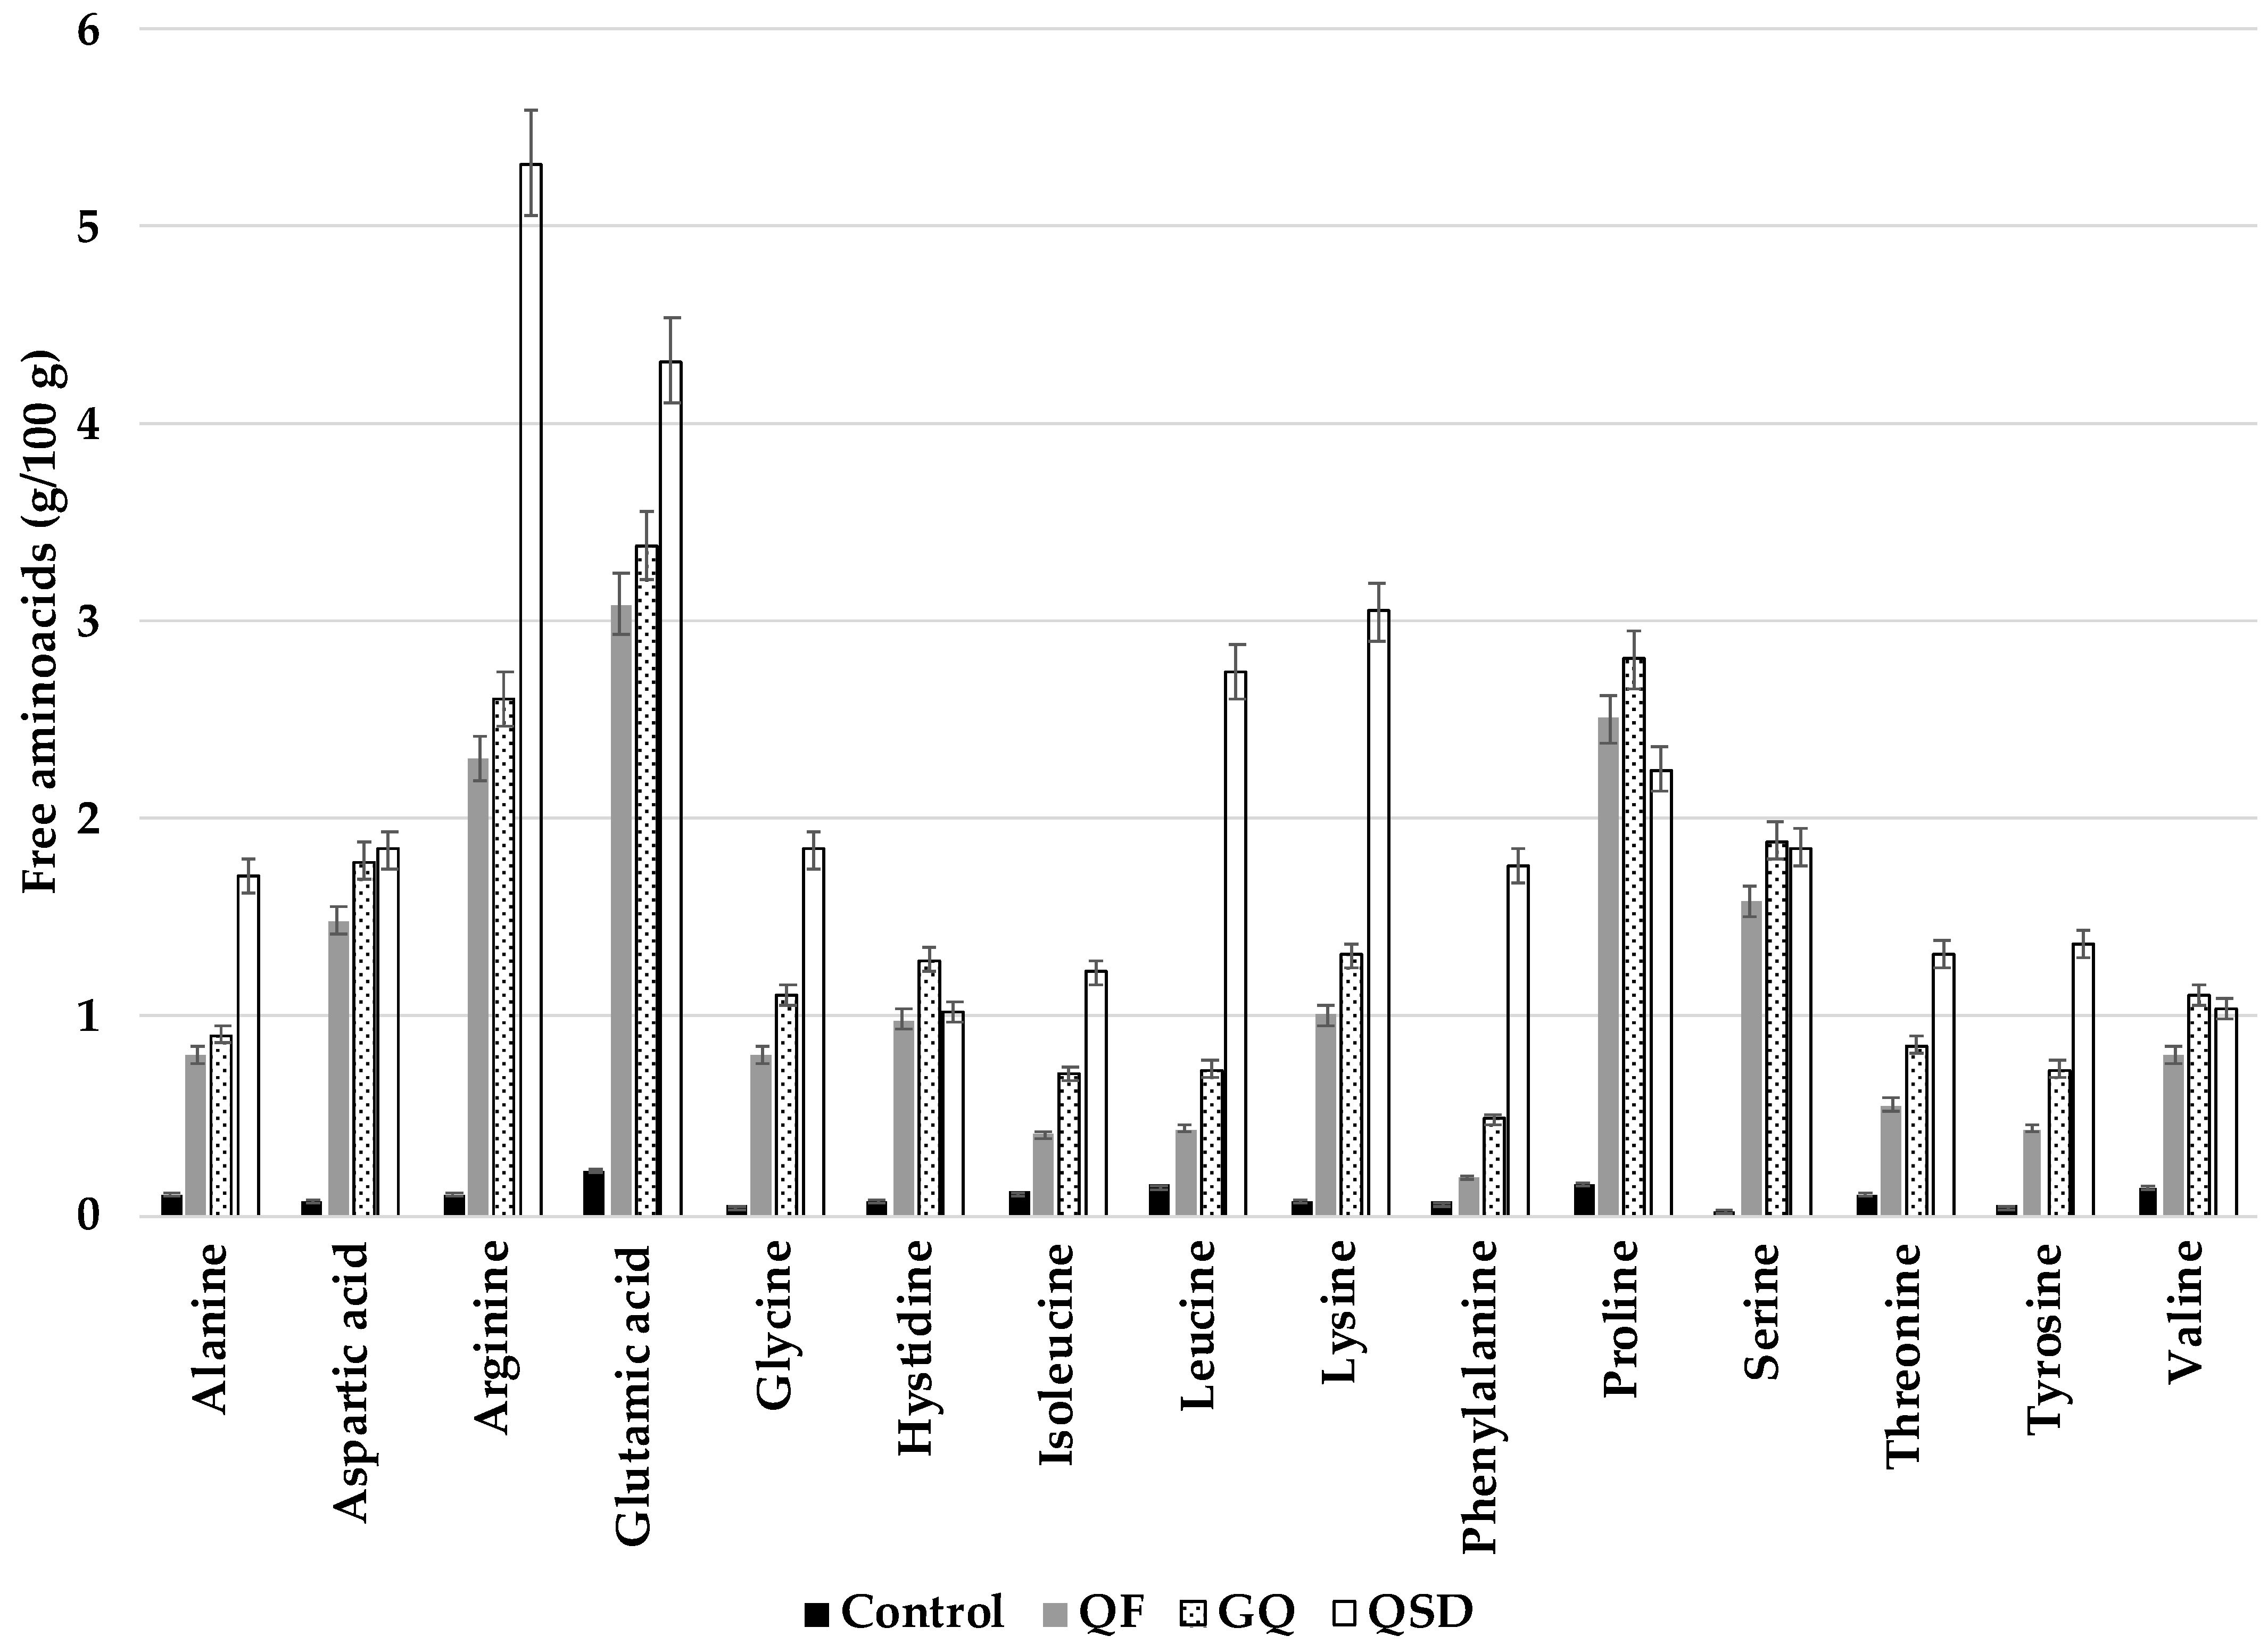
3.3.4. Amino Acid Profile
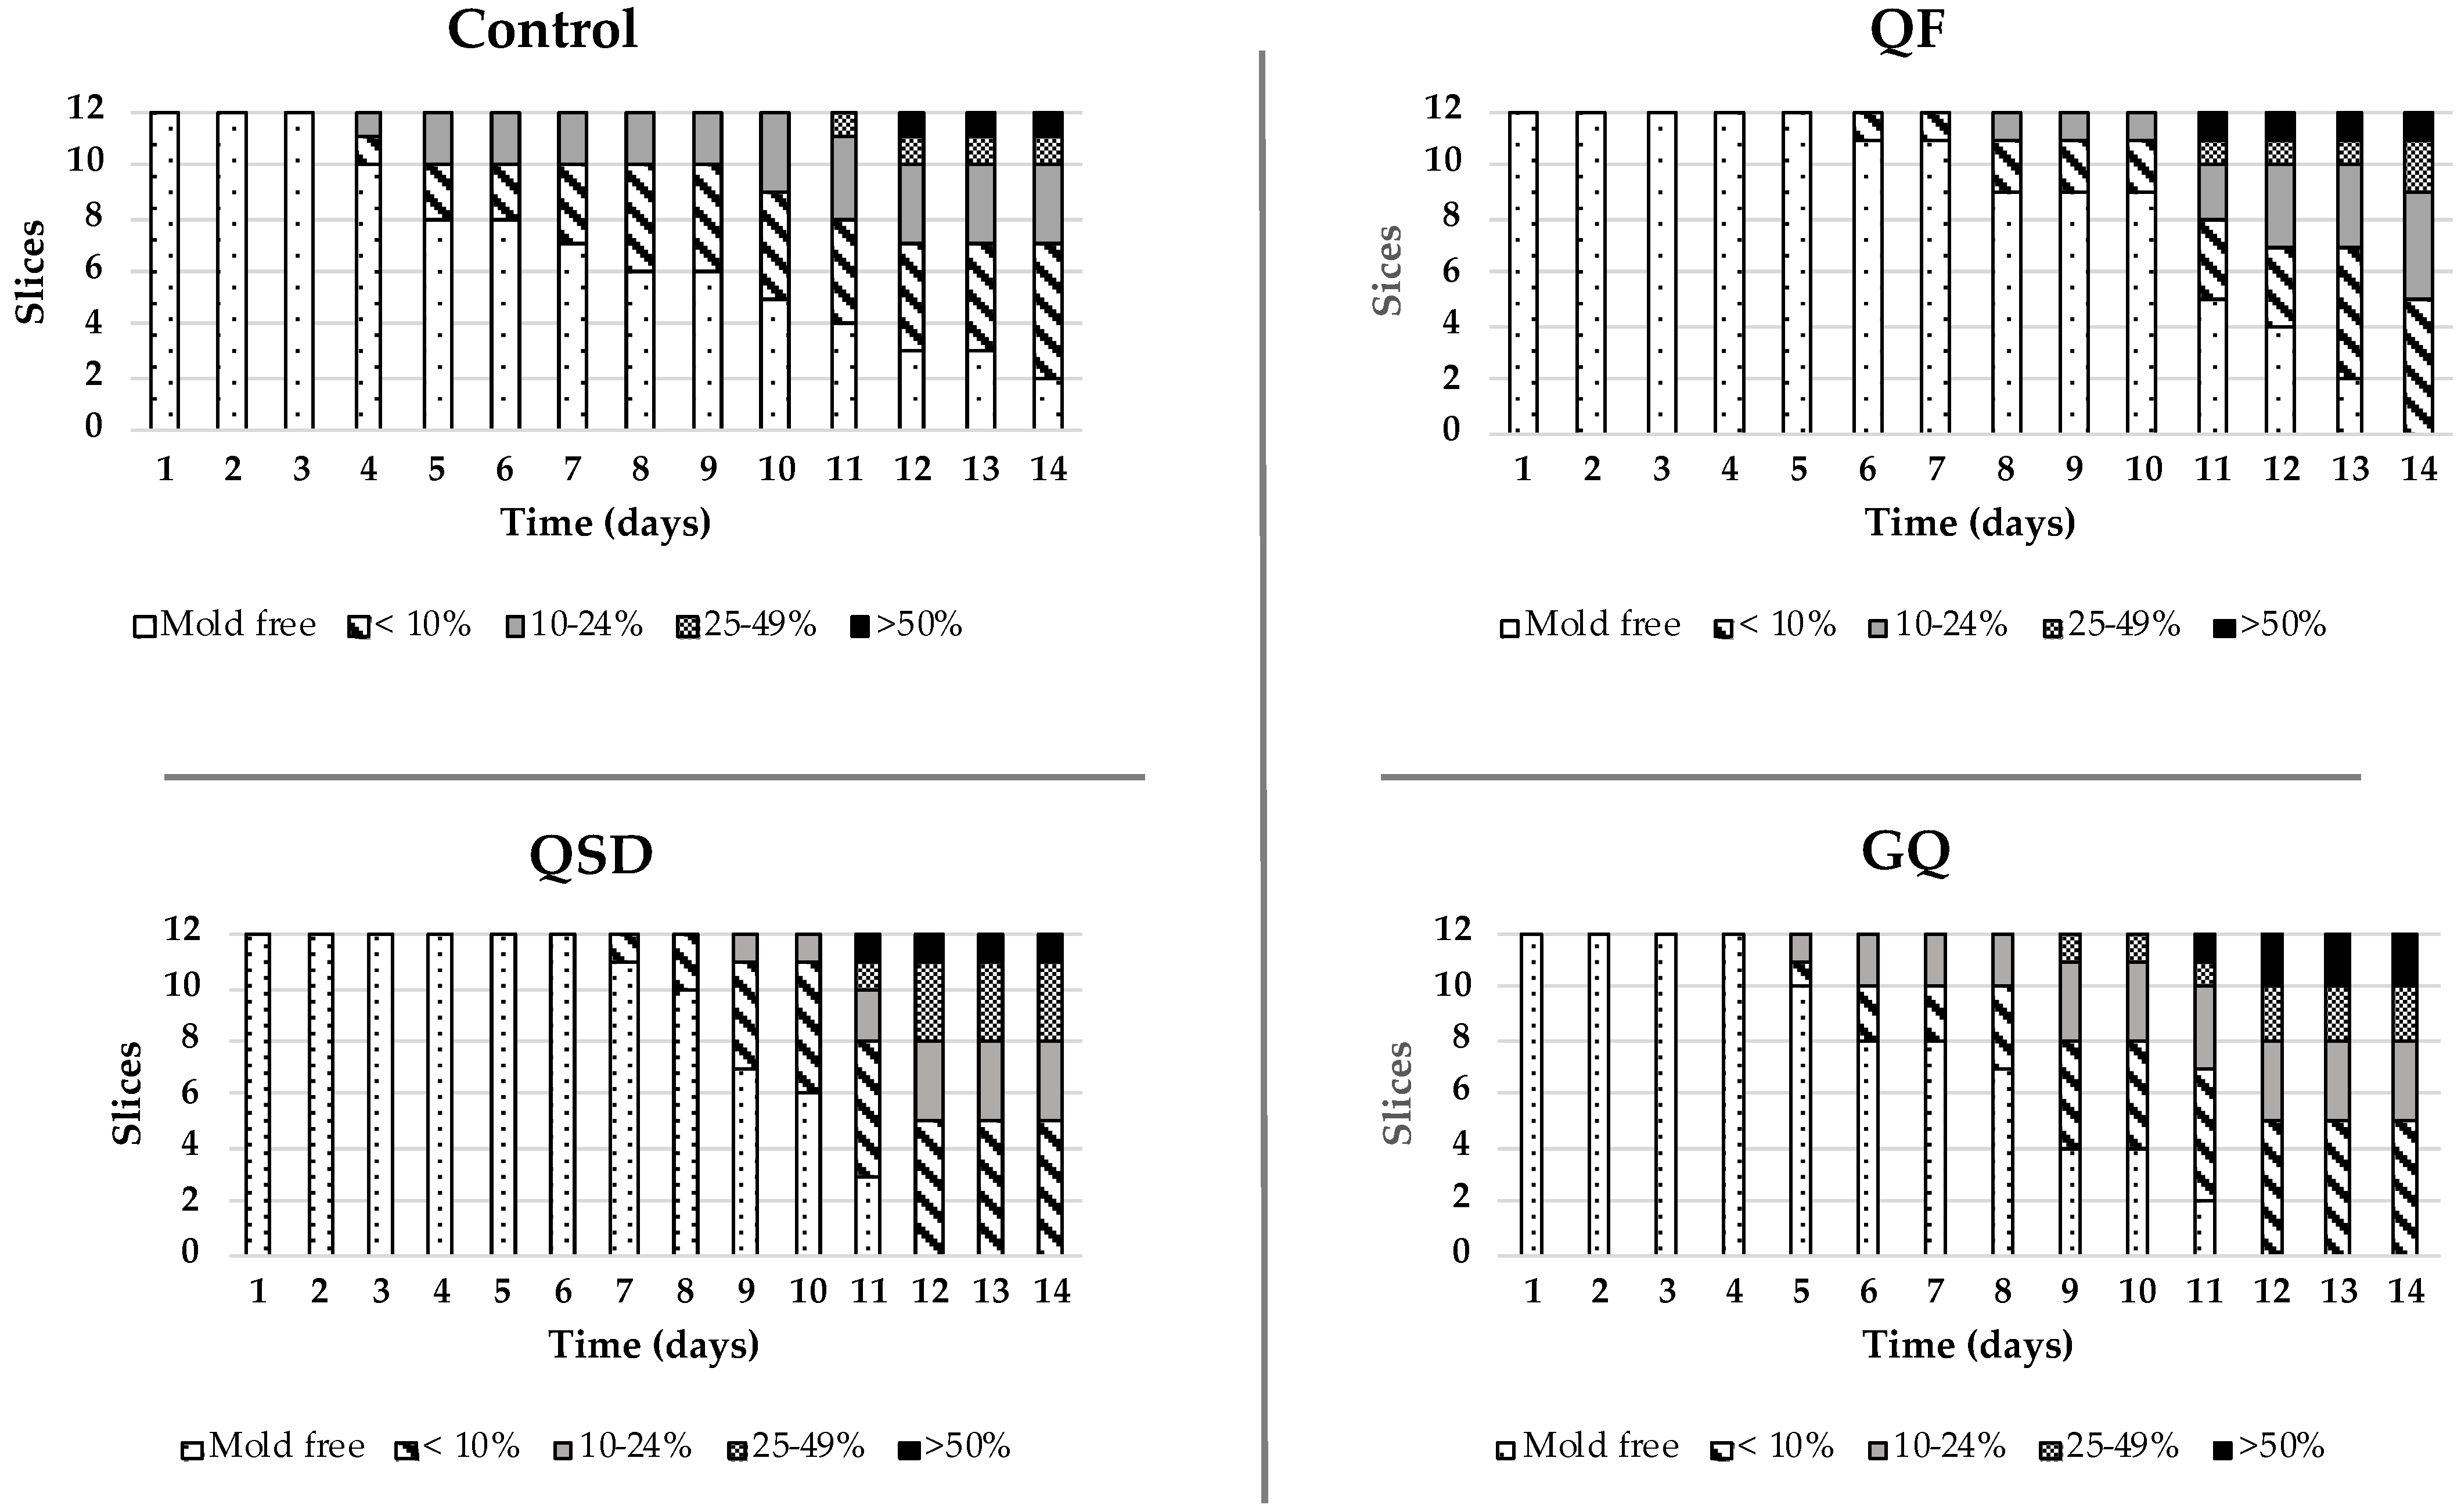
One of the most important characteristics of quinoa proteins is the high quality of its amino acid profile. Among all plants, quinoa seeds are considered a valuable functional food that provides all essential amino acids for human health care. In fact, amino acid composition is similar to milk protein, and their values are close to those recommended by FAO [42]. Our results show that the addition of quinoa, germinated quinoa flours, and quinoa sourdough also affected the amino acid profile, with a higher free amino acid percentage than the control bread (Figure 2).
When quinoa flour was used for the formulation of the rice-based GF bread, significant changes in the free amino acid contents were achieved, with the major impact observed in the concentration of arginine, glutamic acid, and proline (Figure 2). Given its nutritional profile, quinoa flour has been used as a functional replacement for the formulation of GF baked products [43], and, similar to our results, flat bread made with 30% quinoa flour resulted in breads with a higher free amino acid content, specially lysine [29]. Likewise, rice-based muffins made with 30% quinoa flour showed increases in the total amino acid concentration, especially in glutamic acid, arginine, and methionine [23].
The greatest impact in amino acid concentration, however, was observed in the sourdough breads. Overall, the use of 30% quinoa sourdough resulted in breads with the highest free amino acids content. Arginine, glutamic acid, leucine, lysine, and phenylalanine increased their concentrations around 5.2, 4.4, 2.6, 3.0, and 2.1 times, respectively, when compared to the control breads. Due to the metabolic activity of LAB, associated with the presence of proteinases and peptidases, nitrogen-based molecules can be metabolized into smaller units [32], which, in turn, become more bio-accessible [44]. In that sense, the use of sourdough has been studied as a tool to enrich GF bakery goods. For example, fermentation improved the bio-availability of lysine in millet [45] and maize [46]. Similar to our results, Rizzello et al. (2016) reported significant changes in arginine and leucine concentrations in white breads with a 20% quinoa sourdough replacement. These authors also reported important changes in glutamic acid and valine content [15]; however, in our study, the changes determined in these two amino acids were lower. The LAB proteolytic activity has been discussed as strain-dependent and as something influenced by fermentation conditions [47,48], therefore, differences in free amino acid profiles and concentrations are to be expected.
Similar effects can be observed for the germination process and breads prepared with GQ flour. These breads showed increments on free amino acid content too, but these were lower than those found in sourdough breads (Figure 2). This effect is expected since portions of the proteins are degraded into peptides and amino acids by diverse proteolytical enzymes during germination [49]. Motta et al. (2018) reported that the malting of pseudo-cereals, including quinoa, results in an enhanced amino acid content with the highest retention percentages in comparison with cooked grains [50].

3.3.5. Shelf-Life

The shelf life of the packed breads was monitored during 14 days of storage at room temperature to evaluate mold growth on the surface (Figure 3). It was observed that the inclusion of QSD into the gluten-free formulations resulted in 6 days of no mold growth. The metabolism of some LAB can result in fungicidal activity. L. amylovorus increased two days the shelf-life of gluten-free breads, when compared to the use of a non-antifungal strain and a chemically acidified bread [19]. About an 80% preservation effect was reported when 20% quinoa sourdough fermented with L. plantarum was used as a replacement in white bread formulations, and 20% higher than breads formulated only with 20% quinoa flour replacement [51]. In our study, the use of P. pentosaceous QB17 as single starter culture for the quinoa sourdough preparation increased the bread shelf-life by 3 days, in comparison with the control (only 3 days mold free), 2 days for the bread formulated with 20% germinated quinoa flour replacement, and 1 day for the bread formulated with 20% replacement quinoa flour. This suggests that antifungal activity for the lactic acid bacteria was employed. This activity might be mostly due to the presence of lactic acid and the TTA values of the resulting bread, probably coupled with the presence of other antifungal molecules [19]. However, more studies are necessary to fully characterize and understand the antifungal effect herein observed.
The GQ flour bread resulted in more bread slices with >50% mold outgrow. Mold can also be influenced by the intrinsic presence of a mold load in the whole and germinated grains. Mold contamination in quinoa grains and flours were reported between 2.9 [52] to 104 CFU/g [53]. During the germination process, the humidity and temperature conditions are favorable for the development of the natural grains’ microbiota including mold, and, if the procedure is not performed properly, mold outgrowth can occur. This, coupled with the humidity and pH of the resulting breads, might result in the lower shelf-life observed for the formulated breads.

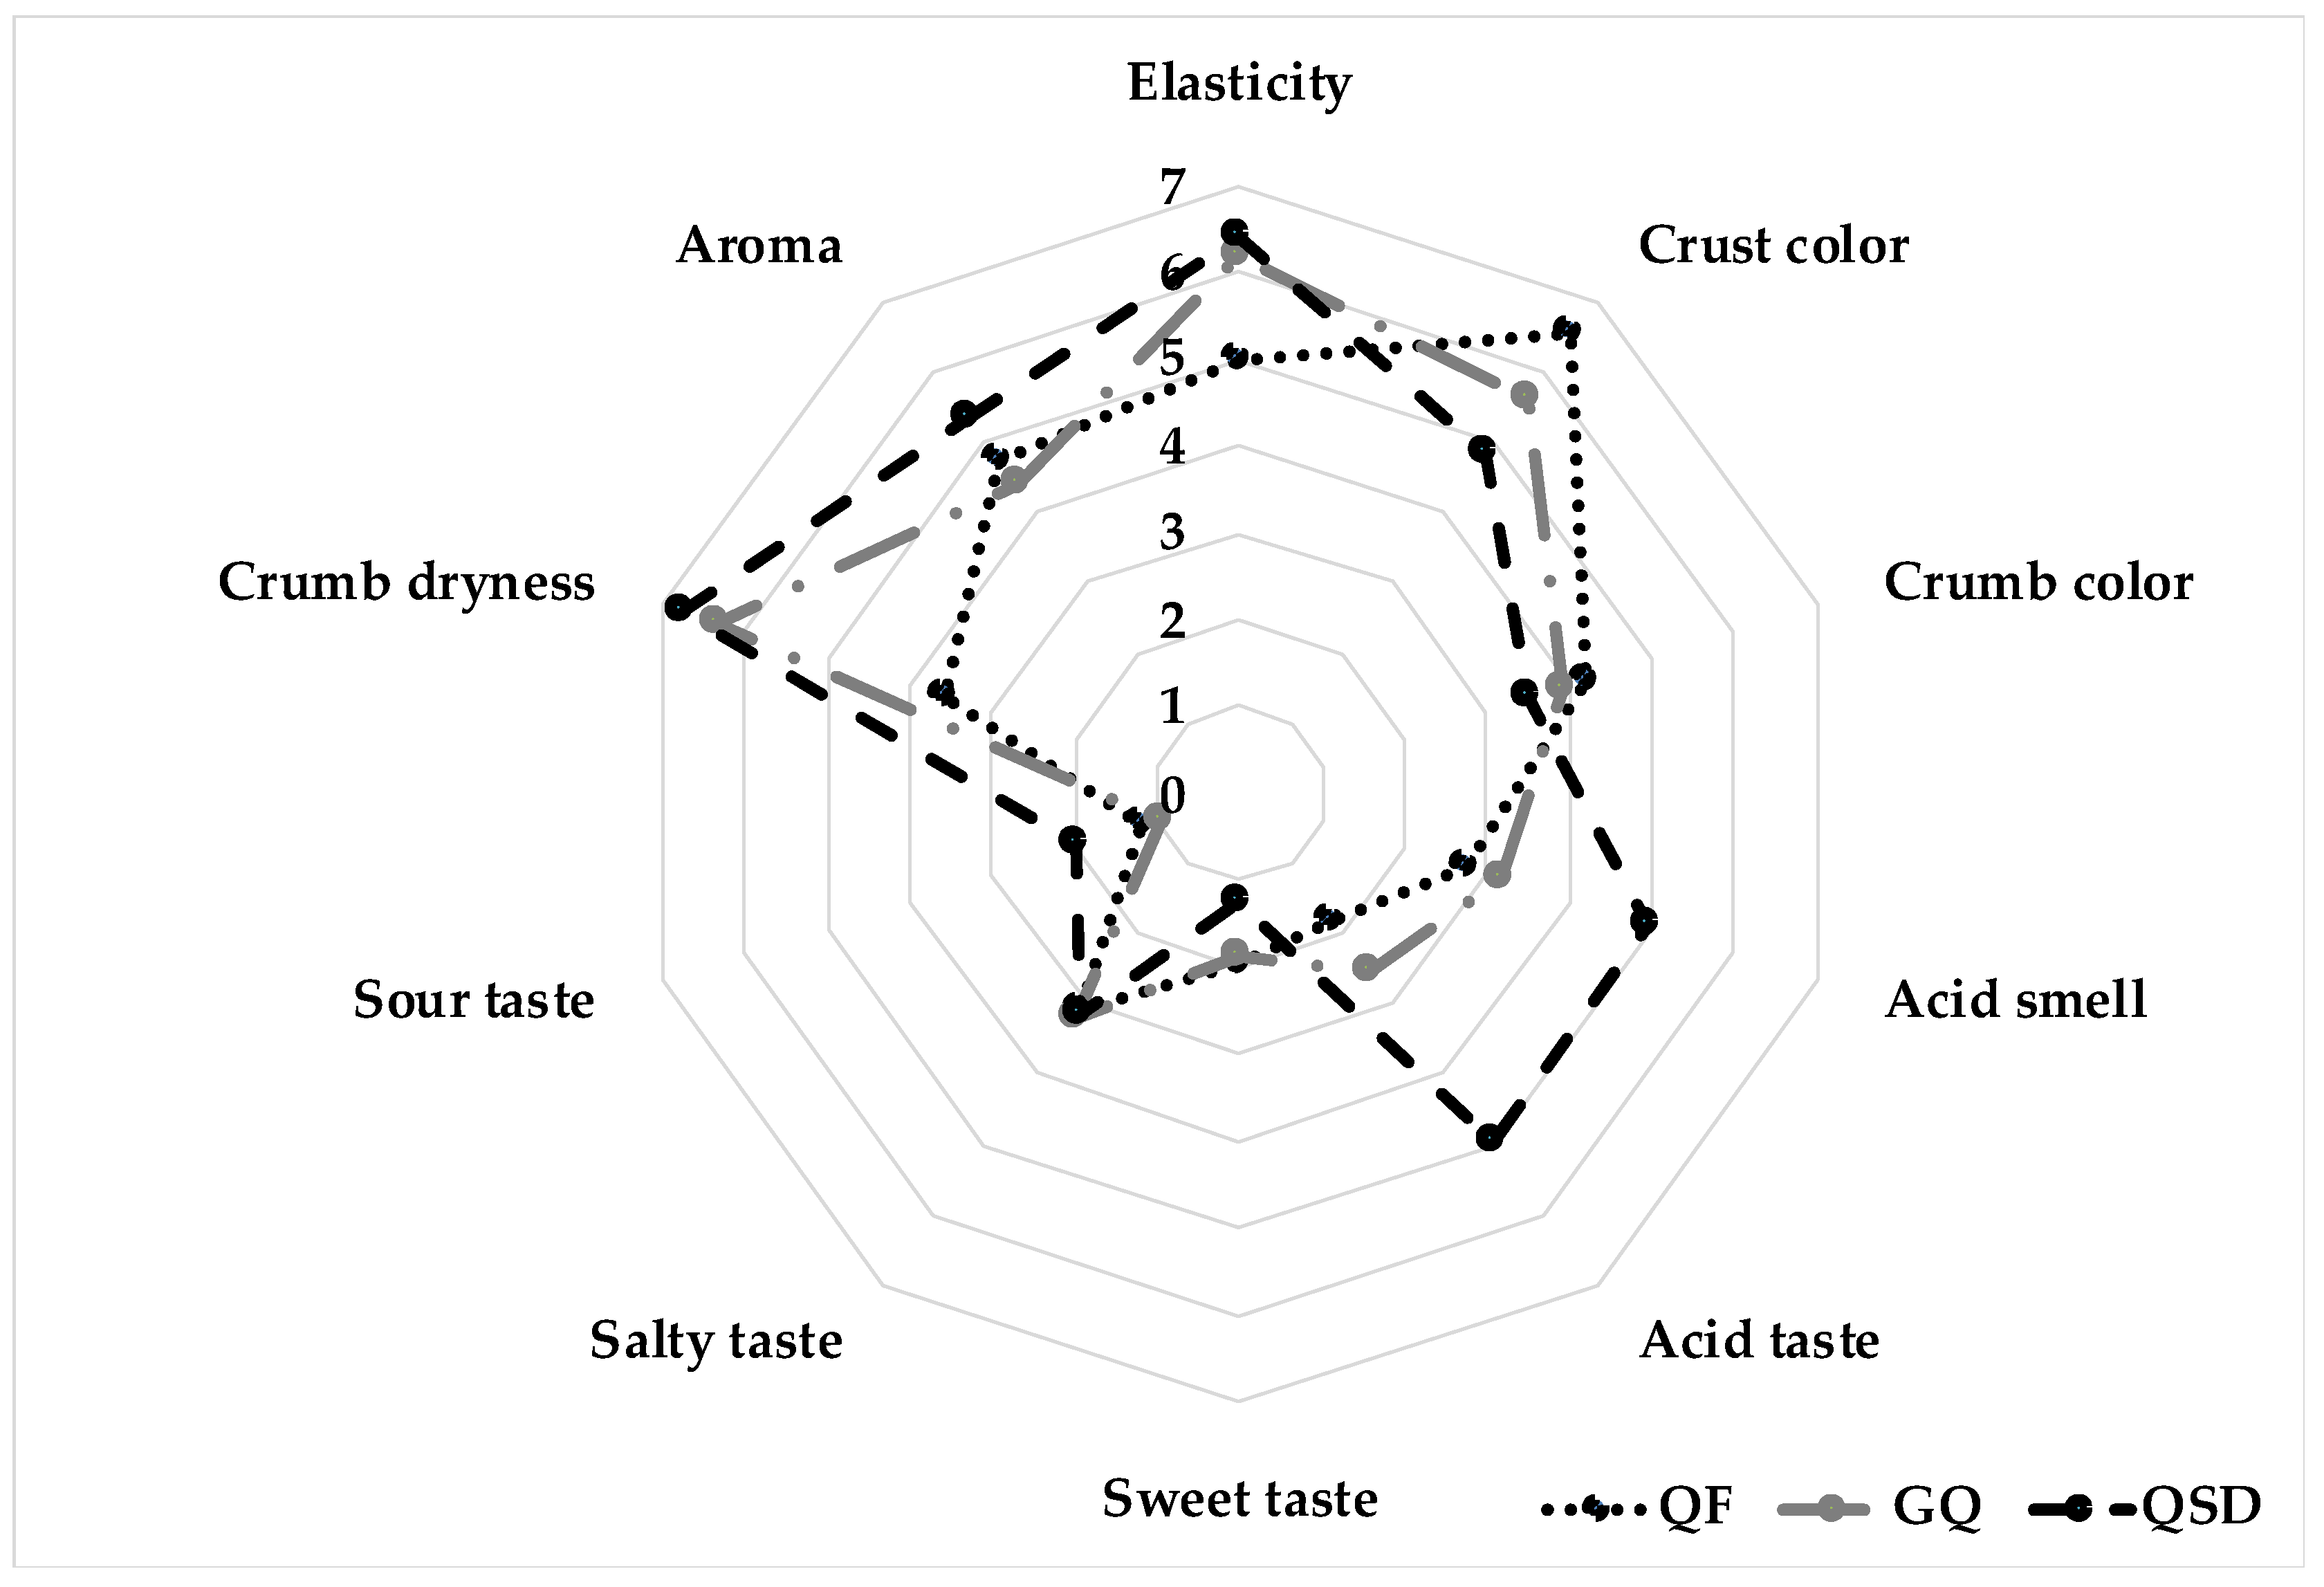
3.3.6. Sensory Analysis

Sensory analyses of quinoa-based breads are shown in Figure 4 and Table 6. Significant differences within the bread attributes were reported by the panelists, especially in crust color, acid smell, acid taste, and crumb dryness (Table 6). Breads formulated with 20% QF were ranked as the least elastic food, which was correlated with the tighter crumb and firmness observed (Figure 1 and Table 5) and its lower baking properties [7]. QSD breads were perceived with an intense crust color with a 6.62 score versus 4.83 and 4.71 for quinoa and germinated quinoa breads, respectively. The crumb colors were similarly scored for the three quinoa-based breads.
As expected, the inclusion of QSD produced a higher perception of the acid, increased sourness, higher aroma attributes, and lower sweet scores. Moreover, QSD breads were perceived as slightly saltier. Although acceptance was not higher among the evaluated breads (all ranked less than 6 out to 9 hedonic-scale points), the germinated quinoa bread showed the greatest acceptability (average rank 5.76) followed by the sourdough bread (average rank 5.43), whereas breads formulated with quinoa flour had a lower mean score (average rank 4.53) (data non shown). Results for overall acceptance of quinoa-based breads were lower than the 7.48 score reported for flat breads with quinoa replacement in a concentration from 5 to 30% [29]. However, these authors also informed that panelists found differences in sensory parameters in all quinoa-based breads. Quinoa grains have an earthy-like flavor that confer a specific characteristic to baked products, which might be considered as an acquired taste [23]. Manzatti et al. (2017) reported that quinoa’s characteristic flavor and aroma negatively affects the perception of breads [54]. Therefore, the lower acceptability scores might be associated with the reduced panelist’s exposition to the flavor, which declared consumed quinoa mainly as cooked grains.

4. Conclusions

Our study demonstrates that the addition of quinoa is a promising bioingredient for gluten-free bread formulation, as observed by the improvement of the nutritional properties of the breads. Furthermore, the inclusion of the different quinoa resulted in the enhancement of some bread attributes when compared to those formulated with rice flour, potato, and corn starches alone. Of interest are the increase in the total protein content and the amino acid profile, particularly in the sourdough bread. The prolonged shelf-life in the sourdough breads is likely associated with the fermentation capacity and antifungal ability of the starter culture, P. pentosaceous QB17, but more studies are necessary to fully characterize the strain capabilities. The inclusion of germinated quinoa flour is an interesting technological alternative due to the favored consumers acceptance, as compared to the other forms of quinoa addition. However, its chemical composition and shelf-life were lower than those observed for sourdough breads. Therefore, our results indicate that the replacement of gluten-free flour with quinoa sourdough is a feasible technological process for the formulation of highly nutritive bread with an extended shelf-life and better texture attributes. More studies are necessary in order to fully characterize the effect of adding quinoa sourdough to GF rice-based breads. For a better evaluation, the functional properties, polyphenol content, digestibility and antioxidant activity of the sourdough bread should be observed.

Author Contributions

W.F.: conceptualization, methodology, formal analysis, writing, supervision, and funding acquisition. K.E.: conceptualization, methodology, investigation, and funding acquisition. C.V.N.: writing: review and editing. All authors have read and agreed to the published version of the manuscript.

Funding

This work was supported by the Agencia Nacional de Investigación y Desarrollo (ANID), Chile [Fondecyt Iniación 11121413, and Fondecyt Postdoctorado 3150164], Fondo de Innovación Agraria [PYT 2019-0136], and Fondo de Innovación para la Competitividad—O’Higgins [IDI 40008904-0].

Institutional Review Board Statement

The study was conducted according to the guidelines of the Declaration of Helsinki, and approved by the Ethics Committee of the Pontifical Catholic University of Chile (protocol code 1728007 and approved 28 July 2016).

Informed Consent Statement

Not applicable.

Data Availability Statement

Not applicable.

Acknowledgments

The authors would like to thank Ilenys Pérez-Díaz for editing the manuscript, and Joscelyn Díaz, María Jesús Fuenzalida and Alexandra Maturana for data gathering.

Conflicts of Interest

The authors declare no conflict of interest.

References

  1. Martínez-Villaluenga, C.; Peñas, E.; Hernández-Ledesma, B. Pseudocereal grains: Nutritional value, health benefits and current applications for the development of gluten-free foods. In Food and Chemical Toxicology; Elsevier Ltd.: Amsterdam, The Netherlands, 2020; Volume 137, p. 111178. [Google Scholar]
  2. Turkut, G.M.; Cakmak, H.; Kumcuoglu, S.; Tavman, S. Effect of quinoa flour on gluten-free bread batter rheology and bread quality. J. Cereal Sci. 2016, 69, 174–181. [Google Scholar] [CrossRef]
  3. Arendt, E.K.; Zannini, E. Quinoa. In Cereal Grains for the Food and Beverage Industries; Elsevier: Amsterdam, The Netherlands, 2013; pp. 409–438. [Google Scholar]
  4. Wood, L. Global Bread Market Growth, Trends & Forecast 2018–2023-ResearchAndMarkets.com—The Business Journals. 2018. Available online: https://www.businesswire.com/news/home/20180515005746/en/Global-Bread-Market-Growth-Trends-Forecast-2018–2023---ResearchAndMarkets.com (accessed on 3 December 2020).
  5. Graf, B.L.; Rojas-Silva, P.; Rojo, L.E.; Delatorre-Herrera, J.; Baldeón, M.E.; Raskin, I. Innovations in Health Value and Functional Food Development of Quinoa (Chenopodium quinoa Willd.). Compr. Rev. Food Sci. Food Saf. 2015, 14, 431–445. [Google Scholar] [CrossRef] [Green Version]
  6. Boukid, F.; Folloni, S.; Sforza, S.; Vittadini, E.; Prandi, B. Current Trends in Ancient Grains-Based Foodstuffs: Insights into Nutritional Aspects and Technological Applications. Compr. Rev. Food Sci. Food Saf. 2018, 17, 123–136. [Google Scholar] [CrossRef] [PubMed] [Green Version]
  7. Alvarez-Jubete, L.; Auty, M.; Arendt, E.K.; Gallagher, E. Baking properties and microstructure of pseudocereal flours in gluten-free bread formulations. Eur. Food Res. Technol. 2009, 230, 437–445. [Google Scholar] [CrossRef]
  8. Elgeti, D.; Nordlohne, S.D.; Föste, M.; Besl, M.; Linden, M.H.; Heinz, V.; Jekle, M.; Becker, T. Volume and texture improvement of gluten-free bread using quinoa white flour. J. Cereal Sci. 2014, 59, 41–47. [Google Scholar] [CrossRef]
  9. Gobbetti, M.; Gänzle, M. Handbook on Sourdough Biotechnology; Springer Science & Business Media: Berlin, Germany, 2013. [Google Scholar]
  10. Franco, W.; Pérez-Díaz, I.M.; Connelly, L.; Diaz, J.T. Isolation of exopolysaccharide-producing yeast and lactic acid bacteria from quinoa (Chenopodium quinoa) sourdough fermentation. Foods 2020, 9, 337. [Google Scholar] [CrossRef] [Green Version]
  11. Galle, S.; Schwab, C.; Arendt, E.K.; Gänzle, M.G. Structural and rheological characterisation of heteropolysaccharides produced by lactic acid bacteria in wheat and sorghum sourdough. Food Microbiol. 2009, 78, 1–11. [Google Scholar] [CrossRef]
  12. Lynch, K.M.; Zannini, E.; Coffey, A.; Arendt, E.K. Lactic Acid Bacteria Exopolysaccharides in Foods and Beverages: Isolation, Properties, Characterization, and Health Benefits. Annu. Rev. Food Sci. Technol. 2018, 9, 155–176. [Google Scholar] [CrossRef] [PubMed]
  13. Bai, Y.; Boger, M.; van der Kaaij, R.M.; Woortman, A.J.J.; Pijning, T.; van Leeuwen, S.S.; Lammerts van Bueren, A.; Dijkhuizen, L. Lactobacillus reuteri Strains Convert Starch and Maltodextrins into Homoexopolysaccharides Using an Extracellular and Cell-Associated 4,6-α-Glucanotransferase. J. Agric. Food Chem. 2016, 64, 2941–2952. [Google Scholar] [CrossRef]
  14. Tieking, M.; Gänzle, M.G. Exopolisaccharides from cereal-associated lactobacilli. Trends Food Sci. Technol. 2005, 16, 79–84. [Google Scholar] [CrossRef]
  15. Rizzello, C.G.; Lorusso, A.; Montemurro, M.; Marco, G. Use of sourdough made with quinoa (Chenopodium quinoa) flour and autochthonous selected lactic acid bacteria for enhancing the nutritional, textural and sensory features of white bread. Food Microbiol. 2016, 56, 1–13. [Google Scholar] [CrossRef]
  16. Jagelaviciute, J.; Cizeikiene, D. The influence of non-traditional sourdough made with quinoa, hemp and chia flour on the characteristics of gluten-free maize/rice bread. LWT 2020, 137, 110457. [Google Scholar] [CrossRef]
  17. Nionelli, L.; Rizzello, C. Sourdough-Based Biotechnologies for the Production of Gluten-Free Foods. Foods 2016, 5, 65. [Google Scholar] [CrossRef]
  18. Arendt, E.K.; O’Brien, C.M.; Schober, T.; Gormley, T.R.; Gallagher, E. Development of gluten-free cereal products. Farm Food 2002, 12, 21–27. [Google Scholar]
  19. Axel, C.; Röcker, B.; Brosnan, B.; Zannini, E.; Furey, A.; Coffey, A.; Arendt, E.K. Application of Lactobacillus amylovorus DSM19280 in gluten-free sourdough bread to improve the microbial shelf life. Food Microbiol. 2015, 47, 36–44. [Google Scholar] [CrossRef]
  20. Moore, M.M.; Bello, F.D.; Arendt, E.K. Sourdough fermented by Lactobacillus plantarum FST 1.7 improves the quality and shelf life of gluten-free bread. Eur. Food Res. Technol. 2008, 226, 1309–1316. [Google Scholar] [CrossRef]
  21. Phiarais, B.P.N.; Arendt, E.K. Malting and brewing with gluten-free cereals. In Gluten-Free Cereal Products and Beverages; Elsevier Inc.: Amsterdam, The Netherlands, 2008; pp. 348–371. [Google Scholar]
  22. Kaur, I.; Tanwar, B. Quinoa beverages: Formulation, processing and potential health benefits. Rom. J. Diabetes, Nutr. Metab. Dis. 2016, 23, 215–225. [Google Scholar] [CrossRef] [Green Version]
  23. Miranda-Villa, P.P.; Mufari, J.R.; Bergesse, A.E.; Calandri, E.L. Effects of Whole and Malted Quinoa Flour Addition on Gluten-Free Muffins Quality. J. Food Sci. 2019, 84, 147–153. [Google Scholar] [CrossRef] [PubMed] [Green Version]
  24. McFeeters, R.F.; Barish, A.O. Sulfite analysis of fruits and vegetables by high-performance liquid chromatography (HPLC) with ultraviolet spectrophotometric detection. J. Agric. Food Chem. 2003, 51, 1513–1517. [Google Scholar] [CrossRef]
  25. Lattanzi, A.; Minervini, F.; Di Cagno, R.; Diviccaro, A.; Antonielli, L.; Cardinali, G.; Cappelle, S.; De Angelis, M.; Gobbetti, M. The lactic acid bacteria and yeast microbiota of eighteen sourdoughs used for the manufacture of traditional Italian sweet leavened baked goods. Int. J. Food Microbiol. 2013, 163, 71–79. [Google Scholar] [CrossRef] [PubMed]
  26. America Association of Cereals and Grains. AACC Approved Methods of Analysis-11 Edition. Available online: https://methods.aaccnet.org/default.aspx (accessed on 19 November 2017).
  27. McCleary, B.V.; De Vries, J.W.; Rader, J.I.; Cohen, G.; Prosky, L.; Mugford, D.C.; Champ, M.; Okuma, K. Determination of Total Dietary Fiber (CODEX Definition) by Enzymatic-Gravimetric Method and Liquid Chromatography: Collaborative Study. J. AOAC Int. 2010, 93, 221–233. [Google Scholar] [CrossRef] [Green Version]
  28. Bello, F.D.; Clarke, C.I.; Ryan, L.A.M.; Ulmer, H.; Schober, T.J.; Ström, K.; Sjögren, J.; Van Sinderen, D.; Schnürer, J.; Arendt, E.K. Improvement of the quality and shelf life of wheat bread by fermentation with the antifungal strain Lactobacillus plantarum FST 1.7. J. Cereal Sci. 2007, 45, 309–318. [Google Scholar] [CrossRef]
  29. El-Sohaimy, S.A.; Shehata, M.G.; Mehany, T.; Zeitoun, M.A. Nutritional, Physicochemical, and Sensorial Evaluation of Flat Bread Supplemented with Quinoa Flour. Int. J. Food Sci. 2019, 2019. [Google Scholar] [CrossRef] [Green Version]
  30. Contreras-Jiménez, B.; Torres-Vargas, O.L.; Rodríguez-García, M.E. Physicochemical characterization of quinoa (Chenopodium quinoa) flour and isolated starch. Food Chem. 2019, 298, 124982. [Google Scholar] [CrossRef]
  31. Cunniff, P.A.; AOAC. Official Methods of Analysis of AOAC International. Assoc. Off. Anal. Chem. Int. 1998, 2, 2–66. [Google Scholar]
  32. Poutanen, K.; Flander, L.; Katina, K. Sourdough and cereal fermentation in a nutritional perspective. Food Microbiol. 2009, 26, 693–699. [Google Scholar] [CrossRef]
  33. Azizi, S.; Azizi, M.H.; Moogouei, R.; Rajaei, P. The effect of Quinoa flour and enzymes on the quality of gluten-free bread. Food Sci. Nutr. 2020, 8, 2373–2382. [Google Scholar] [CrossRef] [PubMed] [Green Version]
  34. Chauhan, G.S.; Zillman, R.R.; Eskin, N.A.M. Dough mixing and breadmaking properties of quinoa-wheat flour blends. Int. J. Food Sci. Technol. 1992, 27, 701–705. [Google Scholar] [CrossRef]
  35. Welman, A.D.; Maddox, I.S. Exopolysaccharides from lactic acid bacteria: Perspectives and challenges. In Trends in Biotechnology; Elsevier Ltd.: Amsterdam, The Netherlands, 2003; Volume 21, pp. 269–274. [Google Scholar]
  36. Schawb, C.; Mastrangelo, M.; Cordsdetti, A.; Gänzle, M.G. Formation of oligosaccharides and polysaccharides by Lactobacillus reuteri LTH5448 and Weisella cibardia 10 M in sorghum sourdough. Cereal Chem. 2008, 85, 679–684. [Google Scholar] [CrossRef]
  37. Montemurro, M.; Pontonio, E.; Rizzello, C.G. Design of a ‘Clean-Label’ Gluten-Free Bread to Meet Consumers Demand. Foods 2021, 10, 462. [Google Scholar] [CrossRef]
  38. Coda, R.; di Cagno, R.; Gobbetti, M.; Rizzello, C.G. Sourdough lactic acid bacteria: Exploration of non-wheat cereal-based fermentation. Food Microbiol. 2014, 37, 51–58. [Google Scholar] [CrossRef]
  39. Mäkinen, O.E.; Zannini, E.; Arendt, E.K. Germination of Oat and Quinoa and Evaluation of the Malts as Gluten Free Baking Ingredients. Plant Foods Hum. Nutr. 2013, 68, 90–95. [Google Scholar] [CrossRef]
  40. de Meo, B.; Freeman, G.; Marconi, O.; Booer, C.; Perretti, G.; Fantozzi, P. Behaviour of malted cereals and pseudo-cereals for gluten-free beer production. J. Inst. Brew. 2011, 117, 541–546. [Google Scholar] [CrossRef]
  41. Cappelli, A.; Oliva, N.; Cini, E. A systematic review of gluten-free dough and bread: Dough rheology, bread characteristics, and improvement strategies. Appl. Sci. 2020, 10, 6559. [Google Scholar] [CrossRef]
  42. Kozioł, M.J. Chemical composition and nutritional evaluation of quinoa (Chenopodium quinoa Willd.). J. Food Compos. Anal. 1992, 5, 35–68. [Google Scholar] [CrossRef]
  43. Zannini, E.; Jones, J.M.; Renzetti, S.; Arendt, E.K. Functional Replacements for Gluten. Annu. Rev. Food Sci. Technol. 2012, 3, 227–245. [Google Scholar] [CrossRef] [PubMed]
  44. Singh, A.K.; Rehal, J.; Kaur, A.; Jyot, G. Enhancement of Attributes of Cereals by Germination and Fermentation: A Review. Crit. Rev. Food Sci. Nutr. 2015, 55, 1575–1589. [Google Scholar] [CrossRef]
  45. Adebiyi, J.A.; Obadina, A.O.; Adebo, O.A.; Kayitesi, E. Comparison of nutritional quality and sensory acceptability of biscuits obtained from native, fermented, and malted pearl millet (Pennisetum glaucum) flour. Food Chem. 2017, 232, 210–217. [Google Scholar] [CrossRef] [PubMed]
  46. Pontonio, E.; Dingeo, C.; Gobbetti, M.; Rizzello, C.G. Maize milling by-products: From food wastes to functional ingredients through lactic acid bacteria fermentation. Front. Microbiol. 2019, 10, 561. [Google Scholar] [CrossRef] [Green Version]
  47. Thiele, C.; Gänzle, M.G.; Vogel, R.F. Contribution of sourdough lactobacilli, yeast, and cereal enzymes to the generation of amino acids in dough relevant for bread flavor. Cereal Chem. 2002, 79, 45–51. [Google Scholar] [CrossRef]
  48. Katina, K.; Poutanen, K.; Autio, K. Influence and interactions of processing conditions ans starter culture on formation of acids, volatile compounds, and amino acids in wheat sourdoughs. Cereal Chem. 2002, 81, 598–610. [Google Scholar]
  49. Celus, I.; Brijs, K.; Delcour, J.A. The effects of malting and mashing on barley protein extractability. J. Cereal Sci. 2006, 44, 203–211. [Google Scholar] [CrossRef]
  50. Motta, C.; Castanheira, I.; Gonzales, G.B.; Delgado, I.; Torres, D.; Santos, M.; Matos, A.S. Impact of cooking methods and malting on amino acids content in amaranth, buckwheat and quinoa. J. Food Compos. Anal. 2019, 76, 58–65. [Google Scholar] [CrossRef]
  51. Dallagnol, A.; Pescuma, M.; Rollán, G.; Torino, M.; Valdez, G. Optimization of lactic ferment with quinoa flour as bio-preservative alternative for packed bread. Appl. Microbiol. Biotechnol. 2015, 99, 3839–3849. [Google Scholar] [CrossRef]
  52. Montemurro, M.; Pontonio, E.; Gobbetti, M.; Giuseppe, C. Investigation of the nutritional, functional and technological e ff ects of the sourdough fermentation of sprouted flours. Int. J. Food Microbiol. 2019, 302, 47–58. [Google Scholar] [CrossRef]
  53. Guarniz-Benites, J.; Valdez-Arana, J.D.C. Morphological identification of mycotoxigenic fungi in accessions of quinoa (Chenopodium quinoa Wild.) of the peruvian coast and sierra. Sci. Agropecu. 2019, 10, 327–336. [Google Scholar] [CrossRef] [Green Version]
  54. Alencar, N.M.M.; de Morais, E.C.; Steel, C.J.; Bolini, H.M.A. Sensory characterisation of gluten-free bread with addition of quinoa, amaranth flour and sweeteners as an alternative for coeliac patients. Int. J. Food Sci. Technol. 2017, 52, 872–879. [Google Scholar] [CrossRef]
Figure 1. Rice based gluten-free breads elaborated with different types of quinoa addition. QF: GF breads made with 20% quinoa flour. GQ: GF breads made with 20% germinated quinoa flour. QSD: GF breads made with 30% quinoa sourdough.
Fermentation 07 00115 g001
Figure 2. Amino acids profiles for the studied breads. Control: Rice flour, potato and corn starch bread; QF: 20% quinoa flour replacement; GQ: 20% replacement germinated quinoa flour; QSD: 30% replacement quinoa sourdough. Different lower case letters within the same amino acids are significantly different (p < 0.05).
Fermentation 07 00115 g002
Figure 3. Shelf-life of gluten-free breads during 14 days of storage at room conditions. Control bread -Rice, potato and corn starch bread; QF: gluten-free bread formulated with 20% quinoa flour replacement; QSD: gluten-free bread formulated with 30% quinoa sourdough replacement, and GQ: gluten-free bread formulated with 20% germinated quinoa flour replacement. Percentage ranges indicate the surface mold outgrowth in the bread slices.
Fermentation 07 00115 g003
Figure 4. Attribute analysis of GF breads supplemented with whole quinoa flour (QF), germinated quinoa flour (GQ), and quinoa sourdough (QSD). Data represent average scoring of two independent sensory analyses conducted with 30 untrained panelists (n = 60).
Fermentation 07 00115 g004
Table 1. Gluten-free breads formulation.
% Dried Weight
IngredientsControlQFGQQSD
Flours
Refined rice flour50303030
Whole quinoa flour-20--
Germinated quinoa flour--20-
Starches
Corn Starch25252525
Potato Starch25252525
Other
Xhantan gum2222
Salt2222
Ferment
Dried baker’s yeast0.50.50.50.5
Sourdough---30
Water10010010080
Control: GF bread formulated with commercial refined rice flour (Mi Tierra, Santiago, Chile), potato and corn starches (Tostaduría Maravilla, Santiago, Chile). QF: bread formulated with 20% whole quinoa flour replacement. GQ: bread formulated with 20% germinated quinoa flour replacement. QSD: bread formulated with 30% quinoa sourdough flour replacement. The ingredients content in the batter formulations are expressed as % of dried ingredients (flours + starches).
Table 2. Proximal composition of rice (RF, Control), quinoa (Q) and germinated quinoa (GQ) flours.
Parameter (%)ControlQFGQ
Moisture14.3 ± 0.31 a13.71 ± 0.87 b13.76 ± 0.45 b
Protein9.75 ± 0.24 b14.8 ± 0.57 a15.3 ± 0.18 a
Lipid0.61 ± 0.03 b5.22 ± 1.01 a5.55 ± 0.41 a
Ash0.14 ± 0.01 c2.00 ± 0.29 a2.55 ± 0.28 b
Carbohydrate89.5 ± 2.31 a77.9 ± 1.52 b76.4 ± 2.45 b
Total dietary fiber
4.03 ± 1.05 c10.5 ± 0.11 a9.15 ± 0.21 b
Soluble fiber
2.17 ± 0.02 b3.15 ± 0.05 a0.85 ± 0.01 c
Insoluble fiber
1.86 ± 1.06 c7.31 ± 0.13 b8.30 ± 0.06 a
Values (on a dry basis: grams of analyzed component versus 100 g of flour) represent the average ± standard deviation of two independent determinations done in triplicate (n = 6). Letters in the same row indicate significant differences (p < 0.05). Control: rice flour, QF: quinoa flour; GQ: germinated quinoa flour. Proximal composition was determined following the official Methods of Analysis (AOAC) [31].
Table 3. Lactic acid bacteria counts and pH values during the fermentation of quinoa flour with Pediococcus pentosaceous QB17.
Time (h)LAB Count
(log CFU/g)
pH
06.01 ± 0.016.01 ± 0.01
26.11 ± 0.016.19 ± 0.03
46.43 ± 0.086.01 ± 0.02
66.94 ± 0.105.63 ± 0.07
87.29 ± 0.144.94 ± 0.13
107.62 ± 0.094.33 ± 0.22
127.93 ± 0.103.93 ± 0.11
148.22 ± 0.173.91 ± 0.10
168.24 ± 0.163.88 ± 0.09
Values represent the average ± standard deviation of two independent determinations (n = 6).
Table 4. Characteristics of quinoa sourdough fermented with P. pentosaceous QB17.
CharacteristicValue
LAB count (log CFU/g)8.40 ± 0.01
pH3.88 ± 0.09
TTA (mL of NaOH)17.5 ± 0.89
Lactic acid (mM)18.4 ± 2.35
Acetic acid (mM)21.6 ± 1.17
FQ8.52 ± 0.75
Moisture (% d.m)11.2 ± 0.03
Protein (% d.m)14.5 ± 0.04
Lipid (% d.m)5.47 ± 0.03
Carbohydrate (% d.m)70.1 ± 1.13
Soluble fiber (% d.m)4.50 ± 0.20
Insoluble fiber (% d.m)5.50 ± 0.13
Ash (%)2.19 ± 0.02
Values represent the average ± standard deviation of two independent determinations done in triplicate (n = 6). FQ: Estimated as the relationship between lactic and acetic acids present in the doughs after 16 h. The proximal composition of the resulting sourdough was determined following the official Methods of Analysis (AOAC) [31].
Table 5. Color, texture and chemical characteristics of GF breads supplemented with whole quinoa (Q), germinated quinoa (GQ) flours and quinoa sourdough (QSD).
CharacteristicBread Type
ControlQFGQQSD
Color crust
L *60.7 ± 1.13 c61.0 ± 3.62 c70.0 ± 3.23 b71.6 ± 3.94 a
a *12.7 ± 2.34 a13.2 ± 1.76 a8.33 ± 1.10 b7.29 ± 1.47 b
b *31.89 ± 0.35 b33.65 ± 3.43 a32.54 ± 3.50 a32.42 ± 2.10 a
Color crumb
L *69.9 ± 1.54 c72.2 ± 3.07 b73.10± 3.86 a72.8 ± 2.64 a
a *0.22 ± 0.21 a0.25 ± 0.19 a0.01 ± 0.24 b0.01 ± 0.46 b
b *12.8 ± 1.65 d15.1 ± 1.14 c17.1 ± 1.85 a16.6 ± 0.67 b
Texture
Hardness (N)22.3 ± 3.24 d59.9 ± 4.06 a35.6 ± 4.67 b21.1 ± 4.89 c
Bake loss (%)9.04 ± 1.32 c9.05 ± 1.57 c9.2 ± 1.28 b10.5 ± 1.63 a
Chemical composition
pH6.14 ± 0.01 a6.09 ± 0.04 a5.62 ± 0.09 b4.47 ± 0.03 c
TTA (mL NaOH)2.01 ± 0.04 c2.13 ± 0.06 c3.32 ± 0.06 b8.51 ± 0.05 a
Moisture (%)41.5 ± 2.31 a41.6 ± 1.74 a40.6 ± 1.28 a41.6 ± 2.89 a
Protein (%)2.70 ± 0.12 c9.61 ± 0.51 b9.77 ± 0.50 a9.82 ± 0.23 a
Lipid (%)0.34 ± 0.34 c0.58 ± 0.19 b0.78 ± 0.13 a0.62 ± 0.12 b
Ash (%)2.76 ± 0.12 b2.97 ± 0.24 a2.66 ± 0.36 b2.87 ± 0.29 a
Carbohydrate (%)57.9 ± 0.45 b58.8 ± 1.15 a59.1 ± 1.34 a58.2 ± 2.77 b
Values represent the average ± standard deviation of two independent bread formulations done in triplicate (n = 6). Letters in the same row are significantly different (p < 0.05). Control: breads made with rice flour, potato and corn starches. QF: GF breads made with 20% quinoa flour. GQ: GF breads made with 20% germinated quinoa flour. QSD: GF breads made with 30% quinoa sourdough.
Table 6. Sensory scores obtained for each attribute evaluated.
Sensory AttributeRFGQFQSDFp-Value
Elasticity4.85 ± 0.116.02 ± 0.326.46 ± 0.095.823.00 × 10−3
Crust color6.62 ± 1.014.71 ± 0.244.83 ± 0.1816.12.62 × 10−7
Crumb color4.35 ± 0.554.00 ± 0.333.61 ± 0.082.399.30 × 10−2
Acid smell2.98 ± 1.123.27 ± 0.114.86 ± 0.1012.94.62 × 10−6
Acid taste2.01 ± 0.932.50 ± 0.052.81 ± 0.0733.11.54 × 10−13
Sweet taste1.93 ± 0.121.88 ± 0.321.21 ± 0.324.041.90 × 10−2
Salty taste3.11 ± 0.103.15 ± 0.093.24 ± 0.380.089.30 × 10−1
Sour taste1.29 ± 0.051.07 ± 0.022.17 ± 0.077.071.00 × 10−3
Crumb dryness3.67 ± 0.236.68 ± 0.116.36 ± 0.0934.73.94 × 10−14
Aroma4.89 ± 0.594.45 ± 0.105.48 ± 0.053.991.90 × 10−2
Values represent the scores (average ± standard deviation) of 30 untrained panelists. Gluten-free breads supplemented with 20% whole quinoa flour (QF), 20% germinated quinoa flour (GQ), and 30% quinoa sourdough (QSD). Data represent average scoring of two independent sensory analysis conducted with 30 untrained panelists (n = 60).
Publisher’s Note: MDPI stays neutral with regard to jurisdictional claims in published maps and institutional affiliations.

