Article

Bored Coffee Beans for Production of Hyaluronic Acid by Streptococcus zooepidemicus

by
David Antonio Flores-Méndez
1,
José Roberto Ramos-Ibarra
1,
Guillermo Toriz
2,3,
Enrique Arriola-Guevara
1,
Guadalupe Guatemala-Morales
4,* and
Rosa Isela Corona-González
1,3,*
1
Departamento de Ingeniería Química, CUCEI-Universidad de Guadalajara, Guadalajara C.P. 44430, Mexico
2
Departamento de Madera Celulosa y Papel, Universidad de Guadalajara, Zapopan C.P. 45110, Mexico
3
Instituto Transdisciplinar de Investigación y Servicios, CUCEI-Universidad de Guadalajara, Zapopan C.P. 45150, Mexico
4
Unidad de Tecnología Alimentaria, Centro de Investigación y Asistencia en Tecnología y Diseño del Estado de Jalisco, A.C., Guadalajara C.P. 44270, Mexico
*
Authors to whom correspondence should be addressed.
Submission received: 10 June 2021 / Revised: 13 July 2021 / Accepted: 14 July 2021 / Published: 17 July 2021
(This article belongs to the Special Issue Bioconversion of Lignocellulosic Materials to Value-Added Products)

Abstract

:
Bored coffee beans (BCBs) are the residues left from the pest Hypothenemus hampei that attacks coffee crops, resulting in enormous economic losses. The bioconversion of monosaccharides from BCBs into hyaluronic acid (HA) is appealing both for using the residues and given the high commercial value of HA. This study dealt with the production of HA using Streptococcus zooepidemicus by employing either acid (AcH) or enzymatic (EnH) hydrolyzates from BCBs. The highest release of monosaccharides (evaluated using surface response methodology) was obtained with EnH (36.4 g/L); however, S. zooepidemicus produced more HA (1.5 g/L) using AcH compared to EnH. Hydrolyzates from acetone-extracted BCBs yielded 2.7 g/L of HA, which is similar to the amount obtained using a synthetic medium (2.8 g/L). This report demonstrates the potential of hydrolyzates from bored coffee beans to produce HA by S. zooepidemicus.

1. Introduction

Coffee is the most consumed drink in the world; for instance, during 2018–2019, around 10 million tons of coffee grains were consumed [1,2]. However, the pest known as coffee berry borer beetle (Hypothenemus hampei) has the largest negative economic impact to coffee farms, as it causes worldwide annual loses above USD 500 million, and severe infestation may result in 50% crop loss [3]. Bored coffee beans (BCBs) lack the quality required for roasting and alternative uses aside from the extraction of oil must be sought [4]. Coffee residues such as the outer shell, pulp, and spent coffee grounds have been used for microbial production of bioethanol, biodiesel, biogas, citric acid, gibberellic acid, and xylanase, amongst other products [5]. These examples demonstrate the potential of BCB as a source of carbohydrates for the microbial production of industrial metabolites with high added value such as hyaluronic acid.
Hyaluronic acid (HA) is a linear glycosaminoglycan with alternating β-1,3 and β-1,4 glycosidic linkages [6], whose viscoelastic properties, high moisture retention, and biocompatibility allow for a wide range of biomedical applications that include the treatment of osteoarthritis by viscosupplementation, ophthalmic surgery, cosmetic surgeries, controlled release of drugs, tissue engineering, moisturizing creams for the skin, wound healing, etc. The cost of HA ranges from 2000 to 60,000 USD/kg, depending on the application, purity, and molecular weight [7,8]. HA can be obtained from animal tissues such as rooster combs and bovine vitreous humor; however, the amount of tissues is scant, the risk of viral infections is high, and the purification steps are costly. This situation has spurred the interest in the microbial production of HA, from which yields are high, the production costs are lower, and the purification processes are more efficient [9]. Some strains/species of Streptococci show a high production of HA, such as Streptococcus zooepidemicus, S. pyogenes, S. equisimilis, and S. thermophiles, and other genetically modified microorganisms such as Bacillus subtilis, Lactococcus lactis, Escherichia coli, and Lactobacillus acidophilus [6,10]. Particularly, Streptococcus zooepidemicus has regulatory acceptance by the FDA in the USA and by the MHRA in the U.K., and is already used industrially [6,8]. However, the costs associated with the production of HA (mainly the sources of carbon and/or nitrogen for cultivation media) have lagged behind the commercial competitiveness of the microbial path [11]. A plausible alternative to reduce the cost of bacterial cultivation is the use of agroindustrial residues, such as those from the coffee industry.
The goal of this study was to evaluate the production of HA by S. zooepidemicus from bored coffee beans. To the best of our knowledge, this is the first report on the production of HA from coffee residues.

2. Materials and Methods

2.1. Chemical Composition of Bored Coffee Beans

Bored coffee beans (BCBs, Coffea arabica) were kindly donated by a coffee farmer from the village of Pluma Hidalgo in the state of Oaxaca, México. The beans were ground in a mill Pulvex® (Maren, CD México, México) (Pulvex®) and sieved in a test sieve RX-29 (W.S. Tayler, Mentor, OH, USA); the particles retained in sieves 40 (0.42 mm) and 60 (0.25 mm) were used to determine the chemical composition and to carry out both the acid (AcH) and enzymatic hydrolysis (EnH). Ground beans were analyzed regarding moisture content [12], ash content [13], water extractives [14], solvent extractives [15], lignin [16], holocellulose [17], and cellulose [18]. Streptococcus equi subsp. zooepidemicus ATCC 35246 was purchased from the American Type Culture Collection (ATCC, Manassas, VA, USA).

2.2. Hydrolysis of Bored Coffee Beans

BCBs were hydrolyzed either by acid or enzymatically (10% load of solids i.e., 1 g of solids/10 mL solution) at conditions established with a central composite design (2 factors, 5 central points (replicates), and 4 axial points).
The acid hydrolyses (AcH) were carried out by varying the concentration of HCl (1–2% v/v) and the temperature (110–135 °C) for 45 min. After acid hydrolysis, samples were neutralized and then centrifuged at 10,000 rpm for 10 min. The supernatants were then passed first through a Sep-Pack C-18 (Waters®, Milford, MA, USA) cartridge and then through a 0.45 µm Millipore membrane. Glucose, xylose, arabinose, and mannose were quantified in an HPLC system Alliance e2695 (Waters®, Milford, MA, USA) provided with an RI detector (Waters® 2414), and an Aminex HPX-87C (300 mm × 7.8 mm, Bio-Rad, Hercules, CA, USA) column. HPLC-grade water was used as the eluent at 0.6 mL/min at 85 °C.
Enzymatic hydrolysis (EnH) was carried out at 50 °C and pH 5 (citrate buffer) for 20 h on an orbital shaker KS 4000i (IKA® Works, Inc., Wilmington, NC, USA) (KS 4000i, IKA®). Celluzyme (a mixture of cellulolytic enzymes from Trichoderma longibrachiatum, 90,000 CMCase/g activity) was employed. The concentration of enzyme (1–5 g/L buffer) and stirring (100–200 rpm) were the factors evaluated.
Once the enzymatic hydrolyses were conducted, the enzyme was thermally denatured; the samples centrifuged at 10,000 rpm for 10 min; the supernatant neutralized; and the concentrations of glucose, mannose, xylose, and arabinose were determined by HPLC, as described above.
The yields (δ) of monosaccharides were calculated as shown in Equation (1).
δ i ( % ) = ( hexoses ) ( 0.9 ) + ( pentoses ) ( 0.88 )   ( g / L ) initial   holocellulose   in   solution   ( g / L ) × 100   i = AcH ,   EnH ,   AcHD ,   EnHD
The coefficients 0.9 and 0.88 result from the addition of water to each monosaccharide (hexose and pentose, respectively) after hydrolysis.
The relationship between the selected factors and the response variable was obtained from the central composite design that can be described by a quadratic polynomial model Equation (2):
Z = β 0 + β 1 V 1 + β 2 V 2 + β 11 V 1 2 + β 22 V 2 2 + β 12 V 1 V 2 + ε
where β0 is the constant term of the fitted model; β1 and β2, β11 and β22 are regression coefficients (linear and quadratic, respectively); β12 is the interaction coefficient; V1 and V2 are the independent coded variables; and ε is the experimental error. Data analysis, surface responses, polynomial models, and ANOVA were all conducted with Design-Expert 11 software. The effects were considered statistically significant at pvalue < 0.05.
To investigate the effect of organic extractives on the hydrolysis and fermentations, BCBs were acetone-extracted and then hydrolyzed either by acid or enzymatically under the best conditions dictated by the statistical model.

2.3. Post-Treatment of Acid Hydrolyzates

Acid hydrolyzates (AcH and AcHD) were ion-exchanged (250 g resin/Lhydrolyzates) with Amberlite IRA 96, (purchased from Sigma Aldrich, St. Louis, MO, USA) (Aldrich) in order to remove compounds such as hydroxymethyl furfural (HMF), furfural, and formic acid, which inhibit bacterial growth. Before and after ion-exchange treatment, the concentration of monosaccharides was quantified as above, whereas HMF, furfural, and formic acid were determined by HPLC provided with a diode array (Waters® 2998) and an Aminex HPX-87H column (300 mm × 7.8 mm, Bio-Rad), and run at 50 °C, using 5 mM H2SO4 at 0.6 mL/min as the eluent.

2.4. Microorganism and Culture Conditions

For preservation, Streptococcus equi subsp. zooepidemicus was periodically sub-cultured in brain-heart infusion (BHI) agar at 37 °C for 24 h.
Hyaluronic acid was biosynthesized by preparing a S. zooepidemicus inoculum as follows: a single colony was transferred to 200 mL BHI broth and then incubated at 37 °C at 200 rpm on an orbital shaker for 12 h. Later, this culture was inoculated (10% v/v) in the reactor production medium.
Batch cultures were formed in a 3 L bioreactor (Applikon®, JG Delft, Netherlands) (Applikon®) with a working volume of 2 L; the culture medium consisted of (g/L): monosaccharides in hydrolyzates, either acid or enzymatic (30); yeast extract (10); NaCl (2); K2HPO4 (2.5); and MgSO4×7H2O (1.5). A control cultivation was also performed using synthetic media with the same composition as above but with 30 g/L of glucose as the carbon source instead of hydrolyzates. Culture media were autoclaved for 15 min. Cultures were carried out at 37 °C, 300 rpm, pH was set constant at 7 (controlled with NaOH 5M during cultivation), with 1 vvm air flow, and 5% dissolved oxygen. All the runs were duplicated.
The concentration of biomass, HA, monosaccharides, and lactic acid were determined in samples as follows: The biomass content was determined by dry weight; first hyaluronic acid was separated from cells by treating culture samples with equal volumes of sodium dodecyl sulfate (0.1 w/v) for 10 min [19] and the mixture centrifuged at 10,000 rpm for 10 min. Then, the precipitate was washed twice with distilled water and centrifuged again at 10,000 rpm for 10 min, and then dried and weighed. The supernatant was used to quantify products (hyaluronic acid, monosaccharides, and organic acids) by HPLC. Hyaluronic acid was determined by following the methodology described by [19] using an IR detector (Waters® 2414), an Ultrahydrogel 2000 column (7.8 × 300 mm; Waters) at 70 °C, and NaNO3 100 mM as the eluent at 0.8 mL/min. Monosaccharides were quantified as described in Section 2.2, whereas LA was determined under the same conditions as furfural and formic acid described before.

2.5. Kinetic Parameters

Maxima specific growth rate (µmax,1/h), HA, LA production (qHA-max, qLA-max, g/g h), and substrate consumption (qG-max, qM-max, g/g h) were calculated in the exponential phase for each time interval by taking the mean cell concentration ( X ¯ , g/L), as shown in Equations (3)–(5). Yields (YLA/S, YHA/S, y YX/S, g/g) were calculated from the slope of the straight line obtained by plotting increasing amounts of products (LA − LA0), (HA − HA0), or biomass (X − X0) as function of the substrate consumption (S − S0) according to Equation (6). Productivities (g/L h) for HA (rHA) and LA (rLA) were calculated according to Equation (7) by dividing the respective variable (HA or LA) over fermentation time. Samples were obtained in 1 and 2 h periods. Equations (3)–(7):
μ max = ( 1 / X ¯ ) × ( Δ X / Δ t ) .
q j max = ( 1 / X ¯ ) × ( Δ S / Δ t )   j = G , M
q k max = ( 1 / X ¯ ) × ( Δ P / Δ t )   k = LA , HA
Y f / S = Δ i / Δ S   f = LA , HA , X
r i = Δ i / Δ t   i = LA , HA
where G, M, and X, are glucose, mannose, and biomass concentrations, respectively; Δ is the increased at each interval in the respective variable.

3. Results

3.1. Chemical Composition of Bored Coffee Beans

Table 1 shows the chemical composition of the bored coffee beans (BCBs) analyzed in this investigation. The polysaccharides amount was 58.5% (holocellulose: 31.6% corresponds to cellulose and 26.9% to galactomannans). The lignin content was 2.1%, while the amount of water-soluble compounds (which include part of arabinogalactans and pectins) was 25.4 wt %. Acetone-extractives corresponded to 11.9 wt %.
Organic solvent extractives comprise non-saponifiable substances and fatty acids (linoleic and palmitic acids). The ash content was 2 wt %, and represents the mineral content in coffee beans that can be used in media cultures since microorganisms can use minerals for growth.

3.2. Acid Hydrolysis of Bored Coffee Beans and Acetone-Extracted Bored Coffee Beans

Acid hydrolysis (AcH) of bored coffee beans was evaluated through a surface response methodology. The factors under study were concentration of HCl (0.79–2.2%) and reaction temperature (106–134 °C). Table 2 shows the results from the central composite design; the highest monosaccharide concentration (32.5 g/L) was achieved with 2% HCl at 130 °C. Both temperature and HCl concentration were significant at a p-value < 0.05, (0.0001 and 0.0052, respectively), with a mean of 23.67 g/L and a standard deviation of 1.61 g/L.
Figure 1 shows the surface response for AcH; the higher concentration of monosaccharides was obtained at higher HCl concentration and temperature.
According to the quadratic polynomial model (Equation (8), R2 = 0.948 and fitted R2 = 0.912), the concentration of sugars can be maximized up to 35 g/L at 134 °C and 2.2% HCl.
Z = 161.12 26 V 1 + 2.76 V 2 + 7.42 V 1 2 0.009 V 2 2 + 0.069 V 1 V 2
Therefore, subsequent experiments were run at 2% HCl (v/v) and 130 °C, obtaining 29.7 ± 1.4 g/L monosaccharides; according to the model, 32.3 g/L monosaccharides should be obtained.
To observe whether the presence of lipids interferes with the recovery of monosaccharides during acid hydrolysis, acetone-extracted bored coffee beans were also treated with 2% HCl at 130 °C (AcHD). With AcHD, we found 31.6 ± 0.57 g/L of monosaccharides, 0.42 ± 0.05 g/L of HMF, 0.23 ± 0.003 g/L of furfural, and 1.41 ± 0.23 g/L of formic acid.

3.3. Enzymatic Hydrolysis of Bored Coffee Beans and Acetone-Extracted Bored Coffee Beans

For enzymatic hydrolysis (EnH) of bored coffee beans, the enzyme load (0.17–5.8 g/Lbuffer) and shaking (80–220 rpm) were the factors analyzed. At 5 g/L enzyme load and 100 rpm (Table 3), the highest amount of sugars was obtained (36.4 g/L). ANOVA showed that the load of enzyme was the only significant factor (p-valueenzyme load = 0.0001 and p-valueagitation = 0.1474) at the 95% confidence level. Figure 2 shows the surface response for EnH; increasing the enzyme load resulted in an increased concentration of monosaccharides. At 4.8 g enzyme/L and 163 rpm, the expected response is 36.4 g/L according to the statistical model (Equation (9), R2 = 0.933 and adjusted R2 = 0.886).
Z = 6.99 + 13.022 V 1 + 0.138 V 2 1.16 V 1 2 0.0002 V 2 2 0.01 V 1 V 2

3.4. Comparison between Hydrolytic Treatments

Figure 3 shows the concentration of sugars obtained from the optimal enzymatic hydrolysis (EnH) or acid hydrolysis (AcH) of both acetone-extracted or non-extracted bored coffee beans (EnHD and AcHD, respectively). Mannose, glucose, and arabinose were found. Interestingly, the highest concentration of mannose was found in the samples of acetone-extracted coffee beans subjected to acid hydrolysis (AcHD, 26.4 g/L), whereas glucose was found at only 4.2 g/L and arabinose at about 1 g/L.
The highest yield of monosaccharides was obtained by the enzymatic hydrolysis of extracted bored-coffee beans (EnHD); this treatment resulted in glucose as the main hydrolyzate (33.5 g/L), mannose was found at 5.2 g/L, and arabinose was found in even lower quantities (0.19 g/L).
Recovery yields of monosaccharides for acid and enzymatic hydrolysis (δAcH = 52.3% and δEnH = 64.5%) where higher compared to those of the extracted samples (δAcHD = 45.4% and δEnHD = 56.1%) because the amount of holocellulose was increased in the extracted samples from 58.5% to 66.4%.

3.5. Post-Treatment of Acid Hydrolyzates

After acid hydrolysis, hydrolyzates contain a high concentration of chloride (pH < 1) and other compounds that inhibit the growth of S. zooepidemicus. To remove such compounds, the acid hydrolyzates were passed through an ionic exchange resin (Amberlite IRA 96). However, resins retain also some carbohydrates. Table 4 shows the concentration of monosaccharides, formic acid, HMF, and furfural before and after ionic exchange. It can be seen that the resin retained 6.9 g/L (24.1%) of carbohydrates for AcH and 6.2 g/L (17.9%) of carbohydrates for AcHD. Since acid hydrolyzates mainly contain mannose, a control solution of 32 g/L mannose was passed through the ion exchange resin and 5.1 g/L mannose was retained (16%), which is similar to the amount retained from the acid hydrolyzates. HMF removal was higher than 70% in both AcH and AcHD, being higher in the latter. Formic acid was higher in AcHD, while HMF was higher in AcH; regardless, the final concentration of both HMF and formic acid was lower to 0.22 g/L. In both hydrolyzates, pH increased from one to near seven. The post-treated acid hydrolyzates were used for the subsequent microbial production of HA.

3.6. Hyaluronic Acid Production from Bored Coffee Beans Hydrolyzates

Hyaluronic acid (HA) was biosynthesized by Streptococcus zooepidemicus using a variety of hydrolyzates from bored coffee beans (AcH, EnH, AcHD, and EnHD). Figure 4 shows the growth, substrate consumption, and production of HA and lactic acid (LA) by S. zooepidemicus in culture media formulated with the hydrolyzates and a synthetic medium as a comparison. Table 5 lists the kinetic parameters of interest. The maximum concentration of biomass was between 2.2 and 2.4 g/L, the specific maximum growth rate (µmax) ranged from 0.24–0.28 1/h, and biomass yield (YX/S) ranged from 0.06 to 0.10 g/g. The achieved concentrations of HA ranged from 1.5 at 2.8 g/L, while the maximum specific production rate of HA (qHA-max) ranged from 0.11–0.34 g/g h. HA yield (YHA/S) was 0.04 to 0.13 g/g and productivities of HA (rHA) were between 0.09 and 0.34 g/L h. For lactic acid (LA), the concentration was from 14.2 to 18.8 g/L; the maximum specific lactic acid production rate (qLA-max) ranged from 1.1–2.2 g/g h. LA yield (YLA/S) was 0.59–0.69 g/g h and productivities of LA (rLA) were 1.3–1.9 g/L h.

4. Discussion

The chemical composition of bored coffee beans is similar to that of green coffee as reported by others [20,21,22]. According to our results, given the high carbohydrate polymers content (cellulose, galactomannans, and arabinogalactans) and the low lignin content, bored coffee bean (BCB) is an excellent candidate to be employed for the production of HA by microbial cultures. Notably, agricultural residues with higher lignin contents often require a pretreatment (physical, chemical, or biological) in order to remove lignin; examples of such materials include rice straw (12–24%), wheat straw (17–19%), corn straw (8%), and corn stubble (7–21%) [23]. Moreover, water extractives, which contain carbohydrates, represent 25 wt % in bored coffee beans. Different studies have reported the presence of caffeine, phenolic compounds (chlorogenic acids), diterpenes (cafestol and khaweol), sucrose, glucose, and fructose in aqueous extracts of green coffee [24,25]. The differences found in the chemical composition between green coffee beans and bored coffee beans can be attributed to the differences in the environmental conditions and soil composition [1].
Streptococcus zooepidemicus uses monosaccharides as the substrate for the production of HA; therefore, the polysaccharides from bored coffee beans need to be hydrolyzed. The majority of studies on the revalorization of industrial coffee residues have focused mainly on the pulp, outer skin, coffee parchment, and spent coffee grounds [5]; however, there are no reports on the hydrolysis of bored coffee beans. In this study, acid and enzymatic hydrolyses of BCB and acetone-extracted BCB were carried out.
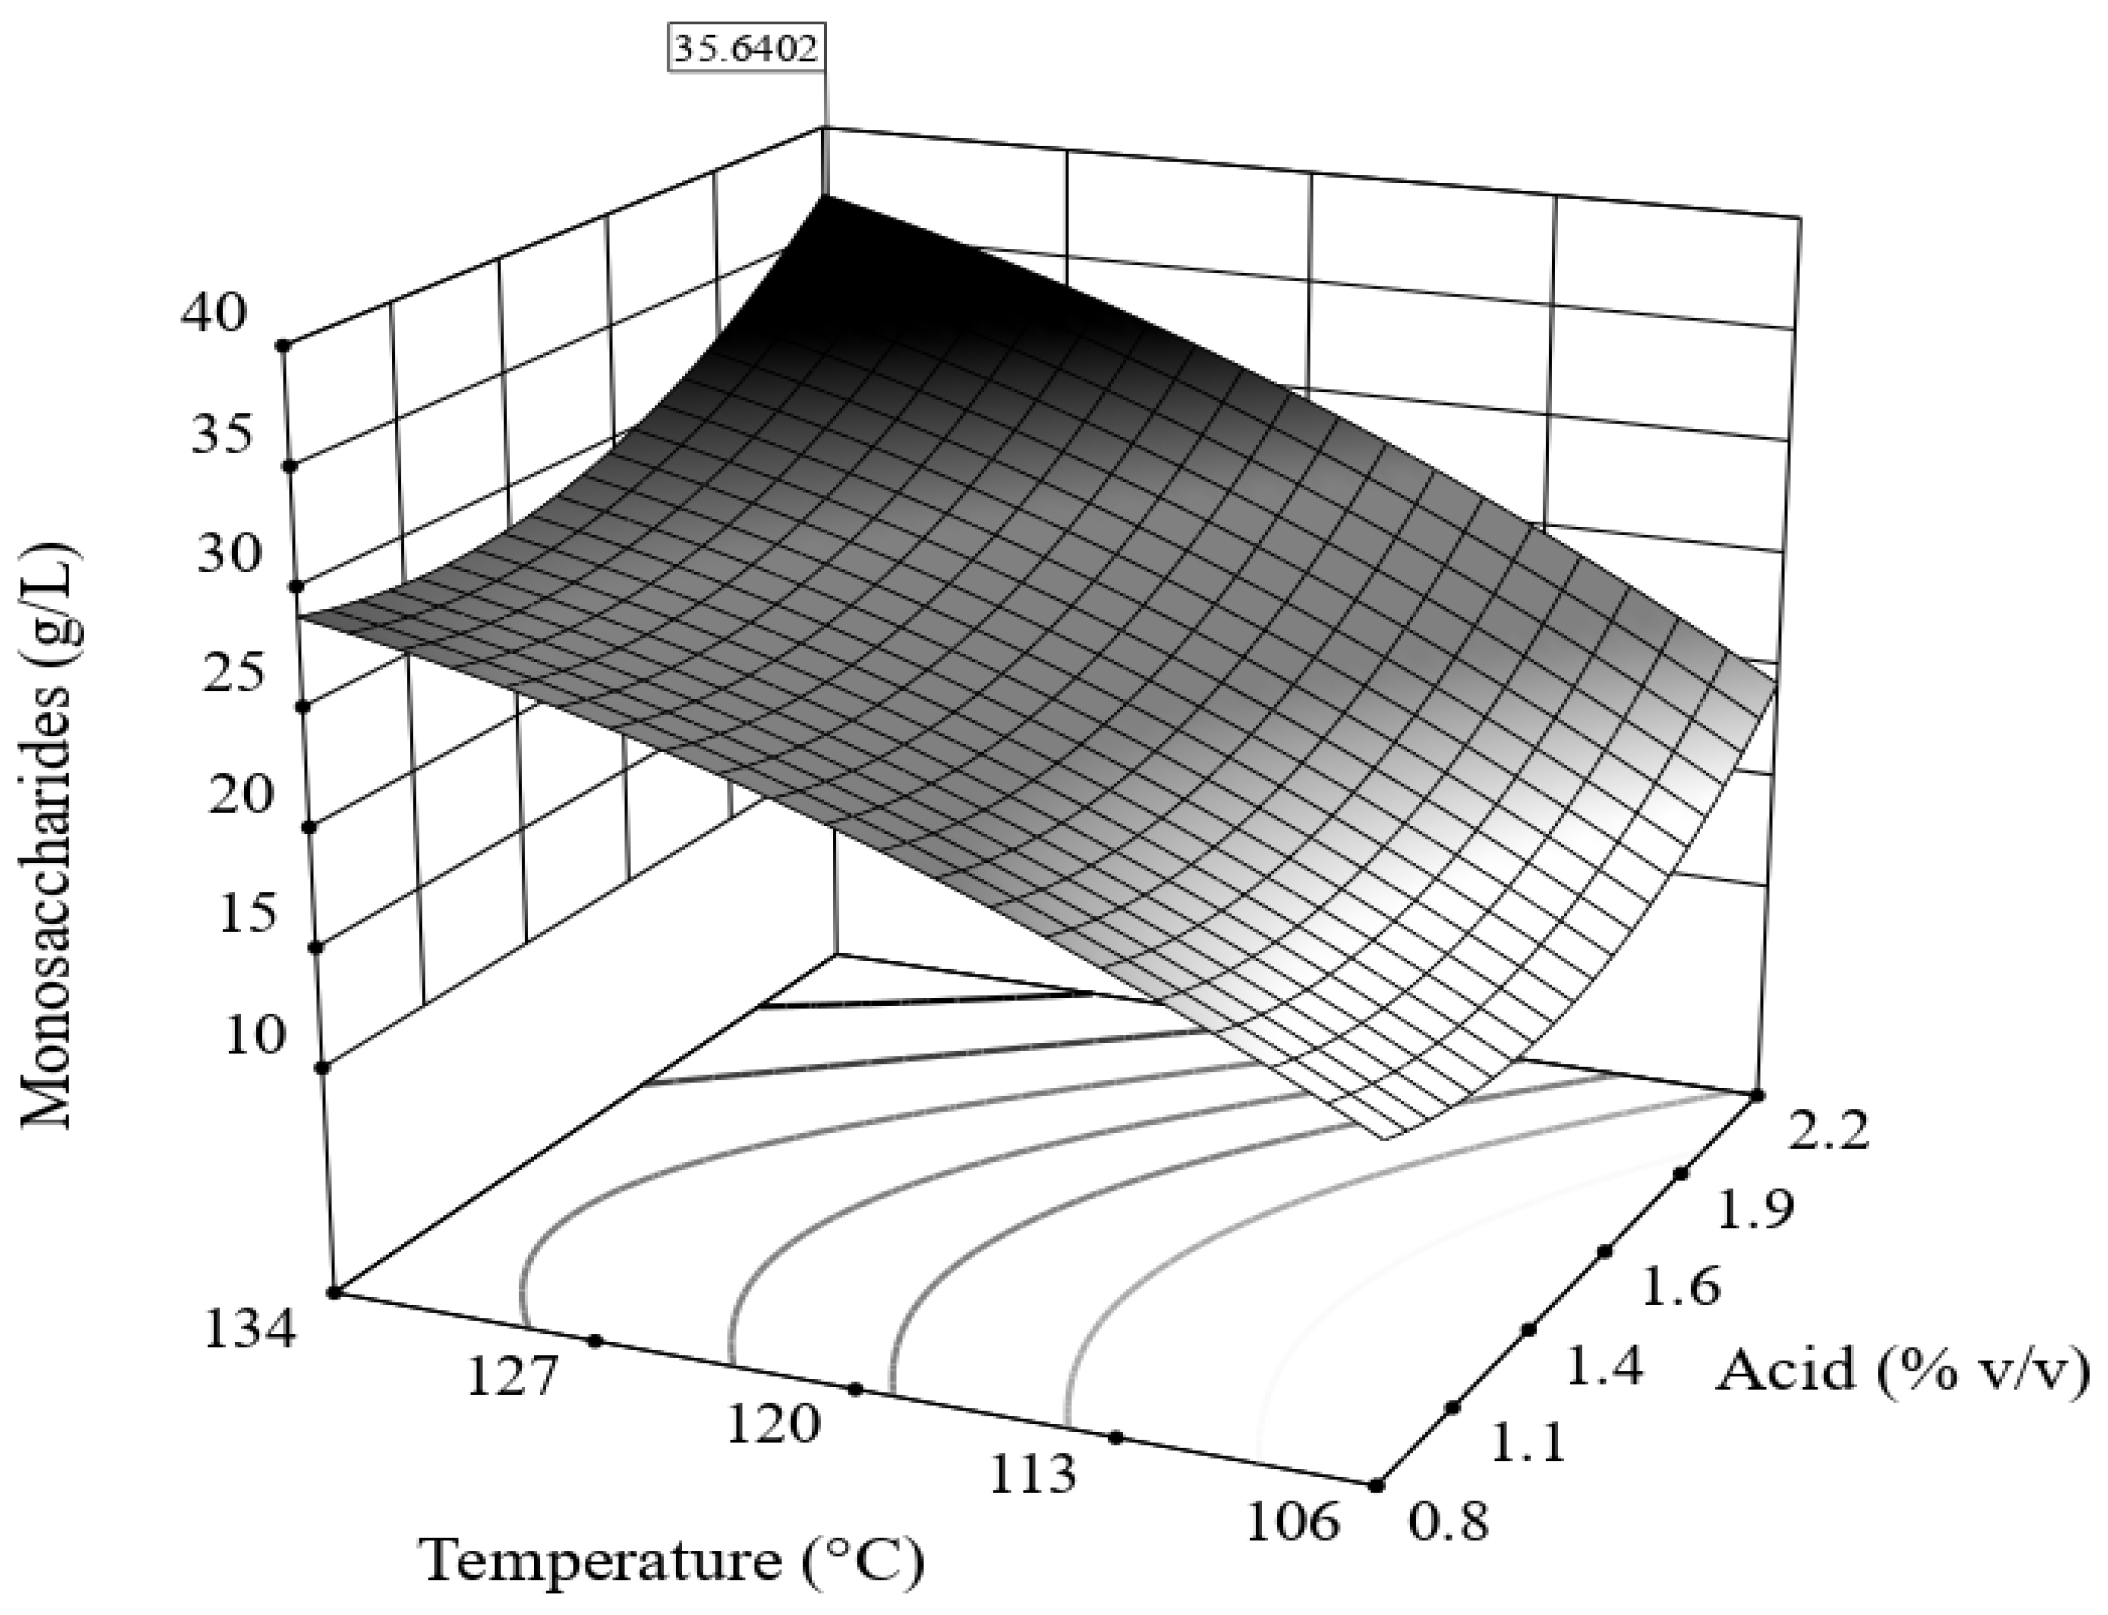
From acid hydrolysis (AcH), similar amounts of products were obtained as in non-extracted bored coffee beans (32.5 g/L, Table 2) and acetone-extracted BCBs (31.6 ± 0.57 g/L). Juarez et al. [26] found 33.4 g/L reductive sugar in the hydrolysis of spent coffee grounds; Kumar et al. [27] obtained 30.29 g/L reductive sugars from sugar cane bagasse using HCl (2.5% v/v), and Pedroso et al. [28] obtained 17.8 g/L sugars from the hydrolysis of rice husks using HCl (1.5% v/v).
The statistical model for acid hydrolysis (Equation (8)) suggests that a higher concentration of monosaccharides should have been obtained. This finding indicates that some monosaccharides were degraded, as HMF (0.103 g/L) and formic acid (3 g/L) were found. During acid hydrolysis, monosaccharides may degrade to furfurals and formic acid. Kupiainen et al. [29] showed that increasing H2SO4 concentration from 1–5% in the hydrolysis of spent coffee grounds increased the concentrations of HMF and furfural (0.056 and 0.012 g/L, respectively). Taherzadeh et al. [30] reported that the addition of 2 g/L of HMF decreased the specific growth rate of S. cerevisiae 40% compared to a control with no HMF. Therefore, it is important to determine the hydrolysis conditions that maximize the recovery of monosaccharides and reduce the generation of furfurals and acetic and formic acids.
Notably, acid hydrolyzates require an ion-exchange treatment for the elimination of HMF, furfural, and formic acid to avoid the inhibition of S. zooepidemicus growth before HA production. Sugar retention in ion-exchange resin might be attributed to the interaction of OH groups with tertiary amines in the resin. Considering the loss of sugars, the concentration of monosaccharides was adjusted to the concentration of sugars before the ion-exchange resin treatment.
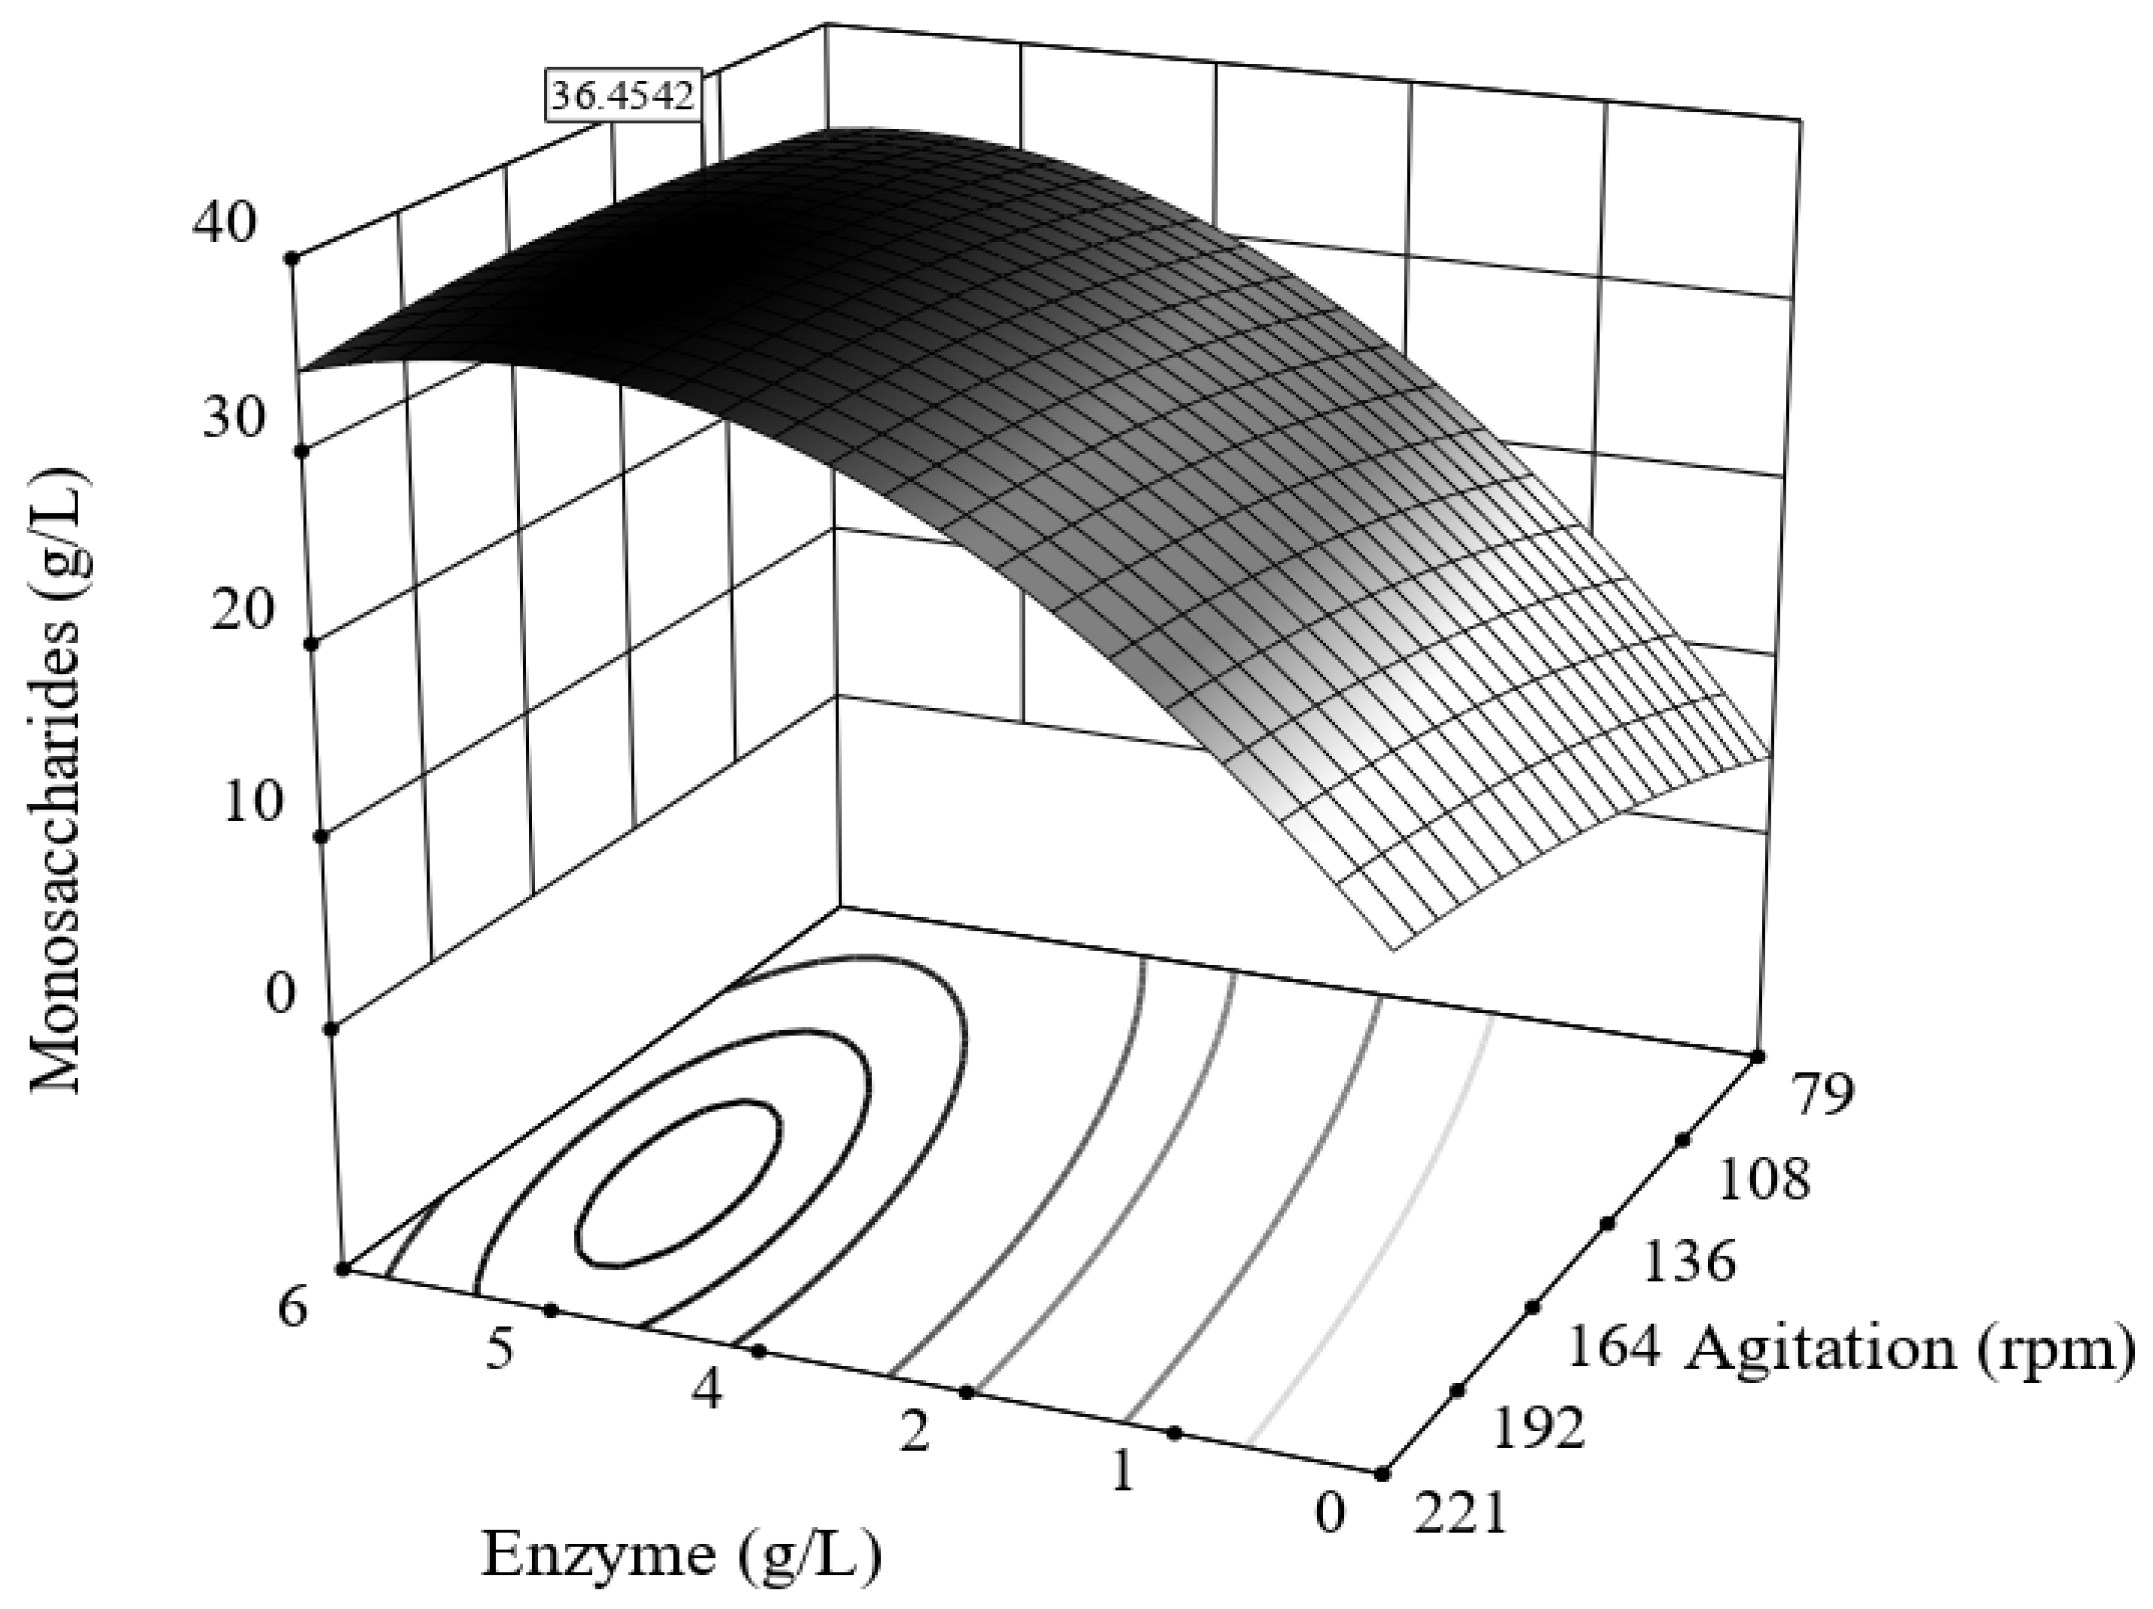
The differences between 3 and 5 g/L enzyme loads are minimal because the surface response is already at the maximum and it is more convenient from an economical point of view to keep the enzyme load at the medium point (3 g/L).
A higher quantity of monosaccharides was obtained from the enzymatic hydrolysis of acetone-extracted BCB (EnHD, 39 ± 0.60 g/L) in comparison to non-extracted bored coffee beans (EnH, 36.7 ± 0.65 g/L monosaccharides); the higher yield in acetone-extracted BCB might be associated with an increased exposure of polysaccharides in BCBs, as seen by Kwon et al. [31], who reported an increased yield of glucose (from 15 to 18 g/L) after extracting spent coffee grounds. Niglio et al. [32] obtained 35 g/L of sugars from the enzymatic hydrolysis of alkali-treated coffee silverskin. Seong et al. [33] carried out enzymatic hydrolysis of HCl-treated spent coffee grounds and obtained 40.6 g/L of sugars. Notably, bored coffee beans and acetone-extracted bored coffee beans require no alkali or acid pretreatments and the obtained yields are consistent with the yields reported.
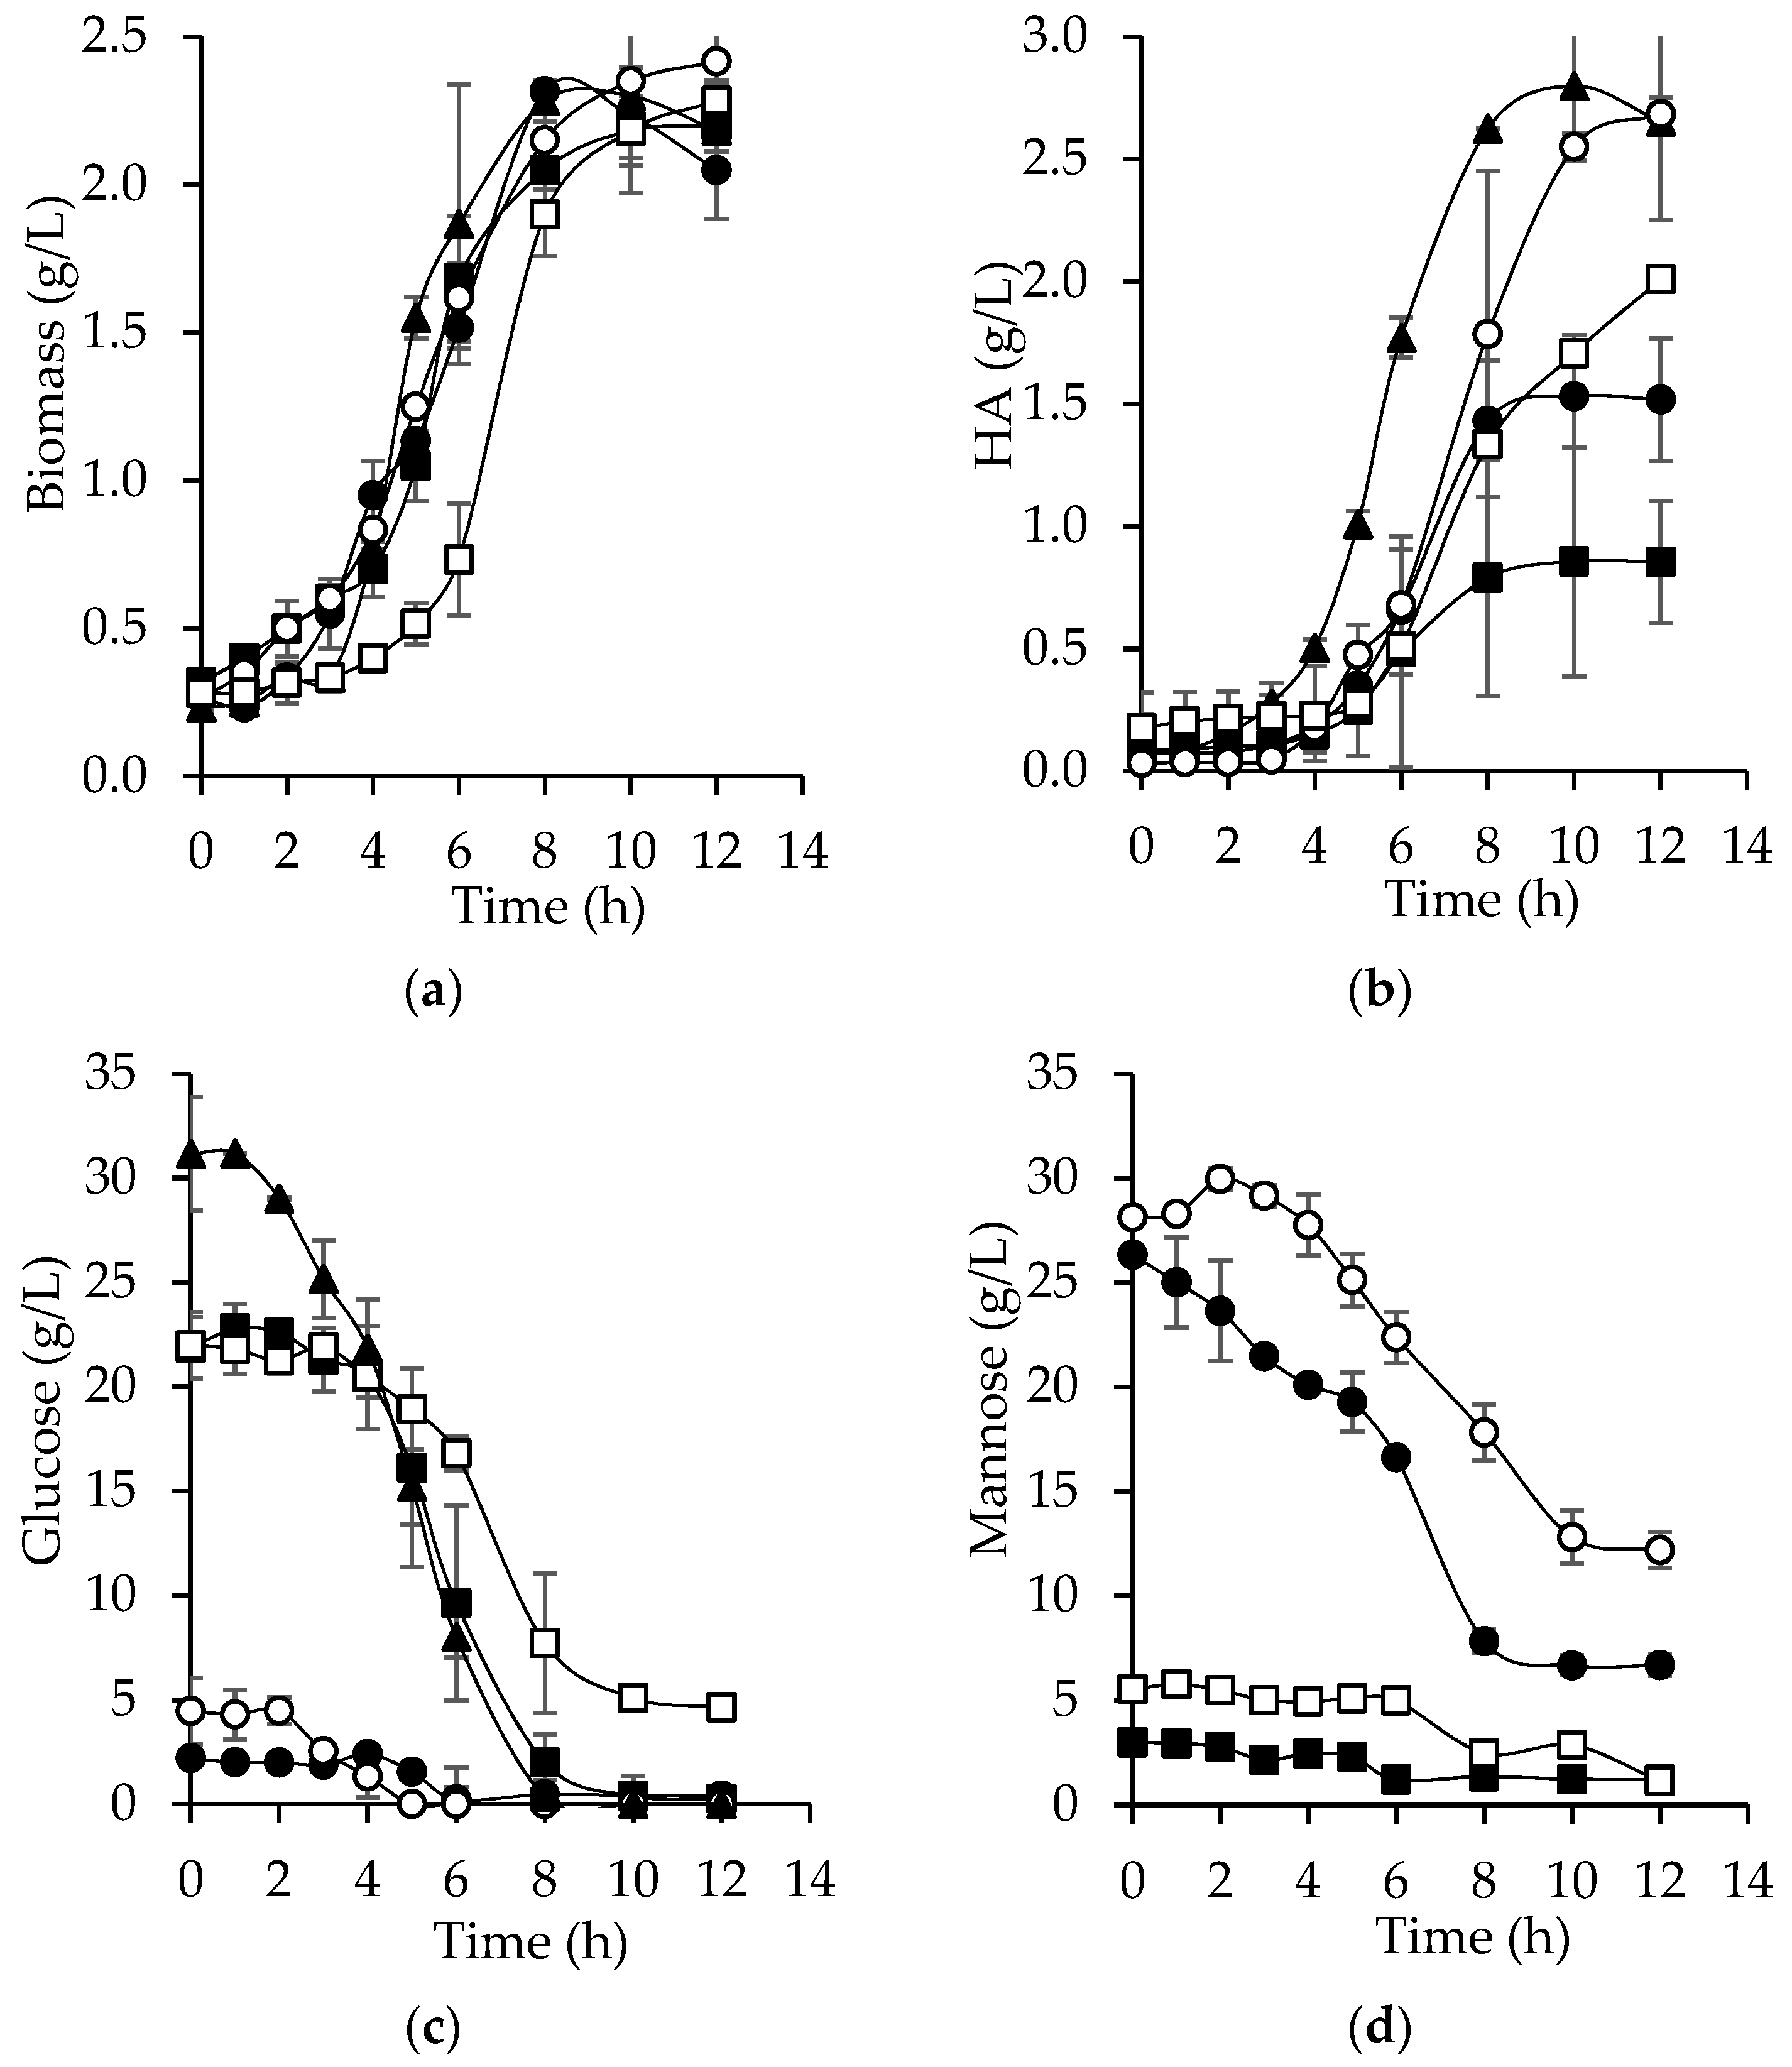
Both the acid and enzymatic hydrolyzates were used for the microbial production of HA. Bacterial growth was similar in all culture media (Figure 4a). The stationary phase was reached at 8 h, except for EnHD. Interestingly, biomass yields (YX/S) were higher with both hydrolyzates compared to the synthetic medium, possibly due to the existence of unidentified substrates. It was expected that the highest concentration of HA would be reached with the enzymatic hydrolyzates because the main substrate in these is glucose. Furthermore, in the enzymatic hydrolysis, compounds such as furfurals and formic acid, which inhibit the bacterial growth, were absent. However, the highest concentration of HA (2.7 g/L) obtained with bored coffee beans hydrolyzates was achieved with AcHD at 12 h (Figure 4b), similar to the amount obtained with the synthetic medium at 8 h (2.8 g/L). This behavior can be explained because there were probably other unidentified substrates in the AcHD that 
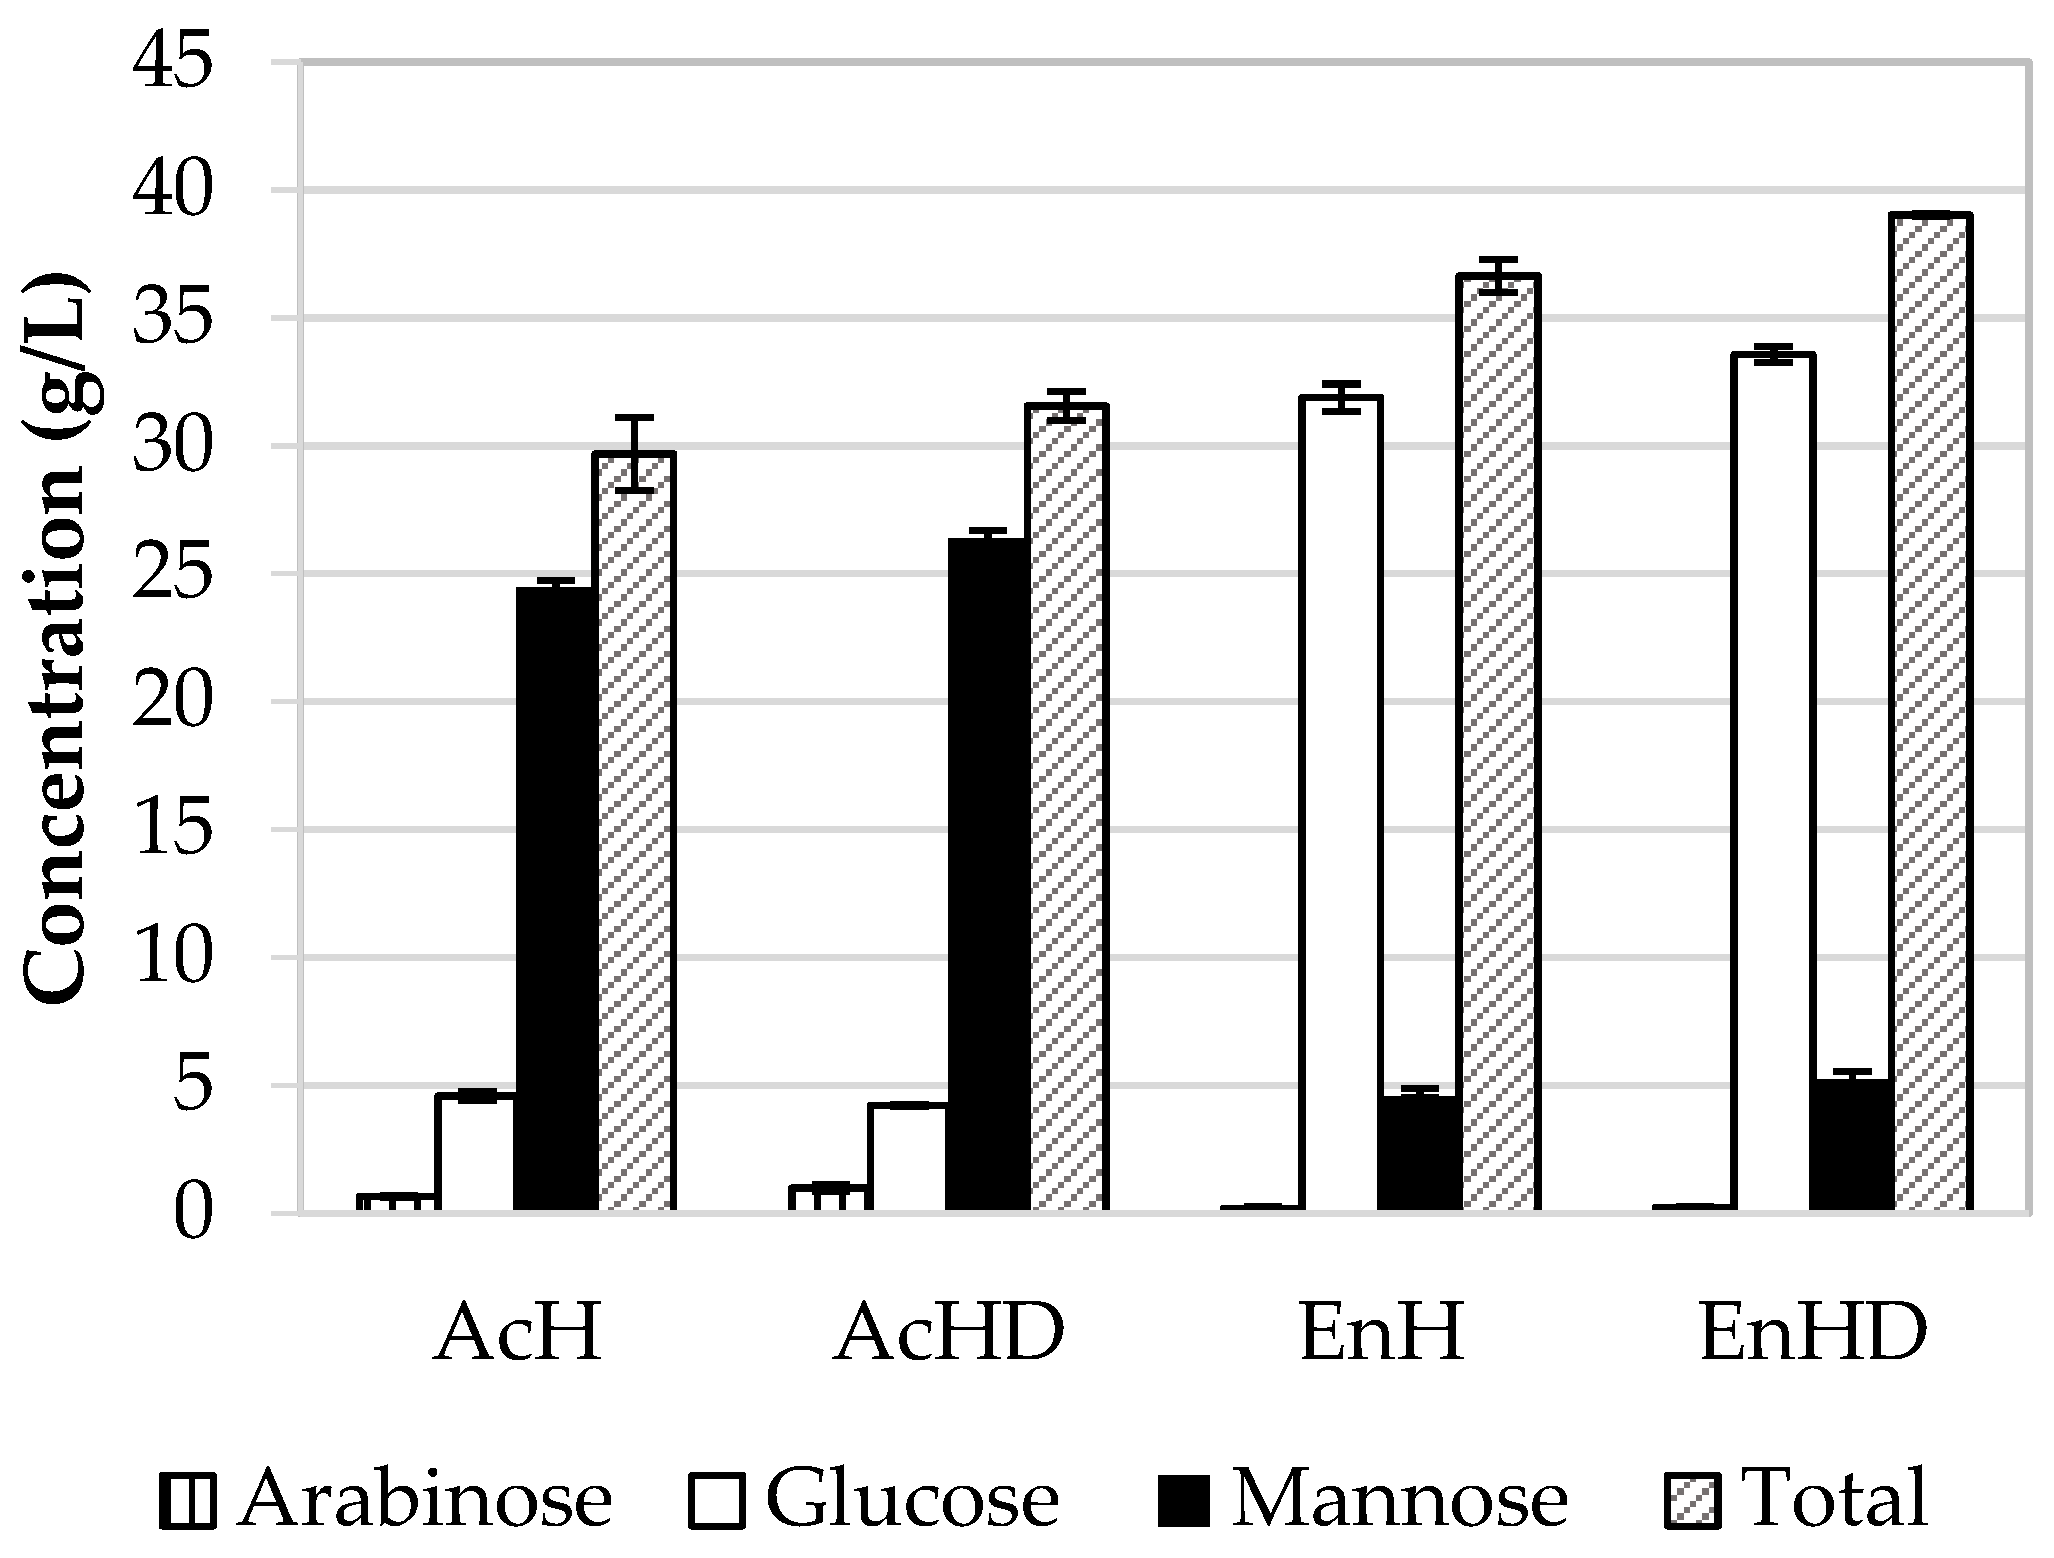
S. zooepidemicus was able to convert into HA. Additionally, a higher concentration of HA was obtained using acetone-extracted bored coffee beans (AcHD and EnHD), achieving 1.8- and 2.3-fold increase in the HA amount, respectively, compared to un-extracted samples, probably because un-extracted bored coffee beans might contain compounds with antimicrobial activity such as quinic, malic, and chlorogenic acids, and caffeine [34]. The main monosaccharide in acid hydrolyzates is mannose; in the enzymatic hydrolyzates, the main sugar is glucose. Glucose originates from the degradation of cellulose, while the lower amount of mannose might be due to the low activity of endogenous mannanase in cellulase preparations from Trichoderma [35], as cellulase from fungi exhibits relatively low levels of galactomannan degradation in softwoods [
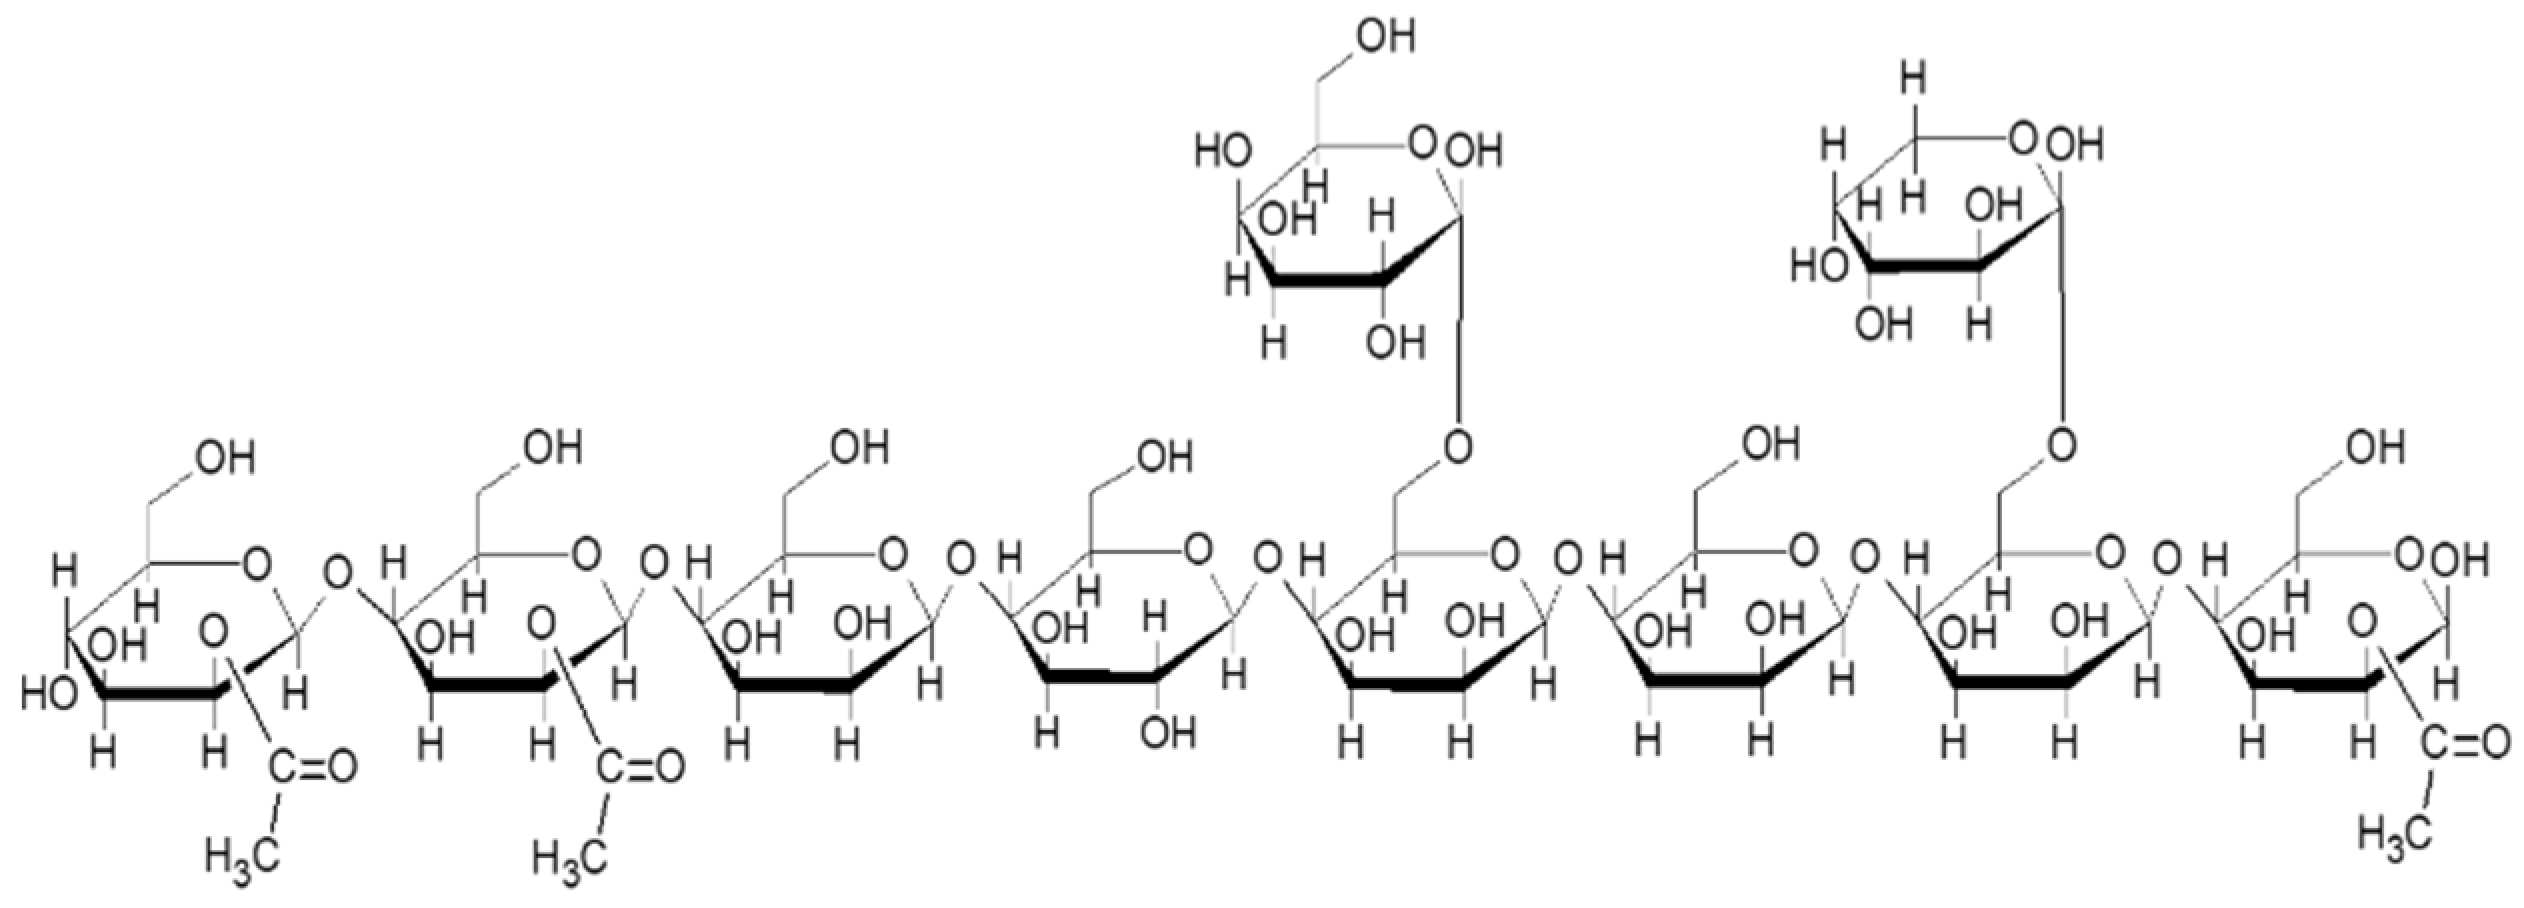
36]. Mannose originates from galactomannans, which, in green coffee, consist of a linear molecule composed of mannose residues linked by β-1,4 bonds with lateral galactose substituents with α-1,6 linkages, as seen in Figure 5. Other randomly distributed elements were also found such as glucose linked in the main backbone with β-1, 4 bonds, arabinose as a lateral group, and acetyl groups (up to 11%) in mannose [37].
Glucose consumption in the enzymatic hydrolyzates was higher and faster, as shown in Figure 4c and Table 5, compared to the consumption of mannose with acid hydrolyzates (Figure 4d, Table 5). Glucose is consumed more rapidly because mannose requires two enzymatic reactions to become fructose 6-P. First, it is converted into mannose 6-P by hexokinase, which has a lower affinity for mannose compared to glucose. Then, in order to be able to enter to glycolysis, it is converted to fructose 6-P by phosphomannose isomerase [38].
Interestingly, at 10 h, the consumption of mannose stopped (Figure 4d), which can be attributed to acetyl decorations that S. zooepidemicus is unable to assimilate. Chen et al. [39] demonstrated that by deacetylating xylan from corn baffles, the consumption of xylose improved and ethanol yields increased 10% during fermentation. Regarding arabinose, at the end of cultivation, no consumption was observed.
We obtained 2.0 g/L HA using EnHD hydrolyzates at 12 h cultivation. Productivity (rHA, Table 5) and the maximum specific rate of HA production (qHA-max) behaved similarly to the concentration, although the highest substrate conversion to HA was obtained with AcHD (YHA/S = 0.13 g/g). The yields of HA obtained with the hydrolyzates ranged between 0.04 and 0.13 g/g, which are comparable to those reported for this species (Table 6). For instance, Rohit et al. [6] reported 0.09 g/g (YHA/S) from palm sugar (Palmyra palm sugar), whereas Pan et al. [7] reported a 0.06 g/g yield from sugarcane molasses. Moreover, the maximum specific rate of HA production (qHA-max) was obtained with acetone-extracted acid hydrolyzates (0.27 g/g h), which is 2.4-fold higher than the value reported by Mohan et al. [40] with 30 g/L glucose (0.11 g/g h).
The production of HA obtained in this work is compared to those obtained in other studies in Table 6. It can be seen that the amount of HA obtained in this work was slightly higher without considering that the other reports employed a higher initial concentration of sugars, which demonstrates the potential of bored coffee beans for the production of HA.
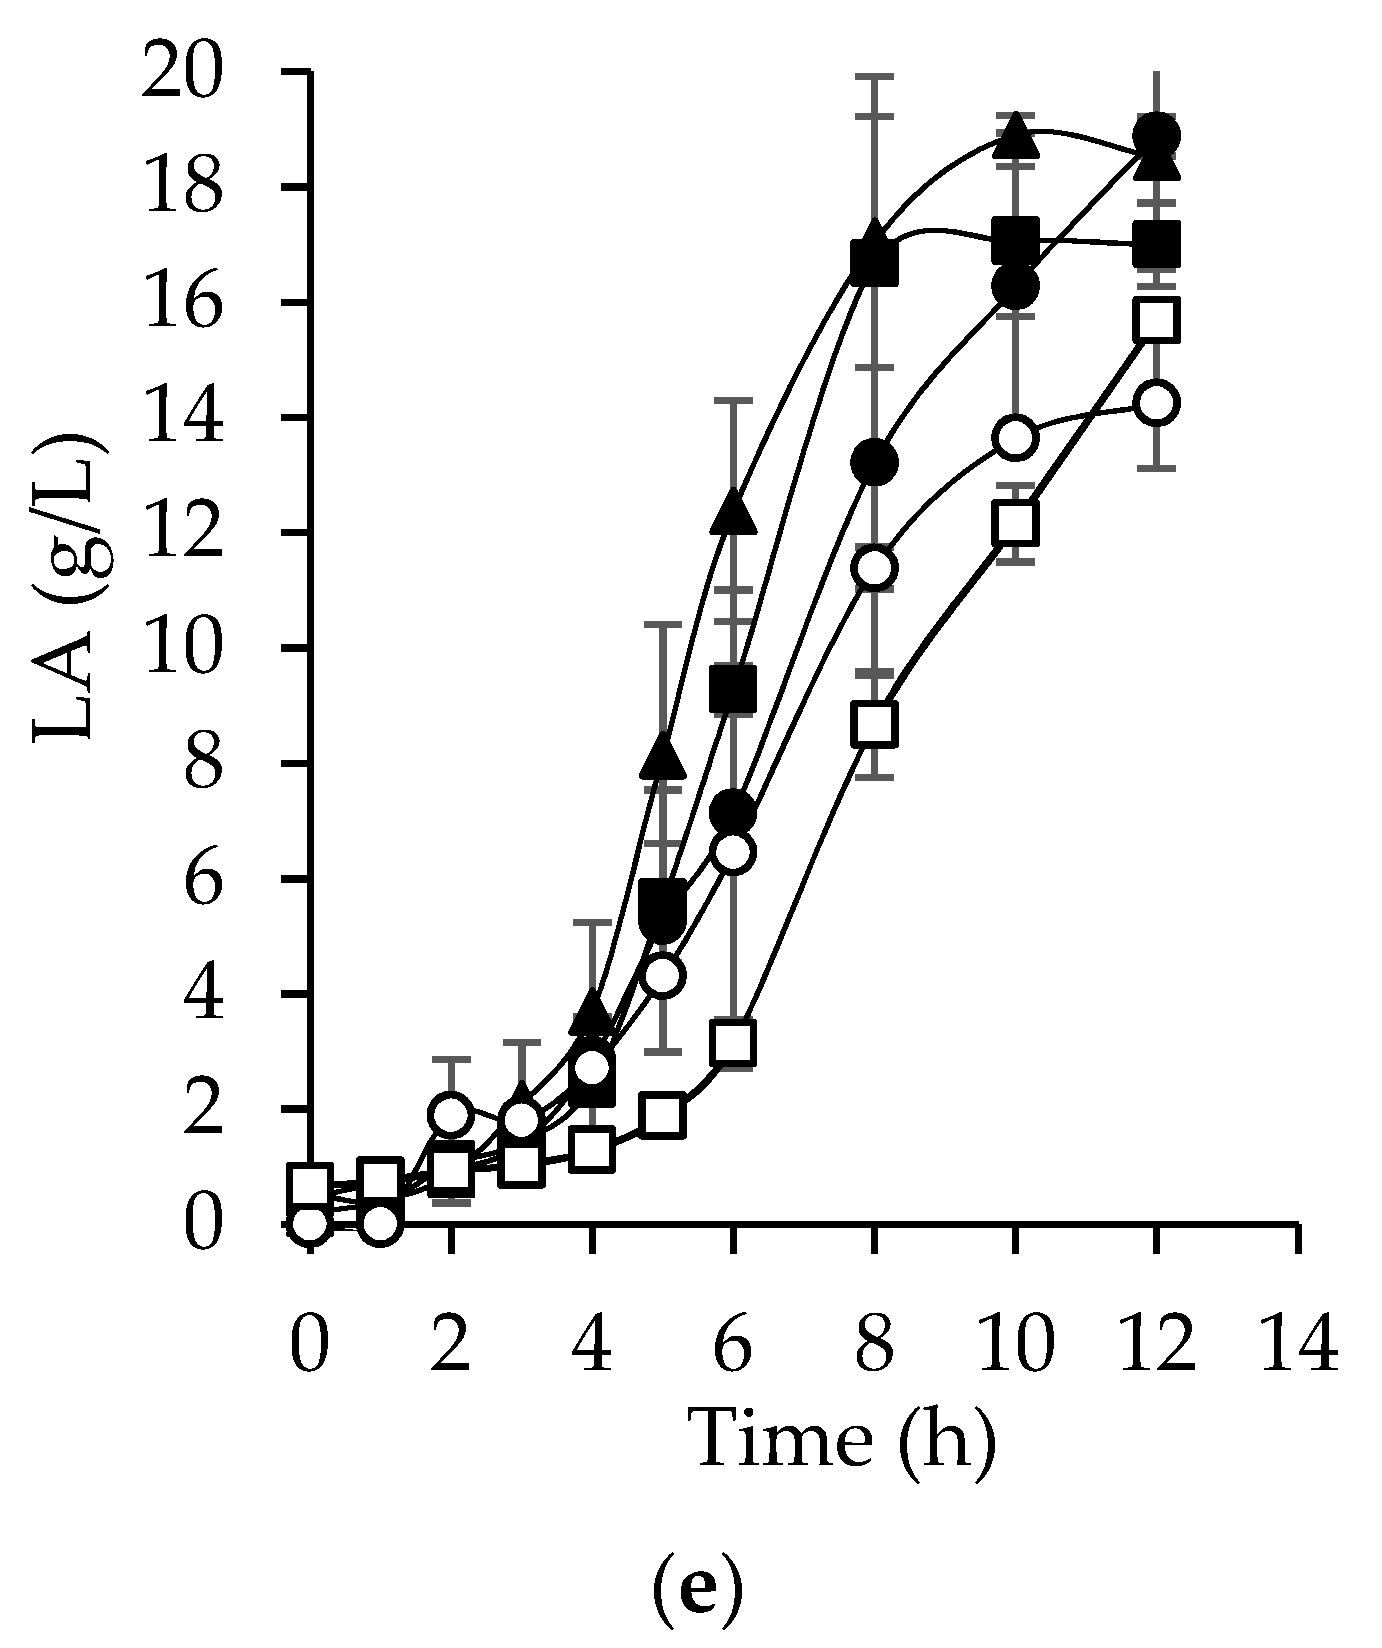
Lactic acid (LA) is a primary metabolite produced simultaneously with HA by S. zooepidemicus. Higher production of LA (Figure 4e), productivity (rLA, Table 5), and specific rate (qLA) were obtained with EnHD (18.8 g/L), slightly higher than those obtained with the synthetic medium (18.6 g/L). However, the concentration of LA with all hydrolyzates was at least 14 g/L and yields (YLA/S) ranged between 0.60 and 0.79 g/g, as seen in Table 5. S. zooepidemicus is a homolactic bacteria that uses the majority of the substrate for LA synthesis [42], which means that bacteria converted from 60% to 80% of the substrate into LA. The LA productivities obtained in this study (1.3 to 1.9 g/L h) agree with values obtained from other microorganisms such as Rhizopus oryzae NRRL 395 and Lactococcus lactis ATCC 19435, whose productivities are 1.62 and 1 g/L h, respectively [43].
Importantly, LA is the main product from the metabolism of S. zooepidemicus. LA is a versatile metabolite with applications in different industries such as pharmaceuticals, cosmetics, chemicals, and food. The possibility of collecting both HA and LA simultaneously is attractive since their separation is easy, thus increasing the added value of BCBs.

5. Conclusions

The potential of bored coffee beans for the production of HA was demonstrated. Hyaluronic acid was obtained in quantities comparable to those reported in other studies that, however, used a higher concentration of monosaccharides. Therefore, the methodology and results shown here provide new opportunities to take advantage of biomass waste in an eco-friendly manner.

Author Contributions

R.I.C.-G.: conceptualization; investigation; acquisition, analysis, and interpretation of data for the work; methodology; supervision, writing—review and editing. D.A.F.-M.: conceptualization, investigation, methodology, validation, writing—review and editing. G.T.: writing—review and editing. J.R.R.-I.: methodology, validation, writing—review and editing. G.G.-M.: conceptualization, investigation; funding acquisition, analysis and interpretation of data for the work; review and editing. E.A.-G.: funding acquisition, supervision, writing—review and editing. All authors have read and agreed to the published version of the manuscript.

Funding

This work was supported by the Fondo Institucional de Fomento Regional para el Desarrollo Científico, Tecnológico y de Innovación (FORDECYT) CONACYT, México (Project No. 2017-10-292474). Financial support for David Antonio Flores-Méndez originated from Consejo Nacional de Ciencia y Tecnología (Conacyt) through scholarship 295612.

Institutional Review Board Statement

Not applicable.

Informed Consent Statement

Not applicable.

Data Availability Statement

The data presented in this study are available on request from the corresponding author (R.I.C.-G. or G.G.-M).

Conflicts of Interest

The authors declare no conflict of interest.

References

  1. Farah, A. Coffee Constituents. In Coffee: Emerging Health Effects and Disease Prevention, 1st ed.; Chu, Y., Ed.; John Wiley & Sons, Inc.; IFT Press: Ames, IA, USA, 2012; pp. 21–58. [Google Scholar]
  2. International Coffee Organization. Available online: http://www.ico.org/prices/new-consumption-table.pdf (accessed on 15 February 2020).
  3. Pava-ripoll, M.; Posada, F.J.; Momen, B.; Wang, C.; Leger, R. Increased pathogenicity against coffee berry borer, Hypothenemus hampei (Coleoptera: Curculionidae) by Metarhizium anisopliae expressing the scorpion toxin (AaIT) gene. J. Invertebr. Pathol. 2008, 99, 220–226. [Google Scholar] [CrossRef]
  4. López, E.; Castaño, J. Extracción de aceite a partir de subproductos de la trilla de café pergamino. Cenicafé 1999, 50, 66–77. [Google Scholar]
  5. Murthy, P.S.; Madhava Naidu, M. Sustainable management of coffee industry by-products and value addition—A review. Resour. Conserv. Recycl. 2012, 66, 45–58. [Google Scholar] [CrossRef]
  6. Rohit, S.G.; Jyoti, P.K.; Subbi, R.R.T.; Naresh, M.; Senthilkumar, S. Kinetic modeling of hyaluronic acid production in palmyra palm (Borassus flabellifer) based medium by Streptococcus zooepidemicus MTCC 3523. Biochem. Eng. J. 2018, 137, 284–293. [Google Scholar] [CrossRef]
  7. Pan, N.C.; Vignoli, J.A.; Baldo, C.; Braga, H.C.; Da Silva, R.S.; Pedrine, M.A. Agroindustrial byproducts for the production of hyaluronic acid by Streptococcus zooepidemicus ATCC 39920. Int. J. Sci. Technol. Res. 2015, 4, 114–118. [Google Scholar]
  8. Zakeri, A.; Rasaee, M.J.; Pourzardosht, N. Enhanced hyluronic acid production in Streptococcus zooepidemicus by over expressing HasA and molecular weight control with Niscin and glucose. Biotechnol. Rep. 2017, 16, 65–70. [Google Scholar] [CrossRef]
  9. Don, M.M.; Shoparwe, N.F. Kinetics of hyaluronic acid production by Streptococcus zooepidemicus considering the effect of glucose. Biochem. Eng. J. 2010, 49, 95–103. [Google Scholar] [CrossRef]
  10. Chahuki, F.F.; Aminzadeh, S.; Jafarian, V.; Tabandeh, F.; Khodabandeh, M. Hyaluronic acid production enhancement via genetically modification and culture medium optimization in Lactobacillus acidophilus. Int. J. Biol. Macromol. 2019, 121, 870–881. [Google Scholar] [CrossRef]
  11. Amado, I.R.; Vázquez, J.A.; Pastrana, L.; Teixeira, J.A. Cheese whey: A cost-effective alternative for hyaluronic acid production by Streptococcus zooepidemicus. Food Chem. 2016, 198, 54–61. [Google Scholar] [CrossRef] [Green Version]
  12. TAPPI T 264 cm-97. Preparation of Wood for Chemical Analysis; TAPPI Press: Atlanta, GA, USA, 1997. [Google Scholar]
  13. TAPPI T 211 om-02. Ash in Wood, Pulp, Paper and Paperboard: Combustion at 525 °C; TAPPI Press: Atlanta, GA, USA, 2002. [Google Scholar]
  14. TAPPI T 207 cm-99. Water Solubility of Wood and Pulp; TAPPI Press: Atlanta, GA, USA, 1999. [Google Scholar]
  15. TAPPI T 204 Cm-97. Solvent Extractives of Wood and Pulp; TAPPI Press: Atlanta, GA, USA, 2007. [Google Scholar]
  16. TAPPI T 222 om-02. Lignin in Wood and Pulp; TAPPI Press: Atlanta, GA, USA, 2006. [Google Scholar]
  17. Wise, L.; Murphy, M.; D’Addieco, A. Chlorite holocellulose, its fractionation and bearing on summative wood analysis and on studies on the hemicellulose. Pap. Trade J. 1946, 122, 35–43. [Google Scholar]
  18. Cross, C.; Bevan, E. Researches on Cellulose, 2nd ed.; Longmans, green, and Co.: London, UK, 1907; Volume 2. [Google Scholar]
  19. Shah, M.V.; Badle, S.S.; Ramachandran, K.B. Hyaluronic acid production and molecular weight improvement by redirection of carbon flux towards its biosynthesis pathway. Biochem. Eng. J. 2013, 80, 53–60. [Google Scholar] [CrossRef]
  20. Mussatto, S.I.; Machado, E.M.S.; Martins, S.; Teixeira, J.A. Production, composition, and application of coffee and its industrial residues. Food Bioprocess Technol. 2011, 4, 661–672. [Google Scholar] [CrossRef] [Green Version]
  21. Redgwell, R.; Fischer, M. Coffee carbohydrates. Braz. J. Plant Physiol. 2006, 18, 165–174. [Google Scholar] [CrossRef]
  22. Oliveira, L.; Franca, A.; Mendonça, J.; Barros-Júnior, M. Proximate composition and fatty acids profile of green and roasted defective coffee beans. LWT Food Sci. Technol. 2006, 39, 235–239. [Google Scholar] [CrossRef]
  23. Cho, E.J.; Thi, L.; Trinh, P.; Song, Y.; Lee, Y.G.; Bae, H. Bioconversion of biomass waste into high value chemicals. Bioresour. Technol. 2020, 298, 122386. [Google Scholar] [CrossRef] [PubMed]
  24. Constantino, L.V.; Zeffa, D.M.; Koltun, A.; Urbano, M.R.; Santos, A.W.; Nixdorf, S.L. Extraction of soluble sugars from green coffee beans using hot water and quantification by a chromatographic method without an organic solvent. Acta Chromatogr. 2020, 32, 242–246. [Google Scholar] [CrossRef]
  25. Nuhu, A.A. Bioactive micronutrients in coffee: Recent analytical approaches for characterization and quantification. ISRN Nutr. 2014, 2014, 1–13. [Google Scholar] [CrossRef]
  26. Juarez, G.F.Y.; Pabiloña, K.B.C.; Manlangit, K.B.L.; Go, A.W. Direct dilute acid hydrolysis of spent coffee grounds: A new approach in sugar and lipid recovery. Waste Biomass Valorization 2018, 9, 235–246. [Google Scholar] [CrossRef]
  27. Kumar, A.; Kumar, R.; Singh, A.; Kuhad, R.C. Detoxification of sugarcane bagasse hydrolysate improves ethanol production by Candida shehatae NCIM 3501. Bioresour. Technol. 2007, 98, 1947–1950. [Google Scholar] [CrossRef]
  28. Pedroso, G.; Philippsen, M.; Saldanha, L.; Araujo, R.; Martins, A. Strategies for fermentable sugar production by using pressurized acid hydrolysis for rice husks. Rice Sci. 2019, 26, 319–330. [Google Scholar] [CrossRef]
  29. Kupiainen, L.; Ahola, J.; Tanskanen, J. Kinetics of glucose decomposition in formic acid. Chem. Eng. Res. Des. 2011, 89, 2706–2713. [Google Scholar] [CrossRef]
  30. Taherzadeh, M.J.; Gustafsson, L.; Niklasson, C.; Lidén, G. Physiological effects of 5-hydroxymethylfurfural on Saccharomyces cerevisiae. Appl. Microbiol. Biotechnol. 2000, 53, 701–708. [Google Scholar] [CrossRef]
  31. Kwon, E.E.; Yi, H.; Jeon, Y.J. Sequential co-production of biodiesel and bioethanol with spent coffee grounds. Bioresour. Technol. 2013, 136, 475–480. [Google Scholar] [CrossRef]
  32. Niglio, S.; Procentese, A.; Russo, M.E. Investigation of enzymatic hydrolysis of coffee silverskin aimed at the production of butanol and succinic acid by fermentative processes. BioEnergy Res. 2019, 12, 312–324. [Google Scholar] [CrossRef]
  33. Seong, I.; Gon, S.; Kim, S.; Bae, H. Conversion of coffee residue waste into bioethanol with using popping pretreatment. Bioresour. Technol. 2012, 125, 132–137. [Google Scholar] [CrossRef]
  34. Chaves-Ulate, E.C.; Esquivel-Rodríguez, P. Ácidos clorogénicos presentes en el café: Capacidad antimicrobiana y antioxidante. Agron. Mesoam. 2019, 30, 299–311. [Google Scholar] [CrossRef]
  35. Berlin, A.; Gilkes, N.; Kilburn, D.; Bura, R.; Markov, A.; Skomarovsky, A.; Okunev, O.; Gusakov, A.; Maximenko, V.; Gregg, D.; et al. Evaluation of novel fungal cellulase preparations for ability to hydrolyze softwood substrates—Evidence for the role of accessory enzymes. Enzym. Microb. Technol. 2005, 37, 175–184. [Google Scholar] [CrossRef]
  36. Inoue, H.; Yano, S.; Sawayama, S. Effect of β-Mannanase and β-Mannosidase Supplementation on the total hydrolysis of softwood polysaccharides by the Talaromyces cellulolyticus cellulase system. Appl. Biochem. Biotechnol. 2015, 176, 1673–1686. [Google Scholar] [CrossRef] [PubMed]
  37. Oliveira, C. Polysaccharides in coffee and their relationship to health: An overview. In Coffee in Health and Disease Prevention, 1st ed.; Preedy, V.R., Ed.; Elsevier Inc.: San Diego, CA, USA, 2015; pp. 163–171. [Google Scholar]
  38. Nelson, D.L.; Cox, M.M. Lehninger Principles of Biochemistry, 7th ed.; W. H. Freeman: New York, USA, 2017; pp. 1–1328. [Google Scholar]
  39. Chen, X.; Shekiro, J.; Franden, M.A.; Wang, W.; Zhang, M.; Kuhn, E.; Johnson, D.K.; Tucker, M.P. The impacts of deacetylation prior to dilute acid pretreatment on the bioethanol process. Biotechnol. Biofuels 2012, 5, 8. [Google Scholar] [CrossRef] [PubMed] [Green Version]
  40. Mohan, N.; Pavan, S.S.; Achar, A.; Swaminathan, N.; Sivaprakasam, S. Calorespirometric investigation of Streptococcus zooepidemicus metabolism: Thermodynamics of anabolic payload contribution by growth and hyaluronic acid synthesis. Biochem. Eng. J. 2019, 152, 107367. [Google Scholar] [CrossRef]
  41. Oliveira, A.H.; Ogrodowski, C.C.; De Macedo, A.C.; Santana, M.H.A.; Gonçalves, L.R.B. Cashew apple juice as microbial cultivation medium for non-immunogenic hyaluronic acid production. Braz. J. Microbiol. 2013, 1097–1104. [Google Scholar] [CrossRef] [PubMed] [Green Version]
  42. Liu, L.; Liu, Y.; Li, J.; Du, G.; Chen, J. Microbial production of hyaluronic acid: Current state, challenges, and perspectives. Microb. Cell Fact. 2011, 10, 99. [Google Scholar] [CrossRef] [PubMed] [Green Version]
  43. Eş, I.; Khaneghah, A.M.; Barba, F.J.; Saraiva, J.A.; Sant’Ana, A.S.; Bagher, S.M. Recent advancements in lactic acid production—A review. Food Res. Int. 2018, 107, 763–770. [Google Scholar] [CrossRef] [PubMed]
Figure 1. Surface response plot for acid hydrolysis of bored coffee beans.
Fermentation 07 00121 g001
Figure 2. Surface response plot for enzymatic hydrolysis of bored coffee beans.
Fermentation 07 00121 g002
Figure 3. Monosaccharides obtained from optimal conditions for acid hydrolysis (AcH), acid hydrolysis of extracted bored-coffee beans (AcHD), enzymatic hydrolysis (EnH), and enzymatic hydrolysis of extracted bored-coffee beans (EnHD). Error bars represent ± standard deviations (n = 2).
Fermentation 07 00121 g003
Figure 4. Kinetic profiles for biomass (a), hyaluronic acid (b), glucose (c), mannose (d), and lactic acid (e) from batch fermentation with S. zooepidemicus from hydrolyzates: (●) acid hydrolysis (AcH), (○) acid hydrolysis of extracted bored-coffee beans (AcHD), (■) enzymatic hydrolysis (EnH), (□) enzymatic hydrolysis of extracted bored-coffee beans, and (▲) synthetic medium. Bars represent ± standard deviation (n = 2).
Fermentation 07 00121 g004aFermentation 07 00121 g004b
Figure 5. Chemical structure of green coffee galactomannans.
Fermentation 07 00121 g005
Table 1. Chemical composition of bored coffee beans (percentage on dry basis).
Content (% wt)Bored Coffee Beans
Holocellulose58.5 ± 1.44
Cellulose31.6 ± 3.69
Galactomannans and other hemicelluloses26.9 ± 3.28
Lignin2.1 ± 0.23
Water soluble extractives (arabinogalactans and pectins)25.4 ± 0.77
Organic solvent extractives11.9 ± 0.17
Ash2.0 ± 0.12
Moisture content12.6± 0.21
Table 2. Central composite design for acid hydrolysis, concentration of monosaccharides, and yield.
RunAcid HydrolysisResponseYield
HCl (% v/v)Temperature (°C)Monosaccharides (g/L)δAcH (%)
1111018.232.0
2211022.239.1
3113027.247.9
4213032.557.2
51.5105.8510.919.2
61.5134.1429.451.7
70.7912022.639.8
82.2012029.051.0
91.512024.743.5
101.512022.239.1
111.512023.240.7
121.512022.138.9
131.512023.341.0
Table 3. Central composite design for enzymatic hydrolysis, concentration of monosaccharides, and yield.
Run NumberEnzymatic HydrolysisResponseYield
Enzyme (g/L)Agitation (rpm)Monosaccharides * (g/L)δEnH (%)
1110014.425.4
2510036.464.0
3120018.432.5
4520036.163.5
5379.2827.949.2
63220.734.761.0
70.1715012.021.2
85.815034.460.7
9315028.349.9
10315029.151.2
11315035.863.0
12315034.761.1
13315032.356.9
* Monosaccharides include glucose, mannose, and arabinose; δEnH, yield based on enzymatic hydrolysis.
Table 4. Composition of acid hydrolyzates before and after ion-exchange treatment.
AcH AcHD
BeforeAfterRemovalBeforeAfterRemoval
ParameterConcentration (g/L)%Concentration (g/L)%
Monosaccharides 28.621.724.134.528.317.9
Formic acid 0.250.0676.01.320.2283.3
Furfural 0.240.0291.60.230.0195.6
Hydrometylfurfural0.850.2274.10.420.0880.9
pH0.86 *6.97 *WR0.91 *7.04 *WR
* pH unities: WR: without removal.
Table 5. Kinetic parameters and concentration of products for the production of hyaluronic acid from different hydrolyzates.
VariablesSMAcHEnHAcHDEnHD
Biomass (g/L)2.3 ± 0.2352.2 ± 0.0472.2 ± 0.1412.4 ± 0.1172.3 ± 0.070
HA (g/L) 2.8 ± 0.2431.5 ± 0.2490.85 ± 0.4672.7 ± 0.0672.0 ± 0.002
Lactic acid (g/L)18.5 ± 1.95016.9 ± 0.72718.8 ± 0.34514.2 ± 1.13315.6 ± 0.252
Glucose (g/L)31.1 ± 2.7132.2 ± 0.06721.8 ± 1.4684.4 ± 0.30022.0 ± 1.593
Mannose (g/L)NP26.3 ± 0.3023.0 ± 0.01028.1 ± 0.1825.53 ± 0.780
µmax (1/h)0.28 ± 0.0010.27 ± 0.0230.24 ± 0.0400.24 ± 0.0050.26 ± 0.003
qG-max (g/g h)3.6 ± 0.0870.17 ± 0.0753.4 ± 0.6130.69 ± 0.0172.4 ± 0.226
qM-max (g/g h)NC2.1 ± 0.0360.36 ± 0.0261.8 ± 0.2230.53 ± 0.045
qLA-max (g/g h)2.2 ± 0.3332.1 ± 0.058 2.2 ± 0.1181.5 ± 0.1271.1 ± 0.017
qHA-max (g/g h)0.34 ± 0.022 0.20 ± 0.0070.11 ± 0.0600.27 ± 0.1190.21 ± 0.033
rLA (g/L h)1.9 ± 0.0341.6 ± 1.7101.6 ± 0.2671.4 ± 0.0161.3 ± 0.021
rHA (g/L h)0.28 ± 0.0240.15 ± 0.0210.09 ± 0.0470.25 ± 0.0050.17 ± 0.004
YX/S (g/g)0.06 ± 0.0090.09 ± 0.0070.08 ± 0.0110.10 ± 0.0010.09 ± 0.009
YLA/S (g/g)0.60 ± 0.0060.79 ± 0.030 0.68 ± 0.1500.69 ± 0.0700.59 ± 0.015
YHA/S (g/g)0.09 ± 0.0090.07 ± 0.014 0.04 ± 0.0190.13 ± 0.0090.08 ± 0.003
SM: synthetic medium; AcH: acid hydrolysis; EnH: enzymatic hydrolysis; AcHD: acid hydrolysis from defatted BCG; EnHD: enzymatic hydrolysis from defatted BCG; HA: hyaluronic acid; NP: not present in culture medium: NC: not calculated.
Table 6. Production of hyaluronic acid by S. zooepidemicus from alternative substrates.
MicroorganismCulture MediumSugars (g/L)HA (g/L)Reference
S. zooepidemicus 39920Soy molasses30ND[7]
Sugarcane molasses300.37
Sugarcane juice300.26
S. zooepidemicus MTCC 3523Palmyra palm sugar301.2[6]
S. zooepidemicus 39920Cashew apple juice901.8[41]
S. zooepidemicus 35246Cheese whey1002.1[11]
Cheese whey hydrolyzate1002.4
S. zooepidemicus 35246AcH281.5This work
EnH240.85
AcHD322.7
EnHD272.0
Publisher’s Note: MDPI stays neutral with regard to jurisdictional claims in published maps and institutional affiliations.

