
Two-Stage Anaerobic Codigestion of Crude Glycerol and Micro-Algal Biomass for Biohydrogen and Methane Production by Anaerobic Sludge Consortium

 ,
, 

Abstract
:
1. Introduction
2. Materials and Methods
2.1. Substrates
2.2. Inoculum Preparation
2.3. Central Composite Design (CCD)
2.4. Confirmation Experiment
2.5. Biohydrogen Production Experiments
2.6. Methane Production from the Hydrogenic Effluent of a Biohydrogen Production Process
2.7. Analytical Methods
3. Results and Discussion
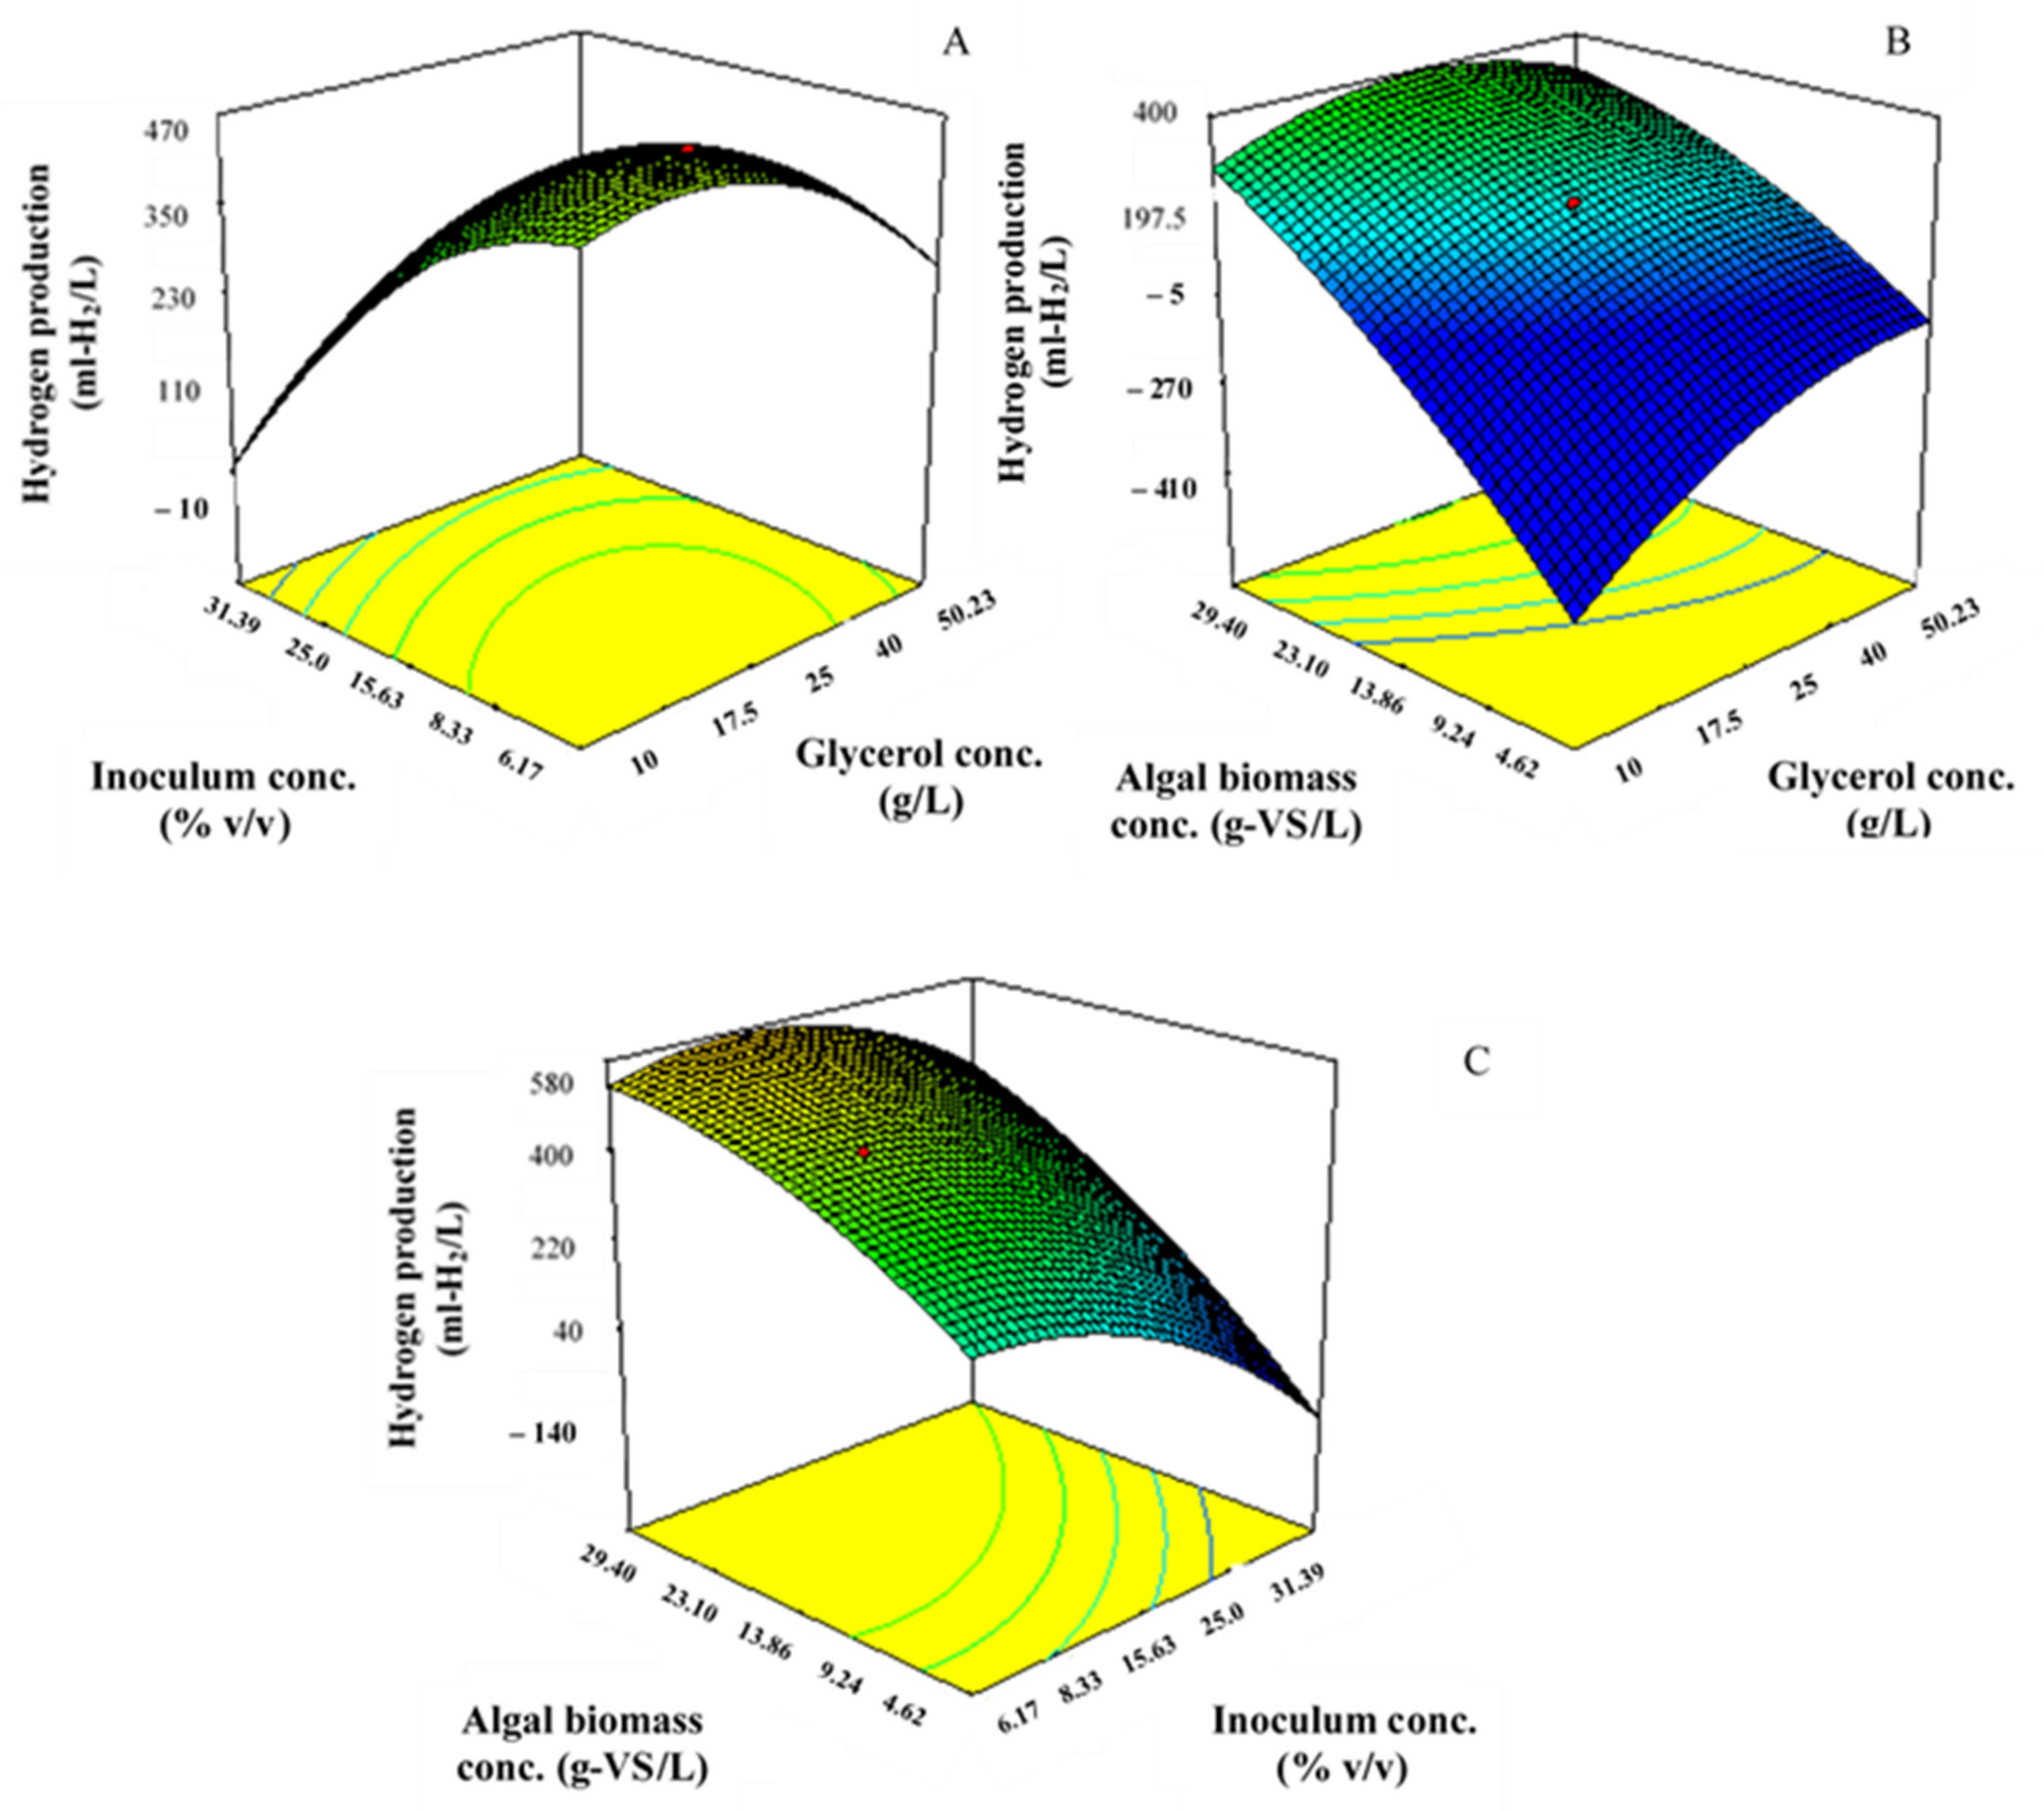
3.1. Biohydrogen Production from a Codigestion of Crude Glycerol with Algal Biomass Using RSM with CCD
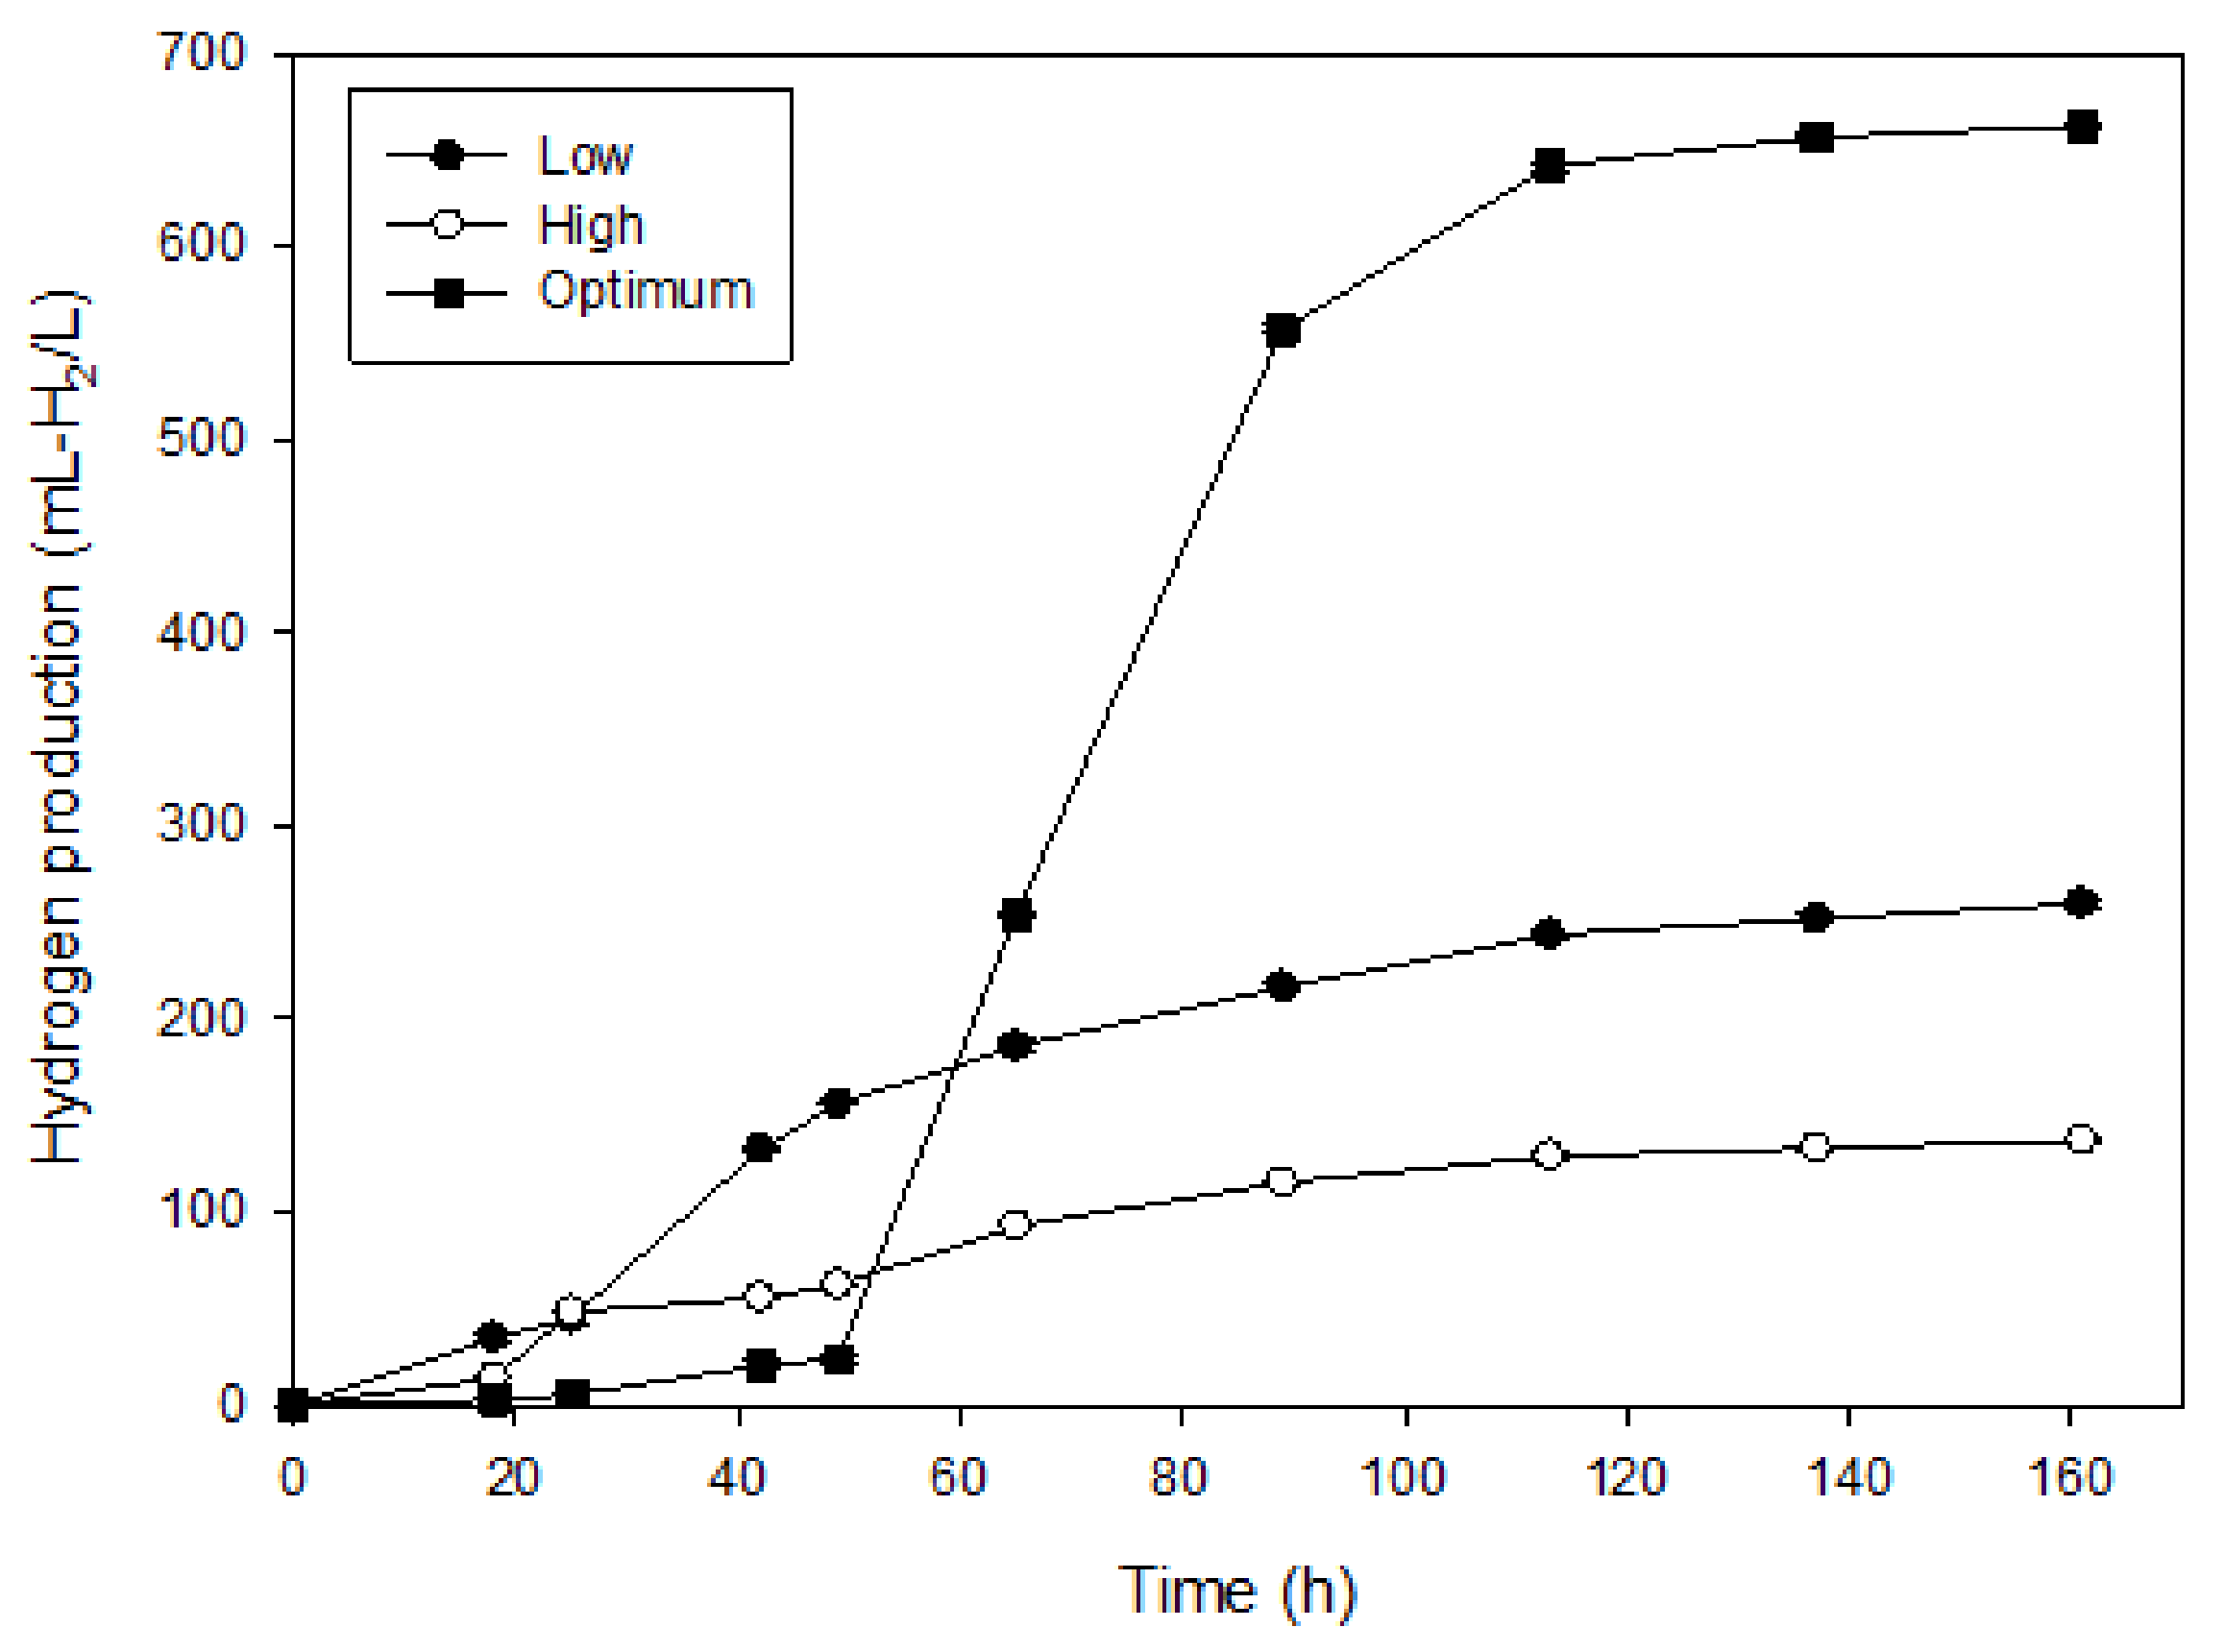
3.2. Confirmation Experiments
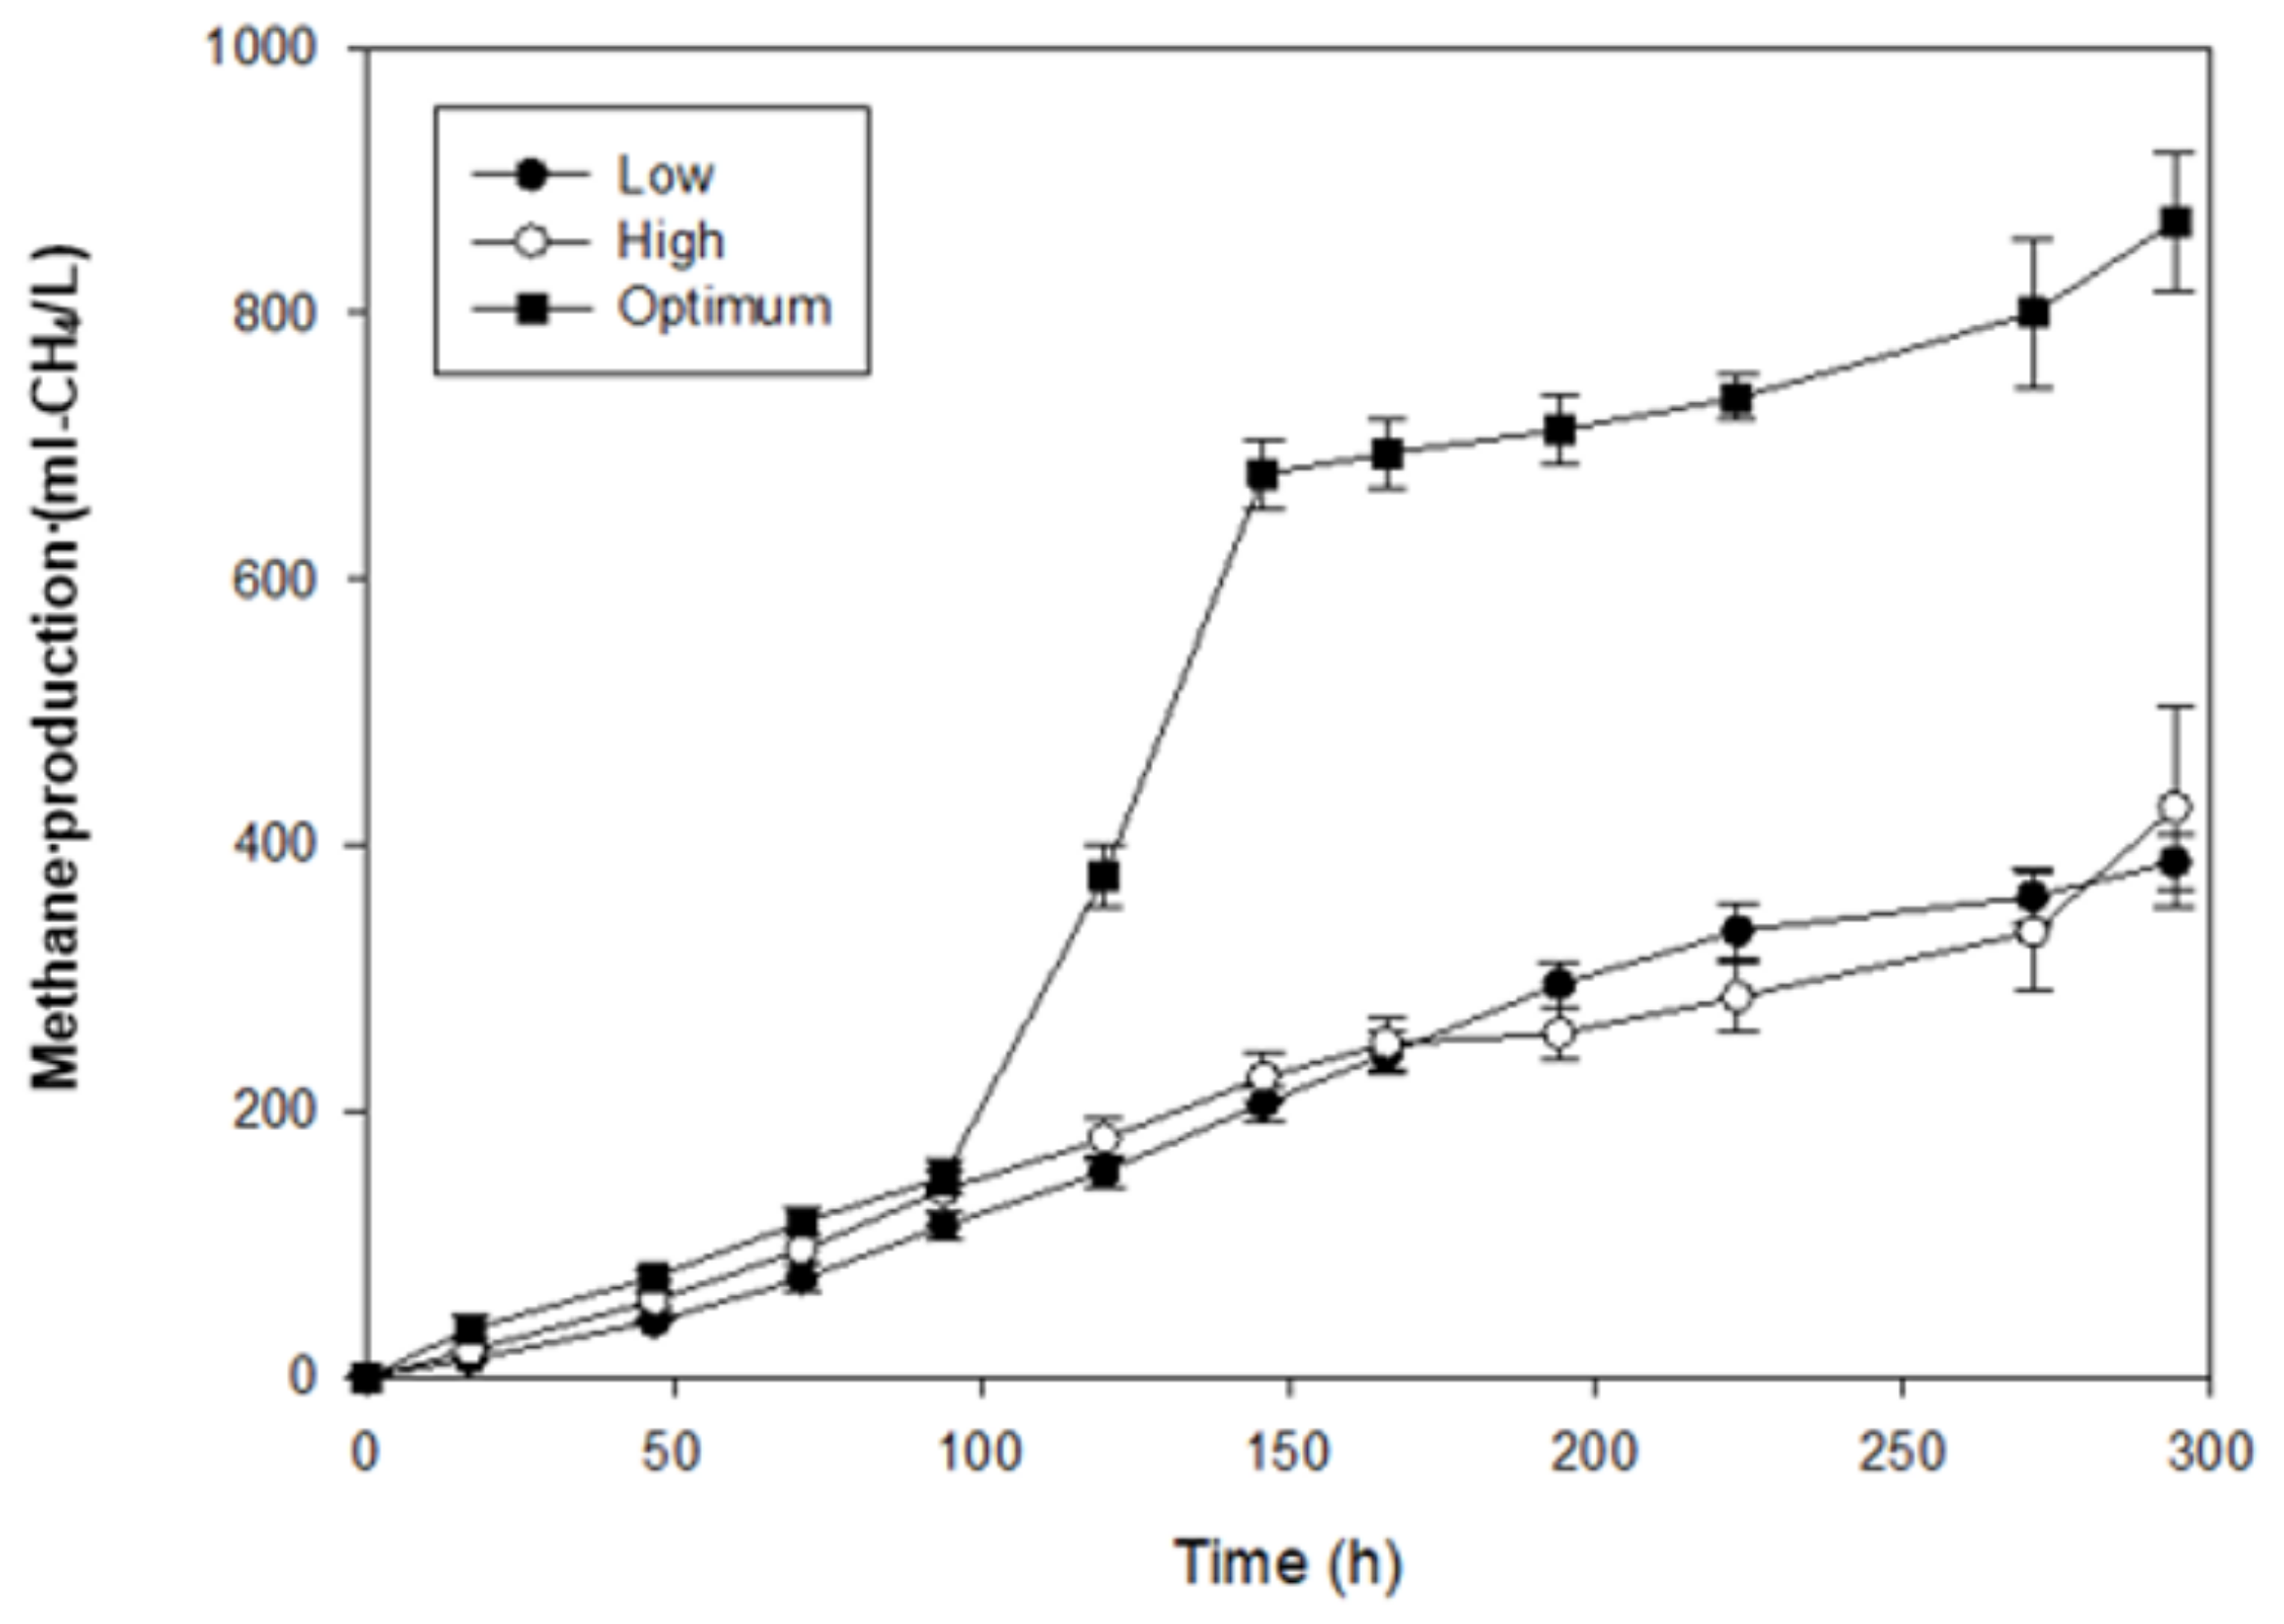
3.3. Methane Production from the Hydrogenic Effluent of a Biohydrogen Production Process
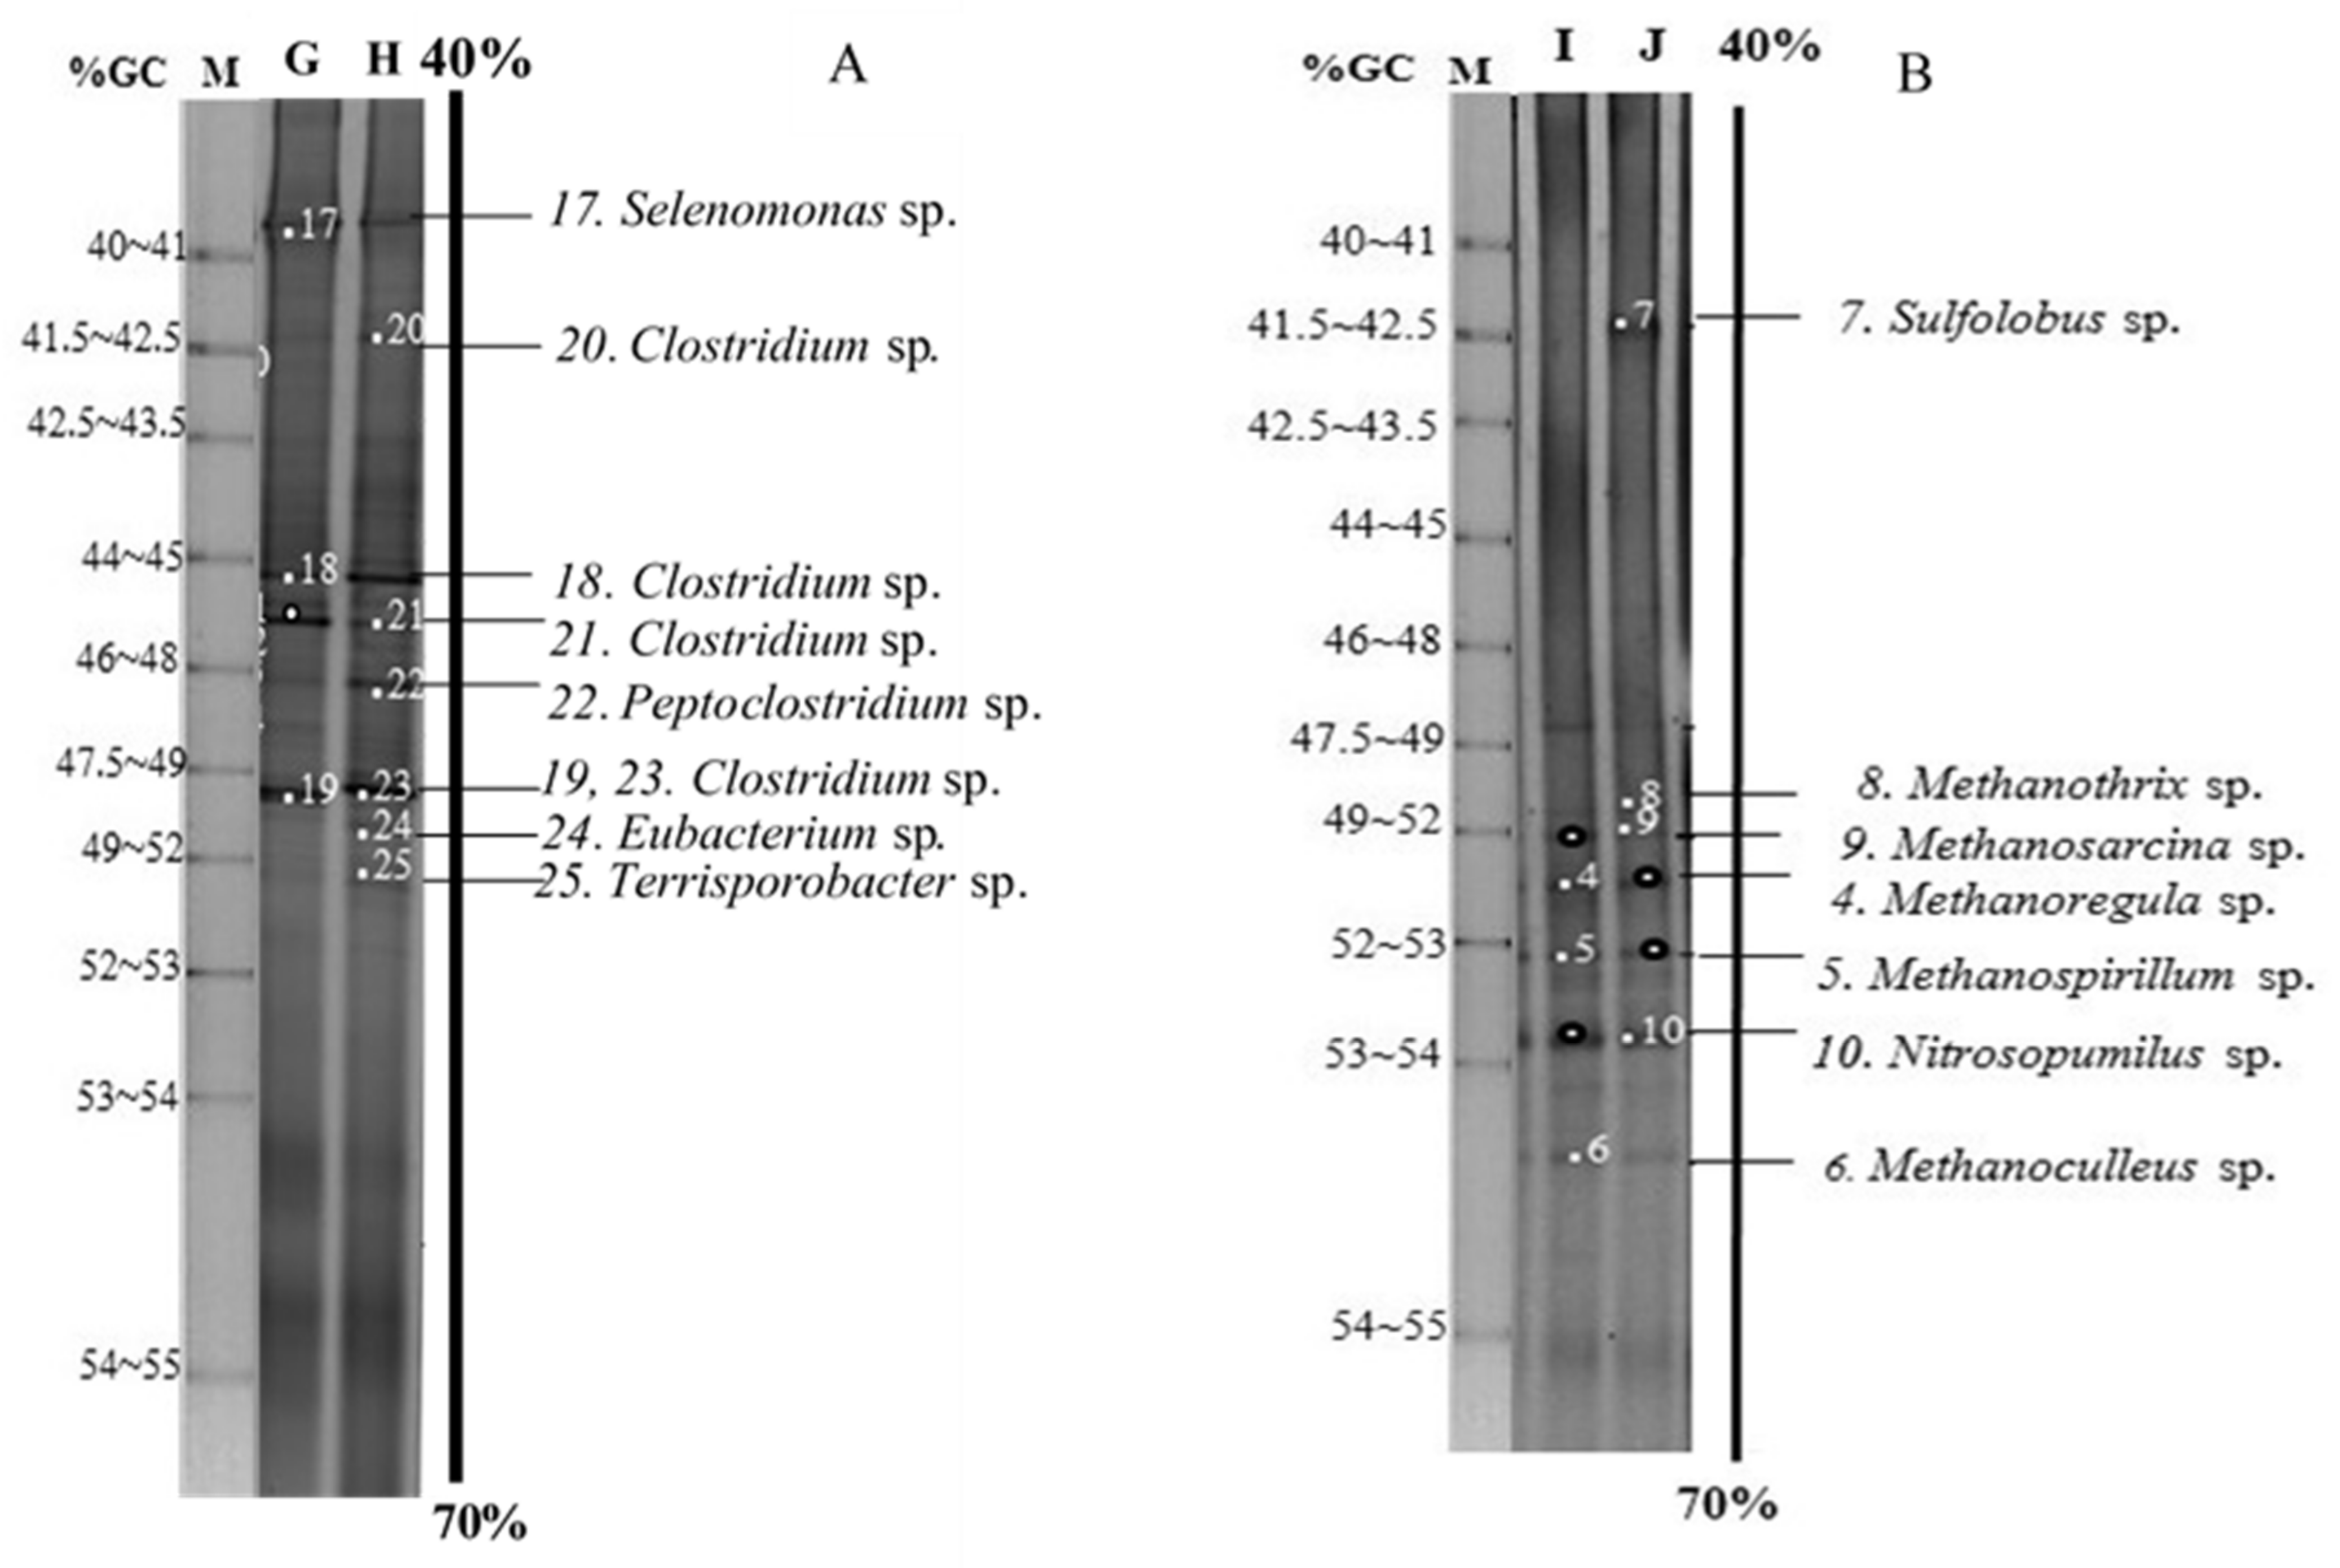
3.4. Microbial Communities
3.5. Synergistic or Antagonistic Effects during Hydrogen and Methane Production
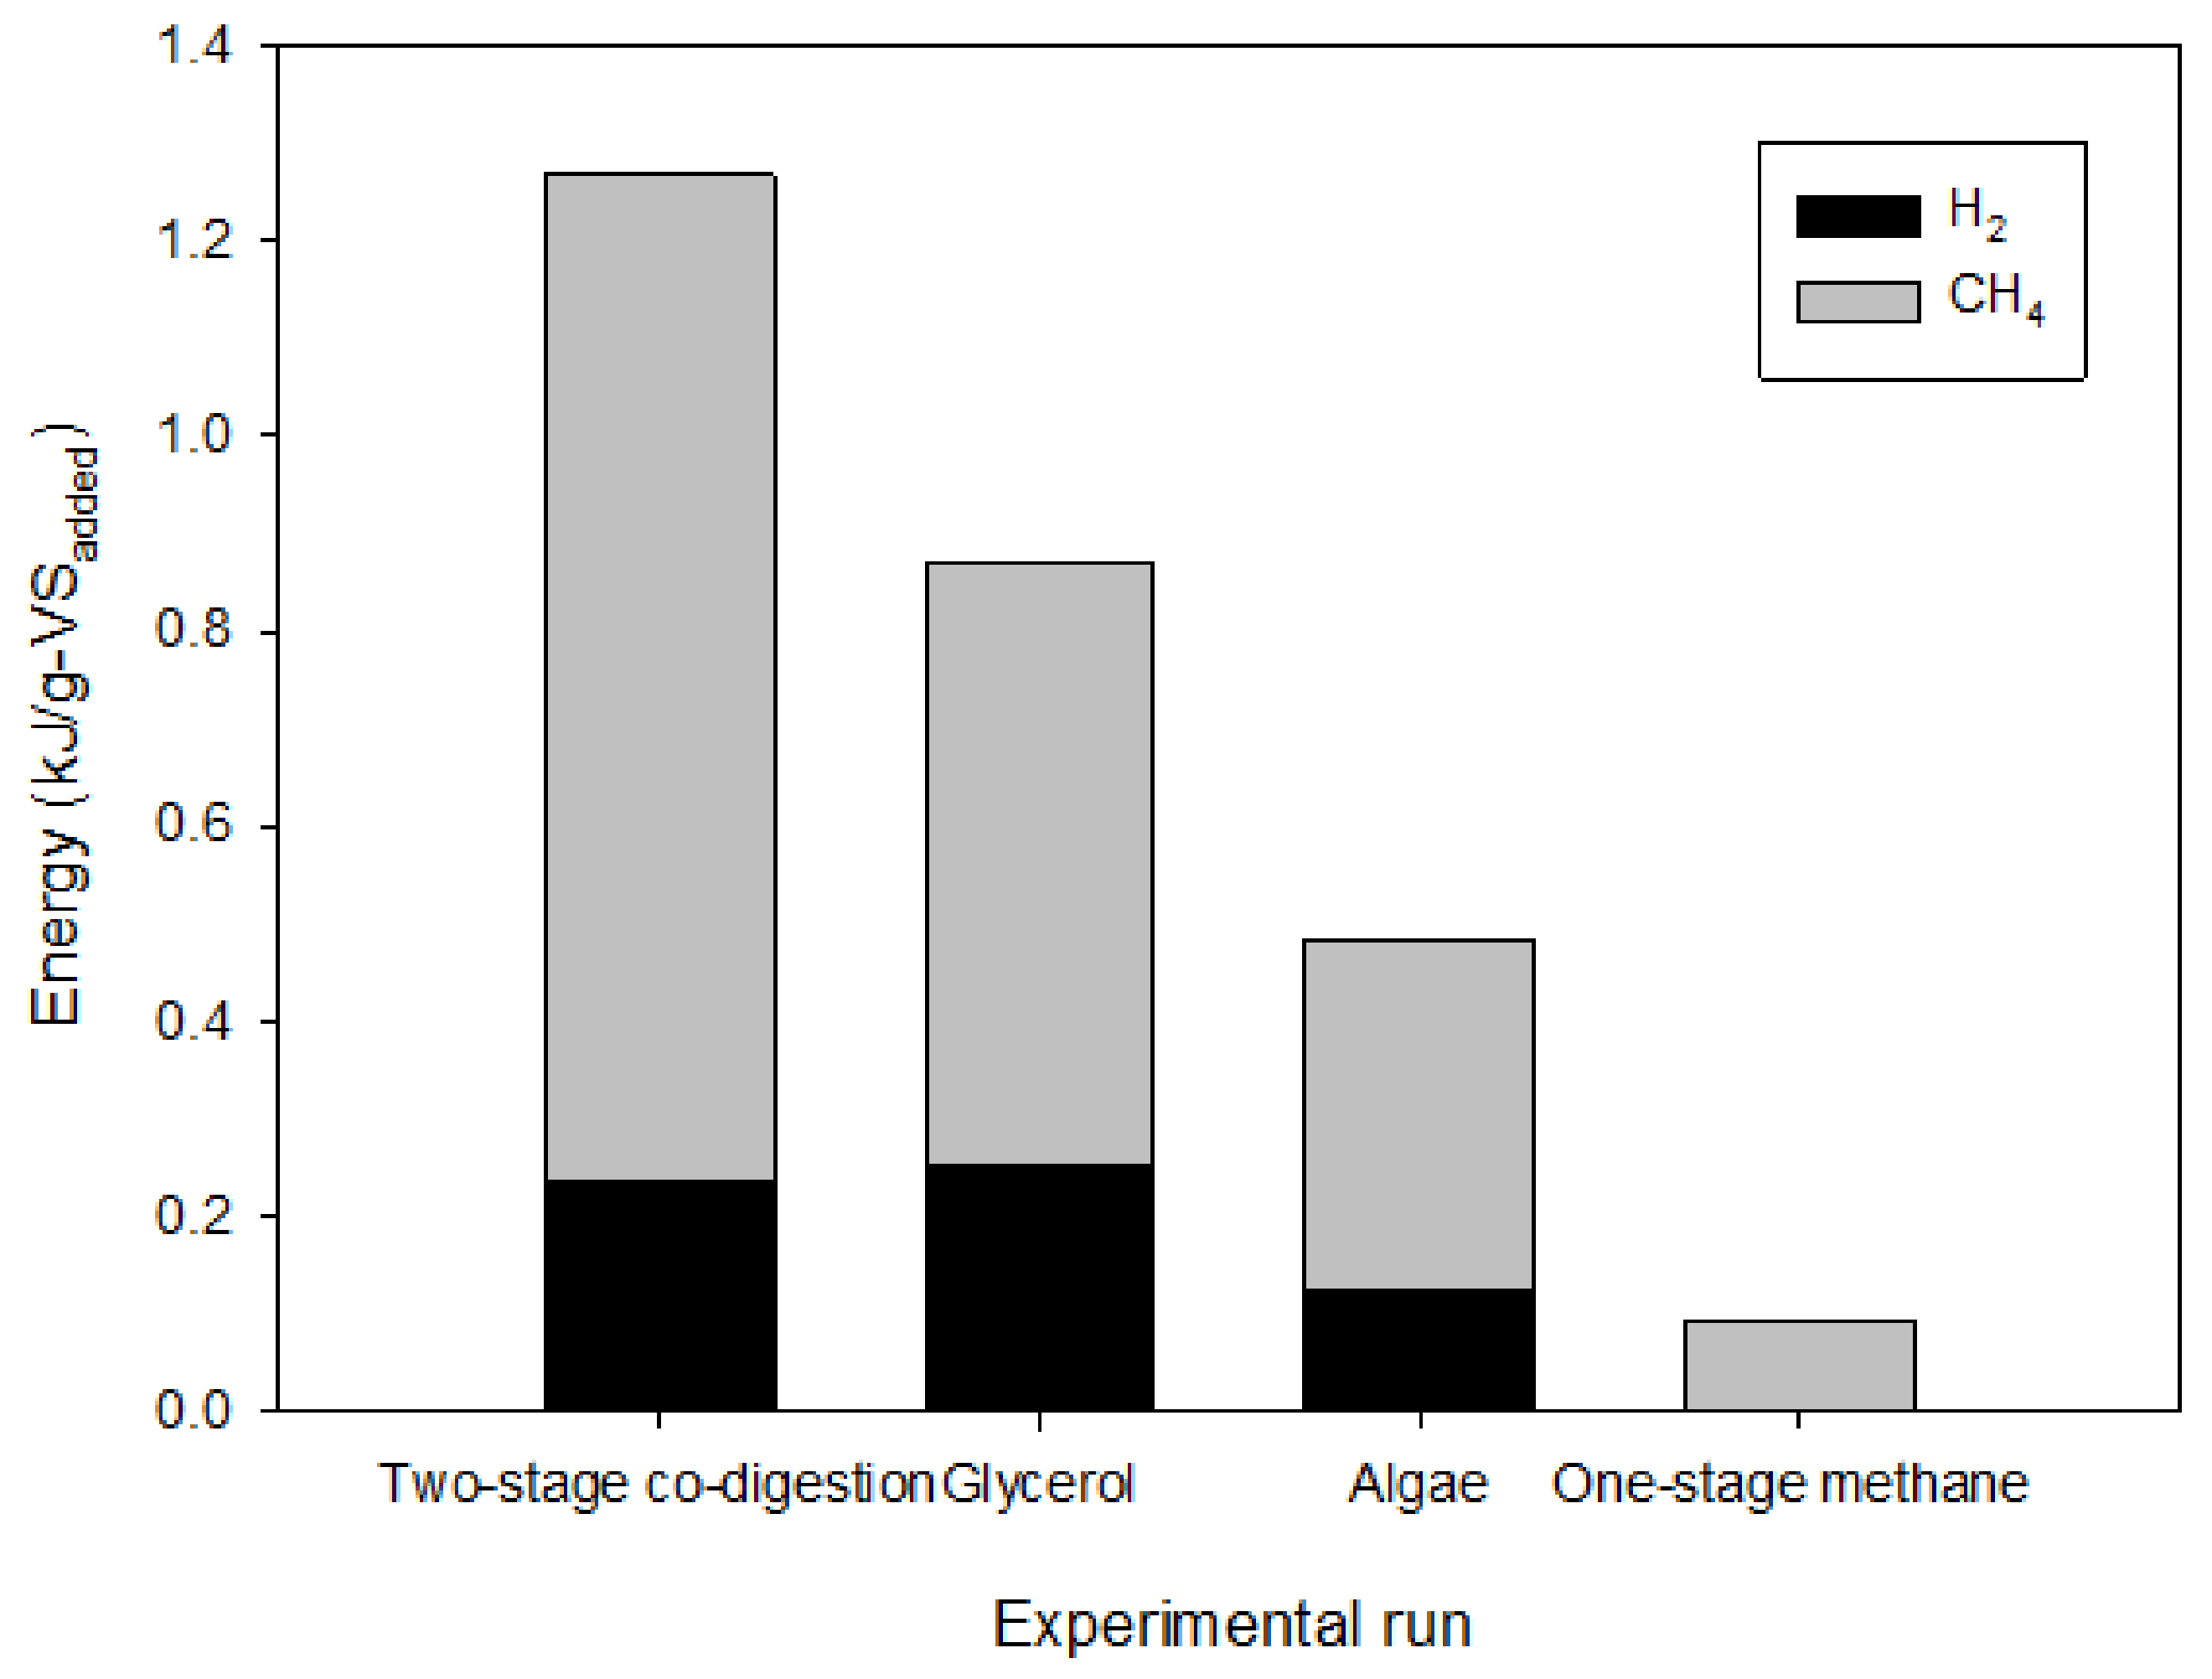
3.6. Energy Production in Two-Stage Hydrogen and Methane Production from a Single Substrate and Codigestion of Crude Glycerol and Algal Biomass and Energy Balance
4. Conclusions
Author Contributions
Funding
Institutional Review Board Statement
Informed Consent Statement
Data Availability Statement
Acknowledgments
Conflicts of Interest
References
- Nazir, M.S.; Mahdi, A.J.; Bilal, M.; Sohail, H.M.; Ali, N.; Iqbal, H.M.N. Environmental impact and pollution-related challenges of renewable wind energy paradigm—A review. Sci. Total Environ. 2019, 683, 436–444. [Google Scholar] [CrossRef]
- Gasanzade, F.; Pfeiffer, W.T.; Witte, F.; Tuschy, I.; Bauer, S. Subsurface renewable energy storage capacity for hydrogen, methane and compressed air– A performance assessment study from the north German basin. Renew. Sustain. Energy Rev. 2021, 149, 111422. [Google Scholar] [CrossRef]
- Lanzilli, M.; Esercizio, N.; Vastano, M.; Xu, Z.; Nuzzo, G.; Gallo, C.; Manzo, E.; Fontana, A.; d’Ippolito, G. Effect of cultivation parameters on fermentation and hydrogen production in the phylum Thermotogae. Int. J. Mol. Sci. 2021, 22, 341. [Google Scholar] [CrossRef] [PubMed]
- Mikheeva, E.R.; Katraeva, I.V.; Kovalev, A.A.; Kovalev, D.A.; Nozhevnikova, A.N.; Panchenko, V.; Fiore, U.; Litti, Y.V. The start-up of continuous biohydrogen production from cheese whey: Comparison of inoculum pretreatment methods and reactors with moving and fixed polyurethane carriers. Appl. Sci. 2021, 11, 510. [Google Scholar] [CrossRef]
- Maru, B.T.; Lopez, F.; Medina, F.; Constantí, M. Improvement of biohydrogen and usable chemical products from glycerol by co-culture of Enterobacter sp. H1 and Citrobacter freundii H3 using different supports as surface immobilization. Fermentation 2021, 7, 154. [Google Scholar] [CrossRef]
- Romio, C.; Kofoed, M.V.W.; Møller, H.B. Digestate post treatment strategies for additional biogas recovery: A Review. Sustainability 2021, 13, 9295. [Google Scholar] [CrossRef]
- Nualsri, C.; Reungsang, A.; Plangklang, P. Biochemical hydrogen and methane potential of sugarcane syrup using a two-stage anaerobic fermentation process. Ind. Crop. Prod. 2016, 82, 88–99. [Google Scholar] [CrossRef] [Green Version]
- Hovorukha, V.; Havryliuk, O.; Gladka, G.; Tashyrev, O.; Kalinichenko, A.; Sporek, M.; Dołhańczuk-Śródka, A. Hydrogen dark fermentation for degradation of solid and liquid food waste. Energies 2021, 14, 1831. [Google Scholar] [CrossRef]
- Bakonyi, P.; Dharmaraja, J.; Shobana, S.; Koók, L.; Rózsenberszki, T.; Nemestóthy, N.; Banu, J.R.; Bélafi-Bakó, K.; Kumar, G. Leachate valorization in anaerobic biosystems: Towards the realization of waste to energy concept via biohydrogen, biogas and bioelectrochemical processes. Int. J. Hydrog. Energy 2019, 44, 17278–17296. [Google Scholar] [CrossRef]
- Singh, R.; Tevatia, R.; White, D.; Demirel, Y.; Blum, P. Comparative kinetic modeling of growth and molecular hydrogen overproduction by engineered strains of Thermotoga maritima. Int. J. Hydrog. Energy 2019, 44, 7125–7136. [Google Scholar] [CrossRef] [Green Version]
- Tan, X.B.; Zhao, X.C.; Yang, L.B. Strategies for enhanced biomass and lipid production by Chlorella pyrenoidosa culture in starch processing wastewater. J. Clean. Prod. 2019, 236, 117671. [Google Scholar] [CrossRef]
- Sittijunda, S.; Reungsang, A. Valorization of crude glycerol into hydrogen, 1,3-propanediol, and ethanol in an up-flow anaerobic sludge blanket (UASB) reactor under thermophilic conditions. Renew. Energy 2020, 161, 361–372. [Google Scholar] [CrossRef]
- Garlapati, V.K.; Shankar, U.; Budhiraja, A. Bioconversion technologies of crude glycerol to value added industrial products. Biotechnol. Rep. 2016, 9, 9–14. [Google Scholar] [CrossRef] [PubMed] [Green Version]
- Dębowski, M.; Kisielewska, M.; Kazimierowicz, J.; Rudnicka, A.; Dudek, M.; Romanowska-Duda, Z.; Zieliński, M. The effects of microalgae biomass co-substrate on biogas production from the common agricultural biogas plants feedstock. Energies 2020, 13, 2186. [Google Scholar] [CrossRef]
- Ganesh Saratale, R.; Kumar, G.; Banu, R.; Xia, A.; Periyasamy, S.; Dattatraya Saratale, G. A critical review on anaerobic digestion of microalgae and macroalgae and co-digestion of biomass for enhanced methane generation. Bioresour. Technol. 2018, 262, 319–332. [Google Scholar] [CrossRef] [PubMed]
- Lu, D.; Zhang, X.J. Biogas production from anaerobic codigestion of microalgae and septic sludge. J. Environ. Eng. 2016, 142, 04016049. [Google Scholar] [CrossRef]
- Thorin, E.; Olsson, J.; Schwede, S.; Nehrenheim, E. Co-digestion of sewage sludge and microalgae–Biogas production investigations. Appl. Energy 2018, 227, 64–72. [Google Scholar] [CrossRef] [Green Version]
- Sittijunda, S.; Reungsang, A. Methane production from the co-digestion of algal biomass with crude glycerol by anaerobic mixed cultures. Waste Biomass Valorization 2020, 11, 1873–1881. [Google Scholar] [CrossRef]
- AOAC International. Official Methods of Analysis of AOAC International, 19th ed.; AOAC International: Gaithersburg, MD, USA, 2012. [Google Scholar]
- Phanduang, O.; Lunprom, S.; Salakkam, A.; Liao, Q.; Reungsang, A. Improvement in energy recovery from Chlorella sp. biomass by integrated dark-photo biohydrogen production and dark fermentation-anaerobic digestion processes. Int. J. Hydrog. Energy 2019, 44, 23899–23911. [Google Scholar] [CrossRef]
- Lin, C.Y.; Lay, C.H. A nutrient formulation for fermentative hydrogen production using anaerobic sewage sludge microflora. Int. J. Hydrog. Energy 2005, 30, 285–292. [Google Scholar] [CrossRef]
- Sittijunda, S.; Reungsang, A. Media optimization for biohydrogen production from waste glycerol by anaerobic thermophilic mixed cultures. Int. J. Hydrog. Energy 2012, 37, 15473–15482. [Google Scholar] [CrossRef]
- Sittijunda, S.; Reungsang, A. Biohydrogen production from crude glycerol using anaerobic mixed cultures: Media compositions optimization. Chiang Mai J. Sci. 2018, 45, 653–667. [Google Scholar]
- Sim, Y.B.; Jung, J.H.; Baik, J.H.; Park, J.H.; Kumar, G.; Rajesh Banu, J.; Kim, S.H. Dynamic membrane bioreactor for high rate continuous biohydrogen production from algal biomass. Bioresour. Technol. 2021, 340, 125562. [Google Scholar] [CrossRef]
- Lay, J.J. Modeling and optimization of anaerobic digested sludge converting starch to hydrogen. Biotechnol. Bioeng. 2000, 68, 269–278. [Google Scholar] [CrossRef]
- Owen, W.F.; Stuckey, D.C.; Healy, J.B.; Young, L.Y.; McCarty, P.L. Bioassay for monitoring biochemical methane potential and anaerobic toxicity. Water Res. 1979, 13, 485–492. [Google Scholar] [CrossRef]
- Zwietering, M.H.; Jongenburger, I.; Rombouts, F.M.; van’t Riet, K. Modeling of the bacterial growth curve. Appl. Environ. Microbiol. 1990, 56, 1875. [Google Scholar] [CrossRef] [PubMed] [Green Version]
- Sreela-or, C.; Imai, T.; Plangklang, P.; Reungsang, A. Optimization of key factors affecting hydrogen production from food waste by anaerobic mixed cultures. Int. J. Hydrog. Energy 2011, 36, 14120–14133. [Google Scholar] [CrossRef]
- Pott, R.W.M.; Howe, C.J.; Dennis, J.S. The purification of crude glycerol derived from biodiesel manufacture and its use as a substrate by Rhodopseudomonas palustris to produce hydrogen. Bioresour. Technol. 2014, 152, 464–470. [Google Scholar] [CrossRef] [PubMed]
- Venkataramanan, K.P.; Boatman, J.J.; Kurniawan, Y.; Taconi, K.A.; Bothun, G.D.; Scholz, C. Impact of impurities in biodiesel derived crude glycerol on the fermentation by Clostridium pasteurianum ATCC 6013. Appl. Microbiol. Biotechnol. 2012, 93, 1325–1335. [Google Scholar] [CrossRef] [PubMed]
- Ingram, L.O. Adaptation of membrane lipids to alcohols. J. Bacteriol. 1976, 125, 670–678. [Google Scholar] [CrossRef] [PubMed] [Green Version]
- Cappai, G.; De Gioannis, G.; Muntoni, A.; Spiga, D.; Boni, M.R.; Polettini, A.; Pomi, R.; Rossi, A. Biohydrogen production from food waste: Influence of the inoculum to substrate ratio. Sustainability 2018, 10, 4506. [Google Scholar] [CrossRef] [Green Version]
- Florio, C.; Pirozzi, D.; Ausiello, A.; Micoli, L.; Pasquale, V.; Toscano, G.; Turco, M.; Dumontet, S. Effect of inoculum/substrate ratio on dark fermentation for biohydrogen production from organic fraction of municipal solid waste. Chem. Eng. Trans. 2017, 57. [Google Scholar] [CrossRef]
- Phanduang, O.; Lunprom, S.; Salakkam, A.; Reungsang, A. Anaerobic solid-state fermentation of bio-hydrogen from microalgal Chlorella sp. biomass. Int. J. Hydrog. Energy 2017, 42, 9650–9659. [Google Scholar] [CrossRef]
- Lin, C.Y.; Lay, C.H. Effects of carbonate and phosphate concentrations on hydrogen production using anaerobic sewage sludge microflora. Int. J. Hydrog. Energy 2004, 29, 275–281. [Google Scholar] [CrossRef]
- Huang, L.; Pan, X.R.; Wang, Y.Z.; Li, C.X.; Chen, C.B.; Zhao, Q.B.; Mu, Y.; Yu, H.Q.; Li, W.W. Modeling of acetate-type fermentation of sugar-containing wastewater under acidic pH conditions. Bioresour. Technol. 2018, 248, 148–155. [Google Scholar] [CrossRef]
- Moreira, F.S.; Machado, R.G.; Romão, B.B.; Batista, F.R.X.; Ferreira, J.S.; Cardoso, V.L. Improvement of hydrogen production by biological route using repeated batch cycles. Process. Biochem. 2017, 58, 60–68. [Google Scholar] [CrossRef]
- Choi, J.; Ahn, Y. Biohydrogen fermentation from sucrose and piggery waste with high levels of bicarbonate alkalinity. Energies 2015, 8, 1716–1729. [Google Scholar] [CrossRef]
- Fountoulakis, M.S.; Manios, T. Enhanced methane and hydrogen production from municipal solid waste and agro-industrial by-products co-digested with crude glycerol. Bioresour. Technol. 2009, 100, 3043–3047. [Google Scholar] [CrossRef]
- Kanchanasuta, S.; Sillaparassamee, O. Enhancement of hydrogen and methane production from co-digestion of palm oil decanter cake and crude glycerol using two stage thermophilic and mesophilic fermentation. Int. J. Hydrog. Energy 2017, 42, 3440–3446. [Google Scholar] [CrossRef]
- Silva, F.M.S.; Oliveira, L.B.; Mahler, C.F.; Bassin, J.P. Hydrogen production through anaerobic co-digestion of food waste and crude glycerol at mesophilic conditions. Int. J. Hydrog. Energy 2017, 42, 22720–22729. [Google Scholar] [CrossRef]
- Zahedi, S.; Solera, R.; García-Morales, J.L.; Sales, D. Effect of the addition of glycerol on hydrogen production from industrial municipal solid waste. Fuel 2016, 180, 343–347. [Google Scholar] [CrossRef]
- Li, H.; Wang, Y. The effect of propionic acid accumulation on methane production in dry mesophilic anaerobic fermentation. IOP Conf. Ser. Earth Environ. Sci. 2021, 675, 12208. [Google Scholar] [CrossRef]
- Jomnonkhaow, U.; Sittijunda, S.; Reungsang, A. Enhanced simultaneous saccharification and fermentation of Napier grass and Napier silage for two stage bio-hydrogen and methane production using organosolv and hydrothermal. Mater. Chem. Phys. 2021, 267, 124614. [Google Scholar] [CrossRef]
- Krishnan, S.; Singh, L.; Sakinah, M.; Thakur, S.; Wahid, Z.A.; Alkasrawi, M. Process enhancement of hydrogen and methane production from palm oil mill effluent using two-stage thermophilic and mesophilic fermentation. Int. J. Hydrog. Energy 2016, 41, 12888–12898. [Google Scholar] [CrossRef] [Green Version]
- Cibis, K.G.; Gneipel, A.; König, H. Isolation of acetic, propionic and butyric acid-forming bacteria from biogas plants. J. Biotechnol. 2016, 220, 51–63. [Google Scholar] [CrossRef]
- Shrestha, P.M.; Malvankar, N.S.; Werner, J.J.; Franks, A.E.; Elena Rotaru, A.; Shrestha, M.; Liu, F.; Nevin, K.P.; Angenent, L.T.; Lovley, D.R. Correlation between microbial community and granule conductivity in anaerobic bioreactors for brewery wastewater treatment. Bioresour. Technol. 2014, 174, 306–310. [Google Scholar] [CrossRef] [PubMed]
- Wu, J.; Jiang, B.; Kong, Z.; Yang, C.; Li, L.; Feng, B.; Luo, Z.; Xu, K.Q.; Kobayashi, T.; Li, Y.Y. Improved stability of up-flow anaerobic sludge blanket reactor treating starch wastewater by pre-acidification: Impact on microbial community and metabolic dynamics. Bioresour. Technol. 2021, 326, 124781. [Google Scholar] [CrossRef]
- Yin, Z.; Bi, X.; Xu, C. Ammonia–oxidizing archaea (AOA) play with ammonia-oxidizing bacteria (AOB) in nitrogen removal from wastewater. Archaea 2018, 2018, 8429145. [Google Scholar] [CrossRef] [Green Version]
- Quehenberger, J.; Shen, L.; Albers, S.V.; Siebers, B.; Spadiut, O. Sulfolobus—A potential key organism in future biotechnology. Front. Microbiol. 2017, 8, 2474. [Google Scholar] [CrossRef] [PubMed]
- Himanshu, H.; Murphy, J.D.; Grant, J.; O’Kiely, P. Antagonistic effects on biogas and methane output when co-digesting cattle and pig slurries with grass silage in in-vitro batch anaerobic digestion. Biomass Bioenergy 2018, 109, 190–198. [Google Scholar] [CrossRef]


| Run | Glycerol | Inoculum | Algal Biomass | Hydrogen Production | ||||
|---|---|---|---|---|---|---|---|---|
| Concentration (X1) | Concentration (X2) | Concentration (X3) | ||||||
| (g/L) | (% v/v) | (g-VS/L) | (mL-H2/L) | |||||
| Code | Actual | Code | Actual | Code | Actual | Observed | Predicted | |
| 1 | 1 | 40 | 1 | 25 | −1 | 4.62 | 5.76 ± 0.73 | 5.5 |
| 2 | −1 | 10 | 1 | 25 | 1 | 23.1 | 583.2 ± 3.76 | 551.2 |
| 3 | 0 | 25 | −1 | 6.17 | −1 | 4.62 | 53.6 ± 2.77 | 56.5 |
| 4 | 0 | 25 | 1.628 | 31.39 | 0 | 13.86 | 210 ± 4.25 | 205.3 |
| 5 | 0 | 25 | 0 | 15.63 | 0 | 13.86 | 459.4 ± 1.05 | 458.2 |
| 6 | −1.682 | 0 | 0 | 15.63 | 0 | 13.86 | 11.4 ± 0.04 | 11.5 |
| 7 | 0 | 25 | 0 | 15.63 | 0 | 13.86 | 459.4 ± 1.05 | 458.2 |
| 8 | 0 | 25 | 0 | 15.63 | 0 | 13.86 | 459.4 ± 1.05 | 458.2 |
| 9 | 1 | 10 | 1 | 6.17 | −1 | 23.1 | 702.7 ± 1.28 | 717.9 |
| 10 | 1.628 | 50.23 | 0 | 15.63 | 0 | 13.86 | 295.5 ± 0.46 | 282.2 |
| 11 | −1 | 10 | 1 | 25 | −1 | 4.62 | 9.9 ± 0.16 | 10 |
| 12 | 1 | 40 | 1 | 25 | 1 | 23.1 | 311.1 ± 0.81 | 312.9 |
| 13 | 0 | 25 | 0 | 15.63 | 0 | 13.86 | 459.4 ± 1.05 | 458.2 |
| 14 | 0 | 25 | 0 | 15.63 | 0 | 13.86 | 459.4 ± 1.05 | 458.2 |
| 15 | −1 | 10 | −1 | 6.17 | −1 | 4.62 | 311.1 ± 1.03 | 318.8 |
| 16 | 0 | 25 | 0 | 15.63 | 1.628 | 29.4 | 530.7 ± 2.20 | 575.2 |
| 17 | 1 | 40 | −1 | 6.17 | 1 | 23.1 | 73.7 ± 3.57 | 75.9 |
| 18 | 0 | 25 | 0 | 15.63 | 0 | 13.86 | 459.4 ± 1.05 | 458.2 |
| 19 | 0 | 25 | −1.628 | 0 | 0 | 13.86 | 58.4 ± 0.34 | 55.3 |
| 20 | 0 | 25 | 0 | 15.63 | −1.628 | 0 | 15.9 ± 0.04 | 15.6 |
| Source | Sum of Squares | df | Mean Square | F Value | p-Value Prob > F |
|---|---|---|---|---|---|
| Model | 760,000.00 | 9 | 84,383.99 | 4.19 | 0.0178 |
| X1 | 22,357.92 | 1 | 22,357.92 | 1.11 | 0.3171 |
| X2 | 126,000.00 | 1 | 126,000.00 | 6.23 | 0.0317 |
| X3 | 145,000.00 | 1 | 145,000.00 | 7.18 | 0.0231 |
| X1X2 | 55,798.53 | 1 | 55,798.53 | 2.77 | 0.1272 |
| X1X3 | 51,115.31 | 1 | 51,115.31 | 2.54 | 0.1424 |
| X2X3 | 27,439.96 | 1 | 27,439.96 | 1.36 | 0.2704 |
| X12 | 118,000.00 | 1 | 118,000.00 | 5.85 | 0.0361 |
| X22 | 143,000.00 | 1 | 143,000.00 | 7.08 | 0.0238 |
| X32 | 41,327.48 | 1 | 41,327.48 | 2.05 | 0.1827 |
| Residual | 202,000.00 | 10 | 20,163.01 | ||
| Lack of Fit | 202,000.00 | 5 | 40,326.03 |
| Experiment | Glycerol Concentration (g/L) | Inoculum Concentration (% v/v) | Algal Biomass Concentration (g-VS/L) | Hydrogen Production (mL-H2/L) | HPR (mL-H2/L h) | TVFAs (g/L) |
|---|---|---|---|---|---|---|
| Low | 10.00 | 6.17 | 4.62 | 252.56 ± 2.27 | 3.98 | 8.44 ± 3.67 |
| High | 40.00 | 25 | 23.1 | 140.67 ± 3.41 | 1.60 | 11.94 ± 2.36 |
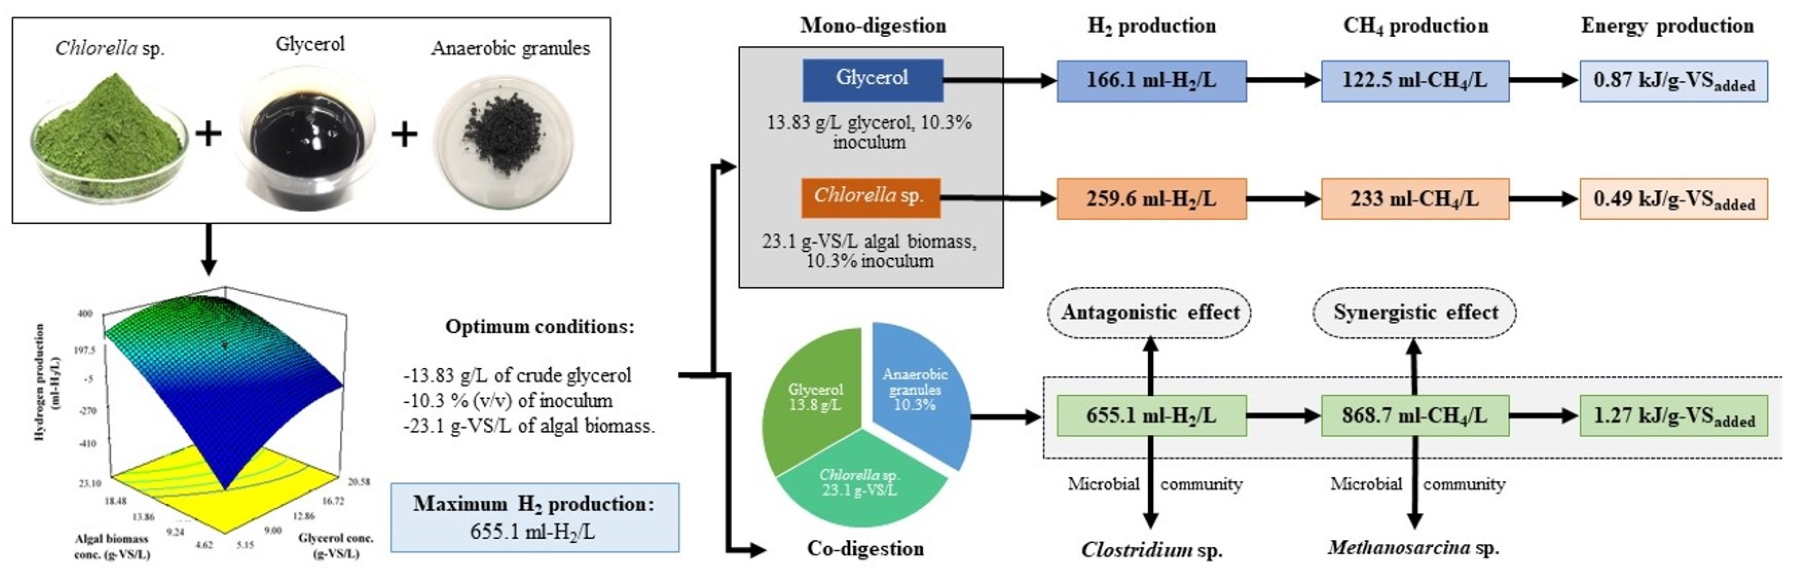
| Optimum | 13.83 | 10.31 | 23.1 | 655.12 ± 1.64 | 4.07 | 13.28 ± 3.06 |
| Raw Materials | Organisms | Hydrogen Yield (mL/g-VSadded) | Reference |
|---|---|---|---|
| Synthetic organic fraction of municipal solid waste + 1% glycerol | Anaerobic sludge | 26 | Fountoulakis and Manios [39] |
| Mixture of olive mill wastewater and slaughterhouse wastewater + 1% glycerol | Anaerobic digester sludge | 15 | Fountoulakis and Manios [39] |
| Palm oil decanter cake + 1.5% glycerol | Anaerobic sludge | 23 | Kanchanasuta and Sillaparassamee [40] |
| Food waste + 1% glycerol | Anaerobic digested sludge | 140 | Silva, Oliveira, Mahler, and Bassin [41] |
| Food waste + 3% glycerol Industrial municipal solid waste + 1% glycerol | Anaerobic digested sludge Thermophilic anaerobic digester effluent | 176 51 | Silva, Oliveira, Mahler, and Bassin [41] Zahedi, Solera, García-Morales, and Sales [42] |
| Crude glycerol + algal biomass | Anaerobic mixed cultures | 21.68 | This study |
| Hydrogenic Effluent | MP (mL-CH4/L) | MPR (mL-CH4/L-h) |
|---|---|---|
| Low | 387.4 ± 20.04 | 1.34 |
| High | 428.0 ± 13.12 | 1.40 |
| Optimum | 868.7 ± 19.98 | 2.95 |
| Experiment | Glycerol Concentration | Inoculum Concentration | Algal Biomass Concentration | Yield | α * | |
|---|---|---|---|---|---|---|
| (g/L) | (g-VS/L) | (%v/v) | (g-VS/L) | (mL/g-VSadded) | ||
| Hydrogen | ||||||
| Optimal | 13.83 | 7.12 | 10.3 | 23.1 | 21.68 | 0.63 |
| 13.83 | 7.12 | 10.3 | 0 | 23.33 | ||
| 0 | 0 | 10.3 | 23.1 | 11.24 | ||
| Methane | ||||||
| Optimal | 13.83 | 7.12 | 25 | 23.1 | 28.75 | 1.05 |
| 13.83 | 7.12 | 25 | 0 | 17.21 | ||
| 0 | 0 | 25 | 23.1 | 10.09 | ||
Publisher’s Note: MDPI stays neutral with regard to jurisdictional claims in published maps and institutional affiliations. |
© 2021 by the authors. Licensee MDPI, Basel, Switzerland. This article is an open access article distributed under the terms and conditions of the Creative Commons Attribution (CC BY) license (https://creativecommons.org/licenses/by/4.0/).
Share and Cite
Sittijunda, S.; Sitthikitpanya, N.; Plangklang, P.; Reungsang, A. Two-Stage Anaerobic Codigestion of Crude Glycerol and Micro-Algal Biomass for Biohydrogen and Methane Production by Anaerobic Sludge Consortium. Fermentation 2021, 7, 175. https://0-doi-org.brum.beds.ac.uk/10.3390/fermentation7030175
Sittijunda S, Sitthikitpanya N, Plangklang P, Reungsang A. Two-Stage Anaerobic Codigestion of Crude Glycerol and Micro-Algal Biomass for Biohydrogen and Methane Production by Anaerobic Sludge Consortium. Fermentation. 2021; 7(3):175. https://0-doi-org.brum.beds.ac.uk/10.3390/fermentation7030175
Chicago/Turabian StyleSittijunda, Sureewan, Napapat Sitthikitpanya, Pensri Plangklang, and Alissara Reungsang. 2021. "Two-Stage Anaerobic Codigestion of Crude Glycerol and Micro-Algal Biomass for Biohydrogen and Methane Production by Anaerobic Sludge Consortium" Fermentation 7, no. 3: 175. https://0-doi-org.brum.beds.ac.uk/10.3390/fermentation7030175