
Mechanisms of Metabolic Adaptation in Wine Yeasts: Role of Gln3 Transcription Factor


Institute for Integrative Systems Biology (I2SysBio), University of Valencia-CSIC, 46980 Paterna, Spain
*
Author to whom correspondence should be addressed.
Fermentation 2021, 7(3), 181; https://0-doi-org.brum.beds.ac.uk/10.3390/fermentation7030181
Submission received: 8 August 2021
/
Revised: 1 September 2021
/
Accepted: 2 September 2021
/
Published: 5 September 2021
(This article belongs to the Special Issue Yeast Biotechnology 5.0)
Abstract
:Wine strains of Saccharomyces cerevisiae have to adapt their metabolism to the changing conditions during their biotechnological use, from the aerobic growth in sucrose-rich molasses for biomass propagation to the anaerobic fermentation of monosaccharides of grape juice during winemaking. Yeast have molecular mechanisms that favor the use of preferred carbon and nitrogen sources to achieve such adaptation. By using specific inhibitors, it was determined that commercial strains offer a wide variety of glucose repression profiles. Transcription factor Gln3 has been involved in glucose and nitrogen repression. Deletion of GLN3 in two commercial wine strains produced different mutant phenotypes and only one of them displayed higher glucose repression and was unable to grow using a respiratory carbon source. Therefore, the role of this transcription factor contributes to the variety of phenotypic behaviors seen in wine strains. This variability is also reflected in the impact of GLN3 deletion in fermentation, although the mutants are always more tolerant to inhibition of the nutrient signaling complex TORC1 by rapamycin, both in laboratory medium and in grape juice fermentation. Therefore, most aspects of nitrogen catabolite repression controlled by TORC1 are conserved in winemaking conditions.
1. Introduction
Saccharomyces cerevisiae is the yeast with the most biotechnological interest due to its strong fermentative metabolism and the ability to adapt efficiently to harsh and changing environments [1]. In the wine industry, its role is to ferment the high amount of monosaccharides that are present in the grape juice (glucose and fructose) into ethanol, CO2, and other molecules of enological interest. In grape juice, sugars are plentiful, but nitrogen is usually scarce, resulting in a limiting factor for growth [2,3,4]. Yeasts have a preference for some nutrients over others, and those favorite ones exert catabolite repression upon the use of less favored ones. For instance, S. cerevisiae favors the use of glucose by fermentation, so when glucose is present over a certain threshold, the use of other less favorite monosaccharides (e.g., galactose), disaccharides (e.g., sucrose), or non-fermenting substrates that have to be metabolized by respiration (e.g., glycerol) is repressed. That is made thanks to a complex genetic program that modifies gene expression in order to impose such glucose repression [5]; that is, the molecular cause of the long term Crabtree effect (the fermentative activity even under fully aerobic conditions) that channels the metabolic flux to the ethanol production, but reducing the biomass generation [6]. Short term Crabtree effect is caused by the inability of mitochondria to deal with a strong glycolytic flux. This metabolic adaptation is a good approach to ferment sugars quickly, producing high ethanol that inhibits growth of less tolerant microorganisms present in grape juice [6]. In modern enology, selected yeasts are inoculated as starters in the form of active dry yeasts [7]. Biomass is propagated in molasses, that are a cheap source of sucrose, keeping low the sucrose concentration and high the oxygen supply to circumvent the Crabtree effect and achieve a higher cell density and diminish fermentation. Therefore, commercial wine strains must have a strong but flexible metabolism, allowing transitions in both directions, fermentation and respiration, to perform at an optimal level. Industrial (brewing and wine) strains tend to use faster sucrose than glucose [8], so the glucose repression is no that stringent for this disaccharide. In fact, we have shown that wine yeasts are more tolerant than laboratory strains to an unmetabolizable glucose analog, 2-deoxyglucose, that induces glucose repression in the presence of sucrose [9]. Nitrogen sources also fall into categories, being considered good ones for instance glutamine and ammonia, while proline and allantoin are poor (the variability, in this case, is higher and there are differences in the order each amino acid is consumed according to genetic and environmental factors) [2,4]. In a similar way, good sources (those that are incorporated easily into the metabolic pathways) impose a nitrogen catabolite repression (NCR) to the use of the poor ones (the ones that require more metabolic steps, energy or oxygen to be fully metabolized) [5].
All the processes dealing with nutrients are well known in laboratory conditions [5]. When glucose is plenty, protein kinase A promotes growth and suppresses stress response, leading to the establishment of glucose repression. When assimilable sugars drop, then Snf1 kinase is activated by phosphorylation, increasing the functions involved in gluconeogenesis and respiration, making possible the use of other carbon sources like galactose, glycerol, or the ethanol produced by fermentation, that is consumed by a glucose-repressed isoform of alcohol dehydrogenase, ADH2 [10]. In a similar fashion, when preferred nitrogen sources are plentiful, the target of rapamycin (TOR) kinase, acting inside the complex TORC1, promotes protein biosynthesis and growth. Its activity imposes the NCR. The activation of genes involved in the metabolism of non-preferred nitrogen sources relies upon the GATA transcription factors Gln3 and Gat1. Those factors remain on the cytosol when TORC1 activity is high [11]. This is achieved through repressor Ure2 that binds them, and this interaction is regulated by a complex balance in phosphorylation. This situation does not apply automatically to winemaking conditions, where Snf1 and Gln3 showed an early activation when sugars and nitrogen are still plenty [12]. Gln3 is also a target of Snf1, as amino acid metabolism has to be balanced with the metabolism of their carbon backbones [13]. We have found that deletion of GLN3 in a haploid wine yeast has an impact in fermentation quite similar to SNF1 deletion, so those pathways may be related and indicates the relevance of this transcription factor during fermentation of grape juice. The contribution of GAT1 was much smaller [9]; it was found that in a haploid wine strain and some laboratory genetic backgrounds, GLN3 deletion results in blocking growth in respiratory substrates, like glycerol, and in increased glucose repression [9].
In this work, we aimed to a quantitative analysis of glucose repression and respiration in a group of interesting industrial yeast strains to understand the variability and the contribution of such mechanisms in different growth media. Next, we analyzed the relevance of Gln3 transcription factor in two diploid commercial strains by deletion, both in a variety of laboratory media and minivinifications, analyzing some molecular markers and testing inhibitors of the relevant pathways. The results indicate that Gln3 is relevant for processes regulating carbon and nitrogen metabolism, and shows that a genetic background is crucial to understand the contribution of the nutrient signaling mechanisms.
2. Materials and Methods
2.1. Yeast Strains and Genetic Manipulation
S. cerevisiae wine strains (EC1118, T73, 71B, L2056, M2) were from Lallemand Inc., baker’s yeast Cinta Roja was from AB/Mauri, and chicha strains EYS5 and ERS1 were isolated by our laboratory [14]. GLN3 deletion mutants were made in M2 and EC1118 diploid strains with the reusable kanMX marker, amplified by PCR from the pUG6 plasmid [15]. This marker contains loxP sites to be excised it by Cre recombinase from plasmid YEp-cre-cyh [16]. The CRISPR-Cas9 deletion of the URE2 gene was made using plasmid pRCC-K, a gift from Eckhard Boles (Addgene plasmid # 81191), in accordance with the provided protocol [17]. Yeast transformations were performed by the lithium acetate method [18].
2.2. Growth Media and Conditions
By default, yeasts were grown in a rich YPD medium (1% yeast extract, 2% bactopeptone, 2% glucose). Solid plates contained 2% agar and 20 μg/mL of geneticin for the selection of kanMX transformants. Other rich media were derived by changing the carbon source: YPS contained 2% sucrose, YPGal 2% galactose, YPGly 2% glycerol. Minimal medium SD contained 0.17% yeast nitrogen base, 0.5% ammonium sulfate, and 2% glucose [19]. This medium was used to select the transformants with cycloheximide resistance by employing it at 2 μg/mL. Nitrogen was changed from this minimal medium replacing ammonium sulfate by 0.5% proline (SPro), 0.5% glutamine (SGln), 300 mg/L of a mix of amino acids (Saa), or 300 mg/L of ammonium chloride (SNH4).
Growth curves were performed in a Varioskan Lux plate reader at 30 °C with shaking, inoculating from a stationary culture in YPD at OD600 of 0.1. Inhibitors were used at the following concentration: 2-deoxyglucose was added at 200 μg/mL, rapamycin at 200 nM, antimycin A at 3 mg/L. For the spot analysis, serial dilutions from stationary cultures in YPD were carried out and 5 μL drops were placed on selective media containing the right amount of inhibitors (glucosamine 0.05%, 10 mM 3-aminotriazole, 50 mM methylamine, 80 mg/L canavanine). Synthetic grape juice MS300 (containing 300 mg/L of assimilable nitrogen) was made as previously described [20] with some changes [21]. It contains a equimolar amount of glucose and fructose at 10%, malic acid 3 g/L, citric acid 0.3 g/L, tartaric acid 3 g/L, assimilable nitrogen source 300 mg N/L (120 mg as (NH4)Cl and 180 mg as amino acids), mineral salts (KH2PO4 750 mg/L, K2SO4 500 mg/L, MgSO4 250 mg/L, CaCl2 155 mg/L, and NaCl 200 mg/L), oligoelements, vitamins and anaerobic factors (ergosterol 15 mg/L and oleic acid 5 mg/L, Tween 80 0.5 mL/L) at pH 3.3. MS60 was the same, but with a reduction in the amount of amino acids and ammonium proportionally. Cells were inoculated from a stationary culture in YPD at 106 cells/mL in 30 mL fill-in tubes and kept at 25 °C with low shaking (50 rpm).
2.3. Biochemical Determinations
Reducing sugars were measured with DNS (dinitro-3,5-salicylic acid) compared with a glucose calibration curve according to Miller’s method [22]. α-amino acids were determined by the O-phthaldialdehyde/N-acetyl-L-cysteine method, using a curve of isoleucine as reference [23]. Other metabolites were measured with commercial kits (Megazyme Ltd., Bray, Ireland). Cellular respiration was followed by the 1-(4,5-dimethylthiazol-2-yl)-3,5-diphenyltetrazolium bromide (MTT) assay [24] with modifications [25].
2.4. Western Blot and Zymogram
To analyze Snf1 activation, proteins were extracted by fast cell lysis with trichloroacetic acid (TCA) [26]. To 5 OD600 units of cells, 5.5% TCA was added. Cells were incubated on ice for 15 min before centrifuging. The pellet was washed twice with acetone and resuspended in 150 μL of 10 mM Tris-HCl, pH 7.5, 1 mM EDTA, and broken with 150 μL of 0.2 M NaOH. SDS-PAGE was carried out in an Invitrogen mini-gel device, gel was blotted onto PVDF membranes a Novex semy dry blotter (Invitrogen, Waltham, MA, USA). The membrane was probed with anti-AMPKα Thr172, Cell Signalling Technologies, Topsfield, MA, USA). The ECL Western blotting detection system (GE) was used following the manufacturer’s instructions.
To perform the zymogram, cells were broken in cold 50 mM phosphate buffer, pH 7.5, with glass beads in a FastPrep 24 (MP-Biomedicals, Irvine, CA, USA) [27]. Electrophoresis were run in cold non-denaturing 6.5% acrylamide PAGE gel in an Invitrogen mini-gel device. Activity was detected by soaking the gel in 2 mg phenazine methosulfonate (PMS), 5 mg nitro-tetrazolium blue (NTB), 25 mg NAD, and 0.05 mL ethanol dissolved in 25 mL of 0.1 M Tris-HC1 HCl buffer, pH 8.5 solution by looking for a dark deposit [28].
3. Results
3.1. Quantitative Analysis of Carbon Metabolism in Food-related S. cerevisiae Strains
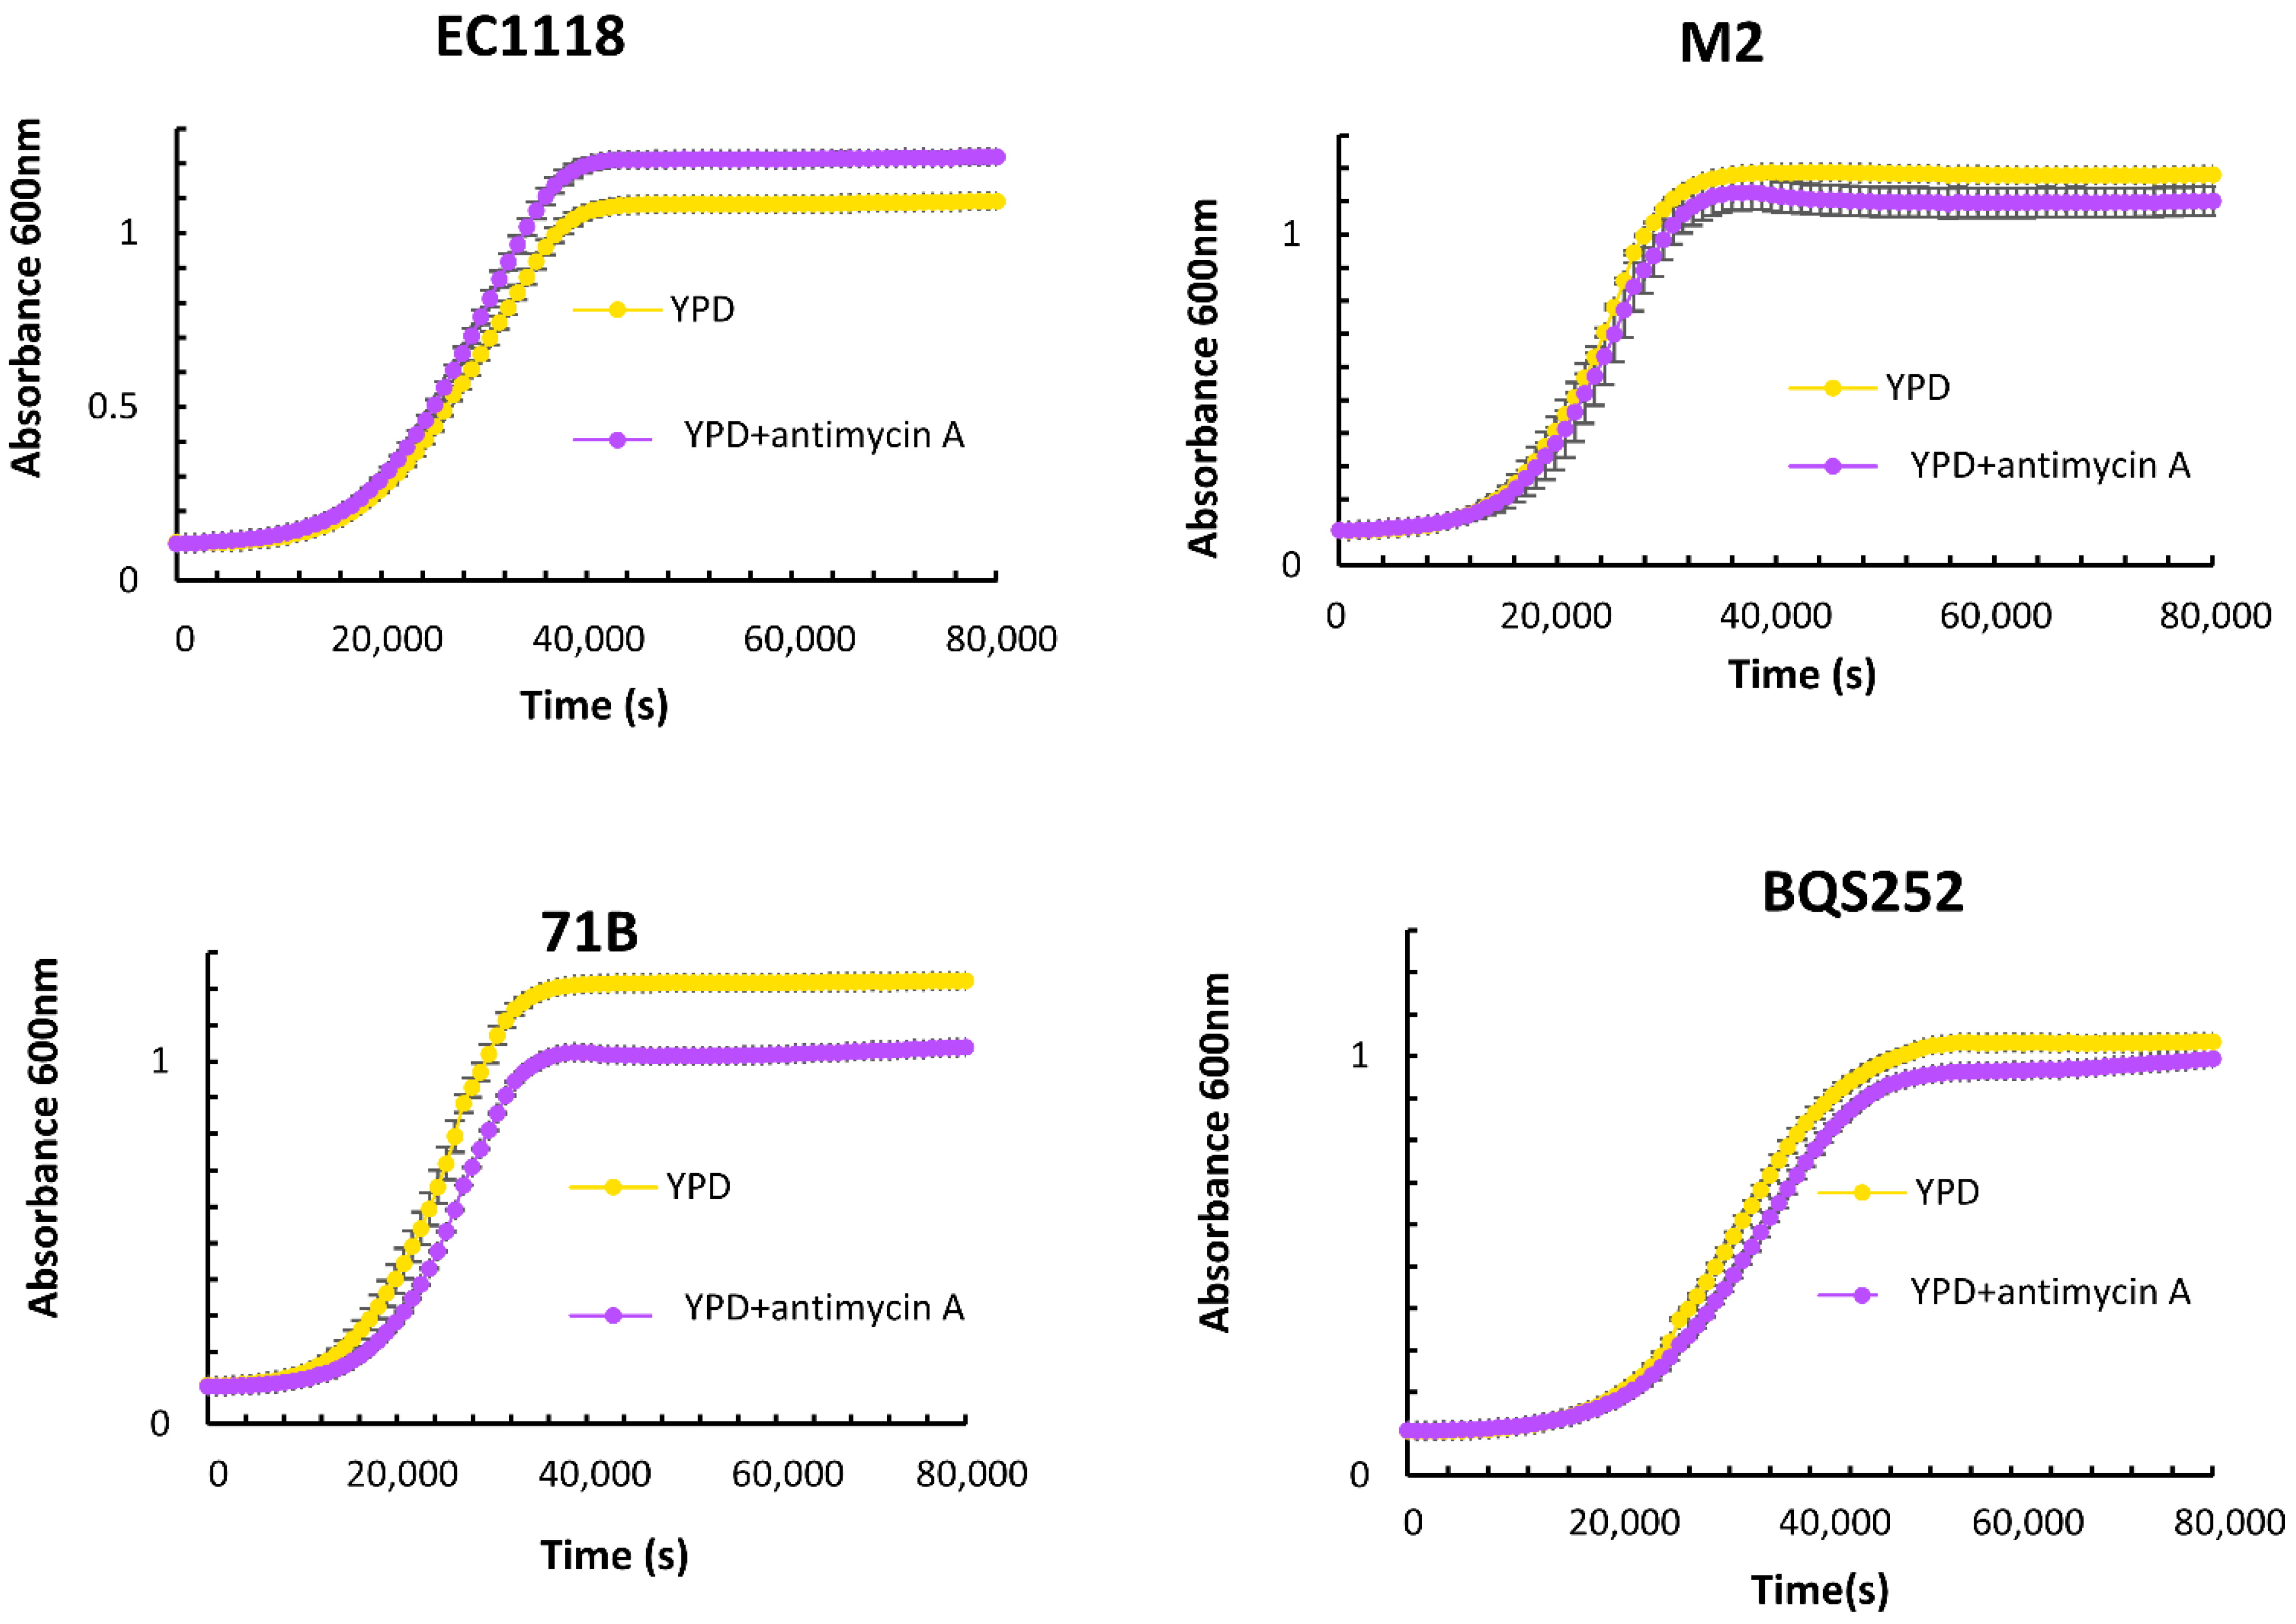
First, the behavior under different carbon sources and with the presence of metabolic inhibitors was tested (Figure 1 and Figure 2 and Supplementary Figure S1). Several commercial wine yeasts (T73, EC1118, M2, L2056, and 71B) were compared to baker’s yeast Cinta Roja and chicha fermentation yeasts (EYS5, corn, and ERS1, rice [14]) and a laboratory strain that has no auxotrohies for amino acid metabolism, BQS252. Yeast was grown in a rich medium containing, as carbon source, glucose (YPD), sucrose (YPS), and galactose (YPGal). Antimycin A, an electron transport chain inhibitor, was used to test the role of respiration [29]. Glucose analog 2-deoxyglucose was used to study glucose repression on alternative carbon sources other than glucose, such as sucrose and galactose. Growth was carried out in multiwell plates at 30 °C and followed by OD600, obtaining kinetic parameters such as maximum velocity of growth (Vmax), maximum OD600 (OD600max), and lag time (Table 1 and Table 2 and Supplemental Table S1). YPD is the standard rich medium with glucose used to propagate all kinds of yeasts. Yeasts in this condition grow by fermentation and mitochondrial respiration is not required. Antimycin A would block such respiration. The effect on growth for laboratory strain BQS252 and most industrial strains (M2 is depicted in Figure 1, for example) is therefore very small, as expected. After consuming glucose, cells enter postdiauxic growth and they consume the resulting ethanol by respiration, so the maximum growth is dependent on mitochondrial activity, and that is reflected in a small reduction in the OD600max reached. There is, however, some phenotypic variation among wine yeasts. The 71B strain is the most sensitive one, which relies mostly on respiratory metabolism, as the ratios of all parameters (Table 1) indicate a growth delay. Surprisingly, the EC1118 strain performs better with antimycin A, starting growing earlier (the lowest ratio in lag time) and the growth speed and saturation OD were the highest. Therefore, inhibition of mitochondria helps this strain to achieve a better fermentation performance. Sucrose is a carbon source commonly used in the food industry, as for instance, for yeast biomass propagation. In this case, the effect of antimycin is also small (Supplementary Figure S1 and Table S1), indicating a fully fermentative metabolism. In this case, strain EC1118 does not have an improved saturation point nor lag phase, although its Vmax is bigger. The lag phase in galactose is a way of stimulating the activation of respiratory genes [29]. Unfortunately, EC1118 and T73 strains are unable to metabolize this monosaccharide, so the spectrum of wine yeast is reduced. The rest of the strains showed an expected delay in the start of growth, similar to the laboratory strain (Supplemental Table S1). Baker’s yeast Cinta Roja was insensitive to this chemical.
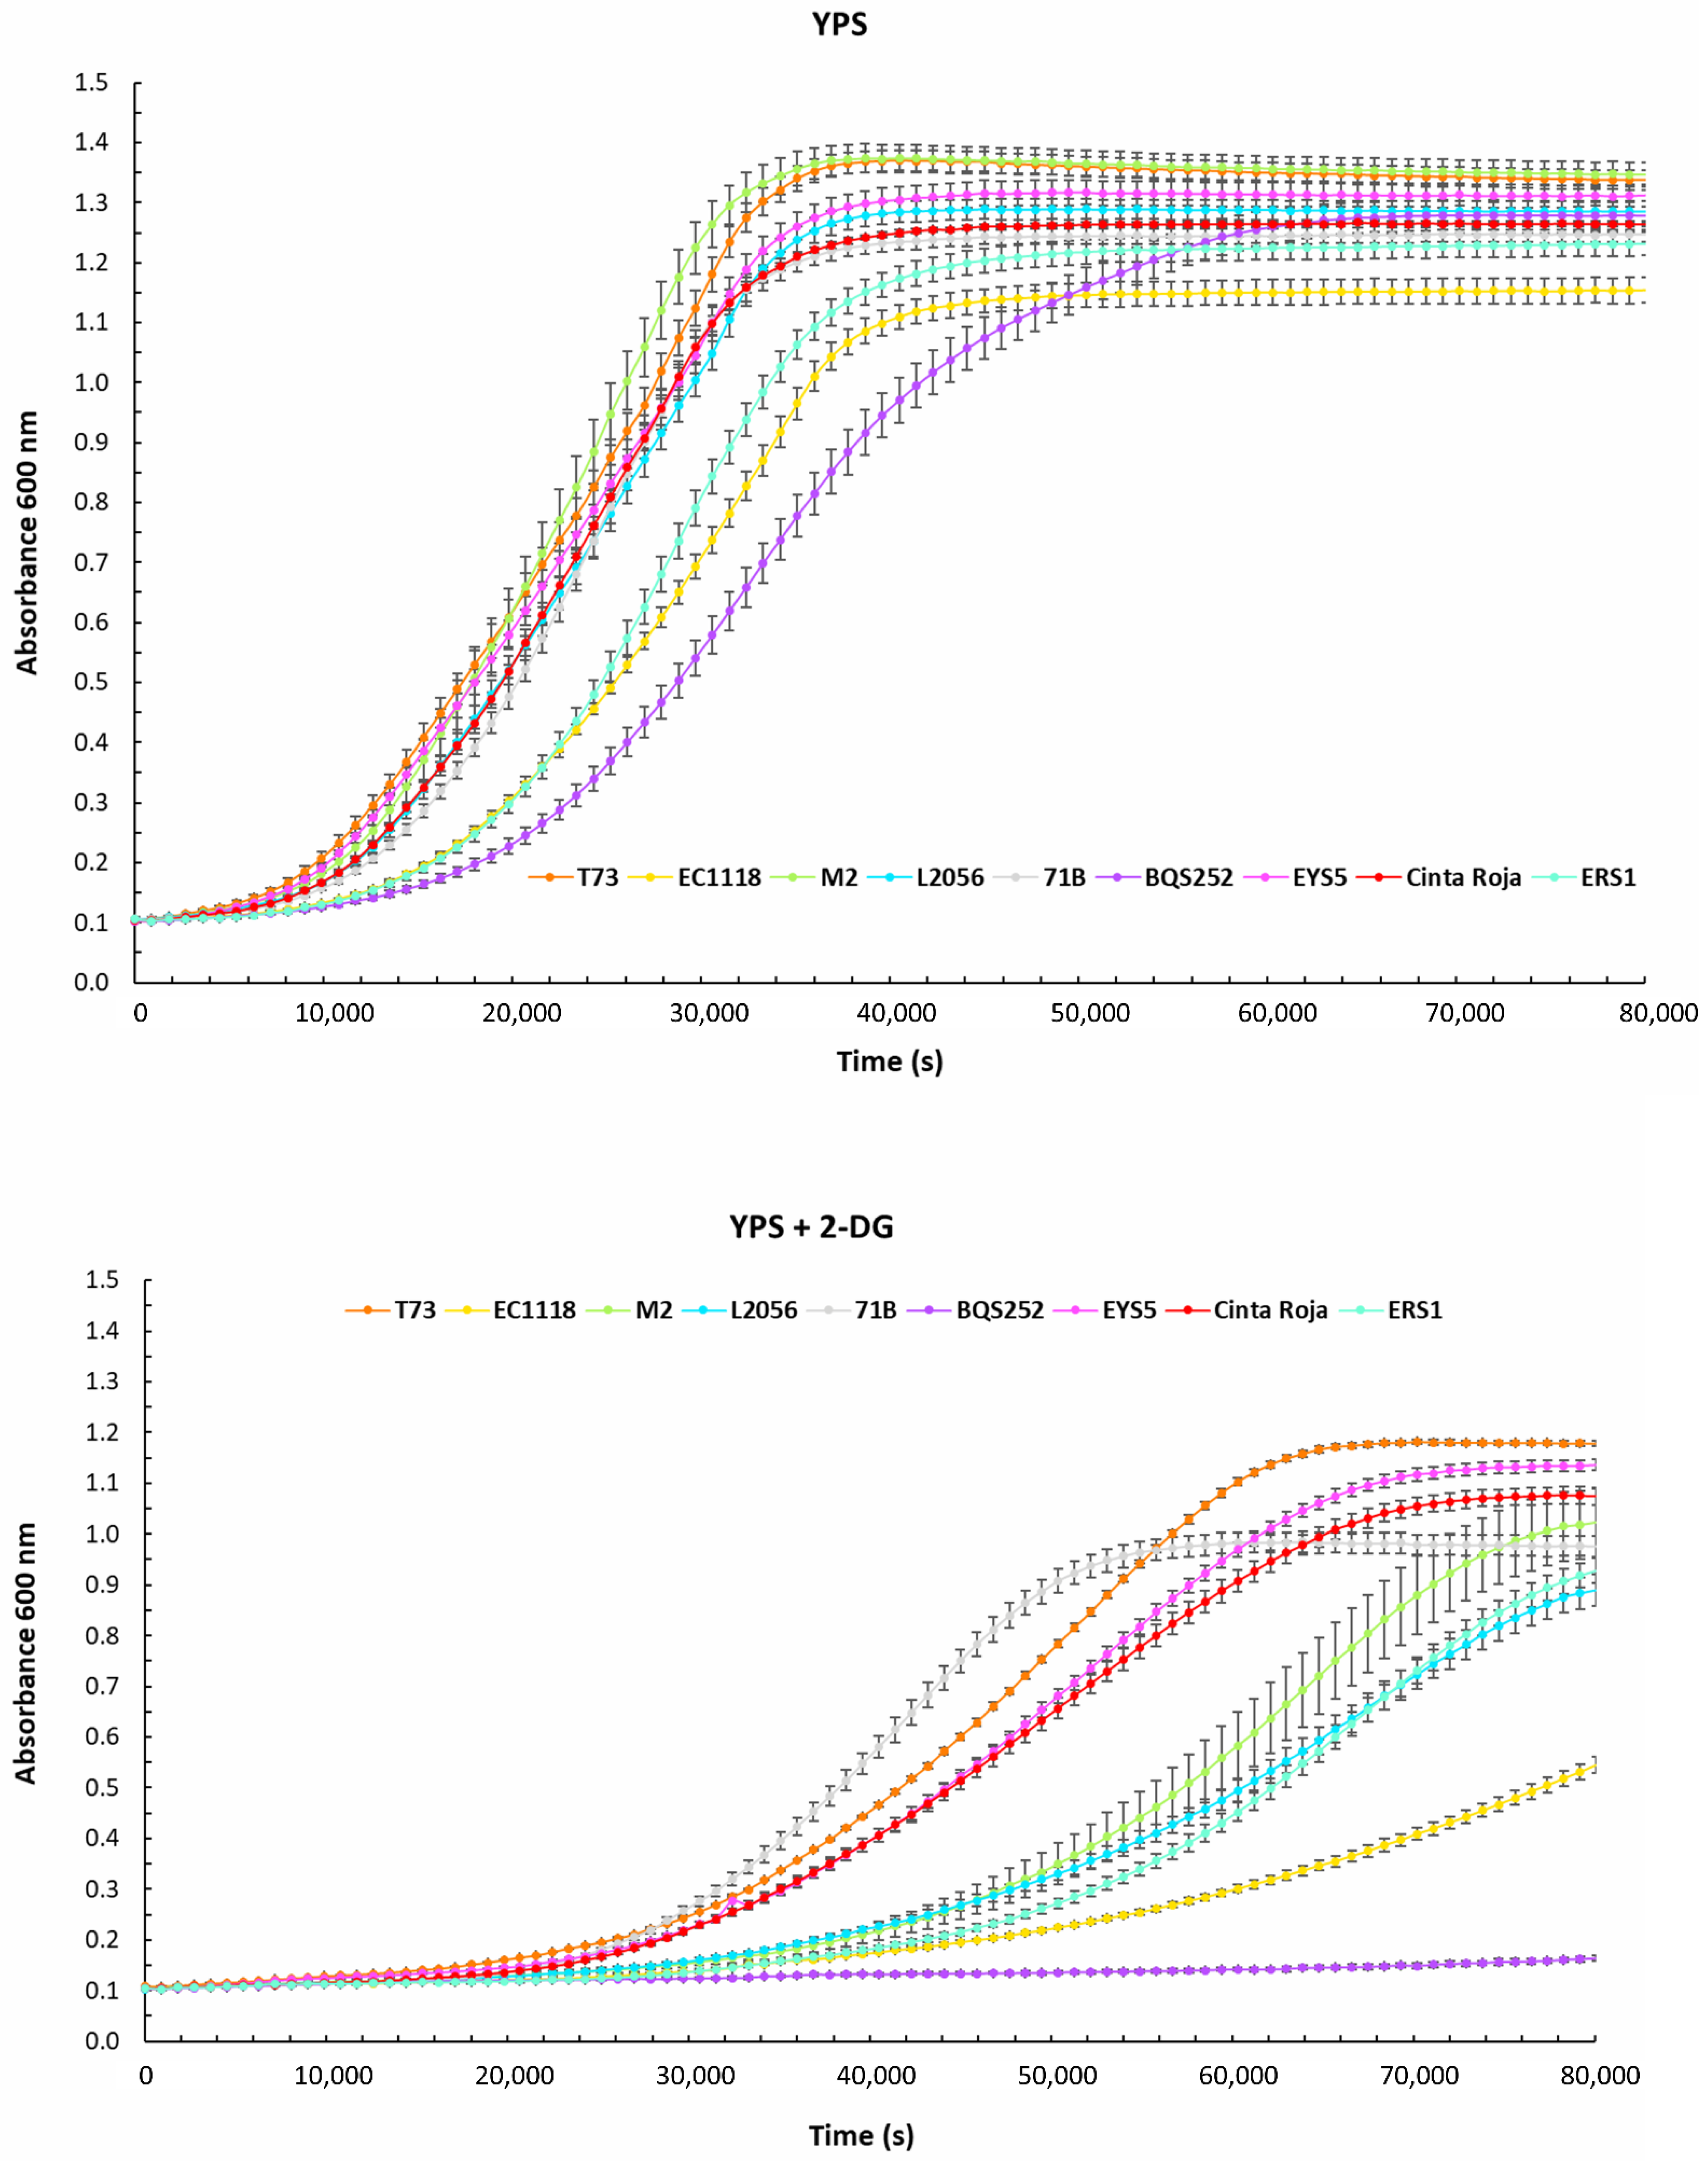
Glucose analog 2-deoxyglucose can induce a state of glucose repression that inhibits growth in a carbon source subjected to catabolite repression, such as sucrose and galactose. In the case of the strains that grow in galactose, their growth was fully inhibited by the amount of 2DG used (Supplementary Figure S1), so there are no quantitative data. However, surprisingly chicha rice yeast ERS1 was able to grow quite normaly, indicating that its galactose metabolism is insensitive for glucose repression by unknown causes.
The 2DG effect is better known in a medium containing sucrose as the carbon source. In this condition, the growth of laboratory strain is fully inhibited, while all industrial strains were able to cope with glucose repression and growth (Figure 2). That was observed qualitatively before [12], but now using kinetic parameters, we can estimate differences between strains quantitatively (Table 2). There is a wide variety of behaviors among wine strains. The most sensitive strain is EC1118, which does not reach saturation along the time course. The ratio of Vmax is the lowest among strains, reinforcing the idea of higher repression. Interestingly, EC1118 is the strain that reaches the lowest absorbance at saturation point in the control YPS curve, suggesting a different way of dealing with this disaccharide that may influence the degree of glucose repression. The most tolerant wine strain was T73, with the highest ODmax and a high Vmax. 71B strain shows a different profile, with relatively short lag time and growth speed, but with a higher impact in the long term, reaching a low ODmax. That may suggest short-term and long-term effects on glucose repression, or a better quick response but an earlier entry into the stationary phase due to a poor adaptation to sucrose starvation. Wine yeasts do not act differently to other yeasts of biotechnological interest (for instance, wine L2056 is very similar to chicha ERS1 at this effect), so the mechanisms of glucose are not particular for this breed of industrial yeast overall.
3.2. Gln3 Has a Complex Role in Carbon Metabolism in Commercial Wine Yeasts
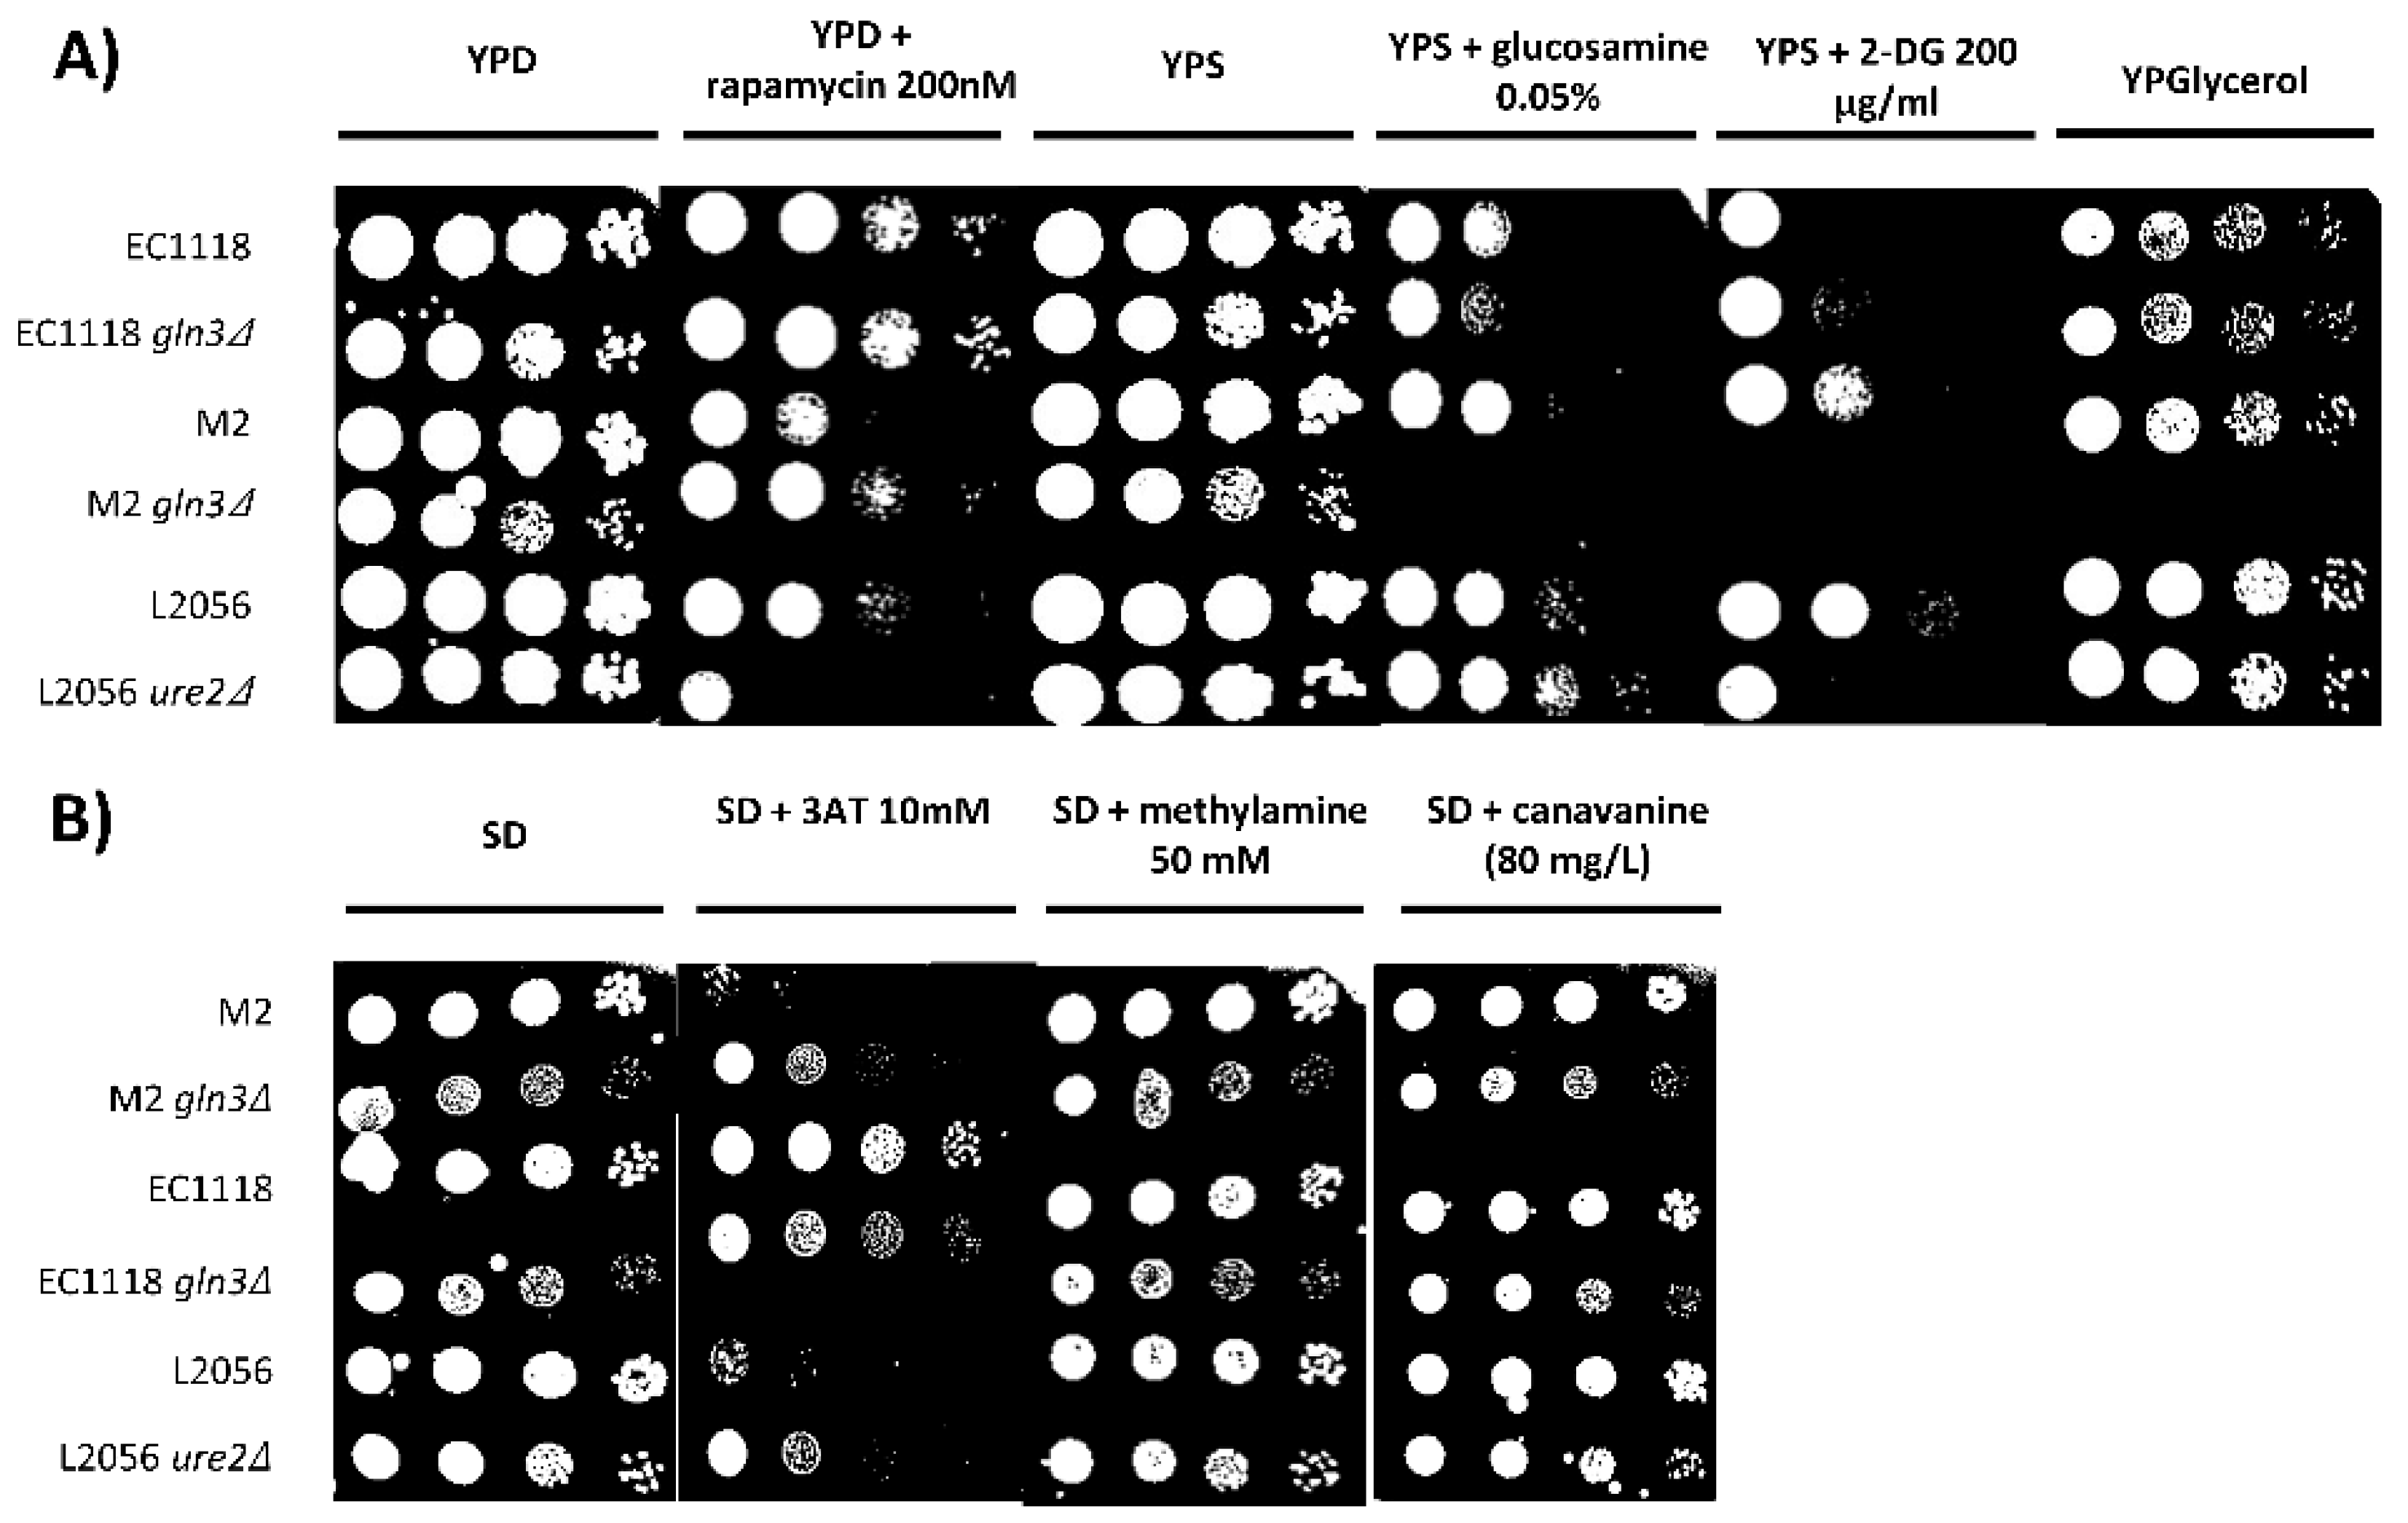
As there are phenotypic differences between commercial wine yeasts regarding respiratory metabolism and glucose repression, the next experiments tried to identify potential molecular players in these processes. Previously, we have shown that transcription factor GLN3 deletion blocks respiration and increases glucose repression in one haploid wine strain and some laboratory, but not all, genetic backgrounds [9]. In order to investigate the relevance of the Gln3 transcription factor in commercial strains, the two copies of GLN3 were deleted from diploid strains EC1118 and M2. EC1118 was chosen by its extreme behavior against inhibitors antimycin A and 2-deoxyglucose, and because it is one of the most used strains in industry. As a complement, M2 strain was chosen as a reference due to its average response to those inhibitors. The results of these mutations was tested by spot analysis in selective media (Figure 3). The fastest way to test for respiration is to grow yeasts in a media where the carbon source has to be metabolized by respiration, such as glycerol. Cells were spotted in rich medium containing glucose (YPD) or glycerol (YPglycerol) (Figure 3A). GLN3 mutation does not cause a deleterious phenotype as both mutants grow fine in YPD. EC1118 gln3 grows strongly in glycerol, but M2 gln3 is unable to grow in a non-fermentative carbon source. Therefore, both strains are quite different in terms of respiratory metabolism, and M2 relies more on this transcription factor. To test glucose repression, cells were grown in YPSucrose with 2-deoxyglucose. EC1118 is more sensitive to 2DG, but GLN3 deletion does not change it. However, deletion of GLN3 in M2 causes a full inhibition of growth, also indicating a clear role of this factor in this event. Glucosamine is another glucose analog that is known to induce glucose repression. Again M2 gln3 is unable to grow in the presence of this inhibitor. In the EC1118 gln3 strain, the effect is smaller but in the same direction. Gln3 is controlled, among other signaling pathways, by the TORC1 complex. Deletion of GLN3 causes increased rapamycin tolerance in laboratory strains [30], and it is the same for the M2 gln3 mutant, so the TORC1 branch of Gln3 regulation seems to be fine. The effect on EC1118 is similar but much less intense.
To further characterize the phenotype of GLN3 deletion, mutants were spotted in minimal medium, where aspects of nitrogen metabolism can be studied (Figure 3B). Canavanine and methylamine are toxic analogs of arginine and ammonia, respectively, that can be used to assess the impact of a mutation in amino acid or ammonia import. In this case, the mutants have no phenotype in either genetic background. 3-aminotriazol is used to measure amino acid biosynthesis, as it inhibits the His3 imidazoleglycerol-phosphate dehydratase I for histidine biosynthesis. M2 gln3 is more tolerant to this inhibitor, while EC1118 is insensitive to it. Therefore, there is also a phenotypic diversity in some aspects of nitrogen metabolism regarding GLN3 implication.
Ure2 is a repressor of Gln3 transcription factor that channels signaling from TORC1. We developed a CRISPR-Cas9 based method to delete both copies of such genes in industrial yeasts. We failed to modify EC1118 and M2 strains, but the method was successful in strain L2056. The mutation behaves the expected way [31], as it increased sensitivity to rapamycin (Figure 3A). Ure2 plays no role in respiration, as the mutant grows fine in glycerol, but its mutation increases glucose repression as the deletion mutant is more sensitive to 2DG.
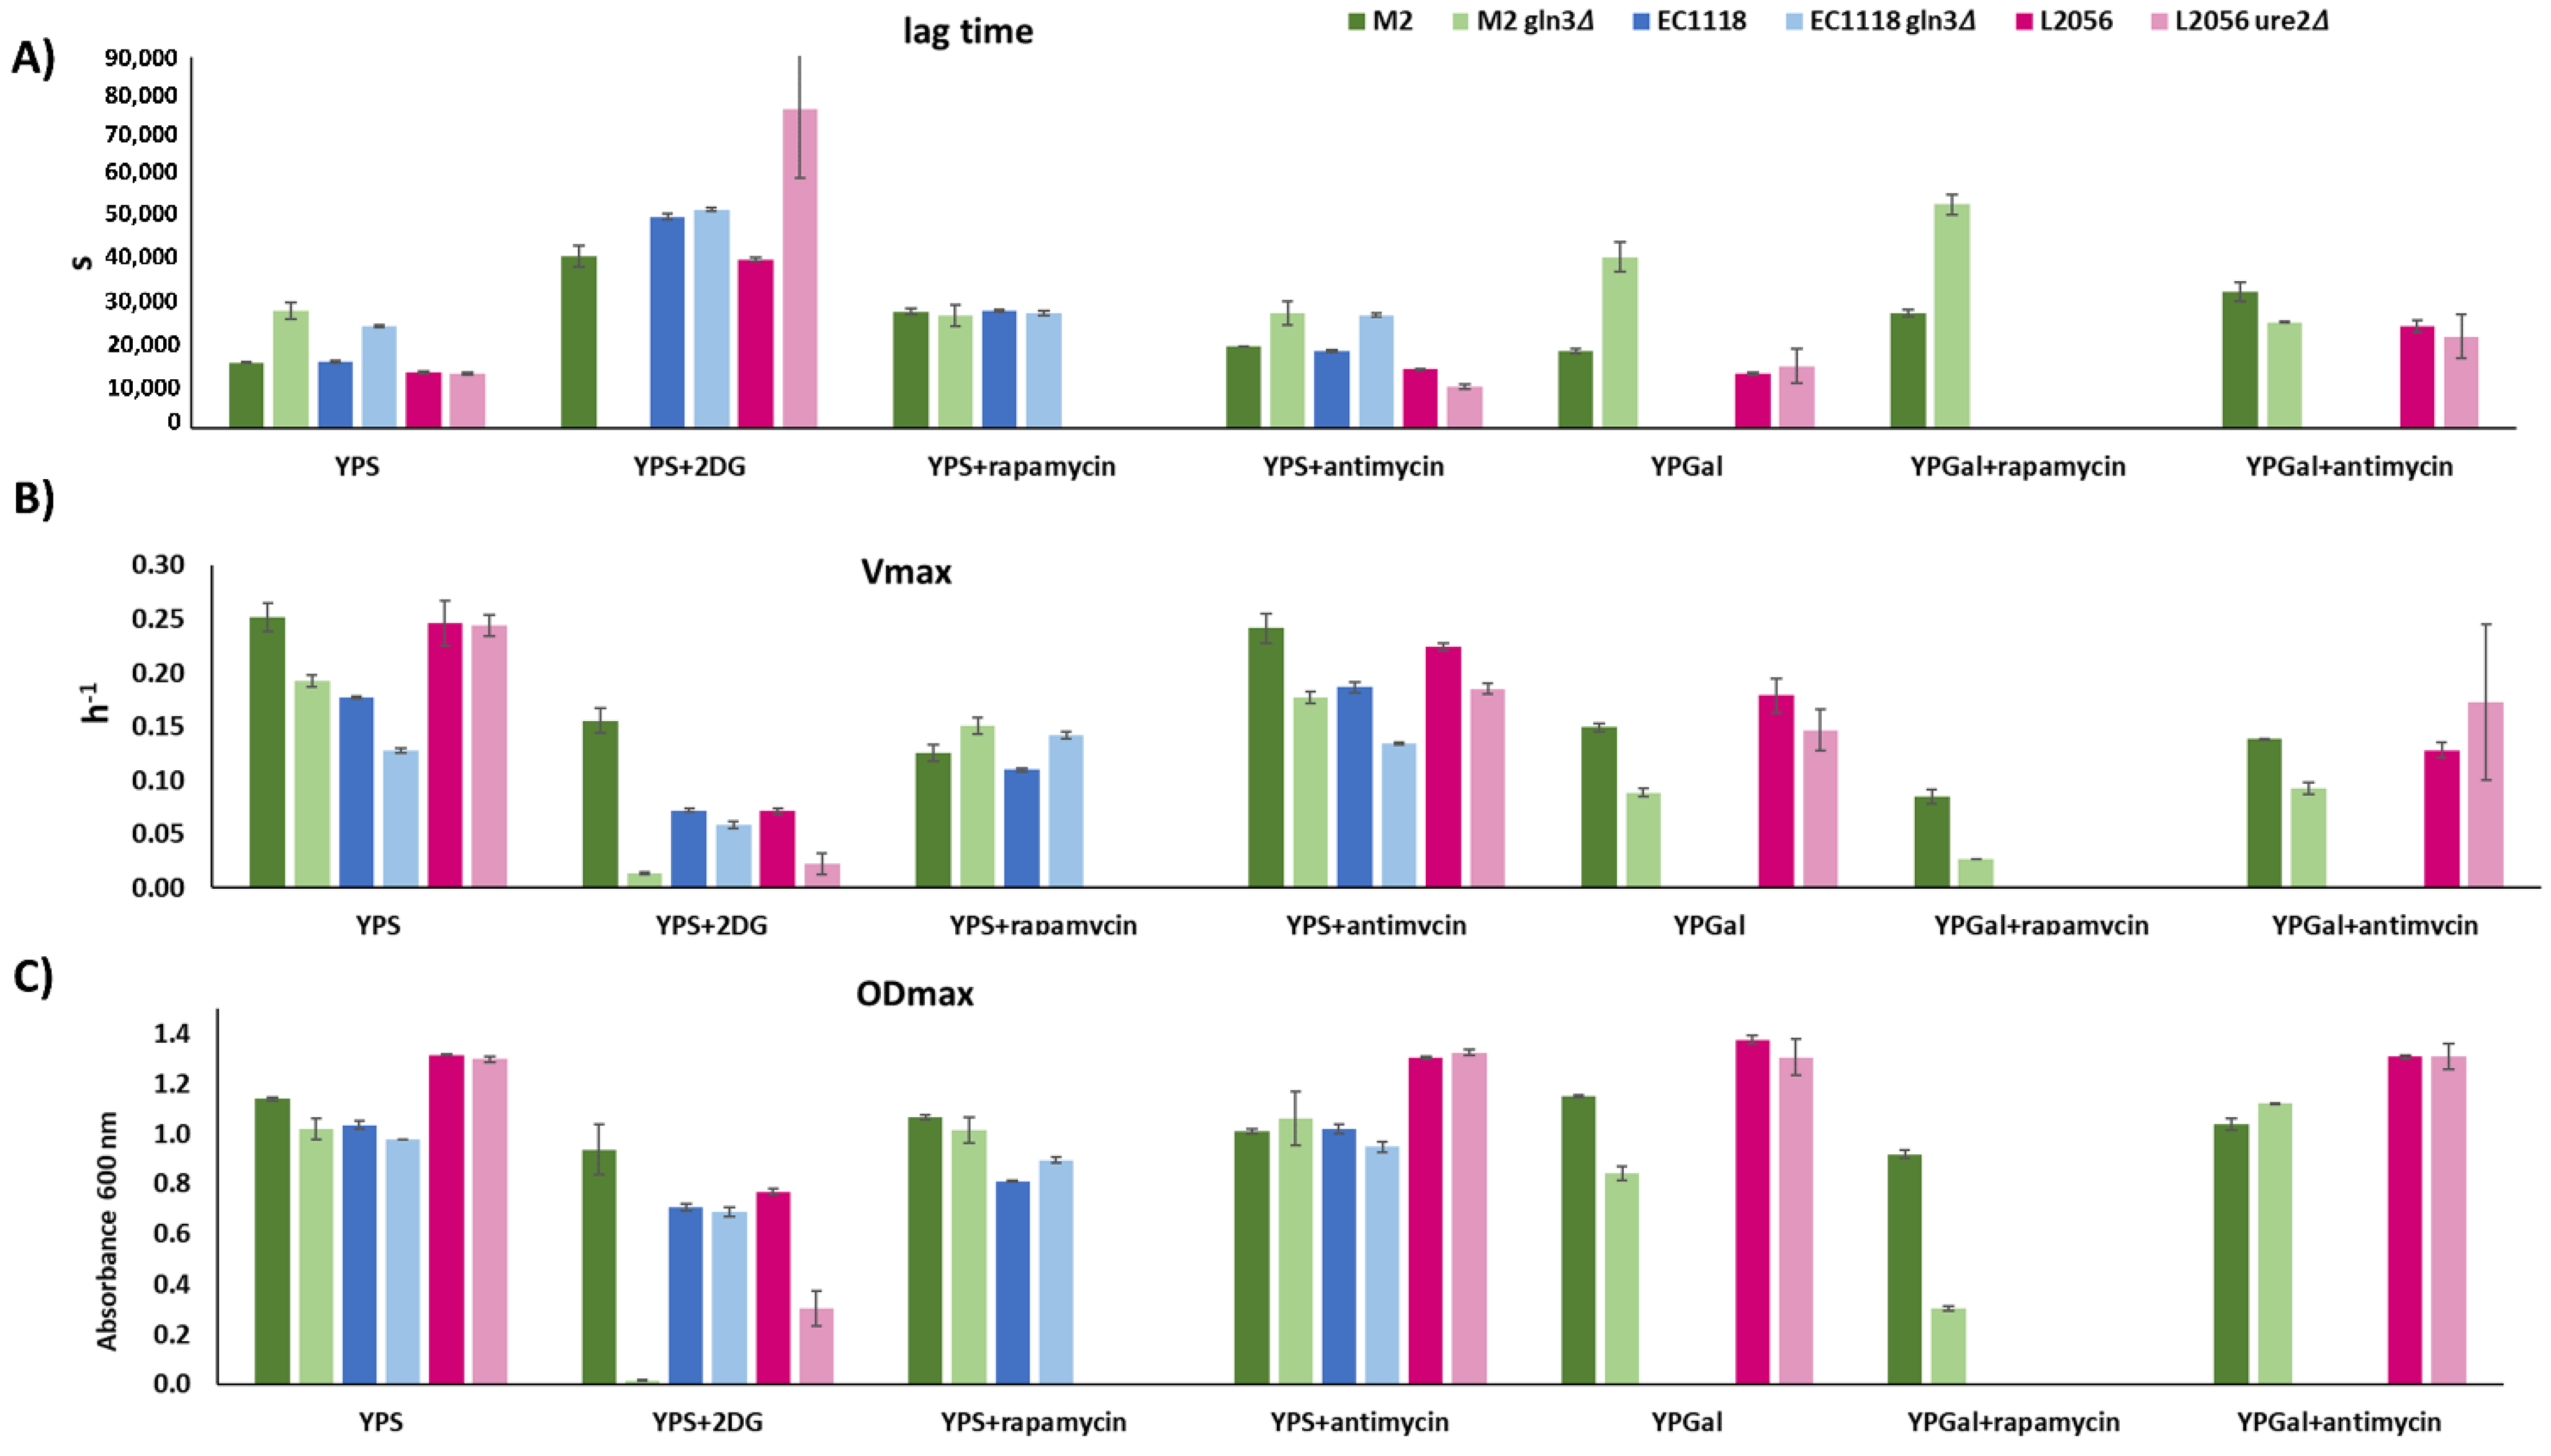
To further quantitatively analyze the effect of such mutations, growth curves of the aforementioned mutants in the presence of inhibitors, like 2-DG and antimicyn A, were obtained and the kinetic parameters calculated (Figure 4). Cells grown in sucrose confirm the higher sensitivity to 2DG of the M2 gln3 in all parameters, while showing that deletion of URE2 extends lag time in the presence on 2-DG and reduces Vmax and ODmax. GLN3 deletion increases Vmax in the presence of rapamycin in both genetic backgrounds, indicating that the effect on growth is common. Both mutants behave similarly in terms of lag phase, so their mechanisms of adaptation are also similar. Antimycin A was tested for all three mutants in YPS and no major impact was seen. Antimycin was also tested in YPGalactose (in this case, EC1118 was left out, as it does not grow in galactose). In galactose, GLN3 deletion had a negative impact on M2 growth (increase lag phase, reduced speed, and maximum OD). However, antimycin A relieves those differences, and in fact, the mutant had a reduced lag phase and it reaches an slightly higher final OD. URE2 deletion has no major impact on the sensitivity to antimycin A during growth in galactose. Inhibition of growth with 2DG in YPgalactose was complete for all strains.
3.3. Molecular Markers of GLN3 Deletion
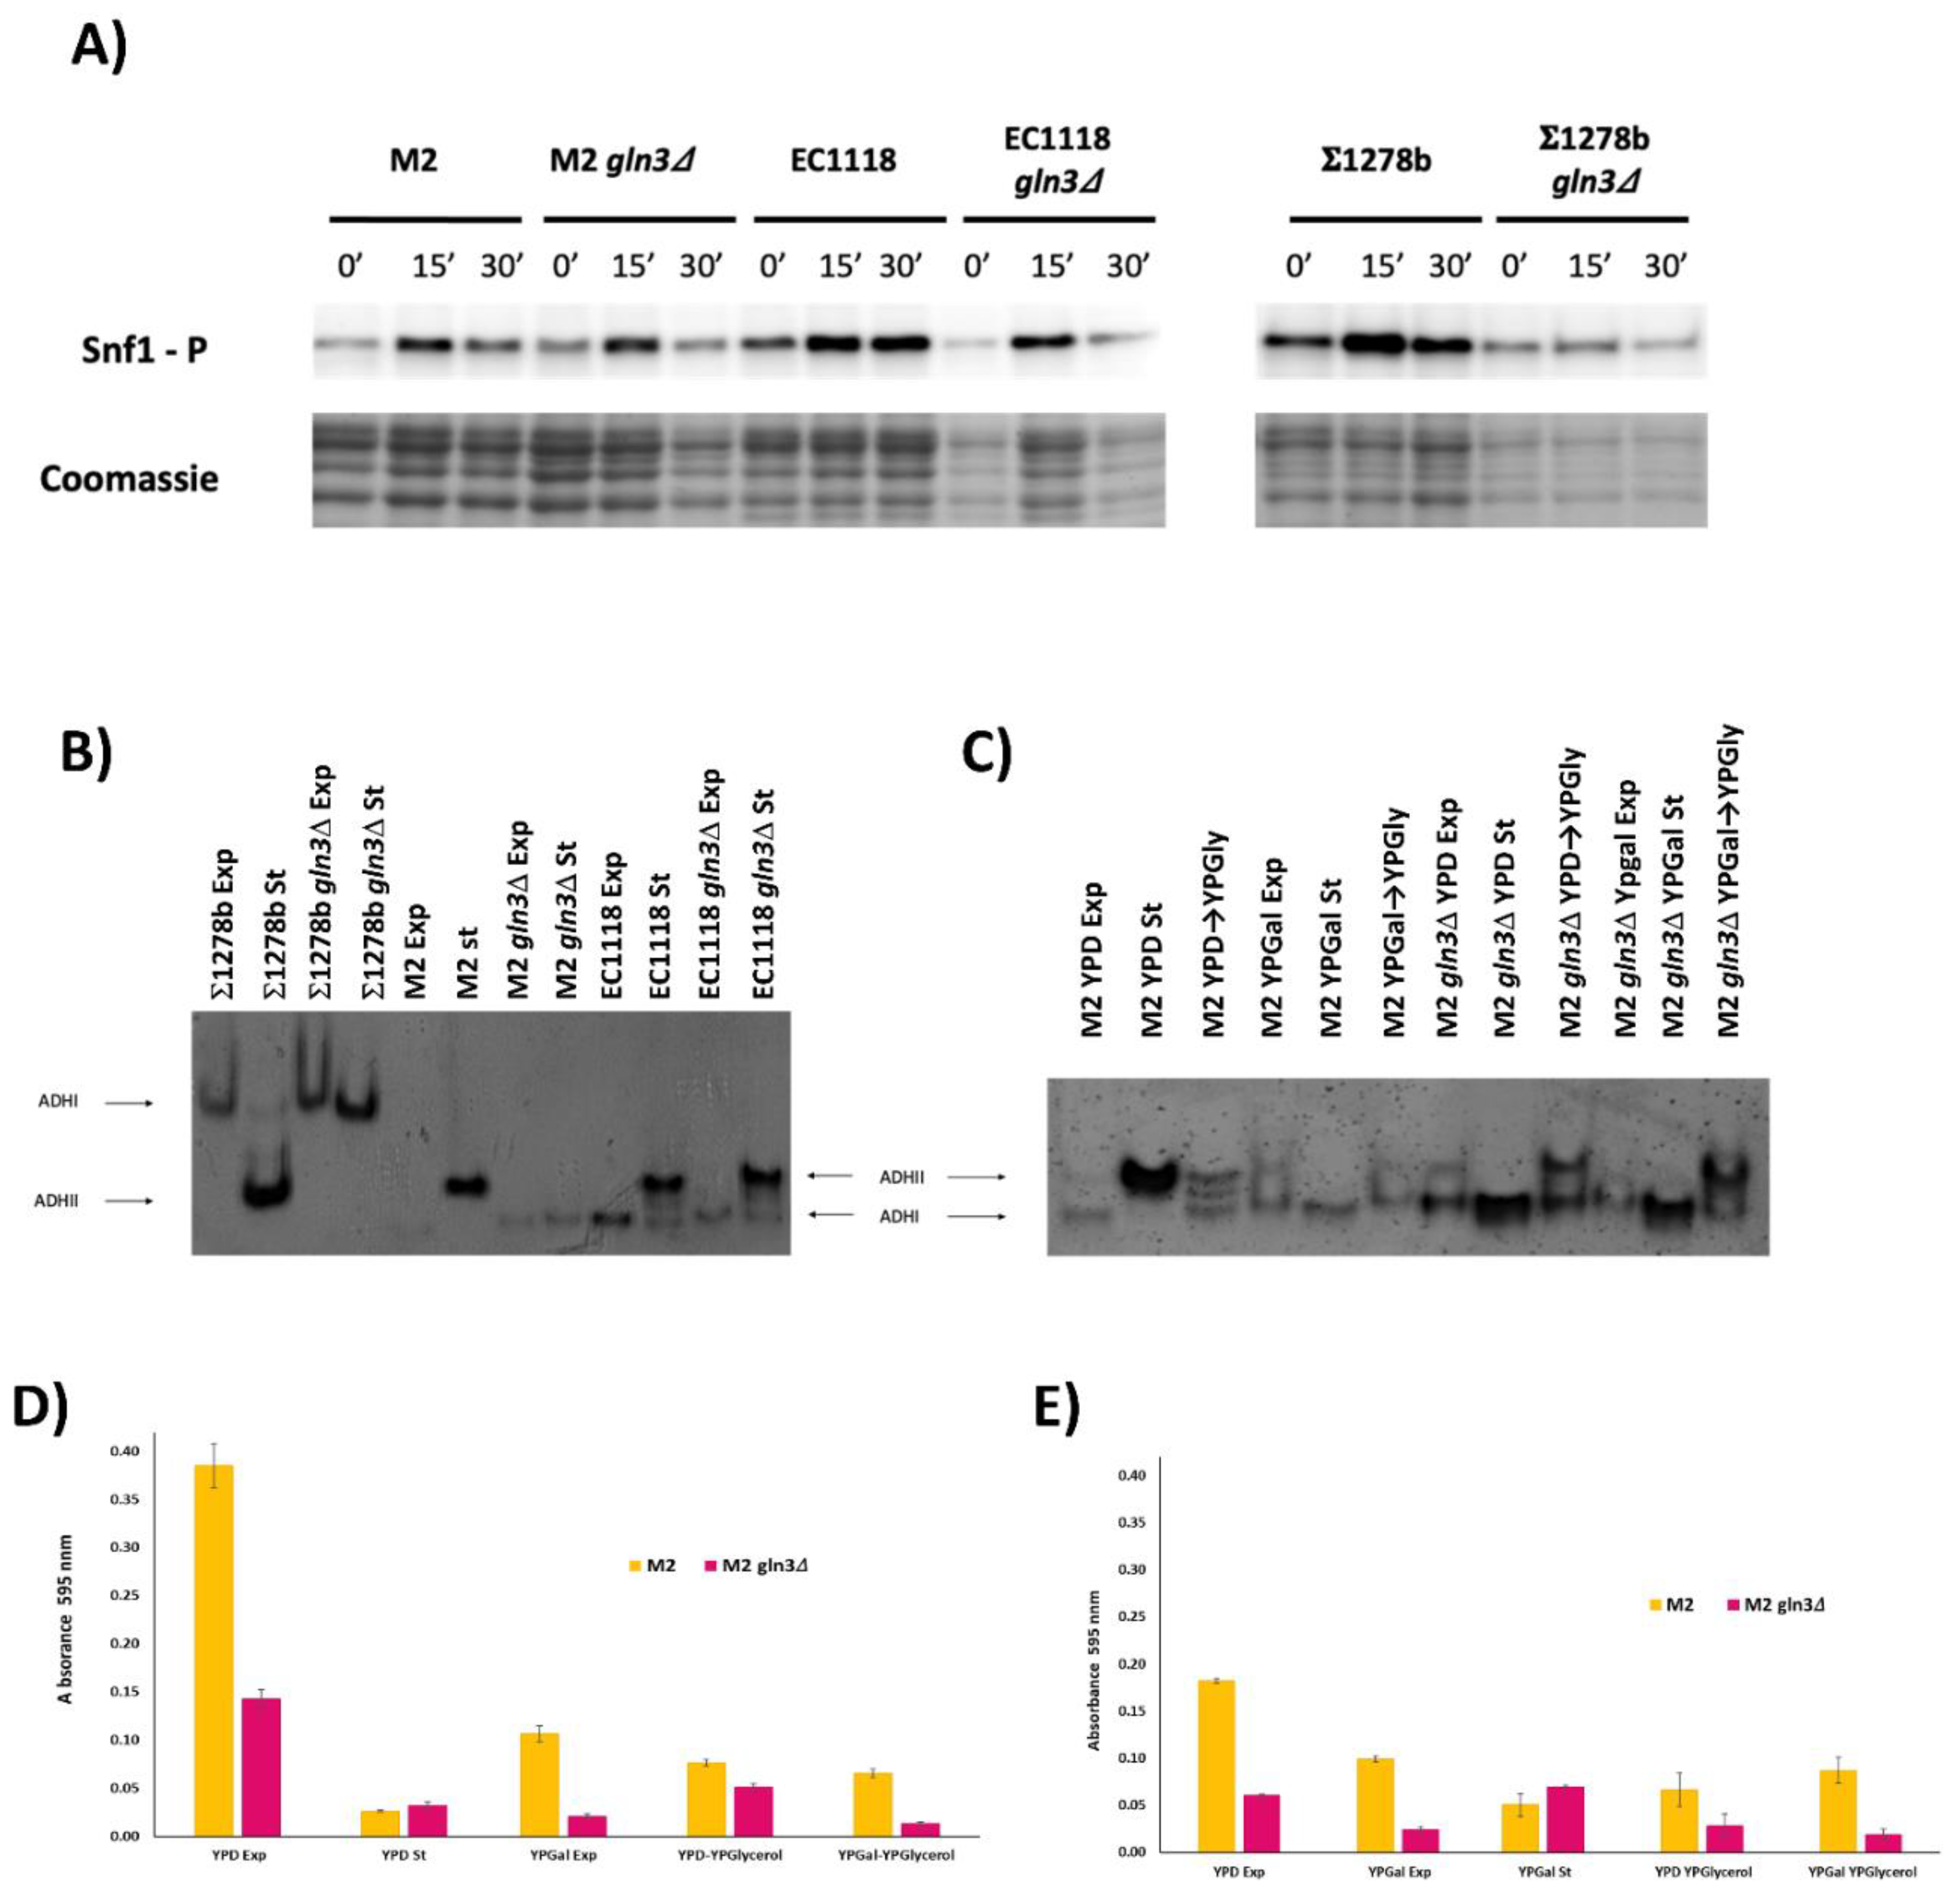
To further characterize the impact of GLN3 deletion on wine yeast metabolic regulation, molecular markers were studied (Figure 5). Snf1 kinase activation is required for full derepression of sugar-regulated genes, including respiration ones. That was followed using a specific antibody in our wine strains and in the laboratory strain 1278b, which also was unable to grow by respiration when GLN3 was deleted [9]. When cells are transferred from high to low glucose, Snf1 was rapidly phosphorylated and activated in all strains (Figure 5A). The phosphorylation peaked at 15 min and then it decreased. The gln3 mutants in both M2 and EC11118 strains have the same pattern, so there is no global regulation of the process from the early point of regulation, and Gln3 effect has to be more specific. Interestingly, the activation is reduced in the laboratory strain, so the behavior regarding this aspect is different in industrial strains, reinforcing the necessity to be characterized. A marker of glucose repression is alcohol dehydrogenase. Isoenzyme ADH2 is glucose repressed, and it is activated only when sugar concentration decreases (as it occurs in stationary phase), while ADH1 is used in fermentation conditions (as the exponential phase in YPD). A zymogram of ADH activity was done for the two industrial strains using 1278b strain as control (Figure 5B). A distinctive ADHII band appeared in stationary conditions in the wild-type strain M2, but this band failed to show in M2 gln3 fitting its inability for respiratory growth, while derepression in EC1118 was fine. So the lower part of the derepression pathway is affected by GLN3 deletion in M2 strain. A similar behavior is shown in laboratory strain, as expected. To try to dissect the degree of repression in M2 gln3, cells were grown in different media and subjected to derepression. When the mutant is grown in YPD (glucose) and shifted to YPGlycerol, there is a sign of partial derepression (Figure 5C), so there is not an intrinsic inability to express ADH2 in this strain. When grown in galactose, the wild type shows both bands, indicating an intrinsic derepression, while the mutant has only ADHI. However, when shifted to glycerol from galactose, induction of ADHII is clear again for both strains. Therefore, the effect of GLN3 deletion is targeted to specific conditions and genes and does not seem to be a general effect on ADH2 promoter expression.
To test respiration directly, the activity of the electron transport chain was measured by reduction of the MTT probe (Figure 5D,E). A preculture in YPD was used to inoculate various media (Figure 5D). GLN3 deletion in M2 causes a decrease of mitochondrial activity in cells growing exponentially in YPD, but not in the stationary phase. A similar reduction is seen when cells are growing in galactose, and when cells are shifted to glycerol from exponentially growing cells in glucose and galactose (more evident in the latter). When the preculture is made in YPGalactose (Figure 5E), again, GLN3 deletion reduces mitochondrial activity in exponentially grown cells in YPD and YPGalactose. When the culture in YPGalactose reaches the stationary phase, such difference disappears again. Change to glycerol again retains the difference. So, Gln3 has an impact on mitochondrial activity in many growth conditions.
3.4. Role of GLN3 in Winemaking Conditions
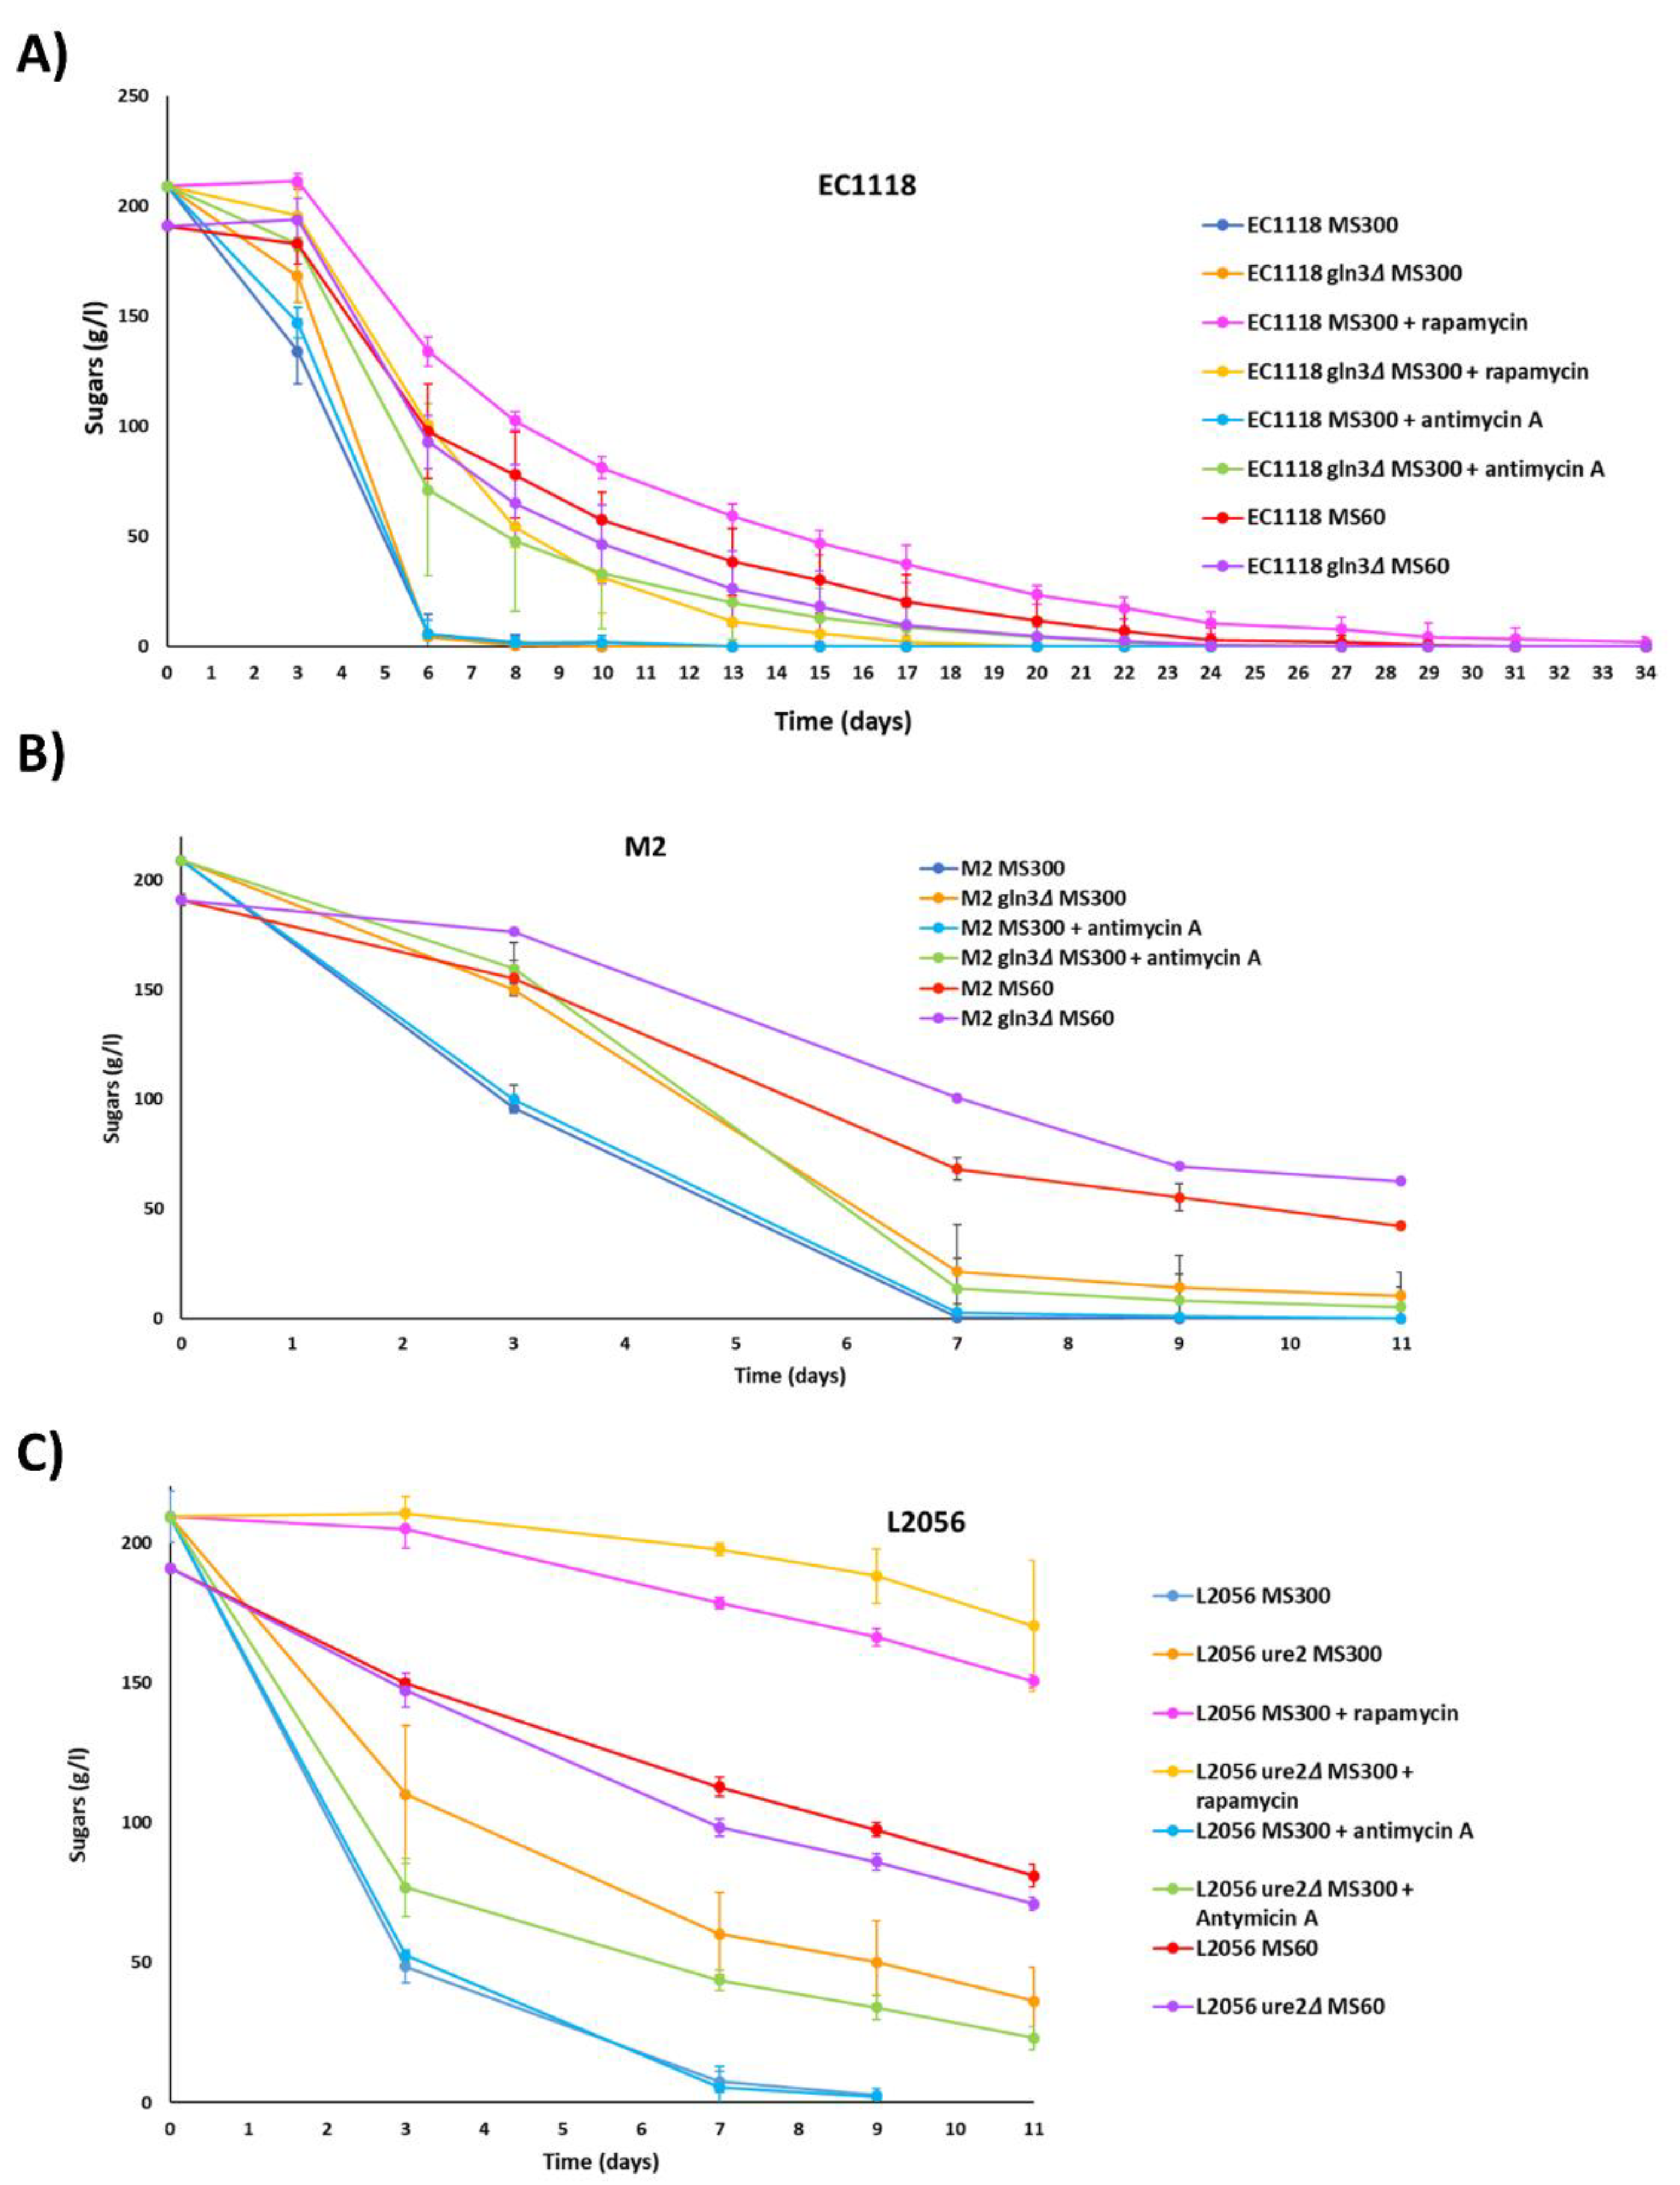
Next, the impact of GLN3 deletion was tested in winemaking conditions by conducting minivinifications of synthetic grape juice (Figure 6), which allows the change in media composition regarding nitrogen. The standard synthetic grape juice had 300 mg/L of assimilable nitrogen (MS300) while the limiting one had 60 mg/L (MS60). In addition, rapamycin and antimycin A was added to MS300 to follow the impact of such inhibitors. First, strain EC1118 was tested. Fermentation was followed by measuring sugar consumption (Figure 6A). GLN3 deletion causes a minor delay at short times in MS300, but the fermentation finished rapidly. In the wild type, antimycin A does not have a significant impact on fermentation, indicating that in those fully fermentative conditions, respiration may not be very relevant. However, there is a significant delay in fermentation when antimycin A is added to the EC1118 gln3 mutant, indicating an alteration in mitochondrial activity caused by GLN3 deletion. Rapamycin has a massive impact on the advance of fermentation, indicating that TORC1 is key for cellular growth and proliferation, as expected. EC1118 gln3 is more tolerant to rapamycin, as seen in laboratory media, so the relevance of Gln3 in controlling metabolism in a TORC1-mediated way is conserved during vinification. As expected, fermentation at limiting nitrogen is delayed in the wild type and in a similar way in the mutant. The production of ethanol, glycerol and acetic acid after finishing fermentation was not significantly altered (data not shown). To get some information about nitrogen metabolism, amino acid concentration in the media was measured at the beginning of fermentation (Supplementary Figure S2). In the rich medium, the MS300 wild-type strain consumes more than half amino acids at day 3 and then the consumption speed slowed down, suggesting an excess of amino acids. EC1118 gln3 strain showed a similar pattern, so there is no need for this transcription factor to activate the bulk of amino acid transport. Limiting grape juice MS60 showed a rapid depletion of the scarce amino acids to a residual level. Again, GLN3 deletion does not alter this pattern. Antimycin A does not alter this particular metabolic aspect, but rapamycin does it, as expected. Again EC1118 gln3 mutant performs better, indicating a better amino acid assimilation.
The behavior of M2 and M2 gln3 strains was followed in the same conditions (Figure 6B). In this case, GLN3 deletion has a more prominent impact on the advance on fermentation, delaying its completion. Again, the mutation is more relevant in this genetic background. The impact in this case of antimycin A is negligible for both strains. Again, GLN3 mutation delays fermentation in nitrogen limiting grape must MS60. As it happened with the EC1118 strain, rapamycin causes a big upset that is relieved by GLN3 deletion (Supplementary Figure S3), indicating that the functions related to TORC1 are conserved among strains. Regarding the amino acid profile (Supplementary Figure S2), the pattern under MS60 growth and rapamycin and antimycin A is similar to EC1118 background, but the impact of GLN3 deletion in MS300 is more apparent. Wild type M2 strain consumes most amino acids very fast, although those increase later (maybe due to export or partial cell lysis). M2 gln3 is clearly delayed in this aspect, so again, Gln3 is more relied upon in this genetic background to achieve full amino acid import.
Regarding URE2 deletion (Figure 6C), it slows down fermentation in MS300. Despite being a repressor of Gln3 function, it does not have the opposite role, probably due to the high number of targets involved that have to be regulated in a balanced way. Antimycin A, in this case, improves the function of the mutant, so it alleviates some of the negative aspects of such mutations that are be related to mitochondrial function. Rapamycin impact on fermentation is worse in the ure2 strain, so in this regard, the mutation is indeed opposite to the GLN3 deletion. Finally, in poor MS60 URE2 deletion improves fermentation as expected. In terms of amino acid transport, surprisingly, URE2 deletion mutant behaves in a similar way to its parental strain in all conditions tested (Supplementary Figure S2).
3.5. GLN3 Relevance in Nitrogen Metabolism in Industrial Wine Yeasts
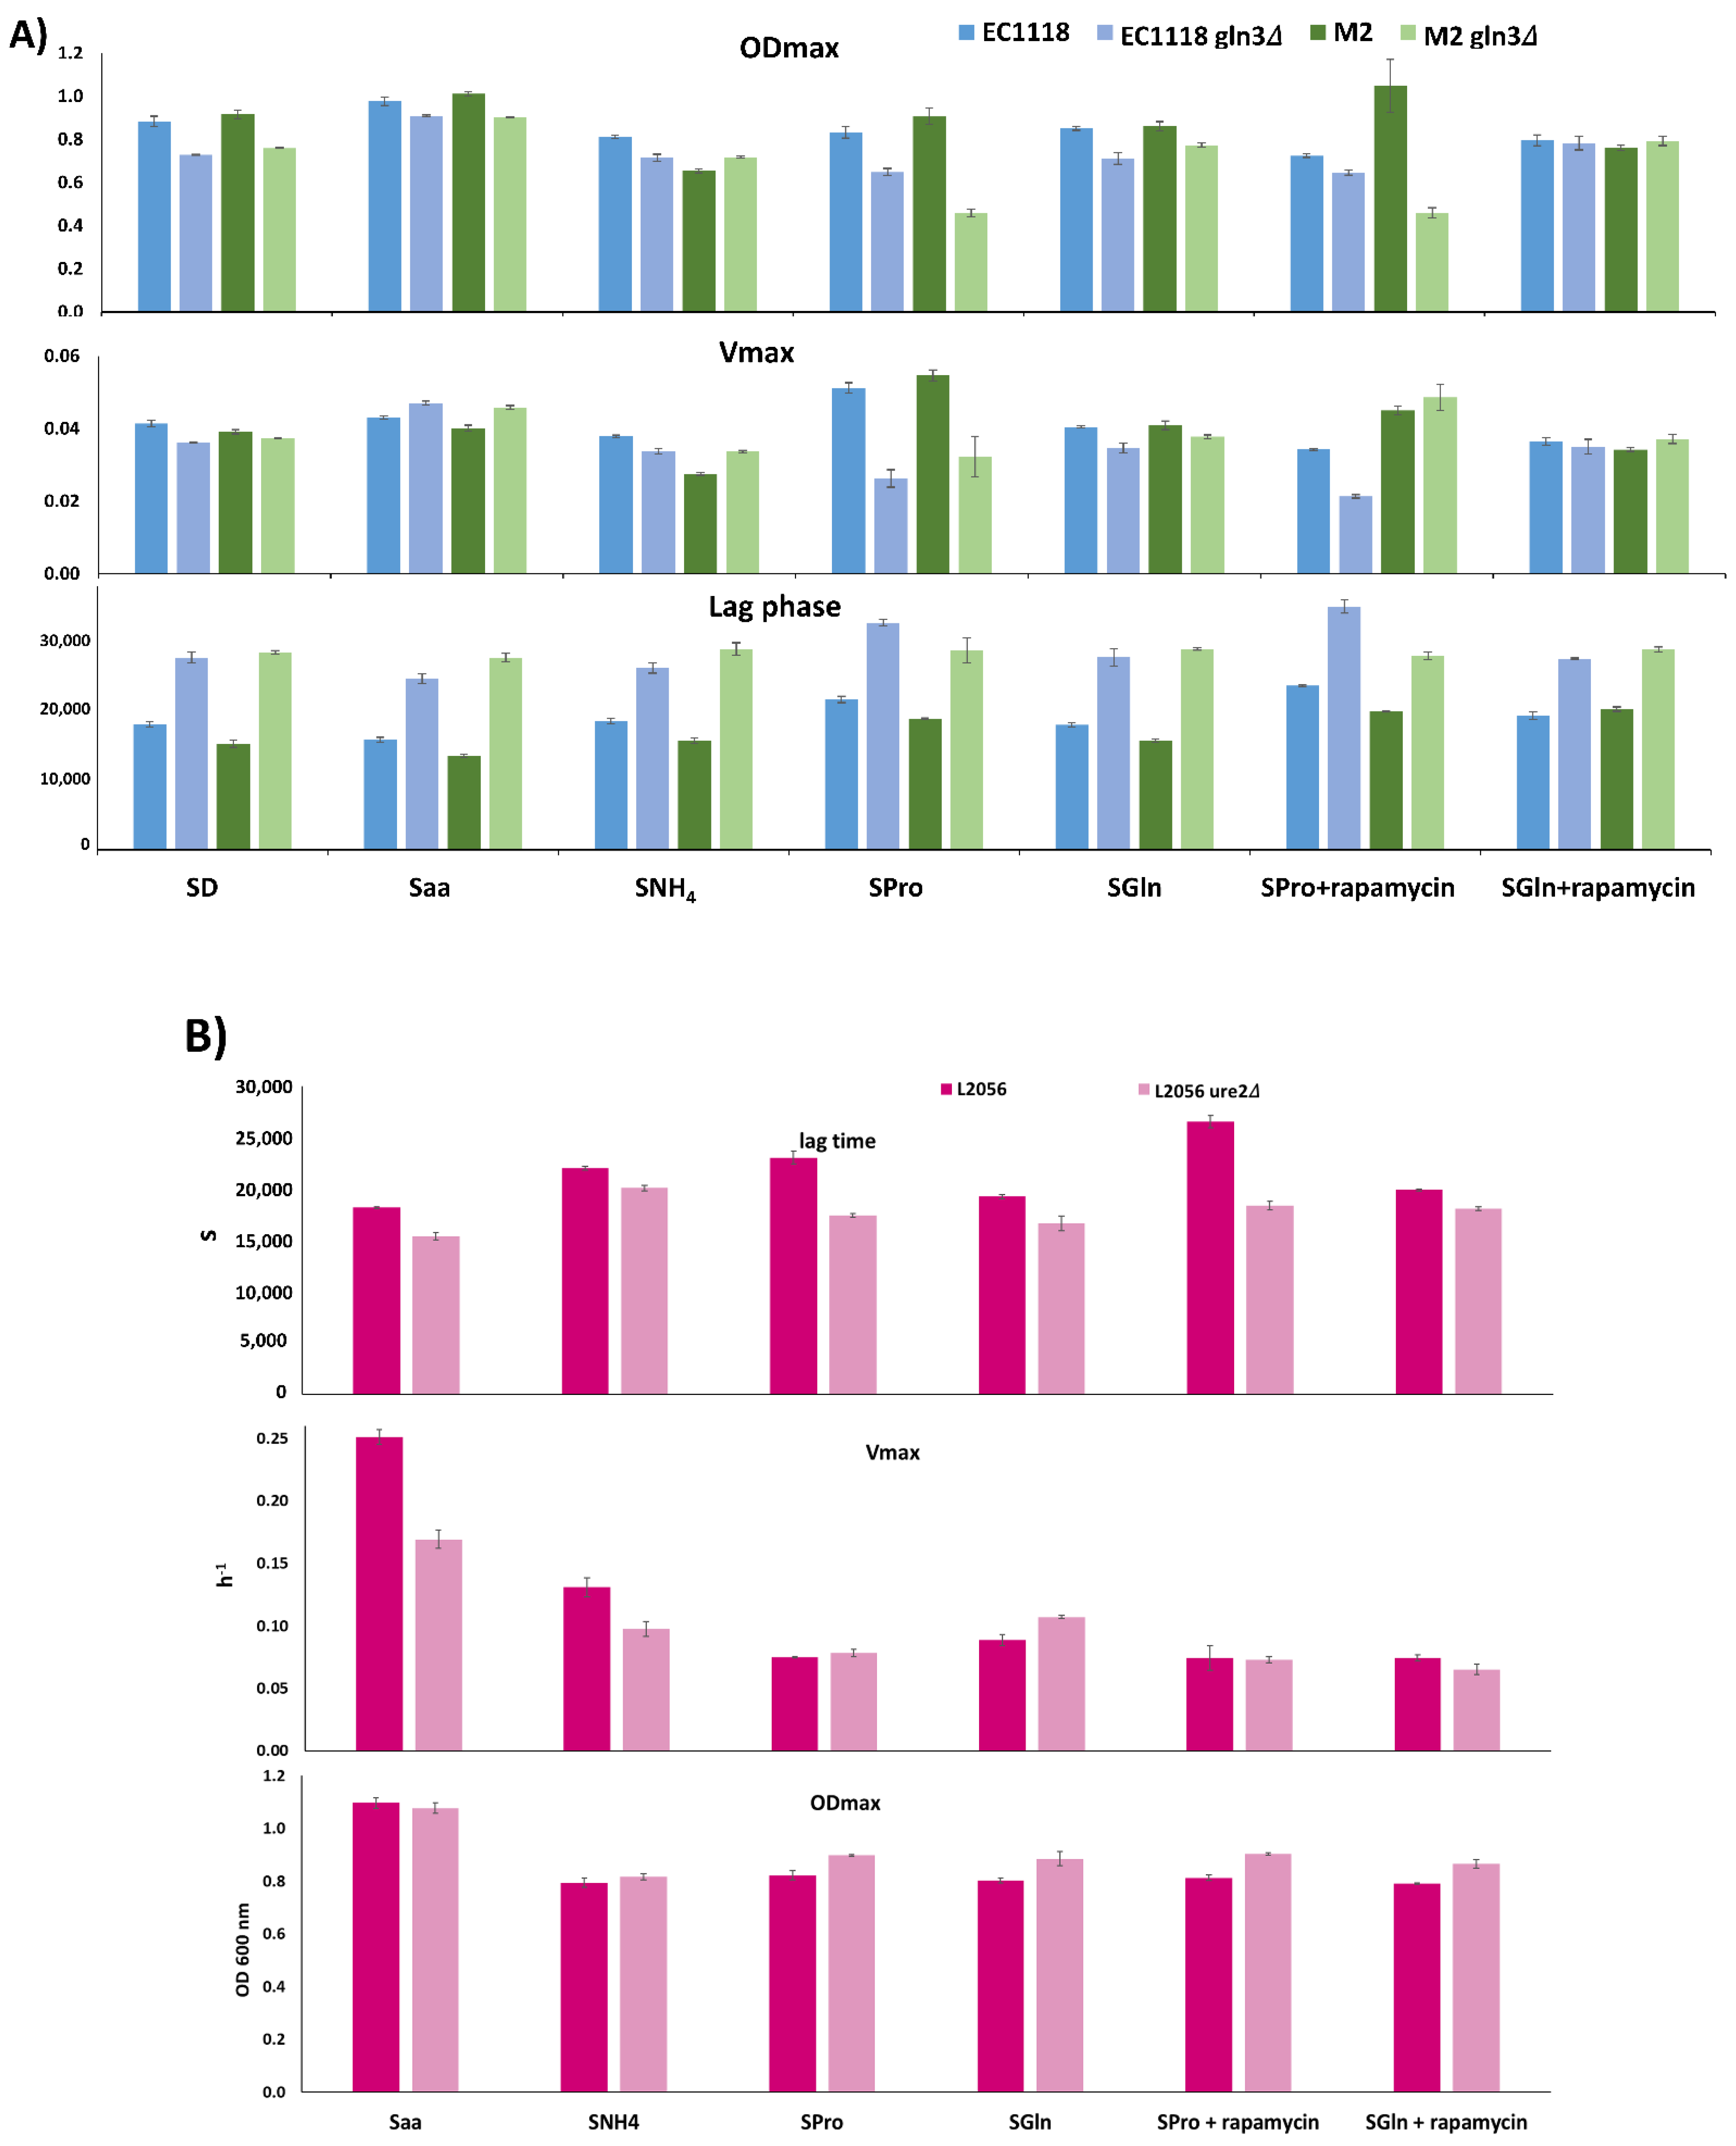
GLN3 functions regarding TORC1 activity in wine yeast and in winemaking conditions are consistent with their known role in nitrogen metabolism. Growth curves with different nitrogen sources were made in minimal medium and kinetic parameters were obtained to better understand its role regarding specific nitrogen sources (Figure 7). Reference minimal medium SD contains 0.5% ammonium sulfate. In this medium, the lag phase was delayed and the maximum OD600 was decreased in the mutant strains for both genetic backgrounds, M2 and EC1118, while Vmax was basically unaffected. So in ammonium, Gln3 is relevant to resume growth and reach stationary phase, but not so relevant for steady growth.
Next, another two unique nitrogen sources were tested. Glutamine is considered a rich, nitrogen repression inducing source, while proline is a poor nitrogen source that triggers Gln3 activity. Results in glutamine are similar to SD, the expected for a rich nitrogen source. However, proline has a bigger impact for both mutant strains, particularly at the Vmax. Therefore, Gln3 is required to fully assimilate proline as a nitrogen source. Rapamycin shuts off TORC1 complex and its effects were followed in proline and glutamine containing media. Rapamycin eliminates the differences caused by GLN3 deletion in ODmax and Vmax in glutamine, so part of the effect of the mutation is TORC1-dependent. Proline-grown EC1118/EC1118 gln3 do not change when ratios when exposed to rapamicyn, suggesting that proline is not fully activating TORC1. However, Vmax was increased in M2 gln3, as if TORC1 was causing growth problems in a Gln3 mediated way. Finally, synthetic media with 300 mg of assimilable nitrogen (like synthetic must MS300) in the form of just amino acids (Saa) or just ammonia (SNH4) were tested to check the potential contributions of the nitrogen source of musts. GLN3 mutations increase Vmax in both backgrounds, suggesting that biosynthesis is more deleterious to the cell than importing all the amino acids from the medium, a situation that may be relevant for a rich environment like grape juice. The reduced amount of nitrogen in SNH4 is not relevant for the EC1118/EC1118 gln3 pair compared to SD, but M2 gln3 has a relative increase of Vmax and ODmax, so both strains show different sensitivities to ammonia that may be at the core of nitrogen requirements for both strains.
Regarding Ure2 (Figure 7B), their influence is lower on average. Surprisingly its deletion improves not only growth in proline, as expected, but also a slight increase in Vmax and ODmax in glutamine, indicating that alleviating NCR is good whatever the input. The same pattern is seen in ammonium. However, when grown in a mix of amino acids, URE2 deletion improves lag time, but it has no impact on the final ODmax and reduces Vmax. So, in a complex situation (as the one seen on industrial growth media), the presence of a regulator like Ure2 may be required for optimal growth. Rapamycin presence reduces the difference in Vmax in glutamine, suggesting that the described positive effect was TORC1 mediated, but Ure2-independent.
4. Discussion
The mechanisms of yeast metabolic adaptations are complex and poorly characterized in industrial yeasts during biotechnological conditions, but it is an issue that has to be tackled to improve yeast industrial performance. A limitation for such a study is that there is not a reference industrial strain, not even a reference wine yeast. In the studies of respiration and glucose repression, wine yeasts offer a broad variability, with extreme behaviors that are more distant than yeasts used for other purposes, like bread or chicha making (Figure 1 and Figure 2, and Supplementary Figure S1). A positive aspect is that what we learn from wine strains may be useful to improve the performance of yeasts in other food-making processes. The mentioned phenotypic variability reinforces the idea that the right yeast has to be chosen for each specific process and that conditions have to be adapted for each strain. The latter is more difficult to be carried out in an industry with increasingly standardized protocols. The fact that wine yeast starters have to be propagated in sucrose-rich molasses with high respiration, to be later used in a low oxygen environment, such as grape juice fermentation, just increases the complexity of the overall performance of a selected yeast. Inhibition of respiration by antimycin A does not impact greatly on wine fermentation (Figure 5) or initial growth on many fermentable sugars (Supplementary Table S1) but it is required to achieve maximum biomass production. However, some strains are more sensitive than others, and stopping respiration improves EC1118 strain growth (Figure 1). EC1118 showed an extreme behavior regarding other carbon-related phenotypes, like glucose repression (Figure 2), suggesting a particular genetic background regarding these events. EC1118 is a widely used strain that belongs to a subset of wine yeasts known as the Prise de Mousse clade (PdM, for being strain suited to perform sparkling wine fermentations) [32]. Those are genetically very similar strains that share the same recent common origin, although there is not a single common feature that could be considered exclusive of that clade. Industrial strains contain genes or chromosomal regions that are exclusive of some strains [32]. EC1118 was the first wine yeast to be completely sequenced [33] and three unique large chromosomal regions were found (caused in part by horizontal transfer). However, those are not exclusive of the clade and are found scattered along many other wine strains [32]. According to Novo et al. (2009), none of those regions were found, for instance, in strains L2056 and 71B, but all of them are in T73, so there is not an easy correlation with the phenotype showed by these strains under different conditions and those specific regions. M2 has no any of these regions either [32]. None of the regions contains a gene easily linked to metabolic control. Therefore, there is a long way to be able to link the increasing number of sequences obtained from industrial yeasts to specific phenotypes, and further work has to be done to clarify those phenotypes, like the one to study nitrogen requirements by studying quantitative trait loci (QTL) [34].
The bulk of this study is based on the analysis of the Gln3 transcription factor. This is a key factor in metabolic regulation, as it is involved both in nitrogen and carbon metabolism, being regulated by both nitrogen-induced TORC1 complex and carbon catabolite derepressing kinase Snf1. Many previous works have focused in the Gln3 repressor Ure2 to improve wine yeasts [35,36,37,38], mainly by improving the assimilation of poor nitrogen sources, such as proline. Here we aimed to analyze systematically GLN3 function by deleting it in two commercial wine strains with different behavior, M2 and EC1118. The GLN3 deletion mutants had the expected role in some aspects, mainly the ones related to nitrogen and TORC1 regulation. For instance, they are more tolerant to TORC1 inhibition by rapamycin during winemaking conditions (Figure 6), and they grow worse with a poor nitrogen source like proline (Figure 7). However, the effect of the mutation is background-dependent when it comes to carbon metabolism. M2 gln3 is unable to grow by respiration and shows complete glucose repression by 2-deoxyglucose that the EC1118 counterpart does not suffer (Figure 3), and its impact in wine fermentation is bigger too (Figure 6). We previously found that GLN3 deletion impaired respiration in laboratory strain 1278b but not in reference to S288c genetic background [9], so this elusive phenotype is not linked to industrial strains per se. Comparison of sequences of NCR-related genes in the databases did not reveal a distinctive pattern linked to this phenotype (data not shown). In the absence of Gln3, differences in Gat1 function and regulation can become more apparent, and although previous works indicated that Gat1 role in winemaking is smaller [9], that has to be carefully studied in the future. The real molecular causes behind the impact of Gln3 in carbon metabolism have to be clarified. In this paper, we showed that there is not a global alteration in glucose repression via Snf1 due to lack of activation (Figure 5A), so probably a reduced subset of molecular targets are affected. Glucose repressible Adh2 expression is blocked in the mutant in the stationary phase, but induction is possible when transferred to glycerol (Figure 5C), although cells are unable to grow in it. Therefore, the lack of regulation of glucose repression is partial. Transcriptomic global analysis indicates that Gln3 is a positive transcriptional activator of ADH2 gene [39], although detailed analysis of ADH2 promoters suggest the bulk of its regulation is made by other transcription factors, such as Adr1 [40]. An indirect effect of GLN3 deletion acting on more specific activators cannot be ruled out. That would explain the fact that we have detected decreased mitochondrial activity that may contribute to the phenotype (Figure 5D and 5E). A detailed global analysis at different levels is required in the future to pinpoint the molecular targets of GLN3 in those specific backgrounds. URE2 deletion has no phenotype in respiration, but it does increase glucose repression (Figure 5). Therefore, both functions of Gln3 could be differently regulated. Deletion of URE2 and GLN3 give opposite phenotypes regarding TORC1 inhibition by rapamycin, so those carbon-related events probably are not regulated by TORC1. It may seem surprising that deletion of GLN3 and URE2 have similar, not opposite, phenotypes regarding glucose repression, but this is shared by other events, like pseudohyphal growth [41].
5. Conclusions
The mechanisms involved in glucose repression in industrial yeasts, particularly wine yeasts, are complex and may influence their performance under biotechnological conditions. Transcription factor Gln3 is at the crossroads between respiration, glucose repression, and nitrogen repression, so it is a protein worth studying to better understand the fine-tuning adaptation to environmental changes.
Supplementary Materials
The following are available online at https://0-www-mdpi-com.brum.beds.ac.uk/article/10.3390/fermentation7030181/s1, Table S1. Kinetic parameters of S. cerevisiae strains under different growing conditions. Figure S1. Growth curves of industrial wine yeasts in YPD, YPS, and YPGal, plus with the indicated inhibitor. Figure S2. Quantification of alpha-amino acids of the vinifications described in Figure 6. Figure S3. MS300 synthetic grape juices fermentation of M2 and M2 gln3 strains in the presence of 200 nM rapamycin. Conditions as in Figure 6.
Author Contributions
Conceptualization, A.A. and E.M.; investigation, A.F.-P., V.G. and A.A.; resources, E.M. and A.A.; writing—original draft preparation, A.A.; writing—review and editing, A.F.-P., V.G., E.M., and A.A.; project administration, E.M.; funding acquisition, E.M. and A.A. All authors have read and agreed to the published version of the manuscript.
Funding
This work was funded by a grant from the Spanish Ministry of Science (AGL2017-83254-R) to E.M. and A.A. V.G. has Generalitat Valenciana fellowship ACIF/2020/122.
Institutional Review Board Statement
Not applicable.
Informed Consent Statement
Not applicable.
Data Availability Statement
Not aplicable.
Conflicts of Interest
The authors declare no conflict of interest.
References
- Matallana, E.; Aranda, A. Biotechnological impact of stress response on wine yeast. Lett. Appl. Microbiol. 2016. [Google Scholar] [CrossRef] [PubMed] [Green Version]
- Kessi-Perez, E.I.; Molinet, J.; Martinez, C. Disentangling the genetic bases of Saccharomyces cerevisiae nitrogen consumption and adaptation to low nitrogen environments in wine fermentation. Biol. Res. 2020, 53, 2. [Google Scholar] [CrossRef] [PubMed]
- García-Ríos, E.; Guillamón, J.M. Mechanisms of yeast adaptation to wine fermentations. Prog. Mol. Subcell. Biol. 2019, 58, 37–59. [Google Scholar] [CrossRef] [PubMed]
- Gobert, A.; Tourdot-Maréchal, R.; Sparrow, C.; Morge, C.; Alexandre, H. Influence of nitrogen status in wine alcoholic fermentation. Food Microbiol. 2019, 83, 71–85. [Google Scholar] [CrossRef] [PubMed]
- Conrad, M.; Schothorst, J.; Kankipati, H.N.; Van Zeebroeck, G.; Rubio-Texeira, M.; Thevelein, J.M. Nutrient sensing and signaling in the yeast Saccharomyces cerevisiae. FEMS Microbiol. Rev. 2014, 38, 254–299. [Google Scholar] [CrossRef] [Green Version]
- Piskur, J.; Rozpedowska, E.; Polakova, S.; Merico, A.; Compagno, C. How did Saccharomyces evolve to become a good brewer? Trends Genet. 2006, 22, 183–186. [Google Scholar] [CrossRef] [PubMed]
- Pérez-Torrado, R.; Gamero, E.; Gómez-Pastor, R.; Garre, E.; Aranda, A.; Matallana, E. Yeast biomass, an optimised product with myriad applications in the food industry. Trends Food Sci. Technol. 2015, 46, 167–175. [Google Scholar] [CrossRef]
- Meneses, F.J.; Henschke, P.A.; Jiranek, V. A Survey of industrial strains of Saccharomyces cerevisiae reveals numerous altered patterns of maltose and sucrose utilisation. J. Inst. Brew. 2002, 108, 310–321. [Google Scholar] [CrossRef]
- Vallejo, B.; Peltier, E.; Garrigós, V.; Matallana, E.; Marullo, P.; Aranda, A. Role of Saccharomyces cerevisiae nutrient signaling pathways during winemaking: A phenomics approach. Front. Bioeng. Biotechnol. 2020. [Google Scholar] [CrossRef]
- Beier, D.R.; Sledziewski, A.; Young, E.T. Deletion analysis identifies a region, upstream of the ADH2 gene of Saccharomyces cerevisiae, which is required for ADR1-mediated derepression. Mol. Cell Biol 1985, 5, 1743–1749. [Google Scholar] [CrossRef] [Green Version]
- De Virgilio, C. The essence of yeast quiescence. FEMS Microbiol. Rev. 2012, 36, 306–339. [Google Scholar] [CrossRef] [PubMed] [Green Version]
- Vallejo, B.; Matallana, E.; Aranda, A. Saccharomyces cerevisiae nutrient signaling pathways show an unexpected early activation pattern during winemaking. Microb. Cell Fact. 2020. [Google Scholar] [CrossRef]
- Bertram, P.G.; Choi, J.H.; Carvalho, J.; Chan, T.F.; Ai, W.; Zheng, X.F. Convergence of TOR-nitrogen and Snf1-glucose signaling pathways onto Gln3. Mol. Cell Biol. 2002, 22, 1246–1252. [Google Scholar] [CrossRef] [Green Version]
- Grijalva-Vallejos, N.; Aranda, A.; Matallana, E. Evaluation of yeasts from Ecuadorian chicha by their performance as starters for alcoholic fermentations in the food industry. Int. J. Food Microbiol. 2020, 317, 108462. [Google Scholar] [CrossRef]
- Guldener, U.; Heck, S.; Fielder, T.; Beinhauer, J.; Hegemann, J.H. A new efficient gene disruption cassette for repeated use in budding yeast. Nucleic Acids Res. 1996, 24, 2519–2524. [Google Scholar] [CrossRef] [Green Version]
- Delneri, D.; Tomlin, G.C.; Wixon, J.L.; Hutter, A.; Sefton, M.; Louis, E.J.; Oliver, S.G. Exploring redundancy in the yeast genome: An improved strategy for use of the cre-loxP system. Gene 2000, 252, 127–135. [Google Scholar] [CrossRef]
- Generoso, W.C.; Gottardi, M.; Oreb, M.; Boles, E. Simplified CRISPR-Cas genome editing for Saccharomyces cerevisiae. J. Microbiol. Methods 2016, 127, 203–205. [Google Scholar] [CrossRef] [PubMed]
- Gietz, R.D.; Woods, R.A. Transformation of yeast by lithium acetate/single-stranded carrier DNA/polyethylene glycol method. Methods Enzym. 2002, 350, 87–96. [Google Scholar]
- Adams, A.; Kaiser, C.; Cold Spring Harbor Laboratory. Methods in Yeast Genetics: A Cold Spring Harbor Laboratory Course Manual, 1997th ed.; Cold Spring Harbor Laboratory Press: Plainview, NY, USA, 1998; ISBN 0879695080. [Google Scholar]
- Riou, C.; Nicaud, J.M.; Barre, P.; Gaillardin, C. Stationary-phase gene expression in Saccharomyces cerevisiae during wine fermentation. Yeast 1997, 13, 903–915. [Google Scholar] [CrossRef]
- Viana, T.; Loureiro-Dias, M.C.; Prista, C. Efficient fermentation of an improved synthetic grape must by enological and laboratory strains of Saccharomyces cerevisiae. AMB Express 2014, 4, 1–9. [Google Scholar] [CrossRef] [PubMed] [Green Version]
- Robyt, J.F.; Whelan, W.J. Reducing value methods for maltodextrins. I. Chain-length dependence of alkaline 3,5-dinitrosalicylate and chain-length independence of alkaline copper. Anal. Biochem. 1972, 45, 510–516. [Google Scholar] [CrossRef]
- Dukes, B.C.; Butzke, C.E. Rapid determination of primary amino acids in grape juice using an o-phthaldialdehyde/N-acetyl-L-cysteine spectrophotometric Assay. Am. J. Enol. Vitic. 1998, 49, 125–134. [Google Scholar]
- Sánchez, N.S.; Königsberg, M. Using yeast to easily determine mitochondrial functionality with 1-(4,5-dimethylthiazol-2-yl)-3,5-diphenyltetrazolium bromide (MTT) assay. Biochem. Mol. Biol. Educ. Bimon. Publ. Int. Union Biochem. Mol. Biol. 2006, 34, 209–212. [Google Scholar] [CrossRef] [PubMed]
- Márquez, I.G.; Ghiyasvand, M.; Massarsky, A.; Babu, M.; Samanfar, B.; Omidi, K.; Moon, T.W.; Smith, M.L.; Golshani, A. Zinc oxide and silver nanoparticles toxicity in the baker’s yeast, Saccharomyces cerevisiae. PLoS ONE 2018. [Google Scholar] [CrossRef]
- Orlova, M.; Barrett, L.; Kuchin, S. Detection of endogenous Snf1 and its activation state: Application to Saccharomyces and Candida species. Yeast 2008, 25, 745–754. [Google Scholar] [CrossRef] [PubMed]
- Williamson, V.M.; Bennetzen, J.; Young, E.T.; Nasmyth, K.; Hall, B.D. Isolation of the structural gene for alcohol dehydrogenase by genetic complementation in yeast. Nature 1980, 283, 214–216. [Google Scholar] [CrossRef]
- Fowler, P.W.; Ball, A.J.; Griffiths, D.E. The control of alcohol dehydrogenase isozyme synthesis in Saccharomyces cerevisiae. Can. J. Biochem. 1972, 50, 35–43. [Google Scholar] [CrossRef]
- Perez-Samper, G.; Cerulus, B.; Jariani, A.; Vermeersch, L.; Barrajón Simancas, N.; Bisschops, M.M.M.; van den Brink, J.; Solis-Escalante, D.; Gallone, B.; De Maeyer, D.; et al. The crabtree effect shapes the Saccharomyces cerevisiae lag phase during the switch between different carbon sources. MBio 2018. [Google Scholar] [CrossRef] [Green Version]
- Huber, A.; Bodenmiller, B.; Uotila, A.; Stahl, M.; Wanka, S.; Gerrits, B.; Aebersold, R.; Loewith, R. Characterization of the rapamycin-sensitive phosphoproteome reveals that Sch9 is a central coordinator of protein synthesis. Genes Dev. 2009, 23, 1929–1943. [Google Scholar] [CrossRef] [Green Version]
- Xie, M.W.; Jin, F.; Hwang, H.; Hwang, S.; Anand, V.; Duncan, M.C.; Huang, J. Insights into TOR function and rapamycin response: Chemical genomic profiling by using a high-density cell array method. Proc. Natl. Acad. Sci. USA 2005, 102, 7215–7220. [Google Scholar] [CrossRef] [Green Version]
- Borneman, A.R.; Forgan, A.H.; Kolouchova, R.; Fraser, J.A.; Schmidt, S.A. Whole genome comparison reveals high levels of inbreeding and strain redundancy across the spectrum of commercial wine strains of Saccharomyces cerevisiae. G3 2016. [Google Scholar] [CrossRef] [Green Version]
- Novo, M.; Bigey, F.; Beyne, E.; Galeote, V.; Gavory, F.; Mallet, S.; Cambon, B.; Legras, J.L.; Wincker, P.; Casaregola, S.; et al. Eukaryote-to-eukaryote gene transfer events revealed by the genome sequence of the wine yeast Saccharomyces cerevisiae EC1118. Proc. Natl. Acad. Sci. USA 2009, 106, 16333–16338. [Google Scholar] [CrossRef] [PubMed] [Green Version]
- Brice, C.; Sanchez, I.; Bigey, F.; Legras, J.L.; Blondin, B. A genetic approach of wine yeast fermentation capacity in nitrogen-starvation reveals the key role of nitrogen signaling. BMC Genom. 2014, 15, 495. [Google Scholar] [CrossRef] [PubMed] [Green Version]
- Salmon, J.M.; Barre, P. Improvement of nitrogen assimilation and fermentation kinetics under enological conditions by derepression of alternative nitrogen-assimilatory pathways in an industrial Saccharomyces cerevisiae strain. Appl. Environ. Microbiol. 1998, 64, 3831–3837. [Google Scholar] [CrossRef] [PubMed] [Green Version]
- Deed, N.K.; van Vuuren, H.J.; Gardner, R.C. Effects of nitrogen catabolite repression and di-ammonium phosphate addition during wine fermentation by a commercial strain of S. cerevisiae. Appl. Microbiol. Biotechnol. 2011, 89, 1537–1549. [Google Scholar] [CrossRef]
- Tate, J.J.; Tolley, E.A.; Cooper, T.G. Sit4 and PP2A dephosphorylate nitrogen catabolite repression-sensitive Gln3 when TorC1 is up- as well as down-regulated. Genetics 2019. [Google Scholar] [CrossRef]
- Dufour, M.; Zimmer, A.; Thibon, C.; Marullo, P. Enhancement of volatile thiol release of Saccharomyces cerevisiae strains using molecular breeding. Appl. Microbiol. Biotechnol. 2013, 97, 5893–5905. [Google Scholar] [CrossRef]
- Reimand, J.; Vaquerizas, J.M.; Todd, A.E.; Vilo, J.; Luscombe, N.M. Comprehensive reanalysis of transcription factor knockout expression data in Saccharomyces cerevisiae reveals many new targets. Nucleic Acids Res. 2010, 38, 4768–4777. [Google Scholar] [CrossRef] [Green Version]
- Young, E.T.; Yen, K.; Dombek, K.M.; Law, G.L.; Chang, E.; Arms, E. Snf1-independent, glucose-resistant transcription of Adr1-dependent genes in a mediator mutant of Saccharomyces cerevisiae. Mol. Microbiol. 2009, 74, 364–383. [Google Scholar] [CrossRef]
- Lorenz, M.C.; Heitman, J. The MEP2 ammonium permease regulates pseudohyphal differentiation in Saccharomyces cerevisiae. EMBO J. 1998, 17, 1236–1247. [Google Scholar] [CrossRef] [Green Version]
Figure 1.
Mitochondrial activity has little effect on fermentative growth. Growth curves by OD600 measurement of selected strains grown in rich medium YPD with or without mitochondrial respiration inhibitor antimycin A. The average of three experiments is shown.
Figure 1.
Mitochondrial activity has little effect on fermentative growth. Growth curves by OD600 measurement of selected strains grown in rich medium YPD with or without mitochondrial respiration inhibitor antimycin A. The average of three experiments is shown.

Figure 2.
Wine yeasts have a variety of behaviors for glucose repression. Growth curves by OD600 measurement of selected strains grown in sucrose-containing medium YPS with or without 2-deoxyglucose. The average of three experiments is shown.
Figure 2.
Wine yeasts have a variety of behaviors for glucose repression. Growth curves by OD600 measurement of selected strains grown in sucrose-containing medium YPS with or without 2-deoxyglucose. The average of three experiments is shown.

Figure 3.
Gln3 has a distinctive role in respiration and glucose repression in some commercial wine strains. Spot analysis in rich (A) and minimal (B) media in the presence of several metabolic inhibitors (for GLN3 deletion mutants EC1118 gln3 and M2 gln3 and for URE2 deletion mutant L2056 ure2 mutants and their parental strains. Serial dilutions were made and 5 µL dropped for each spot.

Figure 4.
Kinetic parameters of industrial strains carrying GLN3 and URE2 mutations grown in sucrose (YPS) galactose (YPGal) with inhibitors. (A) lag time, (B) maximum speed (Vmax), (C) maximum OD600 (ODmax).
Figure 4.
Kinetic parameters of industrial strains carrying GLN3 and URE2 mutations grown in sucrose (YPS) galactose (YPGal) with inhibitors. (A) lag time, (B) maximum speed (Vmax), (C) maximum OD600 (ODmax).

Figure 5.
Gln3 impacts at the molecular level. (A) Western blot analysis of phosphorylated Snf1 proteins from GLN3 deletion mutants in M2, EC1118, and 1278b strains (M2 gln3, EC1118 gln3, and 1278b gln3. Cells growing exponentially in YPD were changed to medium with 0.05% glucose and samples were taken at 15 and 30 min. Coomassie staining was used as the loading control. (B) Alcohol dehydrogenase zymogram. Samples from the same strains were collected in exponential (Exp) and stationary phases (St) of growth in YPD and stained for ADH activity. (C) Same as (B) with M2 and M2 gln3 under different growth conditions and carbon sources. Shifts from one carbon source to another were indicated by an arrow. Exponentially growing cells in the first medium are shifted to the second, and cells were incubated then for two more hours. (D) Respiratory activity measured by MTT reaction in the same conditions as panel (C) from a preculture in YPD. (E) same as panel (D) with a preculture in YPGalactose.

Figure 6.
Gln3 role in wine fermentation. Progress of fermentation is followed by measuring reducing sugars. High nitrogen must (MS300) and low nitrogen must (MS60) were used. In the MS300, rapamycin (200 nM) and antimycin A (3 mg/L) were added. (A) EC1118 and GLN3 deletion mutant EC1118 gln3 M2 and GLN3 deletion mutant M2 gln3 (C) L2046 and URE2 deletion mutant L2056 ure2.

Figure 7.
Gln3 impacts nitrogen assimilation in wine yeasts. (A) Kinetic parameters (ODmax, Vmax, and lag phase) obtained from GLN3 deletion mutants in EC1118 and M2 strains grown in minimal medium with a different nitrogen source. SD: standard minimal medium with = 0.5% ammonium sulfate, Saa (300 mg/L of assimilable nitrogen as amino acid mix), SNH4 (300 mg/L of assimilable nitrogen as ammonium chloride), SPro (0.5% proline as sole nitrogen source), SGln (0.5% glutamine as sole nitrogen source). Rapamycin was used at 200 nM. (B) Same for L2056 URE2 deletions strain.


Table 1.
Kinetic parameters of industrial strains grown in YPD and YPD+antimycin A. Maximum velocity (Vmax), maximum OD600 (ODmax), and lag time are shown. YPD+antimycin A/YPD ratios are also shown. Experiments were done in triplicate, Average (Av) and standard deviation (SD) is shown.
Table 1.
Kinetic parameters of industrial strains grown in YPD and YPD+antimycin A. Maximum velocity (Vmax), maximum OD600 (ODmax), and lag time are shown. YPD+antimycin A/YPD ratios are also shown. Experiments were done in triplicate, Average (Av) and standard deviation (SD) is shown.
| YPD | YPD + Antimycin A | ||||||||||||||
|---|---|---|---|---|---|---|---|---|---|---|---|---|---|---|---|
| Vmax | ODmax | Lag Time | Vmax | ODmax | Lag Time | Ratios | |||||||||
| Av | SD | Av | SD | Av | SD | Av | SD | Av | SD | Av | SD | Vmax MaxOD Lag | |||
| T73 | 0.219 | 0.046 | 1.150 | 0.024 | 11,710 | 269 | 0.259 | 0.009 | 1.060 | 0.057 | 15,720 | 442 | 1.18 | 0.82 | 1.34 |
| EC1118 | 0.184 | 0.007 | 0.989 | 0.016 | 17,705 | 417 | 0.218 | 0.007 | 1.112 | 0.024 | 16,570 | 438 | 1.18 | 1.12 | 0.94 |
| M2 | 0.330 | 0.009 | 1.077 | 0.008 | 14,807 | 247 | 0.287 | 0.024 | 1.017 | 0.064 | 15,413 | 1592 | 0.87 | 0.94 | 1.04 |
| L2056 | 0.293 | 0.040 | 1.084 | 0.022 | 14,597 | 1251 | 0.239 | 0.000 | 1.124 | 0.011 | 14,365 | 375 | 0.81 | 1.04 | 0.98 |
| 71B | 0.328 | 0.055 | 1.114 | 0.010 | 14,337 | 1070 | 0.254 | 0.005 | 0.940 | 0.005 | 16,920 | 57 | 0.77 | 0.84 | 1.18 |
| BQS252 | 0.175 | 0.031 | 0.930 | 0.018 | 21,755 | 375 | 0.141 | 0.003 | 0.902 | 0.003 | 22,670 | 693 | 0.81 | 0.97 | 1.04 |
| EYS5 | 0.275 | 0.010 | 1.092 | 0.038 | 14,390 | 1067 | 0.240 | 0.010 | 0.998 | 0.038 | 15,950 | 622 | 0.88 | 0.91 | 1.11 |
| ERS1 | 0.236 | 0.001 | 1.061 | 0.029 | 17,967 | 724 | 0.214 | 0.005 | 0.972 | 0.012 | 19,887 | 351 | 0.91 | 0.92 | 1.11 |
| Cinta Roja | 0.224 | 0.010 | 1.014 | 0.025 | 14,227 | 547 | 0.219 | 0.005 | 0.952 | 0.006 | 15,185 | 290 | 0.98 | 0.94 | 1.07 |
Table 2.
Kinetic parameters of industrial strains grown in YPS and YPS+2-deoxyglucose (non-metabolizable glucose analog). Maximum velocity (Vmax), maximum OD600 (ODmax), and lag time are shown. YPS+2-deoxyglucose /YPs ratios are also indicated. Experiments were done in triplicate. Average (Av) and standard deviation (SD) are shown.
| YPs | YPS + 2DG | ||||||||||||||
|---|---|---|---|---|---|---|---|---|---|---|---|---|---|---|---|
| Vmax | Max OD | Lag Time | Vmax | Max OD | Lag Time | Ratios | |||||||||
| Av | SD | Av | SD | Av | SD | Av | SD | Av | SD | Av | SD | Vmax MaxOD Lag | |||
| T73 | 0.24 | 0.0001 | 1.19 | 0.0071 | 9667 | 400 | 0.13 | 0.0001 | 1.02 | 0.0218 | 25,203 | 410 | 0.70 | 0.87 | 1.92 |
| EC1118 | 0.19 | 0.0034 | 1.04 | 0.0297 | 15,840 | 57 | 0.06 | 0.0037 | 0.48 | 0.0232 | 47,137 | 621 | 0.32 | 0.46 | 2.98 |
| M2 | 0.26 | 0.0076 | 1.25 | 0.0289 | 10,993 | 824 | 0.12 | 0.0078 | 0.91 | 0.0812 | 39,020 | 2365 | 0.46 | 0.73 | 3.55 |
| L2056 | 0.22 | 0.0067 | 1.17 | 0.0202 | 11,870 | 531 | 0.10 | 0.0040 | 0.79 | 0.0373 | 37,667 | 883 | 0.42 | 0.67 | 3.17 |
| 71B | 0.23 | 0.0039 | 1.13 | 0.0161 | 12,597 | 367 | 0.14 | 0.0016 | 0.87 | 0.0246 | 26,827 | 300 | 0.62 | 0.77 | 2.13 |
| BQS252 | 0.17 | 0.0026 | 1.16 | 0.0297 | 18,433 | 717 | 0.00 | 0.00 | 0.00 | ||||||
| EYS5 | 0.22 | 0.0020 | 1.20 | 0.0250 | 10,342 | 346 | 0.16 | 0.0378 | 1.02 | 0.0135 | 28,543 | 526 | 0.76 | 0.85 | 2.76 |
| ERS1 | 0.22 | 0.0017 | 1.11 | 0.0242 | 16,057 | 487 | 0.11 | 0.0058 | 0.83 | 0.0280 | 43,797 | 922 | 0.49 | 0.75 | 2.73 |
| Cinta Roja | 0.21 | 0.0022 | 1.15 | 0.0038 | 11,697 | 175 | 0.10 | 0.0030 | 0.96 | 0.0205 | 28,877 | 437 | 0.48 | 0.83 | 2.47 |
Publisher’s Note: MDPI stays neutral with regard to jurisdictional claims in published maps and institutional affiliations. |
© 2021 by the authors. Licensee MDPI, Basel, Switzerland. This article is an open access article distributed under the terms and conditions of the Creative Commons Attribution (CC BY) license (https://creativecommons.org/licenses/by/4.0/).
Share and Cite
MDPI and ACS Style
Ferrer-Pinós, A.; Garrigós, V.; Matallana, E.; Aranda, A. Mechanisms of Metabolic Adaptation in Wine Yeasts: Role of Gln3 Transcription Factor. Fermentation 2021, 7, 181. https://0-doi-org.brum.beds.ac.uk/10.3390/fermentation7030181
AMA Style
Ferrer-Pinós A, Garrigós V, Matallana E, Aranda A. Mechanisms of Metabolic Adaptation in Wine Yeasts: Role of Gln3 Transcription Factor. Fermentation. 2021; 7(3):181. https://0-doi-org.brum.beds.ac.uk/10.3390/fermentation7030181
Chicago/Turabian StyleFerrer-Pinós, Aroa, Víctor Garrigós, Emilia Matallana, and Agustín Aranda. 2021. "Mechanisms of Metabolic Adaptation in Wine Yeasts: Role of Gln3 Transcription Factor" Fermentation 7, no. 3: 181. https://0-doi-org.brum.beds.ac.uk/10.3390/fermentation7030181
Note that from the first issue of 2016, this journal uses article numbers instead of page numbers. See further details here.