
Bioethanol Production from Sugarcane Press-Mud: Assessment of the Fermentation Conditions to Reduce Fusel Alcohol

Abstract
:
1. Introduction
2. Materials and Methods
2.1. Material Collection
2.2. Evaluation of Yeast Strains
2.3. Sample Preparation
2.4. Fermentation
2.5. Experimental Design
2.6. Validation Results
2.7. Analytical Methods
3. Result
3.1. Yeast Screening
3.2. Effect of Pretreatment and Fermentation Conditions
3.2.1. Inhibitory Compounds
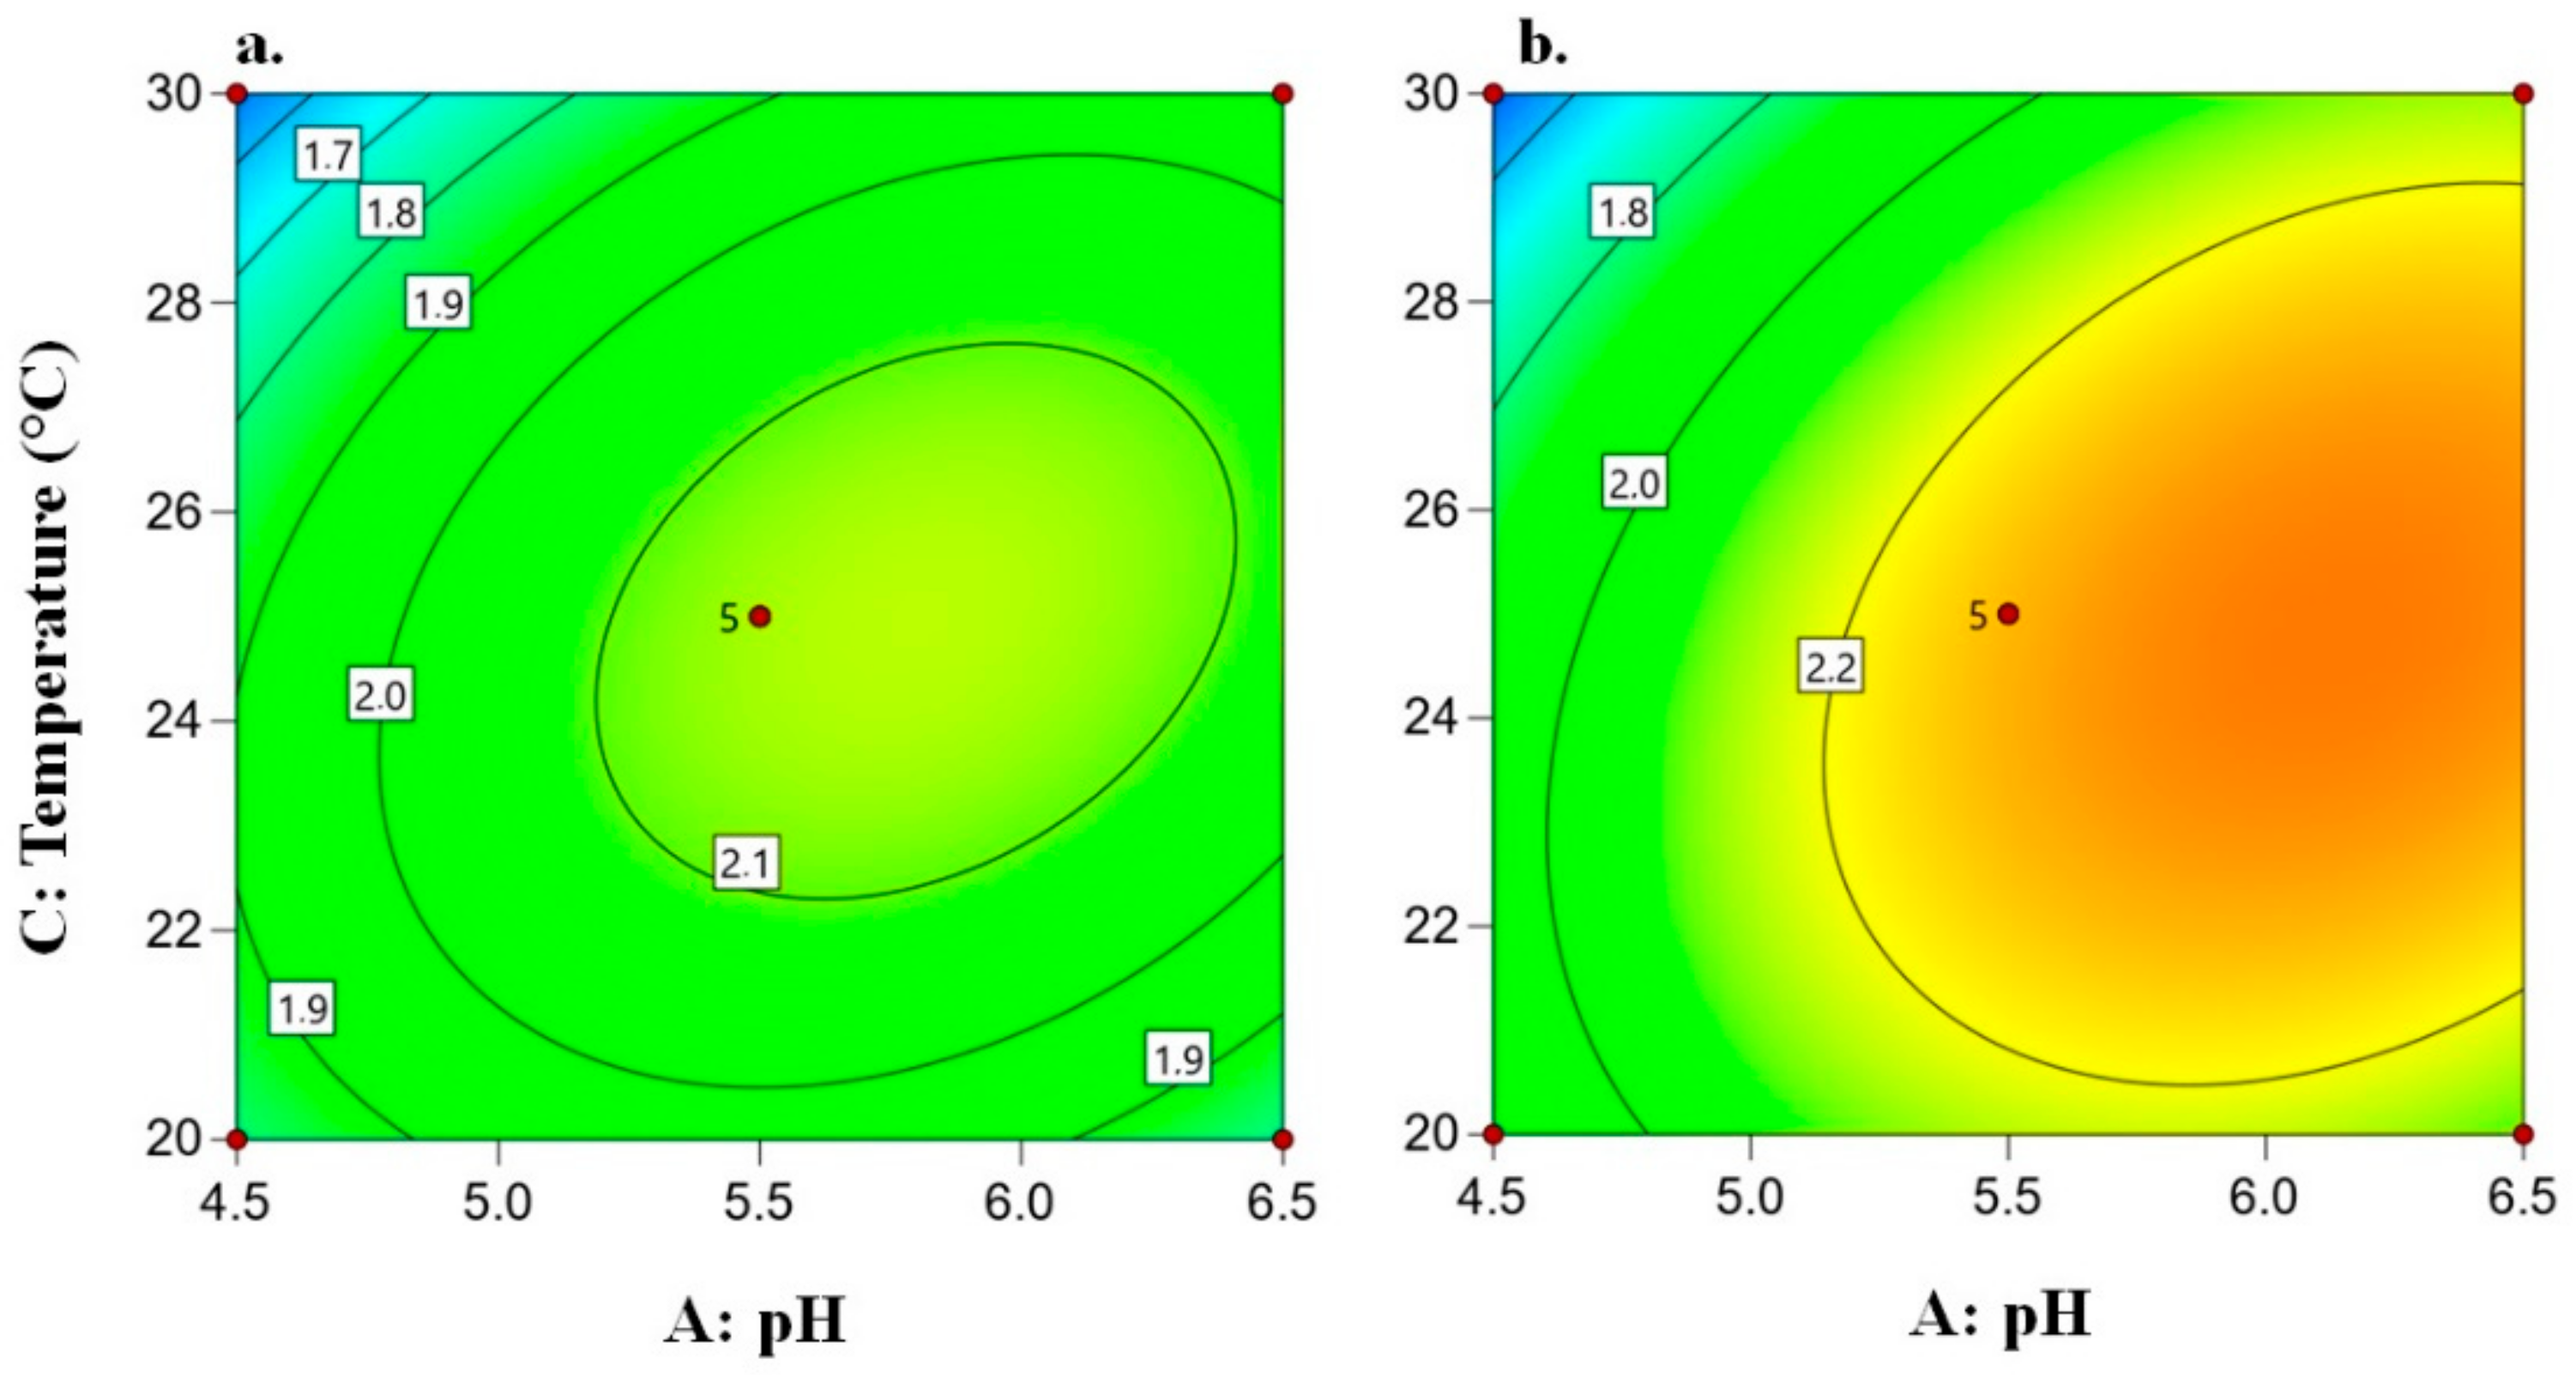
3.2.2. Yeast Cell Viability
3.2.3. Carbohydrate Conversion
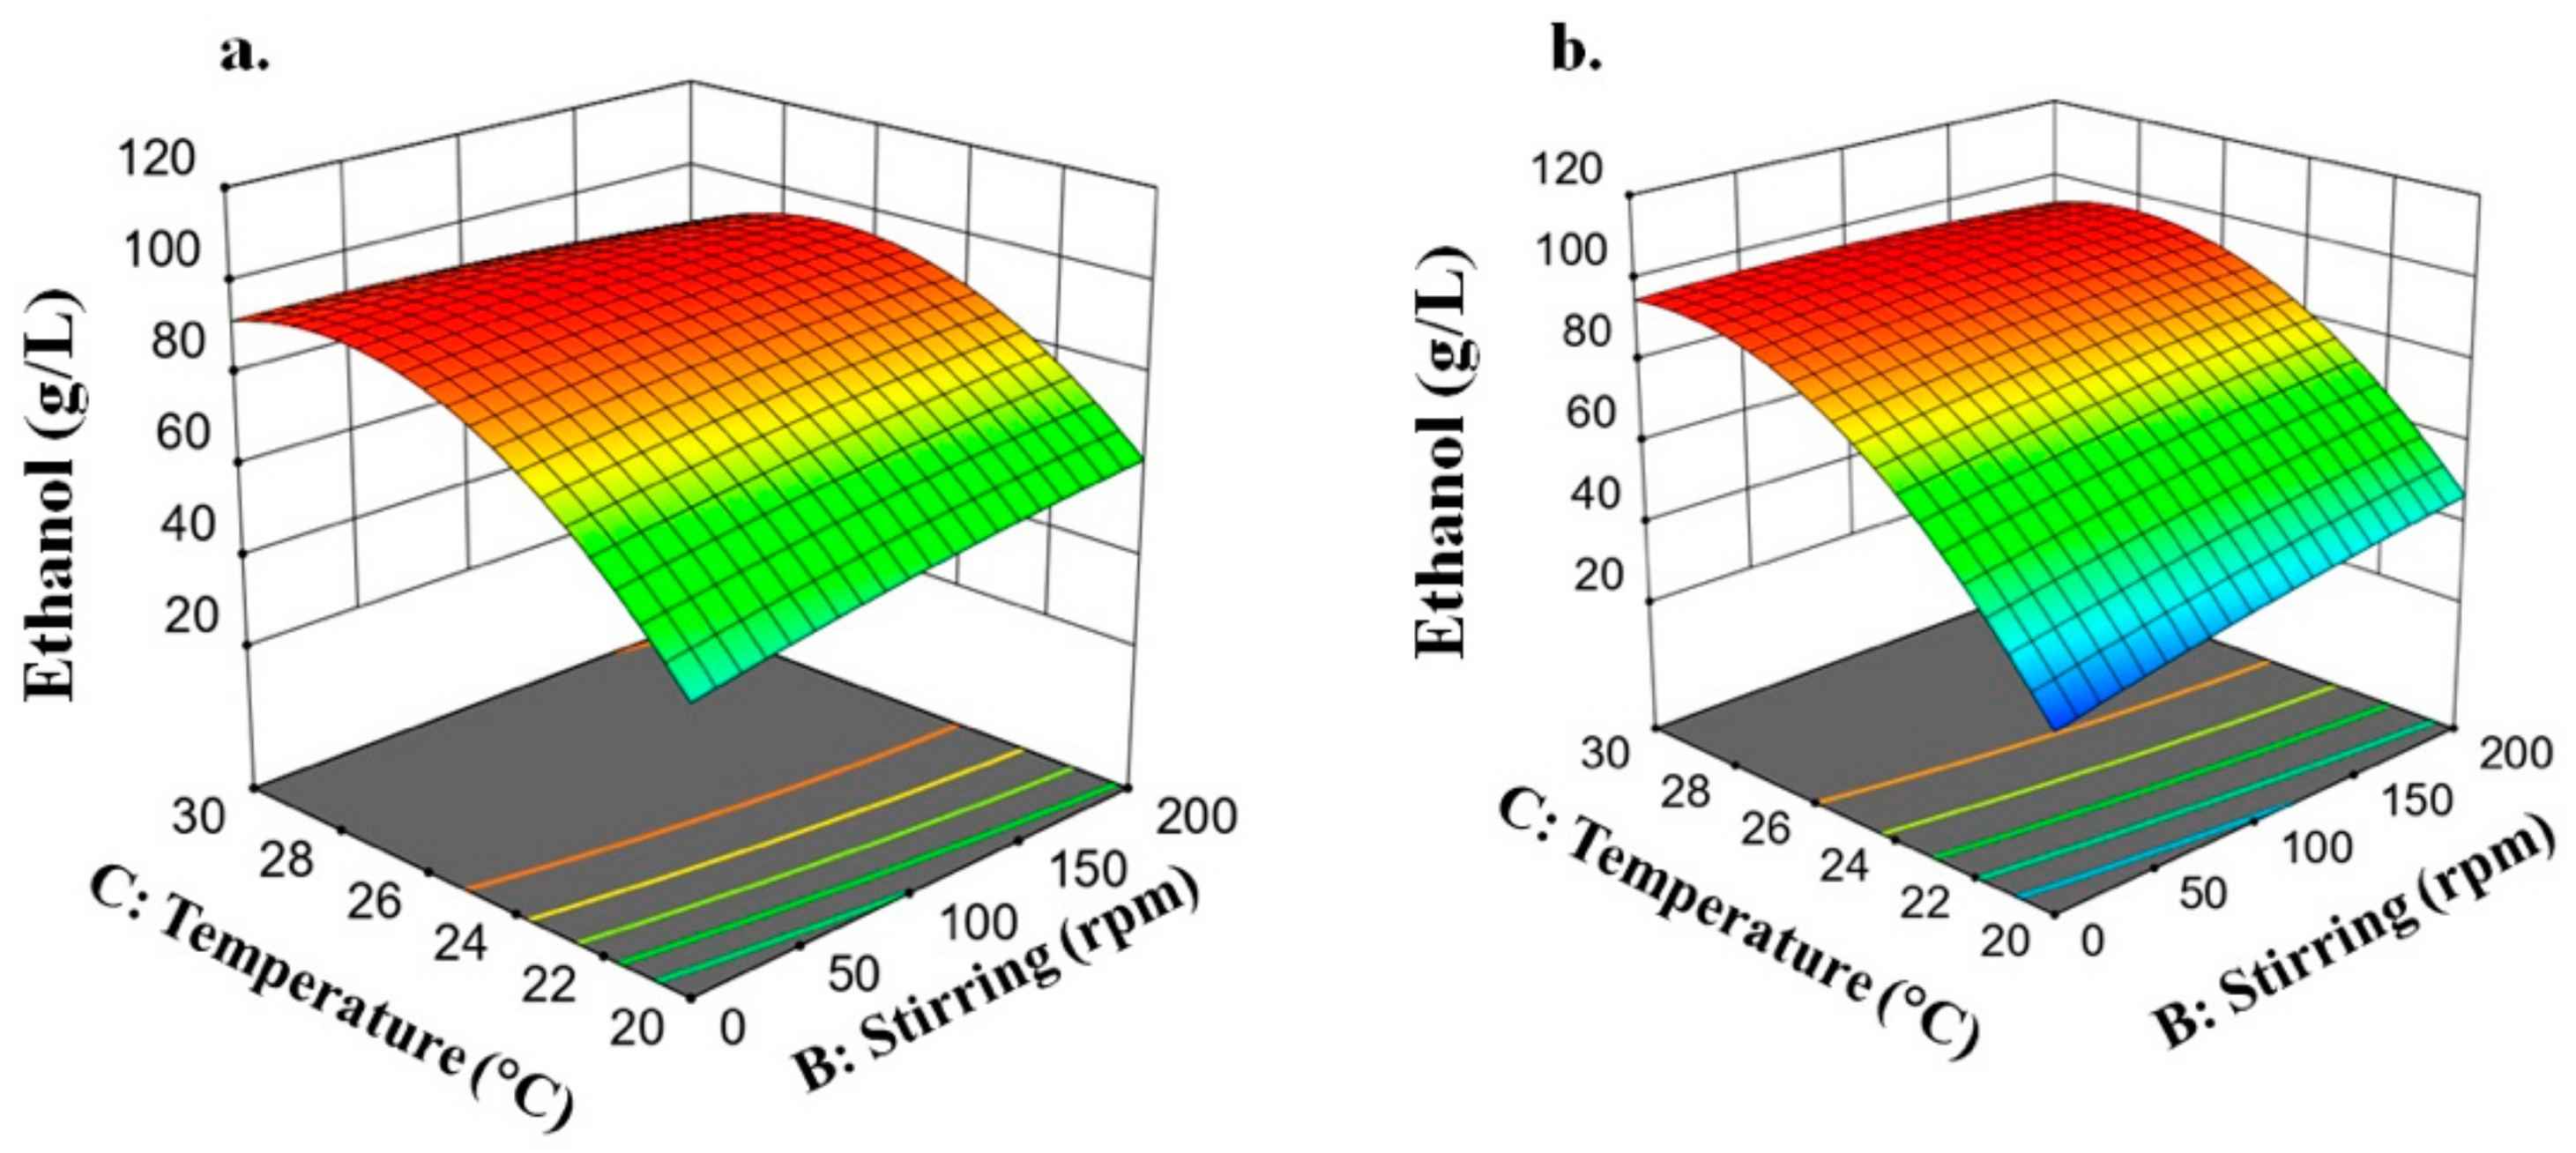
3.2.4. Ethanol Concentration
3.2.5. Fusel Alcohol Concentration
3.2.6. Condition Selection
3.3. Model Validation
3.4. Future Perspectives
4. Conclusions
Author Contributions
Funding
Institutional Review Board Statement
Informed Consent Statement
Data Availability Statement
Acknowledgments
Conflicts of Interest
References
- Sachs, J.D.; Schmidt-Traub, G.; Mazzucato, M.; Messner, D.; Nakicenovic, N.; Rockström, J. Six Transformations to achieve the Sustainable Development Goals. Nat. Sustain. 2019, 2, 805–814. [Google Scholar] [CrossRef]
- Martinez-Hernandez, E.; Tibessart, A.; Campbell, G.M. Conceptual design of integrated production of arabinoxylan products using bioethanol pinch analysis. Food Bioprod. Process. 2018, 112, 1–8. [Google Scholar] [CrossRef] [Green Version]
- Sanchez, N.; Ruiz, R.; Hacker, V.; Cobo, M. Impact of bioethanol impurities on steam reforming for hydrogen production: A review. Int. J. Hydrogen Energy 2020, 45, 11923–11942. [Google Scholar] [CrossRef]
- Becerra, J.; Figueredo, M.; Cobo, M. Thermodynamic and economic assessment of the production of light olefins from bioethanol. J. Environ. Chem. Eng. 2017, 5, 1554–1564. [Google Scholar] [CrossRef]
- Sun, J.; Wang, Y. Recent advances in catalytic conversion of ethanol to chemicals. ACS Catal. 2014, 4, 1078–1090. [Google Scholar] [CrossRef]
- Ajit, A.; Sulaiman, A.Z.; Chisti, Y. Production of bioethanol by Zymomonas mobilis in high-gravity extractive fermentations. Food Bioprod. Process. 2017, 102, 123–135. [Google Scholar] [CrossRef]
- Sanchez, N.; Ruiz, R.; Plazas, A.; Vasquez, J.; Cobo, M. Effect of pretreatment on the ethanol and fusel alcohol production during fermentation of sugarcane press-mud. Biochem. Eng. J. 2020, 161, 107668. [Google Scholar] [CrossRef]
- Conesa, C.; Seguí, L.; Laguarda-Miró, N.; Fito, P. Microwaves as a pretreatment for enhancing enzymatic hydrolysis of pineapple industrial waste for bioethanol production. Food Bioprod. Process. 2016, 100, 203–213. [Google Scholar] [CrossRef]
- Skiba, E.A.; Baibakova, O.V.; Budaeva, V.V.; Pavlov, I.N.; Vasilishin, M.S.; Makarova, E.I.; Sakovich, G.V.; Ovchinnikova, E.V.; Banzaraktsaeva, S.P.; Vernikovskaya, N.V.; et al. Pilot technology of ethanol production from oat hulls for subsequent conversion to ethylene. Chem. Eng. J. 2017, 329, 178–186. [Google Scholar] [CrossRef]
- Sanchez, N.; Ruiz, R.Y.; Cifuentes, B.; Cobo, M. Controlling sugarcane press-mud fermentation to increase bioethanol steam reforming for hydrogen production. Waste Manag. 2019, 98, 1–13. [Google Scholar] [CrossRef]
- Rossetti, I.; Compagnoni, M.; De Guido, G.; Pellegrini, L.A.; Ramis, G.; Dzwigaj, S. Ethylene production from diluted bioethanol solutions. Can. J. Chem. Eng. 2017, 95, 1752–1759. [Google Scholar] [CrossRef]
- Pires, E.J.; Teixeira, J.A.; Brányik, T.; Vicente, A.A. Yeast: The soul of beer’s aroma—A review of flavour-active esters and higher alcohols produced by the brewing yeast. Appl. Microbiol. Biotechnol. 2014, 98, 1937–1949. [Google Scholar] [CrossRef] [Green Version]
- Hazelwood, L.A.; Daran, J.M.; van Maris, A.J.A.; Pronk, J.T.; Dickinson, J.R. The ehrlich pathway for fusel alcohol production: A century of research on Saccharomyces cerevisiae metabolism. Appl. Environ. Microbiol. 2008, 74, 2259–2266. [Google Scholar] [CrossRef] [PubMed] [Green Version]
- Sanchez, N.; Ruiz, R.; Infante, N.; Cobo, M. Bioethanol Production from Cachaza as Hydrogen Feedstock: Effect of Ammonium Sulfate during Fermentation. Energies 2017, 10, 2112. [Google Scholar] [CrossRef] [Green Version]
- Arshad, M.; Khan, Z.M.; Shah, F.A.; Rajoka, M.I. Optimization of process variables for minimization of byproduct formation during fermentation of blackstrap molasses to ethanol at industrial scale. Lett. Appl. Microbiol. 2008, 47, 410–414. [Google Scholar] [CrossRef] [PubMed]
- Rollero, S.; Bloem, A.; Camarasa, C.; Sanchez, I.; Ortiz-julien, A.; Sablayrolles, J.; Dequin, S.; Mouret, J. Combined effects of nutrients and temperature on the production of fermentative aromas by Saccharomyces cerevisiae during wine fermentation. Appl. Microbiol. Biotechnol. 2015, 99, 2291–2304. [Google Scholar] [CrossRef]
- Saerens, S.M.G.; Verbelen, P.J.; Vanbeneden, N.; Thevelein, J.M.; Delvaux, F.R. Monitoring the influence of high-gravity brewing and fermentation temperature on flavour formation by analysis of gene expression levels in brewing yeast. Appl. Microbiol. Biotechnol. 2008, 80, 1039–1051. [Google Scholar] [CrossRef] [PubMed]
- Kłosowski, G.; Mikulski, D.; Macko, D. Influence of various yeast strains and selected starchy raw materials on production of higher alcohols during the alcoholic fermentation process. Eur. Food Res. Technol. 2015, 240, 233–242. [Google Scholar] [CrossRef]
- Dziekońska-Kubczak, U.; Berlowska, J.; Dziugan, P.; Patelski, P.; Pielech-Przybylska, K.; Balcerek, M. Nitric Acid Pretreatment of Jerusalem Artichoke Stalks for Enzymatic Saccharification and Bioethanol Production. Energies 2018, 11, 2153. [Google Scholar] [CrossRef] [Green Version]
- Mariano, A.P.B.; Unpaprom, Y.; Ramaraj, R. Hydrothermal pretreatment and acid hydrolysis of coconut pulp residue for fermentable sugar production. Food Bioprod. Process. 2020, 122, 31–40. [Google Scholar] [CrossRef]
- Mohd Azhar, S.H.; Abdulla, R.; Jambo, S.A.; Marbawi, H.; Gansau, J.A.; Mohd Faik, A.A.; Rodrigues, K.F. Yeasts in sustainable bioethanol production: A review. Biochem. Biophys. Rep. 2017, 10, 52–61. [Google Scholar] [CrossRef]
- Dack, R.E.; Black, G.W.; Koutsidis, G.; Usher, S.J. The effect of Maillard reaction products and yeast strain on the synthesis of key higher alcohols and esters in beer fermentations. Food Chem. 2017, 232, 595–601. [Google Scholar] [CrossRef]
- Comelli, R.N.; Seluy, L.G.; Isla, M.A. Performance of several Saccharomyces strains for the alcoholic fermentation of sugar-sweetened high-strength wastewaters: Comparative analysis and kinetic modelling. New Biotechnol. 2016, 33, 874–882. [Google Scholar] [CrossRef] [PubMed]
- Sanchez, N.; Ruiz, R.; Rödl, A.; Cobo, M. Technical and environmental analysis on the power production from residual biomass using hydrogen as energy vector. Renew Energ 2021, 175, 825–839. [Google Scholar] [CrossRef]
- Kliks, J.; Kawa-Rygielska, J.; Gasinski, A.; Rebas, J.; Szummy, A. Changes in the volatile composition of apple and apple/pear ciders affected by the different dilution rates in the continuous fermentation system. LWT Food Sci. Technol. 2021, 147, 111630. [Google Scholar] [CrossRef]
- Lohrmann, J. Caracterización de Levaduras no Convencionales de la Patagonia para la Producción de Whisky con Características Sensoriales Distintivas Resumen; Trabajo de Grado Licenciatura, Licenciado en Ciencias Biológicas, Universidad Nacional del Comahue: Neuquén, Argentina, 2021. [Google Scholar]
- Sluiter, A.; Hames, B.; Hyman, D.; Payne, C.; Ruiz, R.; Scarlata, C.; Sluiter, J.; Templeton, D.; Nrel, J.W. Determination of Total Solids in Biomass and Total Dissolved Solids in Liquid Process Samples; National Renewable Energy Laboratory: Golden, CO, USA, 2008. [Google Scholar]
- Pereira, F.B.; Guimarães, P.M.R.; Teixeira, J.A.; Domingues, L. Optimization of low-cost medium for very high gravity ethanol fermentations by Saccharomyces cerevisiae using statistical experimental designs. Bioresour. Technol. 2010, 101, 7856–7863. [Google Scholar] [CrossRef] [Green Version]
- Walker, G.; Stewart, G. Saccharomyces cerevisiae in the Production of Fermented Beverages. Beverages 2016, 2, 30. [Google Scholar] [CrossRef]
- Hajar, S.; Azhar, M.; Abdulla, R.; Jambo, S.A.; Marbawi, H.; Azlan, J.; Azifa, A.; Faik, M.; Francis, K. Yeasts in sustainable bioethanol production: A review. Biochem. Biophys. Rep. 2017, 10, 52–61. [Google Scholar]
- Yang, S.; Li, Y.; Jia, D.; Yao, K.; Liu, W. The synergy of Box-Behnken designs on the optimization of polysaccharide extraction from mulberry leaves. Ind. Crop. Prod. 2017, 99, 70–78. [Google Scholar] [CrossRef]
- Kwolek-Mirek, M.; Zadrag-Tecza, R. Comparison of methods used for assessing the viability and vitality of yeast cells. FEMS Yeast Res. 2014, 14, 1068–1079. [Google Scholar] [CrossRef] [PubMed]
- Puligundla, P.; Smogrovicova, D.; Mok, C.; Sarathi, V.; Obulam, R. Recent developments in high gravity beer-brewing. Innov. Food Sci. Emerg. Technol. 2020, 64, 102399. [Google Scholar] [CrossRef]
- Kawa-Rygielska, J.; Pietrzak, W.; Regiec, P.; Stencel, P. Utilization of concentrate after membrane filtration of sugar beet thin juice for ethanol production. Bioresour. Technol. 2013, 133, 134–141. [Google Scholar] [CrossRef]
- Askarbekov, E.; Baigazieva, G.; Zhienbaeva, S.; Batyrbaeva, N.; Iztaev, A.; Uvakasova, G.; Serikbaeva, A. Comparison of different industrial strains of dry yeast for industrial fermentation of sweet sorghum syrup. Biosci. Res. 2018, 15, 1048–1062. [Google Scholar]
- Veljković, V.B. Comment on “study of fuel properties of rubber seed oil based biodiesel” [Energy Convers. Manage. 2014; 78: 266-275] by Ahmad et al. Energy Convers. Manag. 2014, 86, 1186–1188. [Google Scholar] [CrossRef]
- Veljković, V.B.; Veličković, A.V.; Avramović, J.M.; Stamenković, O.S. Modeling of biodiesel production: Performance comparison of Box–Behnken, face central composite and full factorial design. Chin. J. Chem. Eng. 2019, 27, 1690–1698. [Google Scholar] [CrossRef]
- Ramaraj, R.; Unpaprom, Y. Optimization of pretreatment condition for ethanol production from Cyperus difformis by response surface methodology. 3 Biotech 2019, 9, 1–9. [Google Scholar] [CrossRef]
- Shang, Y.H.; Zeng, Y.J.; Zhu, P.; Zhong, Q.P. Acetate metabolism of Saccharomyces cerevisiae at different temperatures during lychee wine fermentation. Biotechnol. Biotechnol. Equip. 2016, 30, 512–520. [Google Scholar] [CrossRef] [Green Version]
- Whiting, G. Organic acid metabolism of yeasts during fermentation of alcoholic beverages—A review. J. Inst. Brew. 1976, 82, 84–92. [Google Scholar] [CrossRef]
- Papapetridis, I.; Van Dijk, M.; Dobbe, A.P.A.; Metz, B.; Pronk, J.T. Improving ethanol yield in acetate—Reducing Saccharomyces cerevisiae by cofactor engineering of 6—Phosphogluconate dehydrogenase and deletion of ALD6. Microb. Cell Fact. 2016, 15, 67–83. [Google Scholar] [CrossRef] [PubMed] [Green Version]
- Schober, P.; Boer, C.; Schwarte, L.A. Correlation Coefficients: Appropriate Use and Interpretation. Anesth. Analg. 2018, 126, 1763–1768. [Google Scholar] [CrossRef]
- Wei, N.; Quarterman, J.; Kim, S.R.; Cate, J.H.D.; Jin, Y.S. Enhanced biofuel production through coupled acetic acid and xylose consumption by engineered yeast. Nat. Commun. 2013, 4, 1–8. [Google Scholar] [CrossRef] [Green Version]
- Yang, X.; Wang, K.; Wang, H.; Zhang, J.; Tang, L.; Mao, Z. Control of pH by acetic acid and its effect on ethanol fermentation in an integrated ethanol-methane fermentation process. RSC Adv. 2016, 6, 57902–57909. [Google Scholar] [CrossRef]
- Akillioglu, H.G.; Mogol, B.A.; Gökmen, V. Degradation of 5-hydroxymethylfurfural during yeast fermentation. Food Addit. Contam. Part A Chem. Anal. Control. Expo. Risk Assess. 2011, 28, 1629–1635. [Google Scholar] [CrossRef] [PubMed]
- Van Maris, A.J.A.; Abbott, D.A.; Bellissimi, E.; van den Brink, J.; Kuyper, M.; Luttik, M.A.H.; Wisselink, H.W.; Scheffers, W.A.; van Dijken, J.P.; Pronk, J.T. Alcoholic fermentation of carbon sources in biomass hydrolysates by Saccharomyces cerevisiae: Current status. Antonie van Leeuwenhoek Int. J. Gen. Mol. Microbiol. 2006, 90, 391–418. [Google Scholar] [CrossRef]
- Dziugan, P.; Balcerek, M.; Pielech-Przybylska, K.; Patelski, P. Evaluation of the fermentation of high gravity thick sugar beet juice worts for efficient bioethanol production. Biotechnol. Biofuels 2013, 6, 158. [Google Scholar] [CrossRef] [Green Version]
- Lee, H.; Cho, D.H.; Kim, Y.H.; Shin, S.J.; Kim, S.B.; Han, S.O.; Lee, J.; Kim, S.W.; Park, C. Tolerance of Saccharomyces cerevisiae K35 to lignocellulose-derived inhibitory compounds. Biotechnol. Bioprocess Eng. 2011, 16, 755–760. [Google Scholar] [CrossRef]
- Heard, G.M.; Fleet, G.H. The effects of temperature and pH on the growth of yeast species during the fermentation of grape juice. J. Appl. Bacteriol. 1988, 65, 23–28. [Google Scholar] [CrossRef]
- Lu, Y.; Voon, M.K.W.; Huang, D.; Lee, P.R.; Liu, S.Q. Combined effects of fermentation temperature and pH on kinetic changes of chemical constituents of durian wine fermented with Saccharomyces cerevisiae. Appl. Microbiol. Biotechnol. 2017, 101, 3005–3014. [Google Scholar] [CrossRef]
- Gutiérrez, A.; Chiva, R.; Sancho, M.; Beltran, G.; Arroyo-López, F.N.; Guillamon, J.M. Nitrogen requirements of commercial wine yeast strains during fermentation of a synthetic grape must. Food Microbiol. 2012, 31, 25–32. [Google Scholar] [CrossRef] [PubMed]
- Mendieta, O.; Madrigal, G.; Castro, L.; Rodríguez, J.; Escalante, H. Sugarcane scum as a novel substrate for rapid biogas production from the non-centrifugal cane sugar agribusiness sector in developing countries. Bioresour. Technol. 2020, 297, 122364. [Google Scholar] [CrossRef] [PubMed]
- Quiroga, E.; Moltó, J.; Conesa, J.A.; Valero, M.F.; Cobo, M. Kinetics of the catalytic thermal degradation of sugarcane residual biomass over Rh-Pt/CeO2-SiO2 for syngas production. Catalyst 2020, 10, 508. [Google Scholar] [CrossRef]
- Girisuta, B.; Danon, B.; Manurung, R.; Janssen, L.P.B.; Heeres, H. Experimental and kinetic modeling studies on the acid-catalysed hydrolysis of the water hyacinth plant to levulinic acid. Bioresour. Technol. 2008, 99, 8367–8375. [Google Scholar] [CrossRef] [PubMed]
- Wang, D.; Xu, Y.; Hu, J.; Zhao, G. Fermentation Kinetics of Different Sugars by Apple Wine Yeast Saccharomyces cerevisiae. J. Inst. Brew. 2004, 110, 340–346. [Google Scholar] [CrossRef]
- Aranda, A.; Matallana, E.; Olmo, M. Saccharomyces Yeasts I: Primary Fermentation; Elsevier: Oxford, UK, 2011; ISBN 9780123750211. [Google Scholar]
- Cruz, A.L.B.; Hebly, M.; Duong, G.; Wahl, S.A.; Pronk, J.T.; Heijnen, J.J.; Daran-lapujade, P.; Gulik, W.M. Van Similar temperature dependencies of glycolytic enzymes: An evolutionary adaptation to temperature dynamics? BMC Syst. Biol. 2012, 6, 1–16. [Google Scholar] [CrossRef] [Green Version]
- Kumar, R.; Kesavapillai, B. Stimulation of extracellular invertase production from spent yeast when sugarcane pressmud used as substrate through solid state fermentation. SpringerPlus 2012, 1, 1–6. [Google Scholar] [CrossRef] [Green Version]
- Vilela-moura, A.; Schuller, D.; Mendes-faia, A.; Silva, R.D.; Chaves, S.R.; Sousa, M.J.; Côrte-real, M. The impact of acetate metabolism on yeast fermentative performance and wine quality: Reduction of volatile acidity of grape musts and wines. Appl. Microbiol. Biotechnol. 2011, 89, 271–280. [Google Scholar] [CrossRef] [Green Version]
- Zabed, H.; Faruq, G.; Sahu, J.N.; Azirun, M.S.; Hashim, R.; Nasrulhaq Boyce, A. Bioethanol production from fermentable sugar juice. Sci. World J. 2014, 2014, 1–11. [Google Scholar] [CrossRef] [PubMed] [Green Version]
- Puligundla, P.; Smogrovicova, D.; Obulam, V.S.R.; Ko, S. Very high gravity (VHG) ethanolic brewing and fermentation: A research update. J. Ind. Microbiol. Biotechnol. 2011, 38, 1133–1144. [Google Scholar] [CrossRef]
- De Vasconcelos, J.N. Ethanol Fermentation. In Sugarcane: Agricultural Production, Bioenergy and Ethanol; Santos, F., Borem, A., Caldas, C., Eds.; Elsevier: Porto Alegre, Brazil, 2015; pp. 311–340. ISBN 9780128022399. [Google Scholar]
- Galanakis, C.M.; Kordulis, C.; Kanellaki, M.; Koutinas, A.A.; Bekatorou, A.; Lycourghiotis, A. Effect of pressure and temperature on alcoholic fermentation by Saccharomyces cerevisiae immobilized on c -alumina pellets. Bioresour. Technol. 2012, 114, 492–498. [Google Scholar] [CrossRef] [PubMed]
- de la Roza, C.; Laca, A.; García, L.A.; Díaz, M. Stirring and mixing effects at different cider fermentation scales. Food Bioprod. Process 2002, 80, 1–6. [Google Scholar] [CrossRef]
- Pfeiffer, T.; Morley, A. An evolutionary perspective on the Crabtree effect. Front. Mol. Biosci. 2014, 1, 1–6. [Google Scholar] [CrossRef]
- Mauricio, J.C.; Milla, C.; Ortega, J. Influence of oxygen on the biosynthesis of cellular fatty acids, sterols and phospholipids during alcoholic fermentation by Saccharomyces cerevisiae and Torulaspora delbrueckii. World J. Microbiol. Biotechnol. 1998, 14, 405–410. [Google Scholar] [CrossRef]
- Rollero, S.; Roberts, S.; Bauer, F.F.; Divol, B. Agitation impacts fermentation performance as well as carbon and nitrogen metabolism in Saccharomyces cerevisiae under winemaking conditions. Aust. J. Grape Wine Res. 2015, 24, 1–8. [Google Scholar]
- Pielech-Przybylska, K.; Balcerek, M.; Dziekońska-Kubczak, U.; Patelski, P.; Różański, M. Effect of starch liberation method and initial pH of sweet mashes on higher alcohols content in distillates obtained from different starchy raw materials. Process Biochem. 2018, 73, 29–37. [Google Scholar] [CrossRef]
- Saerens, S.M.G.; Delvaux, F.; Verstrepen, K.J.; Van Dijck, P.; Thevelein, J.M.; Delvaux, F.R. Parameters Affecting Ethyl Ester Production by Saccharomyces cerevisiae during Fermentation. Appl. Environ. Microbiol. 2008, 74, 454–461. [Google Scholar] [CrossRef] [PubMed] [Green Version]
- Espinoza Pérez, A.T.; Camargo, M.; Narváez Rincón, P.C.; Alfaro Marchant, M. Key challenges and requirements for sustainable and industrialized biorefinery supply chain design and management: A bibliographic analysis. Renew. Sustain. Energy Rev. 2017, 69, 350–359. [Google Scholar] [CrossRef]
- Sanchez, N.; Rodriguez-Fontalvo, D. Dataset for fermentation of sugarcane press-mud: Effect of Temperature, Stirring, pH, and hydrolyis on ethanol and fusel alcohol content. Mendeley Dataset 2021, V1. [Google Scholar] [CrossRef]


| Fermentation Parameter | HG-1 | C-70 | M-1 |
|---|---|---|---|
| Yeast cell viability (Log CFU/mL) | 1.89 ± 0.05 a | 1.69 ± 0.12 b | 2.03 ± 0.01 a |
| Carbohydrate conversion | 95.6 | 95.6 | 95.5 |
| Ethanol concentration (g/L) | 80.06 ± 3.88 a | 74.87 ± 9.70 a | 77.85 ± 4.91 a |
| Fusel alcohol concentration (g/L) | 176.01 ± 7.85 a | 228.69 ± 47.45 b | 244.94 ± 37.55 b |
| Run | A: pH | B: Stirring (rpm) | C: T (°C) | ∆Yeast Viability (Log CFU/mL) | Carbohydrates Conversion | Ethanol (g/L) | Fusel Alcohol (mg/L) | Acetic Acid (g/L) | |||||||||
|---|---|---|---|---|---|---|---|---|---|---|---|---|---|---|---|---|---|
| 1-Propanol | 2M1P | 3M1B | |||||||||||||||
| Exp. | Mod. | Exp. | Mod. | Exp. | Mod. | Exp. | Mod. | Exp. | Mod. | Exp. | Mod. | Exp. | Mod. | ||||
| 1 | 6.5 | 100 | 30 | 2.10 | 2.14 | 0.97 | 1.00 | 93.52 | 91.84 | 96.95 | 90.29 | 149.23 | 165.41 | 283.19 | 305.66 | 4.06 | 3.98 |
| 2 | 6.5 | 200 | 25 | 2.37 | 2.40 | 0.98 | 0.99 | 94.22 | 97.80 | 89.42 | 90.41 | 214.82 | 194.86 | 369.13 | 342.93 | 3.88 | 4.00 |
| 3 | 5.5 | 0 | 30 | 1.97 | 2.02 | 0.97 | 0.92 | 93.65 | 91.81 | 89.56 | 88.15 | 148.44 | 143.36 | 287.24 | 269.93 | 3.89 | 3.78 |
| 7 | 5.5 | 200 | 20 | 2.09 | 2.10 | 0.51 | 0.52 | 66.13 | 61.61 | 49.15 | 47.21 | 89.19 | 100.12 | 148.78 | 161.37 | 5.56 | 5.33 |
| 8 | 5.5 | 100 | 25 | 2.29 | 2.28 | 0.98 | 0.93 | 96.83 | 92.71 | 96.13 | 80.77 | 203.08 | 156.43 | 355.53 | 275.38 | 3.87 | 3.97 |
| 11 | 5.5 | 100 | 25 | 2.30 | 2.28 | 0.96 | 0.93 | 94.79 | 92.71 | 88.78 | 80.77 | 186.41 | 156.43 | 335.36 | 275.38 | 3.90 | 3.97 |
| 14 | 4.5 | 0 | 25 | 1.97 | 2.06 | 0.95 | 0.94 | 91.92 | 90.36 | 78.01 | 73.51 | 129.68 | 135.43 | 230.68 | 237.09 | 3.87 | 3.96 |
| 19 | 5.5 | 100 | 25 | 2.23 | 2.28 | 0.95 | 0.93 | 91.79 | 92.71 | 82.03 | 80.77 | 155.21 | 156.43 | 277.96 | 275.38 | 3.94 | 3.97 |
| 24 | 5.5 | 100 | 25 | 2.35 | 2.28 | 0.95 | 0.93 | 92.45 | 92.71 | 72.37 | 80.77 | 168.90 | 156.43 | 286.27 | 275.38 | 3.91 | 3.97 |
| 26 | 4.5 | 200 | 25 | 1.87 | 1.89 | 0.96 | 0.96 | 85.94 | 90.90 | 65.28 | 69.67 | 130.18 | 135.21 | 229.34 | 239.40 | 3.81 | 3.92 |
| 28 | 6.5 | 0 | 25 | 2.47 | 2.40 | 0.94 | 0.94 | 89.02 | 89.66 | 77.33 | 84.07 | 157.28 | 161.69 | 257.25 | 268.50 | 3.99 | 3.96 |
| 29 | 6.5 | 100 | 20 | 2.10 | 2.09 | 0.60 | 0.58 | 59.24 | 59.74 | 46.01 | 45.86 | 80.57 | 96.60 | 118.33 | 145.28 | 6.44 | 5.41 |
| 30 | 5.5 | 0 | 20 | 2.34 | 2.33 | 0.36 | 0.48 | 44.70 | 47.60 | 31.67 | 36.14 | 65.32 | 75.47 | 91.28 | 111.38 | 6.45 | 5.40 |
| 31 | 4.5 | 100 | 30 | 1.63 | 1.50 | 0.94 | 1.01 | 88.22 | 91.18 | 67.60 | 72.41 | 107.01 | 113.36 | 200.51 | 224.73 | 3.92 | 3.82 |
| 32 | 5.5 | 200 | 30 | 2.06 | 2.08 | 0.93 | 0.95 | 90.38 | 86.49 | 77.72 | 79.59 | 132.43 | 151.66 | 272.66 | 296.67 | 3.88 | 3.85 |
| 33 | 5.5 | 100 | 25 | 2.24 | 2.28 | 0.93 | 0.93 | 86.43 | 92.71 | 69.37 | 80.77 | 137.13 | 156.43 | 230.07 | 275.38 | 3.90 | 3.97 |
| 34 | 4.5 | 100 | 20 | 1.89 | 1.89 | 0.60 | 0.55 | 57.50 | 54.19 | 36.21 | 32.45 | 63.20 | 62.74 | 97.50 | 91.26 | 5.59 | 5.50 |
| Run | A: pH | B: Stirring (rpm) | C: T (°C) | ∆yeast Viability (Log CFU/mL) | Carbohydrates Conversion | Ethanol (g/L) | Fusel Alcohol (mg/L) | Acetic Acid (g/L) | |||||||||
|---|---|---|---|---|---|---|---|---|---|---|---|---|---|---|---|---|---|
| 1-Propanol | 2M1P | 3M1B | |||||||||||||||
| Exp. | Mod. | Exp. | Mod. | Exp. | Mod. | Exp. | Mod. | Exp. | Mod. | Exp. | Mod. | Exp. | Mod. | ||||
| 4 | 6.5 | 100 | 30 | 2.09 | 2.06 | 0.91 | 0.91 | 90.06 | 83.79 | 68.47 | 68.72 | 93.92 | 107.06 | 176.40 | 191.84 | 4.48 | 3.58 |
| 5 | 6.5 | 200 | 25 | 1.99 | 1.97 | 0.93 | 0.89 | 95.90 | 93.01 | 91.60 | 89.70 | 147.41 | 136.70 | 271.38 | 251.23 | 3.98 | 2.86 |
| 6 | 5.5 | 0 | 30 | 1.86 | 1.85 | 1.01 | 0.91 | 94.83 | 87.64 | 95.62 | 80.84 | 152.55 | 128.11 | 256.69 | 218.79 | 3.91 | 3.17 |
| 9 | 5.5 | 200 | 20 | 2.05 | 1.95 | 0.94 | 0.89 | 94.36 | 95.02 | 87.07 | 82.30 | 131.86 | 107.13 | 228.36 | 199.84 | 4.03 | 3.16 |
| 10 | 5.5 | 100 | 25 | 1.77 | 1.79 | 0.46 | 0.37 | 51.92 | 42.41 | 31.64 | 21.37 | 64.96 | 38.03 | 101.28 | 50.36 | 5.66 | 4.19 |
| 12 | 5.5 | 100 | 25 | 2.27 | 2.14 | 0.81 | 0.83 | 91.10 | 86.92 | 79.47 | 74.39 | 116.24 | 122.47 | 205.53 | 213.50 | 4.34 | 3.13 |
| 13 | 4.5 | 0 | 25 | 1.92 | 1.94 | 0.91 | 0.89 | 95.21 | 95.83 | 80.40 | 82.85 | 129.38 | 123.59 | 223.42 | 218.95 | 4.38 | 2.82 |
| 15 | 5.5 | 100 | 25 | 2.33 | 2.14 | 0.88 | 0.83 | 89.99 | 86.92 | 78.31 | 74.39 | 134.53 | 122.47 | 215.61 | 213.50 | 4.20 | 3.13 |
| 16 | 5.5 | 100 | 25 | 2.09 | 2.14 | 0.83 | 0.83 | 86.44 | 86.92 | 78.46 | 74.39 | 124.64 | 122.47 | 201.50 | 213.50 | 4.22 | 3.13 |
| 17 | 4.5 | 200 | 25 | 1.41 | 1.53 | 0.98 | 1.03 | 90.89 | 96.93 | 78.50 | 84.12 | 99.44 | 104.00 | 196.15 | 195.91 | 4.11 | 3.28 |
| 18 | 6.5 | 0 | 25 | 1.86 | 1.90 | 0.26 | 0.35 | 41.12 | 46.81 | 32.16 | 40.28 | 49.55 | 68.42 | 74.47 | 107.71 | 5.39 | 4.28 |
| 20 | 6.5 | 100 | 20 | 1.95 | 2.14 | 0.69 | 0.83 | 81.96 | 86.92 | 59.89 | 74.39 | 79.77 | 122.47 | 160.73 | 213.50 | 4.61 | 3.13 |
| 21 | 5.5 | 0 | 20 | 1.64 | 2.17 | 0.43 | 0.33 | 25.64 | 29.50 | 17.67 | 13.25 | 41.15 | 22.49 | 57.03 | 33.07 | 5.87 | 4.72 |
| 22 | 4.5 | 100 | 30 | 2.05 | 2.14 | 0.82 | 0.83 | 86.35 | 86.92 | 70.97 | 74.39 | 88.58 | 122.47 | 175.84 | 213.50 | 4.42 | 3.13 |
| 23 | 5.5 | 200 | 30 | 2.20 | 2.13 | 0.81 | 0.81 | 88.55 | 92.79 | 79.16 | 82.42 | 154.24 | 155.30 | 260.09 | 264.44 | 4.33 | 2.63 |
| 25 | 5.5 | 100 | 25 | 1.86 | 1.81 | 0.41 | 0.45 | 34.26 | 36.83 | 19.14 | 27.12 | 46.57 | 36.64 | 65.97 | 54.22 | 5.55 | 4.90 |
| 27 | 4.5 | 100 | 20 | 2.09 | 2.16 | 0.69 | 0.79 | 79.76 | 81.33 | 56.46 | 60.11 | 85.85 | 100.85 | 148.77 | 165.36 | 4.70 | 2.96 |
| Yeast Cell Viability (Log CFU/mL) | Carbohydrates Conversion | Ethanol (g/L) | 1P (mg/L) | 2M1P (mg/L) | 3M1B (mg/L) | Acetic Acid (g/L) | Fusel Alcohol (mg/L) | Acetic Acid Conversion | HMF Conversion | |
|---|---|---|---|---|---|---|---|---|---|---|
| Model | <0.0001 | <0.0001 | <0.0001 | <0.0001 | <0.0001 | <0.0001 | <0.0001 | <0.0001 | <0.0001 | <0.0001 |
| A | <0.0001 | 0.1845 | 0.4015 | 0.1818 | 0.0391 | 0.0546 | 0.1005 | 0.0482 | <0.0001 | 0.0845 |
| B | 0.0618 | 0.5273 | 0.0315 | 0.0481 | 0.0366 | 0.0142 | 0.0433 | 0.0184 | 0.0298 | 0.1461 |
| C | 0.0346 | <0.0001 | <0.0001 | <0.0001 | <0.0001 | <0.0001 | <0.0001 | <0.0001 | <0.0001 | <0.0001 |
| D | 0.0009 | 0.0006 | 0.0040 | 0.0464 | 0.0006 | 0.0001 | <0.0001 | 0.0003 | 0.0086 | 0.0326 |
| AB | 0.2459 | 0.7727 | 0.3120 | 0.4213 | 0.3409 | 0.1917 | 0.7394 | 0.2416 | 0.9835 | 0.8812 |
| AC | 0.0066 | 0.6597 | 0.5124 | 0.7221 | 0.6009 | 0.6197 | 0.3434 | 0.6108 | 0.2882 | 0.0154 |
| AD | 0.0356 | 0.1175 | 0.7374 | 0.0410 | 0.1950 | 0.1408 | 0.2147 | 0.1219 | 0.6181 | 0.8467 |
| BC | 0.0854 | 0.8970 | 0.0159 | 0.1293 | 0.6379 | 0.6678 | 0.6056 | 0.5437 | 0.1584 | 0.0615 |
| BD | 0.7478 | 0.6808 | 0.5310 | 0.0838 | 0.3901 | 0.5211 | 0.0459 | 0.3723 | 0.6477 | 0.8472 |
| CD | 0.3643 | 0.1293 | 0.0005 | 0.0663 | 0.4970 | 0.8300 | 0.7530 | 0.5425 | 0.0220 | 0.0560 |
| A2 | 0.0002 | 0.0725 | 0.6141 | 0.5286 | 0.6470 | 0.4182 | 0.5146 | 0.3863 | 0.9374 | 0.6569 |
| B2 | 0.0678 | 0.4034 | 0.4283 | 0.8497 | 0.6165 | 0.5780 | 0.4176 | 0.6079 | 0.6923 | 0.7607 |
| C2 | <0.0001 | <0.0001 | <0.0001 | <0.0001 | <0.0001 | <0.0001 | <0.0001 | <0.0001 | <0.0001 | <0.0001 |
| Lack of fit | 0.8412 | 0.0877 | 0.0996 | 0.7494 | 0.5588 | 0.5636 | 0.1143 | 0.6233 | 0.0007 | 0.0002 |
| R2 | 0.8877 | 0.9321 | 0.9588 | 0.9084 | 0.8181 | 0.8719 | 0.9646 | 0.8700 | 0.9271 | 0.9641 |
| R2 adjusted | 0.8108 | 0.8880 | 0.9321 | 0.8489 | 0.6998 | 0.7886 | 0.9391 | 0.7855 | 0.8745 | 0.9366 |
| R2 predicted | 0.6884 | 0.7486 | 0.8419 | 0.7351 | 0.5141 | 0.6603 | 0.8603 | 0.6569 | 0.7378 | 0.7479 |
| Int. | A | B | C | D | AB | AC | AD | BC | BD | CD | A2 | B2 | C2 | |
|---|---|---|---|---|---|---|---|---|---|---|---|---|---|---|
| YCV (CFU/mL) | 2.21 | 0.15 | −0.05 | −0.06 | 0.07 | 0.04 | 0.11 | 0.06 | 0.07 | 0.01 | −0.03 | −0.16 | 0.07 | −0.21 |
| XG (%) | 0.88 | −0.02 | 0.01 | 0.25 | 0.05 | 0.01 | −0.01 | 0.03 | −0.00 | 0.01 | −0.03 | 0.05 | −0.02 | −0.19 |
| E (g/L) | 89.81 | 1.11 | 3.00 | 22.6 | 2.89 | 1.90 | −1.22 | 0.44 | −4.83 | −0.82 | −5.33 | 0.92 | −1.45 | −19.4 |
| 1P (mg/L) | 77.58 | 3.03 | 4.62 | 25.3 | 3.19 | 2.55 | 1.12 | 4.79 | −4.91 | −3.99 | −4.26 | −1.94 | 0.58 | −18.6 |
| 2M1P (mg/L) | 139.4 | 13.3 | 13.5 | 34.0 | 17.0 | 8.35 | 4.55 | 8.12 | −4.09 | −5.32 | −4.19 | −3.88 | 4.24 | −43.0 |
| 3M1B (mg/L) | 244.4 | 19.2 | 25.3 | 75.5 | 30.9 | 18.03 | 6.73 | 14.47 | −5.81 | −6.16 | −2.03 | −10.8 | 7.36 | −72.9 |
| AA (g/L) | 4.129 | 0.07 | −0.09 | −0.76 | −0.16 | 0.019 | 0.06 | −0.05 | 0.03 | 0.09 | −0.02 | 0.04 | −0.06 | 0.67 |
| FA (mg/L) | 461.4 | 35.6 | 43.5 | 135 | 51.1 | 28.93 | 12.4 | 27.38 | −14.8 | −15.4 | −10.5 | −16.6 | 12.2 | −135 |
| XAA | 0.312 | −0.08 | 0.03 | 0.15 | −0.03 | 0.000 | 0.02 | −0.008 | −0.02 | 0.01 | 0.03 | −0.00 | 0.01 | −0.14 |
| XHMF | 0.990 | 0.016 | 0.01 | 0.14 | 0.01 | 0.002 | −0.04 | 0.002 | −0.02 | 0.00 | −0.02 | 0.01 | 0.00 | −0.14 |
| Component | Hydrothermal | Acid Hydrolysis |
|---|---|---|
| Carbohydrates (GE/L) | 146.10 ± 17.47 a | 134.45 ± 38.60 a |
| Acetic acid (g/L) | 5.64 ± 1.15 a | 6.51 ± 0.74 a |
| HMF (g/L) | 3.40 ± 1.16 a | 6.64 ± 2.24 a |
| Fermentation Conditions | Hydrothermal | Acid Hydrolysis | ||
|---|---|---|---|---|
| Fermentation pH | 5.5 | 4.5 | ||
| Temperature (°C) | 30 | 30 | ||
| Stirring (rpm) | 200 | 200 | ||
| Initial carbohydrate concentration (GE/L) | 153.78 ± 1.04 | 142.59 ± 52.4 | ||
| Fermentation Results | Model | Villeta | Model | Villeta |
| Yeast cell viability (Log CFU/mL) | 2.08 | 1.89 ± 0.05 a | 1.57 | 1.74 ± 0.06 a |
| Carbohydrate conversion (%) | 95.1 | 95.6 | 99.8 | 95.6 |
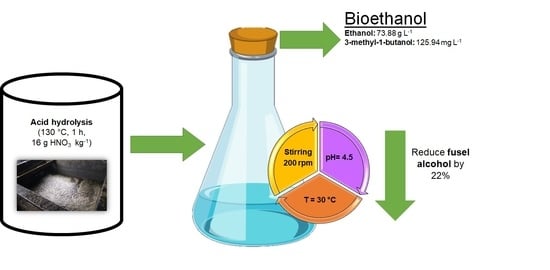
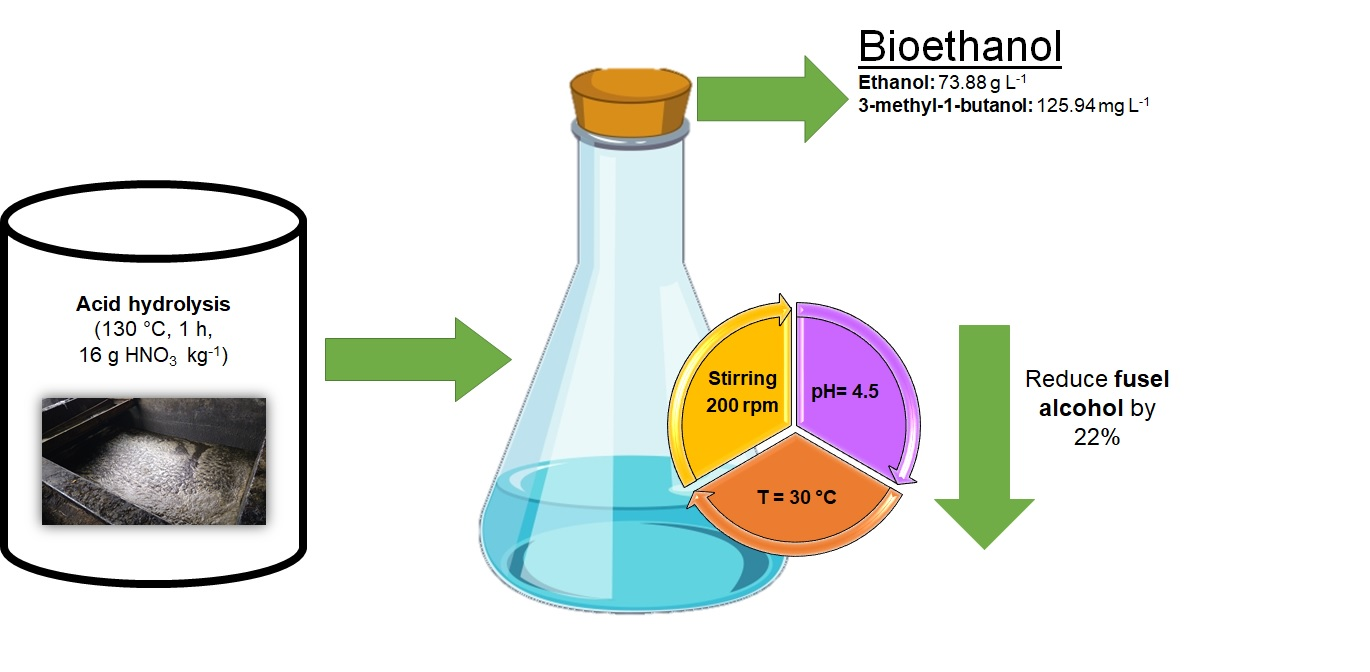
| Ethanol (g/L) | 86.49 | 80.06 ± 3.75 a | 92.58 | 73.88 ± 8.32 a |
| 3-methyl-1-butanol (mg/L) | 296.67 | 176.02 ± 4.20 a | 210.10 | 125.94 ± 23.98 b |
Publisher’s Note: MDPI stays neutral with regard to jurisdictional claims in published maps and institutional affiliations. |
© 2021 by the authors. Licensee MDPI, Basel, Switzerland. This article is an open access article distributed under the terms and conditions of the Creative Commons Attribution (CC BY) license (https://creativecommons.org/licenses/by/4.0/).
Share and Cite
Sanchez, N.; Cobo, M.; Rodriguez-Fontalvo, D.; Uribe-Laverde, M.Á.; Ruiz-Pardo, R.Y. Bioethanol Production from Sugarcane Press-Mud: Assessment of the Fermentation Conditions to Reduce Fusel Alcohol. Fermentation 2021, 7, 194. https://0-doi-org.brum.beds.ac.uk/10.3390/fermentation7030194
Sanchez N, Cobo M, Rodriguez-Fontalvo D, Uribe-Laverde MÁ, Ruiz-Pardo RY. Bioethanol Production from Sugarcane Press-Mud: Assessment of the Fermentation Conditions to Reduce Fusel Alcohol. Fermentation. 2021; 7(3):194. https://0-doi-org.brum.beds.ac.uk/10.3390/fermentation7030194
Chicago/Turabian StyleSanchez, Nestor, Martha Cobo, David Rodriguez-Fontalvo, Miguel Ángel Uribe-Laverde, and Ruth Y. Ruiz-Pardo. 2021. "Bioethanol Production from Sugarcane Press-Mud: Assessment of the Fermentation Conditions to Reduce Fusel Alcohol" Fermentation 7, no. 3: 194. https://0-doi-org.brum.beds.ac.uk/10.3390/fermentation7030194