Article

Multi-Objective Sustainability Optimization of Biomass Residues to Ethanol via Gasification and Syngas Fermentation: Trade-Offs between Profitability, Energy Efficiency, and Carbon Emissions

by
Elisa M. de Medeiros
1,2,
Henk Noorman
1,3,
Rubens Maciel Filho
2 and
John A. Posada
1,*
1
Department of Biotechnology, Delft University of Technology, van der Maasweg 9, 2629 ZH Delft, The Netherlands
2
School of Chemical Engineering, University of Campinas, Av. Albert Einstein 500, Campinas 13084-852, Brazil
3
DSM Biotechnology Center, P.O. Box 1, 2600 MA Delft, The Netherlands
*
Author to whom correspondence should be addressed.
Submission received: 23 July 2021 / Revised: 20 September 2021 / Accepted: 21 September 2021 / Published: 23 September 2021
(This article belongs to the Special Issue Biofuels Production and Processing Technology)

Abstract

:
This work presents a strategy for optimizing the production process of ethanol via integrated gasification and syngas fermentation, a conversion platform of growing interest for its contribution to carbon recycling. The objective functions (minimum ethanol selling price (MESP), energy efficiency, and carbon footprint) were evaluated for the combinations of different input variables in models of biomass gasification, energy production from syngas, fermentation, and ethanol distillation, and a multi-objective genetic algorithm was employed for the optimization of the integrated process. Two types of waste feedstocks were considered, wood residues and sugarcane bagasse, with the former leading to lower MESP and a carbon footprint of 0.93 USD/L and 3 g CO2eq/MJ compared to 1.00 USD/L and 10 g CO2eq/MJ for sugarcane bagasse. The energy efficiency was found to be 32% in both cases. An uncertainty analysis was conducted to determine critical decision variables, which were found to be the gasification zone temperature, the split fraction of the unreformed syngas sent to the combustion chamber, the dilution rate, and the gas residence time in the bioreactor. Apart from the abovementioned objectives, other aspects such as water footprint, ethanol yield, and energy self-sufficiency were also discussed.

1. Introduction

In recent years, significant progress has been achieved in the field of biobased production, especially regarding ethanol production from lignocellulosic materials such as sugarcane bagasse, corn stover, and wood residues—the so-called 2nd-generation (2G) ethanol [1]. However, 2G ethanol is still hardly competitive with sugar-based or 1st-generation ethanol, and despite the existence of several commercial-scale plants based on 2G technologies, the actual throughput remains mostly below the installed capacity [2]; most of these production routes are based on hydrolysis and sugar fermentation [3]. In contrast, gasification-based pathways are considered promising due to the alleged feedstock flexibility and the potential to convert all parts of the biomass (including lignin) [4].
Gasification has a long history of applications with different purposes (heat, electricity, chemicals, or fuels), but most large-scale gasifiers operate with coal, while biomass gasification has been applied on a far more limited scale and has mostly been used for heat and power generation as an alternative to natural gas and biomass combustion [5]. Regarding biomass-to-fuel via gasification, there are currently only eight facilities with a technology readiness level (TRL) above six that are operational or under construction/commissioning, with five of them targeting ethanol production (two operational) and only one at a commercial scale: the Enerkem plant in Alberta, Canada, which converts municipal solid waste (MSW) to syngas, with further chemical conversion to ethanol and other chemicals [6].
Syngas can also be converted to ethanol via fermentation (i.e., using microbes instead of chemical catalysts). Among the abovementioned projects, only one (by LanzaTech/Aemetis) is projected for use in a gasification–fermentation route. This plant, which is still expected to begin construction, will first convert agricultural waste to syngas via plasma gasification [6], a relatively new technology with the ability to convert nearly any type of carbonaceous material yet at still high costs and limited process understanding [7]. Gas fermentation technology is a challenge despite significant developments in the past few years, which include the construction and operation of several demonstration plants to convert basic oxygen furnace (BOF) gas, a CO-rich gas, into ethanol [8].
The integration of biomass gasification and syngas fermentation (i.e., thermo-biochemical route), has been advocated as a promising and versatile contribution to the biobased economy [9]. The understanding of this linkage may be achieved through experiments at laboratory scale, designed with the perspective of the large-scale [10]. Since data sharing regarding the operation of existing large-scale lignocellulose gasification and syngas fermentation plants is still constrained by knowledge protection laws and agreements, the use of mathematical models is necessary to gather insights regarding the large-scale. The modeling strategies for the gasification process are currently more advanced than those developed for the fermentation process. Strategies used for simulating syngas-fermenting bacteria inside large-scale bioreactors include the use of black-box models [11] and largely complex genome-scale models [12] as well as combinations of the two strategies and thermodynamics [13,14]. As for the detailed simulation of mass transfer in large-scale bioreactors that are appropriate for syngas fermentations, there is only study that is currently known, which is at an early development stage [15].
Some of the aforementioned fermentation models have been included in process simulations aimed at assessing the link between gasification and fermentation [16,17], yet little research has been conducted to explore the simultaneous effects of the process conditions and design choices of different units on the performance of the whole process or to optimize it in terms of multiple objectives [18,19]. At the same time, integrated optimization may be indispensable for the commercialization of thermo-biochemical processes. As highlighted by Ramachandriya et al. [20], different challenges arise when integrating both conversion steps (e.g., low product yield, energy requirements in the gasifier, and inhibition caused by syngas impurities), but most studies in this field have focused on the microbial physiology of syngas fermenting bacteria [21,22,23]. On the other hand, research on biomass gasification has unveiled a complex relationship between the performance of different gasifier systems and multiple process conditions (steam to biomass ratio, temperature, air equivalence ratio, feedstock moisture, etc.) [24].
In this context, the main goals of this work are (i) the development of a framework for modeling and optimizing the integrated process for ethanol production from biomass via the thermo-biochemical route by considering two types of feedstock (sugarcane bagasse and wood residues); (ii) the holistic impact analysis of the operating conditions and design parameters; (iii) the analysis of the optimal trade-offs between economic, energy, and environmental performance; and (iv) the analysis of the Pareto-optimal conditions of the multiple units involved in the process by taking into account their interactions.

2. Materials and Methods

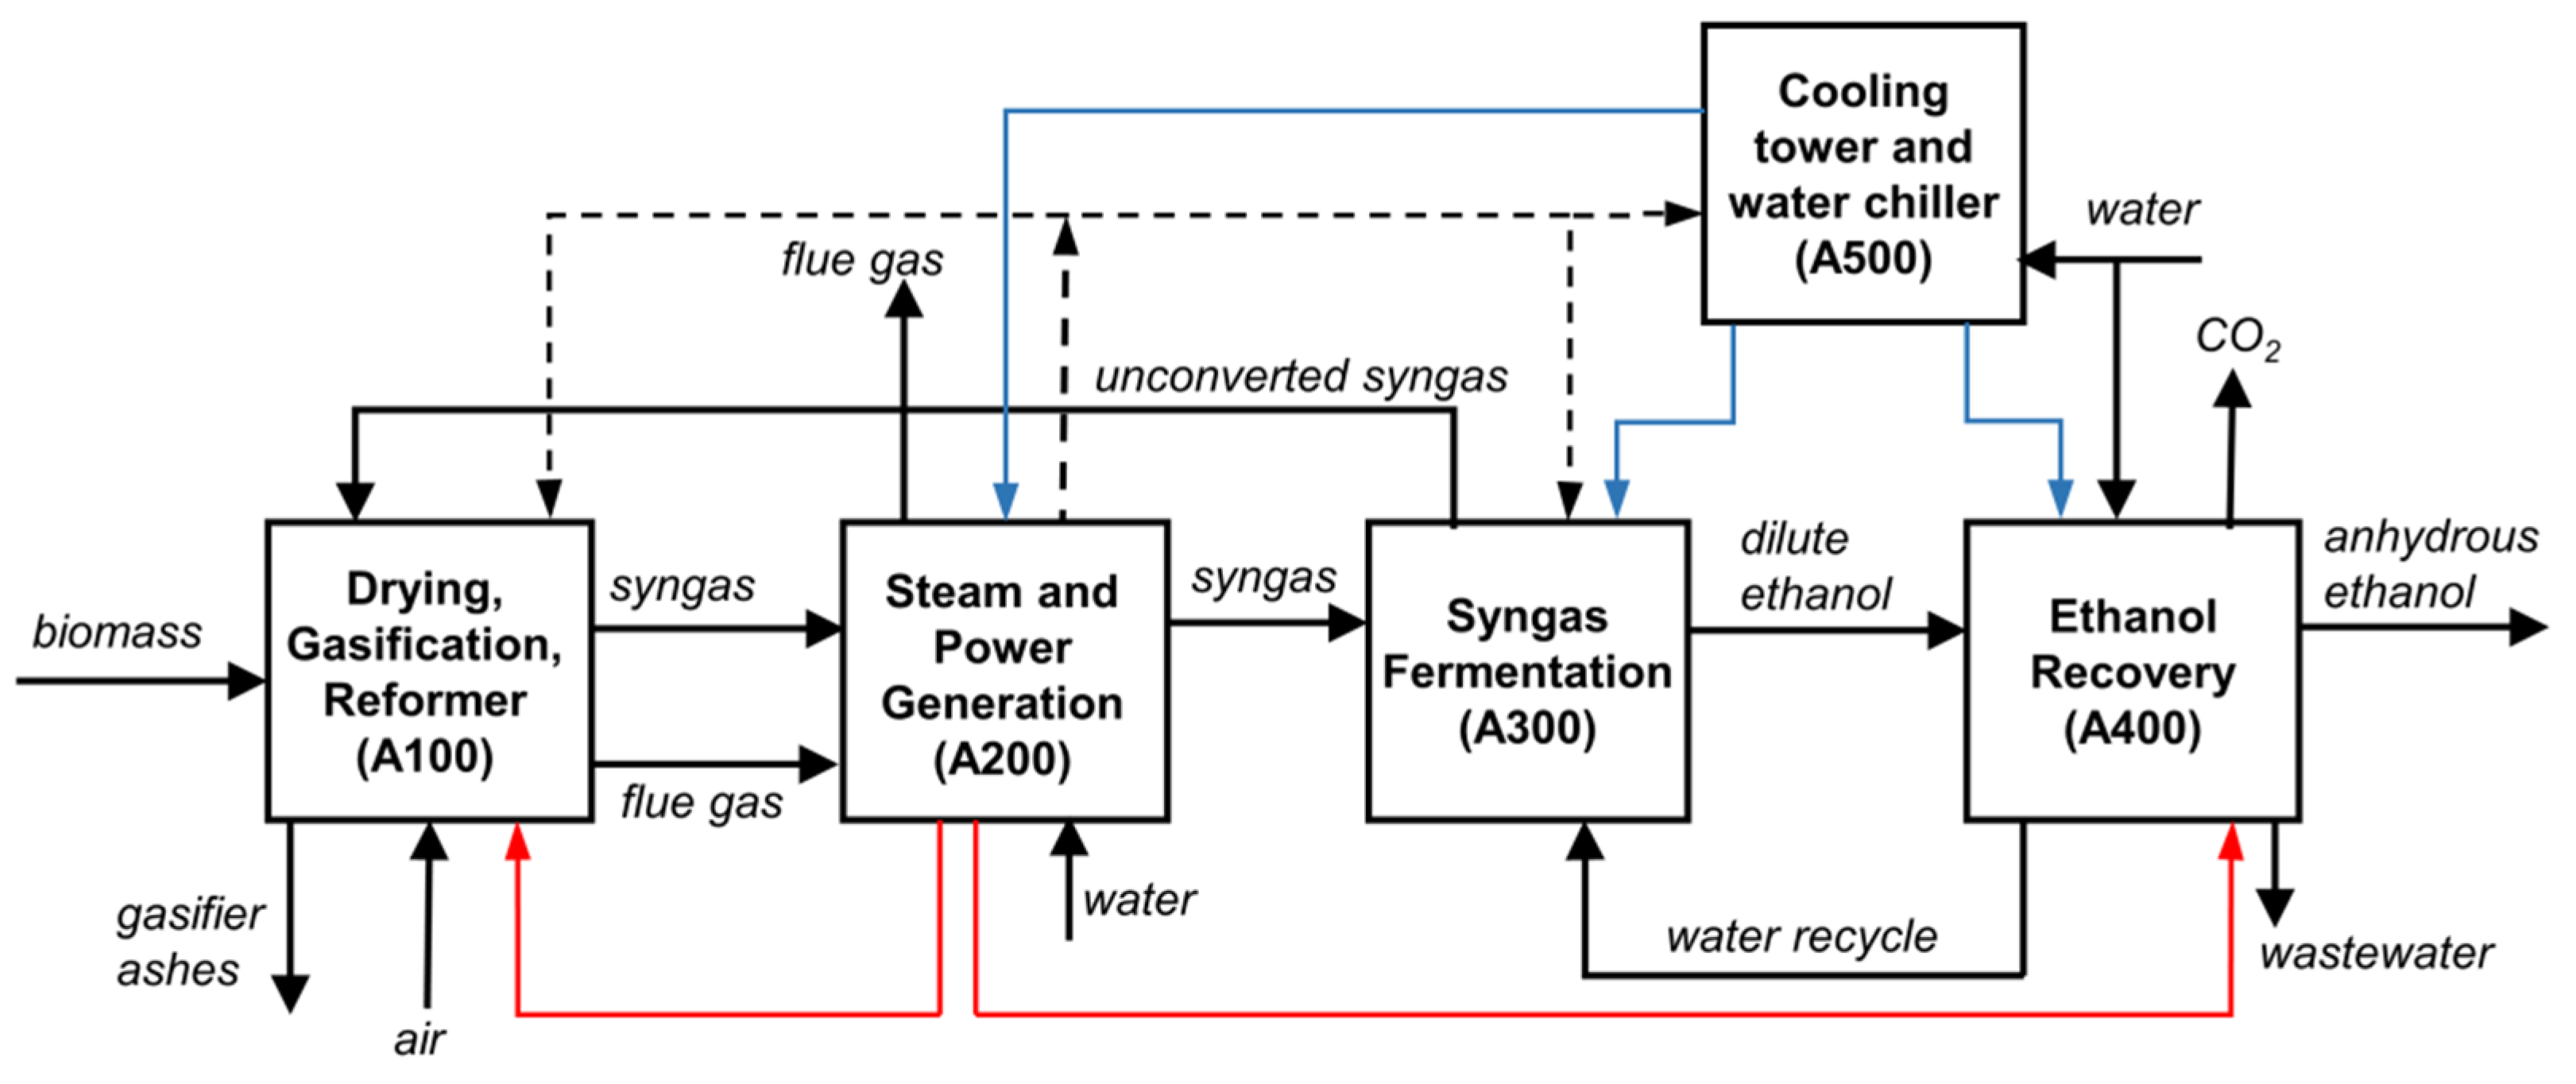
2.1. Modeling Framework

The ethanol production process is divided into five main units, as presented in Figure 1. In unit A100, the biomass feed is dried and gasified, after which the syngas is sent to a reformer. Hot streams from this unit are then cooled in A200, recovering its heat for steam and power generation, after which the cold syngas (~60 °C) is passed through a scrubber to remove contaminants. In A300, the syngas is compressed to the pressure at the bottom of the bioreactor, cooled to 37 °C, and mixed with recycled gas before being fed to the bioreactor. Cells are separated in a microfiltration membrane and recycled with a small purge, and the product stream (dilute ethanol with traces of acetic acid) is sent to A400 for ethanol recovery and purification using distillation and molecular sieves. Unit A500 produces cooling water and chilled water for the whole plant.
This section provides details about the operation of areas A100 and A200, while information about A300 and A400 can be found elsewhere [18].
Our approach to modeling syngas fermentation has been described elsewhere [17,18]. Previously we demonstrated the application of surrogate modeling and machine learning (specifically, artificial neural networks) as tools to simplify the evaluation of the responses originally obtained by rigorous models of the bioreactor and the distillation columns [18]. This strategy is repeated in the present work and is applied to the gasification model, which is described next.

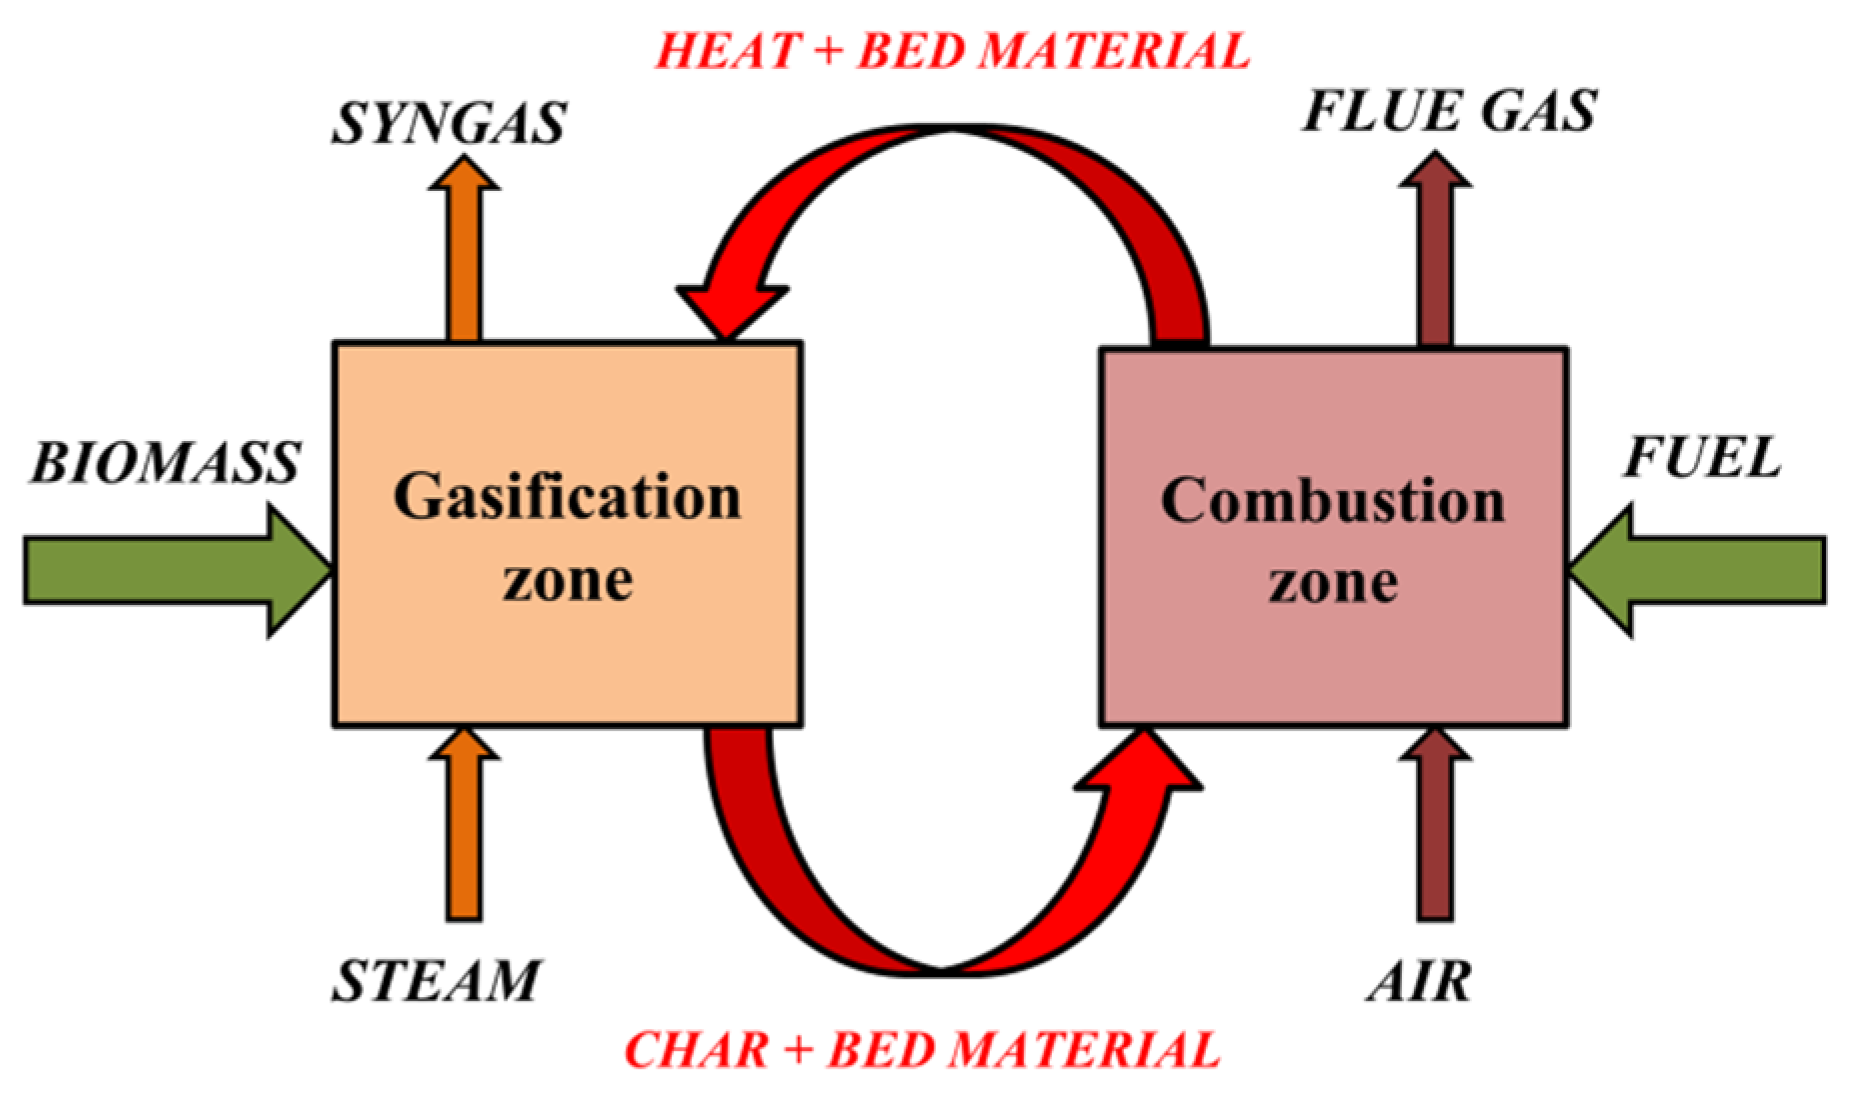
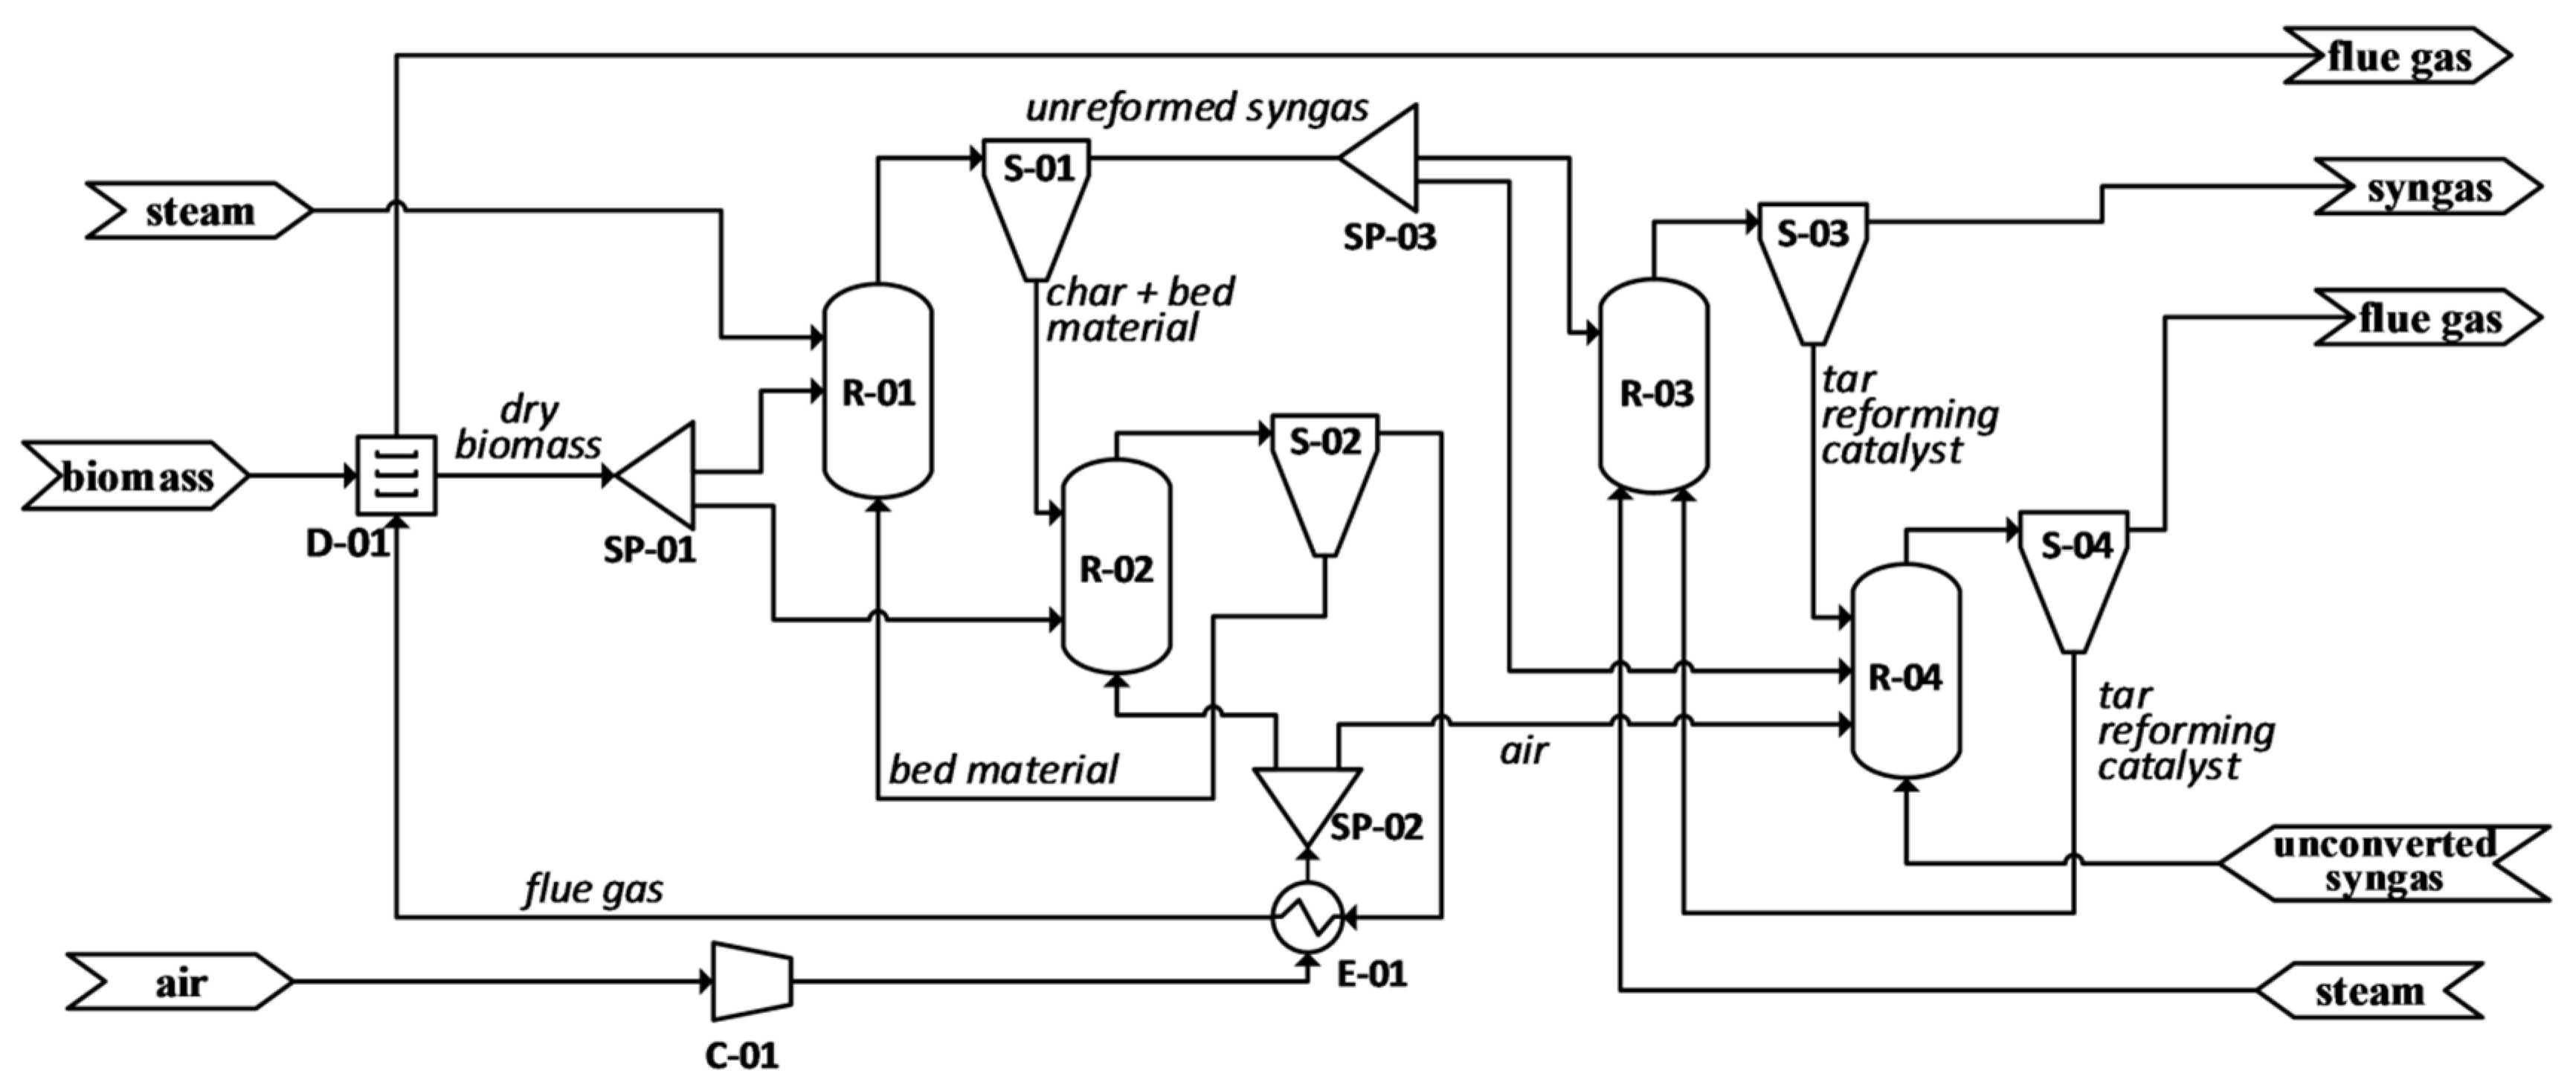
2.1.1. Drying, Gasification, and Tar Reformer (A100)

As in de Medeiros et al. [25], the gasification process consists of a dual fluidized bed gasifier with the circulation of the char and bed material between the two beds, as schematized in Figure 2. Hot flue gas from the combustion zone (CZ) is used in the air pre-heater and the biomass dryer. Since char formation is regulated by the temperature in the gasification zone (TGZ) and char is the main fuel in the combustion zone, the system in Figure 2 will reach an equilibrium point for TGZ and TCZ (temperature in the combustion zone), therefore making TGZ an output of the process instead of an input. To transform TGZ into an independent variable, we propose that other variables (namely, air flow rate and additional fuel fed to CZ) can be tuned to satisfy the energy balance for the desired TGZ, which is not necessarily at the aforementioned equilibrium point. Therefore, the gasification model proposed here comprises an optimization routine in which, for a given TGZ, we wish to minimize the square difference of the heat duty between GZ and CZ, here named Qdiff, by finding the corresponding values of three variables: AE (air excess fed to CZ), DT (temperature difference, TCZTGZ), and f (split fraction of biomass that is diverted to CZ instead of GZ). The energy difference Qdiff also considers a 2% loss of the lower heating value (LHV) of the biomass. Since we also wish to minimize the resources input for the whole process, for a given TGZ, the objective function becomes:
min [ ( Q d i f f ) 2 + ( A E ) + ( f ) + ( D T ) ] = f ( T G Z , A E , f , D T )
The calculation of the energy difference Qdiff starts by estimating the outcomes of the gasification zone (syngas and char yields, and compositions), for which we use temperature-dependent correlations, which were previously adopted by NREL [26]. These correlations are second-degree polynomial functions of TGZ that predict the yield of the syngas (scf/lb maf biomass) and the mass fractions (dry basis) of its main components (i.e., CO, CO2, H2, CH4, C2H4, C2H6, C2H6, C2H2, C6H6). Although there is a correlation for the char yield, we follow NREL’s recommendation of instead using the following algorithm based on the elemental balances: (i) for carbon, determine the total amount of C in the syngas from the results of the correlations and consider any remaining C to be in the form of char; (ii) for oxygen, assume that at least 4% of O in biomass ends in the char; then, if the O balance results in a deficit of this element, the water is decomposed. If there is an excess of O, then the exceeding amount is assumed to also be in the char; (iii) for sulfur, assume that at least 8.3% of the S in biomass is in char and that the remaining S is converted to H2S in the syngas; (iv) for nitrogen, assume that at least 6.6% of the N in biomass goes into the char and that the remaining is converted to NH3 in the syngas; (v) for hydrogen, determine the total amount of H in all of the components of the syngas and consider the remaining H to be in the char. To be coherent with the correlations, other conditions were assumed to be fixed and equal to the experiments described by the correlations, i.e., biomass moisture entering the GZ equal to 10% and steam to biomass ratio SBR = 0.4 kg/kg dry biomass.
To calculate Qdiff, the gasification unit was simulated in Aspen Plus following the flowsheet presented in Figure 3. The Aspen flowsheet is presented in Figure S1 in the Supplementary Materials. Biomass was specified as a non-conventional component described by its heating value and composition given by proximate and ultimate analyses. These can be found in de Medeiros et al. [25] and Capaz et al. [27], for bagasse and wood residues, respectively (see also Table S1 in the Supplementary Materials). For each temperature, the results of the GZ algorithm explained above were used as input in the yield reactor representing the GZ (R-01). A combustion reactor (R-02) is a stoichiometric reactor that is fed with the char generated in GZ, as well as the biomass that may be diverted for this use in the splitter (SP-01). In the simulation, there was also a yield reactor (not depicted in Figure 3) to transform the non-conventional component biomass into conventional components that could participate in combustion reactions. The dryer (D-01) was modeled in Aspen with a stoichiometric reactor and flash operation: the former converts the non-conventional biomass stream into a stream containing biomass and H2O, which is later separated in the flash operation. The amount of H2O generated in this stage is the difference between the initial moisture of the wet biomass and the final desired moisture of 10%. The output Qdiff is then the sum of the three heat streams related to these operations: the decomposition of nonconventional biomass, the gasification reactions R-01, and the combustion reactions R-02. The tar reformer was simulated as a stoichiometric reactor where the conversions of CH4, C2H6, C2H4, and tars into CO and H2 take place in fixed amounts, i.e., 80%, 99%, 90%, and 99%, respectively (the same as those adopted by NREL [26]). The heat duty was calculated in Aspen, and it was assumed to be provided by the combustion of the unconverted syngas from A300 as well as by a fraction of the unreformed syngas from the gasifier. The latter can be adjusted to not only meet the requirements of the tar reformer but to also increase the amount of energy available for steam/electricity production in A200.
The minimization problem (Equation (1)) was solved in MATLAB for a range of TGZ. Since the calculation of QDIFF and other the outputs require the Aspen simulation, one possible approach is to link both programs and to run the simulation every time the objective function needs to be evaluated. However, to make the framework more robust and to reduce the number of simulation runs, we instead decided to train artificial neural networks (ANNs) with the data generated in Aspen for multiple combinations of inputs (TGZ, AE, f, DT). This procedure was previously explained in a different case [18]. These surrogate models were then used in the optimization problem, which was solved with fmincon in MATLAB. The ranges used to obtain the data were TGZ between 700–1000 °C; AE between 10–150%; f between 0–0.5; and DT between 30–100 °C.

2.1.2. Heat Recovery and Power Generation (A200)

Energy is recovered from three streams of hot gases: syngas from the tar reformer, flue gas from the char combustor, and flue gas from the tar reformer/combustor (catalyst regenerator). These hot gases are used as energy inputs in a Rankine cycle with reheat (Figure 4) to produce electricity. In this cycle, there are two expansion stages (ST-01 and ST-02) with an intermediate re-heating operation (E-02) to increase the energy efficiency. In the 2nd stage, a slipstream is extracted to provide steam for the gasification and as process heat (for the distillation). The specifications of inlet/outlet pressure and temperature at the turbine were considered the same as those reported by NREL [26]. Since the properties (mass flow and temperature) of the hot streams are not fixed (i.e., they depend on the conditions of the process), the heat exchanger network (represented in the flowsheet by the exchangers E-01, E-02, and E-05) is designed with an algorithm that roughly maximizes the sensible heat that can be transferred from the hot to the cold streams. In this unit, the mass flow rate of the water/steam circulating in the Rankine cycle is set to meet the plant targets of electricity and steam consumption, but if heat is still available, then more water is provided to increase electricity production. This is achieved by a small optimization routine to maximize the amount of water while respecting the 1st and 2nd laws of thermodynamics.
Electricity generated in unit A200 is used to supply the gas compressors, air blowers, and pumps in the entire plant, as well as the water chiller (which produces chilled water for the bioreactor that must be kept at 37 °C). After heat recovery, the reformed syngas stream is further cooled to 60 °C using cooling water, and is fed to a scrubbing system following the same specifications as adopted by Dutta et al. [26], i.e., comprising a venturi scrubber, cyclone separator, and a quench water circulation system with a small purge and freshwater makeup.

2.2. Evaluation of Model Outputs and Multi-Objective Optimization

The modeling framework considers nine decision variables for the overall process optimization: in A100, (i) the TGZ (temperature in the gasification zone of the gasifier), and (ii) fs (fraction of unreformed syngas sent to combustion) are considered; in A300, (iii) the Drate (dilution rate in the bioreactor), (iv) GRT (gas residence time, defined as the volume of liquid divided by fresh gas volumetric flow), (v) GRR (gas recycle ratio), (vi) L (column height), and (vii) VR (volume of bioreactor) are considered; and in A400, (viii) the SFC1 (mass ratio of side stream to feed stream in the first distillation column) and (ix) RRC2 (molar reflux ratio in the second distillation column) are considered. The sustainability performance is measured by four types of responses: (i) economic; (ii) energetic; (iii) carbon footprint; and (iv) water footprint. The variable fs is used to regulate the amount of energy (electricity and heat) that is produced inside the plant: if fs is too high, the process exports energy and produces less ethanol; if it is too low, then the energy must be imported, which therefore increases the carbon footprint of the process and the utility cost. There is, of course, a point at which the process becomes self-sufficient, but it does not necessarily correspond to optimal process in terms of all of the sustainability criteria. The optimization was conducted for two feedstocks: sugarcane bagasse and wood (eucalyptus) residues.
The capital costs were calculated following the bare module costing technique detailed in Turton et al. [28]. For the gasification unit and steam turbine, the base costs were taken from NREL [26] and were corrected for inflation to the year 2019. The capacity was considered the same for both case studies: 2000 tonnes of dry biomass per day. The costs of heat exchangers, pumps, air blowers, and towers were calculated with the purchase–cost correlations available in Turton et al. [28]. For all types of equipment, the capacity ranges were respected by dividing the equipment into more units if necessary (for example, if the calculated heat exchanger area is greater than 1000 m2). The economic performance indicator used for the optimization is the minimum ethanol selling price (MESP), i.e., the price to achieve NPV = 0. Other economic assumptions were the same as those in de Medeiros et al. (2020).
Table 1 presents the considerations of the prices and carbon footprint (emission factors) associated with raw materials and utilities used in the process. The costs of other raw materials, such as olivine and the tar reformer catalyst, were taken from NREL [26] and were assumed to have negligible carbon footprint contribution. It is worth mentioning that the fermentation nutrients were excluded from the analysis since they could not be calculated with our model, but they were not expected to have a significant impact on either MESP or CO2 emissions, as shown in [16]. In an LCA study using data from LanzaTech, Handler et al. [29] reported that inputs such as nutrients, water, and chemicals together amounted to 9–20% of the CO2eq emissions related to feedstock procurement (corn stover, switchgrass, or forest residue). Regarding the carbon footprint of lignocellulosic feedstocks (sugarcane bagasse or eucalyptus residues), these are considered here as co-products instead of waste, i.e., a fraction of the impacts associated with the production of sugarcane/ethanol or eucalyptus are allocated to the residual biomass according to their economic value [30].
The energy efficiency considered here reflects how much of the energy input from biomass and heat/power (if these are not produced inside the plant) is available in the final product (anhydrous ethanol). If there is an excess of electricity production, for example, the carbon footprint of the process will be lower, but so will the energy efficiency. Finally, the water footprint is the total water consumed in the process divided by the production rate of ethanol. Cooling water make-up due to losses from evaporation, drift, and blowdown were assumed to be 0.4% of the total cooling water consumption.
Prior to the multi-objective optimization, a sensitivity analysis was conducted to determine the correlations between the input and output variables as well as the correlations between different responses. For the latter, principal component analysis was applied to a set of responses obtained under different combinations of input variables (4000 points), and the values of the main component coefficients (also called loadings) were used to interpret the correlations between the responses and thus to reduce the number of objectives. With the final set of objectives, the multi-objective optimization was then conducted in MATLAB using a genetic algorithm. The search ranges of the decision variables are shown in the Results section together with the ranges of the optimal Pareto results in Table 2 (Section 3.4).

3. Results and Discussion
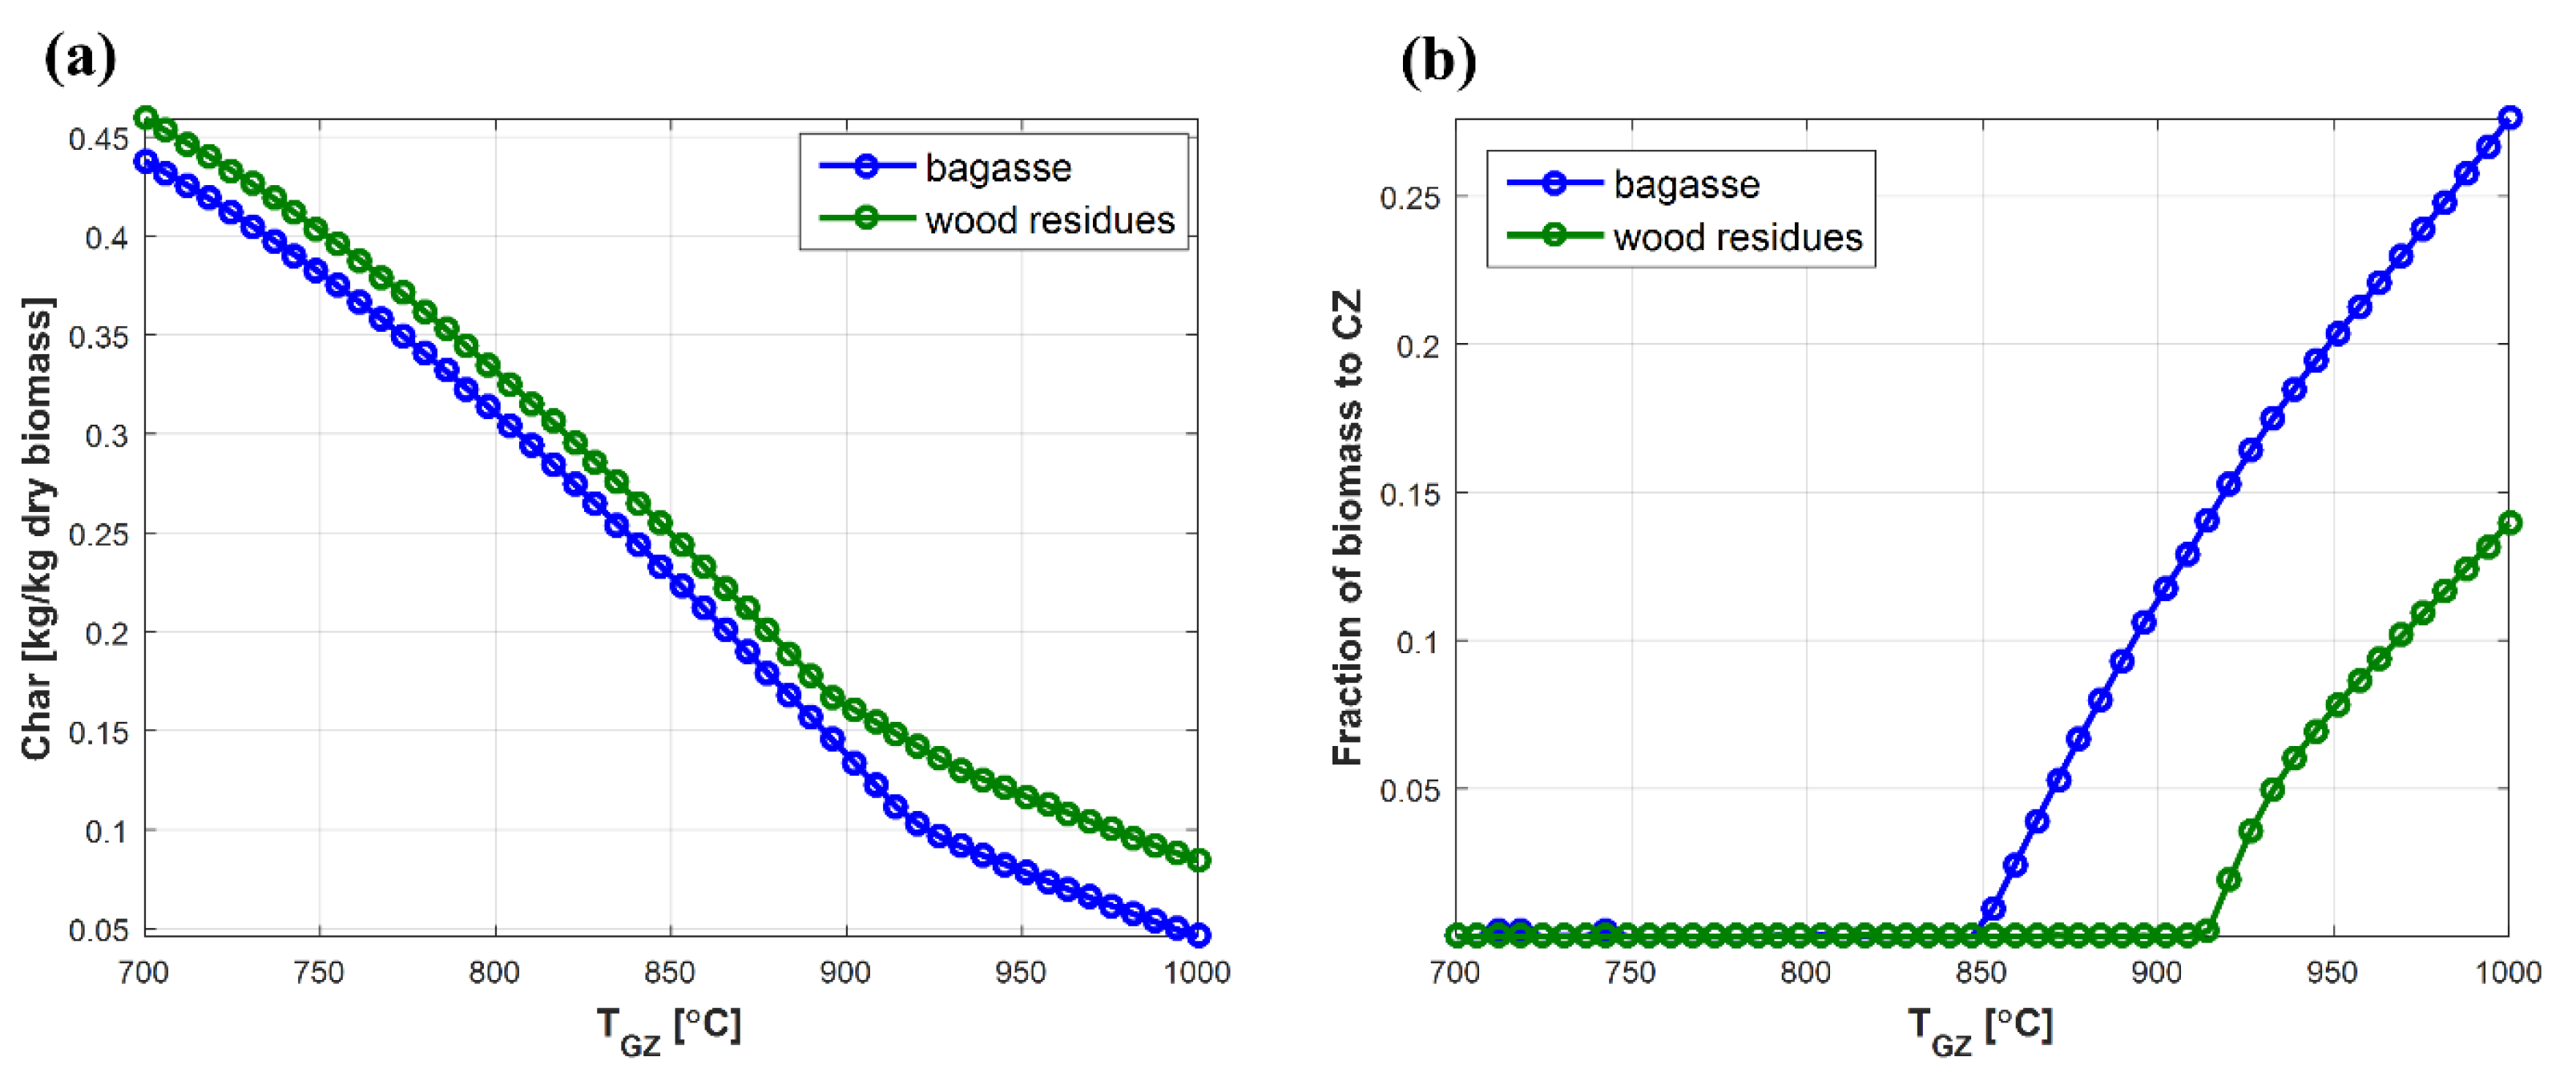
3.1. Gasification

As explained in Section 2.1.1, the gasification model expands the NREL algorithm [26] by tuning other process conditions to maintain a desired temperature in the gasification zone. The main results are presented in Figure 5 and Figure 6. In Figure 5, the compositions are shown for bagasse only, but since the model uses temperature-dependent correlations for the dry molar fractions in the gas phase, there are virtually no differences between the dry composition obtained for the two feedstocks. This is certainly a limitation of the model because it means the feedstock composition has no effect on the dry gas composition; however since the differences are small (e.g., the bagasse has lower carbon content, 46.96% against 50.89%, as shown in Table S1 in the Supplementary Materials), we can assume that in view of the whole process and by recalling that the moisture at the entrance of the gasifier is the same (i.e., 10%), the main distinctive aspects of the feedstocks will be the initial moisture (50% for bagasse and 12% for wood), price, and carbon footprint. It is worth mentioning that the composition correlations were developed for different types of wood; hence, it is safe to affirm that the gasifier model is more accurate for eucalyptus residues.
Differences in feedstock composition are compensated in the char yield, which is therefore lower for bagasse (Figure 6a). Another difference can be observed in the fraction of biomass that must be diverted to the combustion zone to maintain the desired temperature in the gasification zone (Figure 6b): in the case of bagasse, the fraction rises from zero at a lower temperature than the wood resides, not only due to the feedstock composition but also due to the heating value, which is lower for bagasse (16.05 MJ/kg against 18.61 MJ/kg, dry basis).
Another limitation of the model is the inability to predict the formation of toxic HCN. Although it is produced in much lower amounts than NH3 [31], HCN has been reported to be the main reason behind the shutdown of the INEOS Bio gasification–fermentation plant in Florida [32]. On the other hand, recent studies have suggested that the syngas-fermenting microbe Clostridium ljungdahlii can adapt to the presence of cyanide and can achieve similar growth performance as it can without the contaminant [33]. Moreover, HCN removal from syngas can be accomplished through different cleaning processes, such as absorption into an aqueous solution followed by alkaline chlorination or oxidation or even direct through decomposition using heterogeneous catalysts during the gasification process [34]. It may be hypothesized that INEOS Bio underestimated the amount of HCN that would be produced in the gasifier and then, with the plant already constructed, it might have been too problematic to include further cleaning stages.

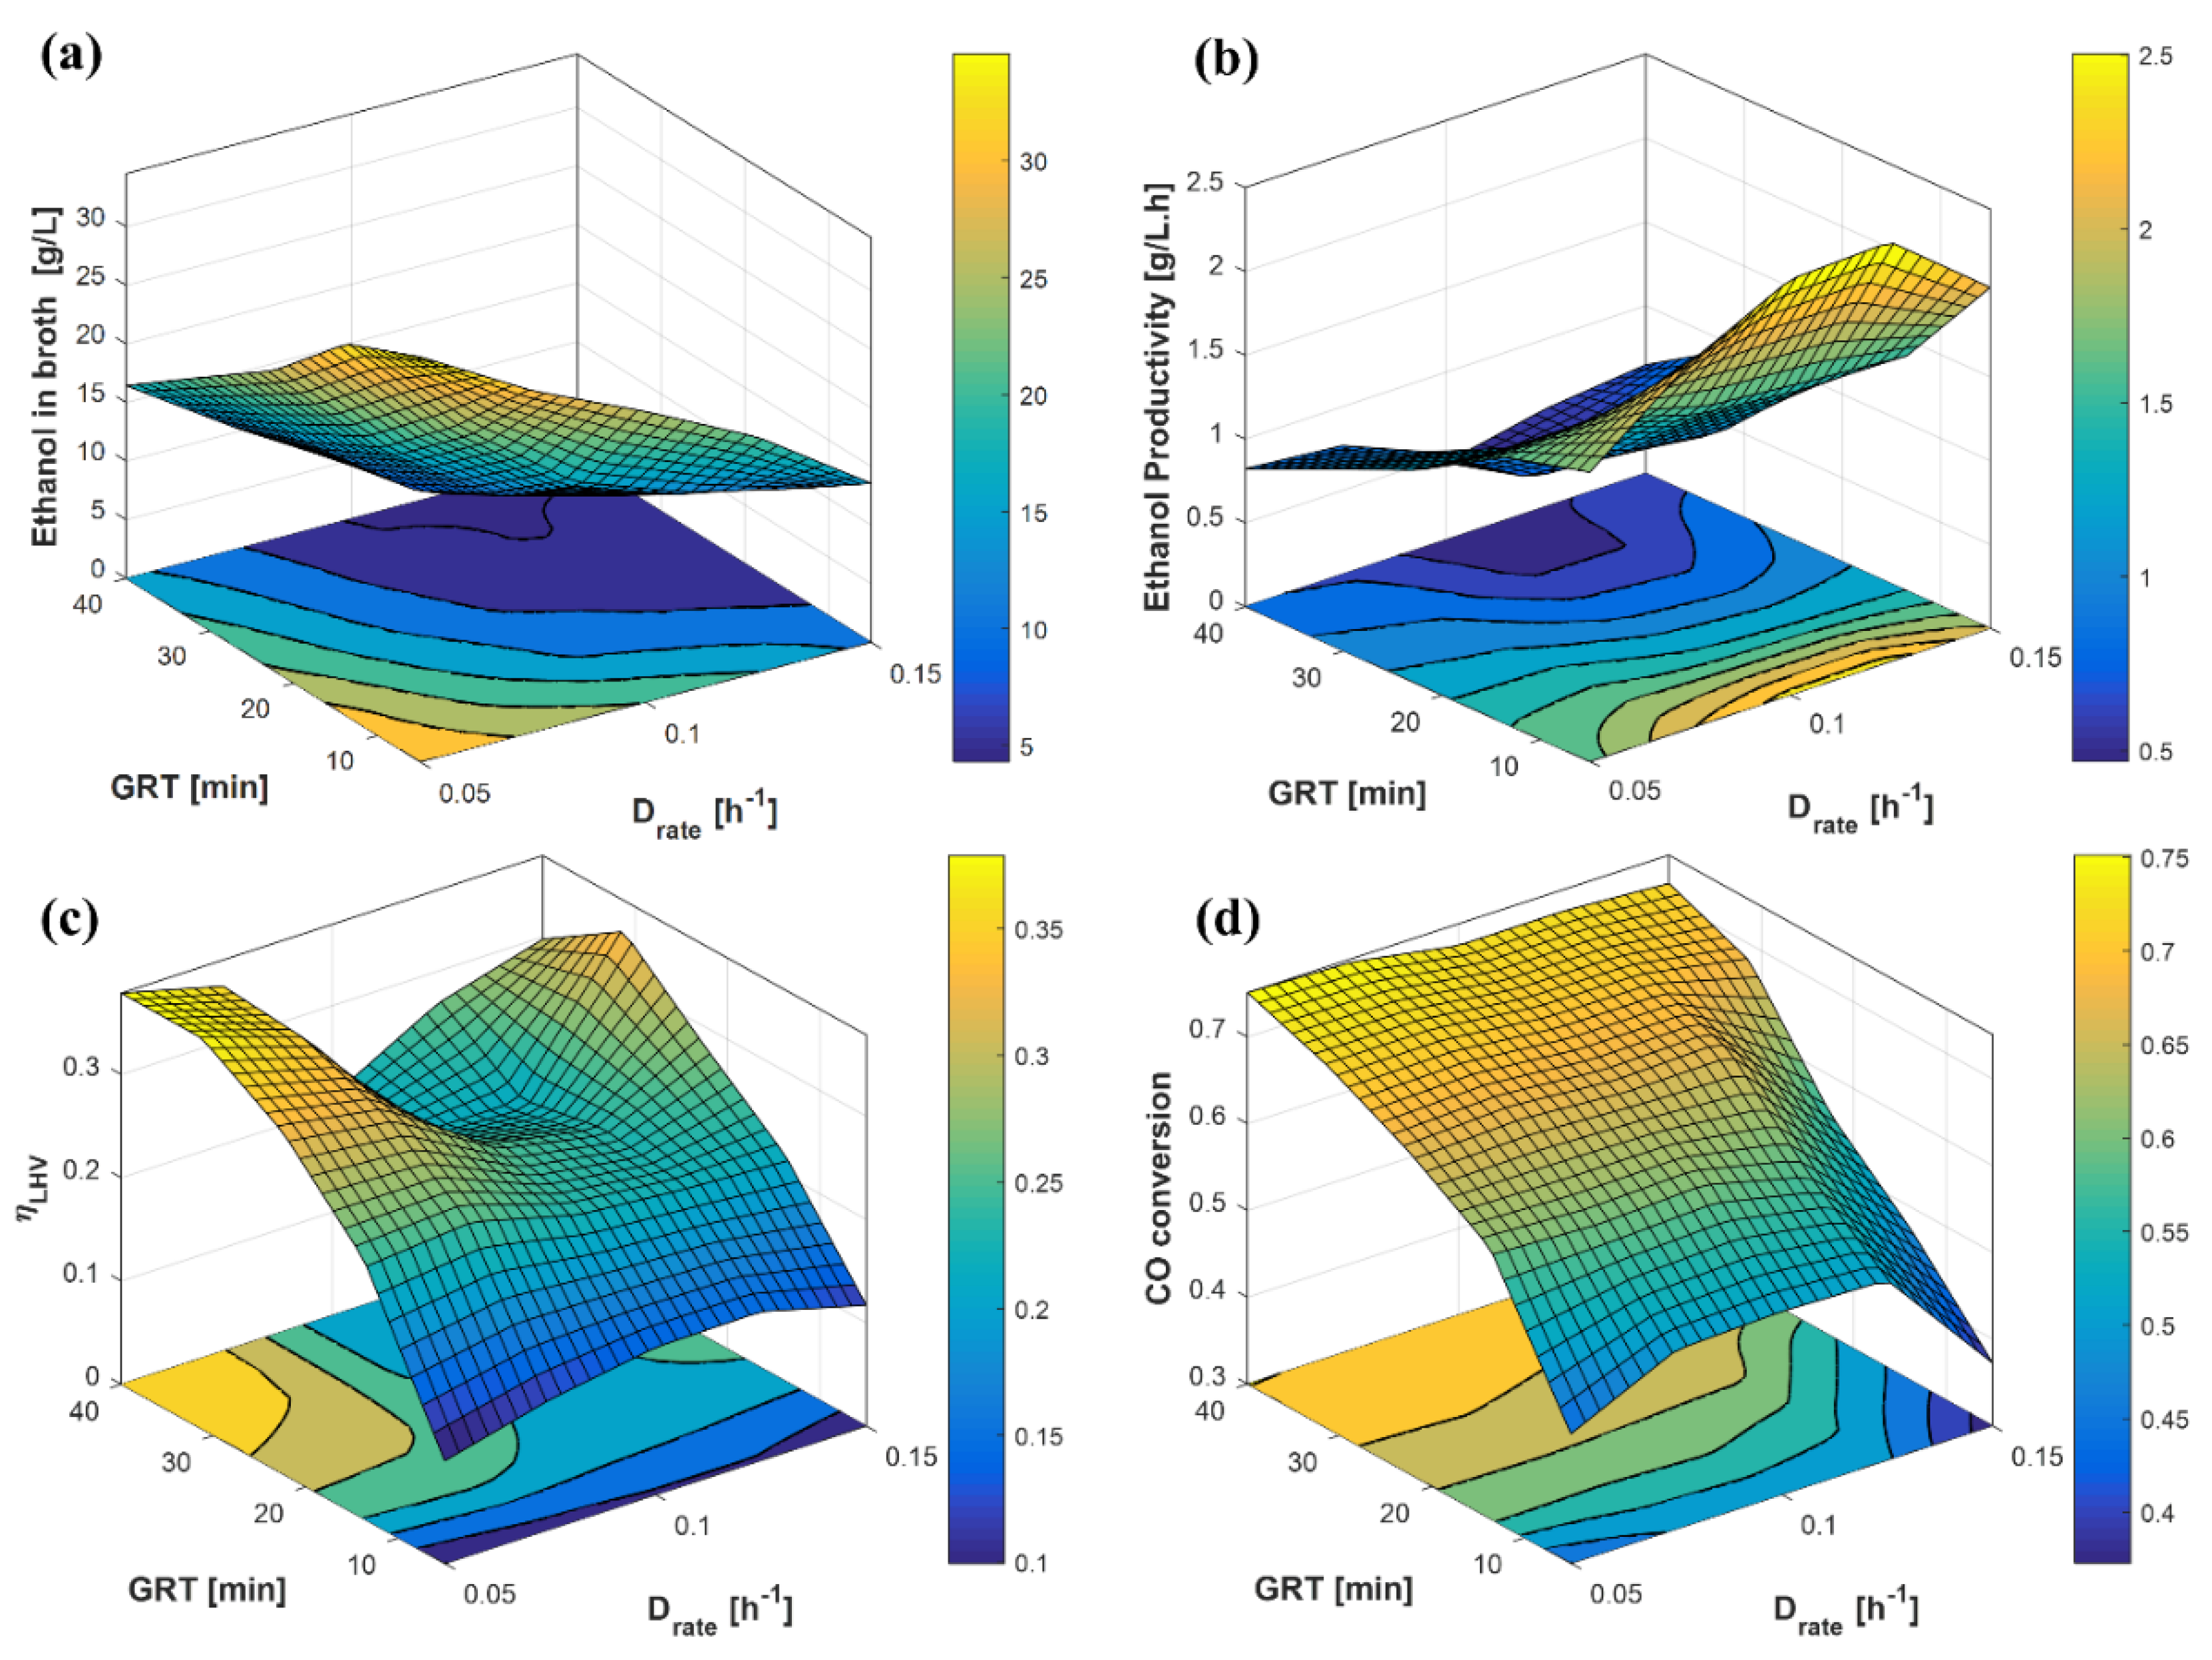
3.2. Bubble Column Bioreactor

A bubble column bioreactor is affected by several variables. For the optimization study, five variables were direct inputs of this unit (Drate, GRT, GRR, L, VR), but other variables were fixed (e.g., cell recycle ratio, at 0.85), or they were outcomes from other units (e.g., syngas composition). In a previous study [11], we showed how the syngas composition affects the gas conversion and ethanol productivity predicted by the biokinetic model. Figure 7 presents the main performance indicators of the bubble column reactor for different values of Drate and GRT, with the syngas molar composition fixed at (CO:H2:CO2) = (0.4:0.5:0.1), column height L (m) = 40, volume VR (m3) = 500, and no gas recycling (GRR = 0). The responses presented in Figure 7 are conflicting and cannot be optimized simultaneously: for example, the highest ethanol titers are achieved under very low Drate (<0.075 h−1) and GRT, while the highest CO conversions are achieved with high GRT. The energy efficiency ηLHV is also favored under high GRT (due to higher conversion), but the productivity is favored at low GRT, achieving a maximum close to Drate = 0.1 h−1.

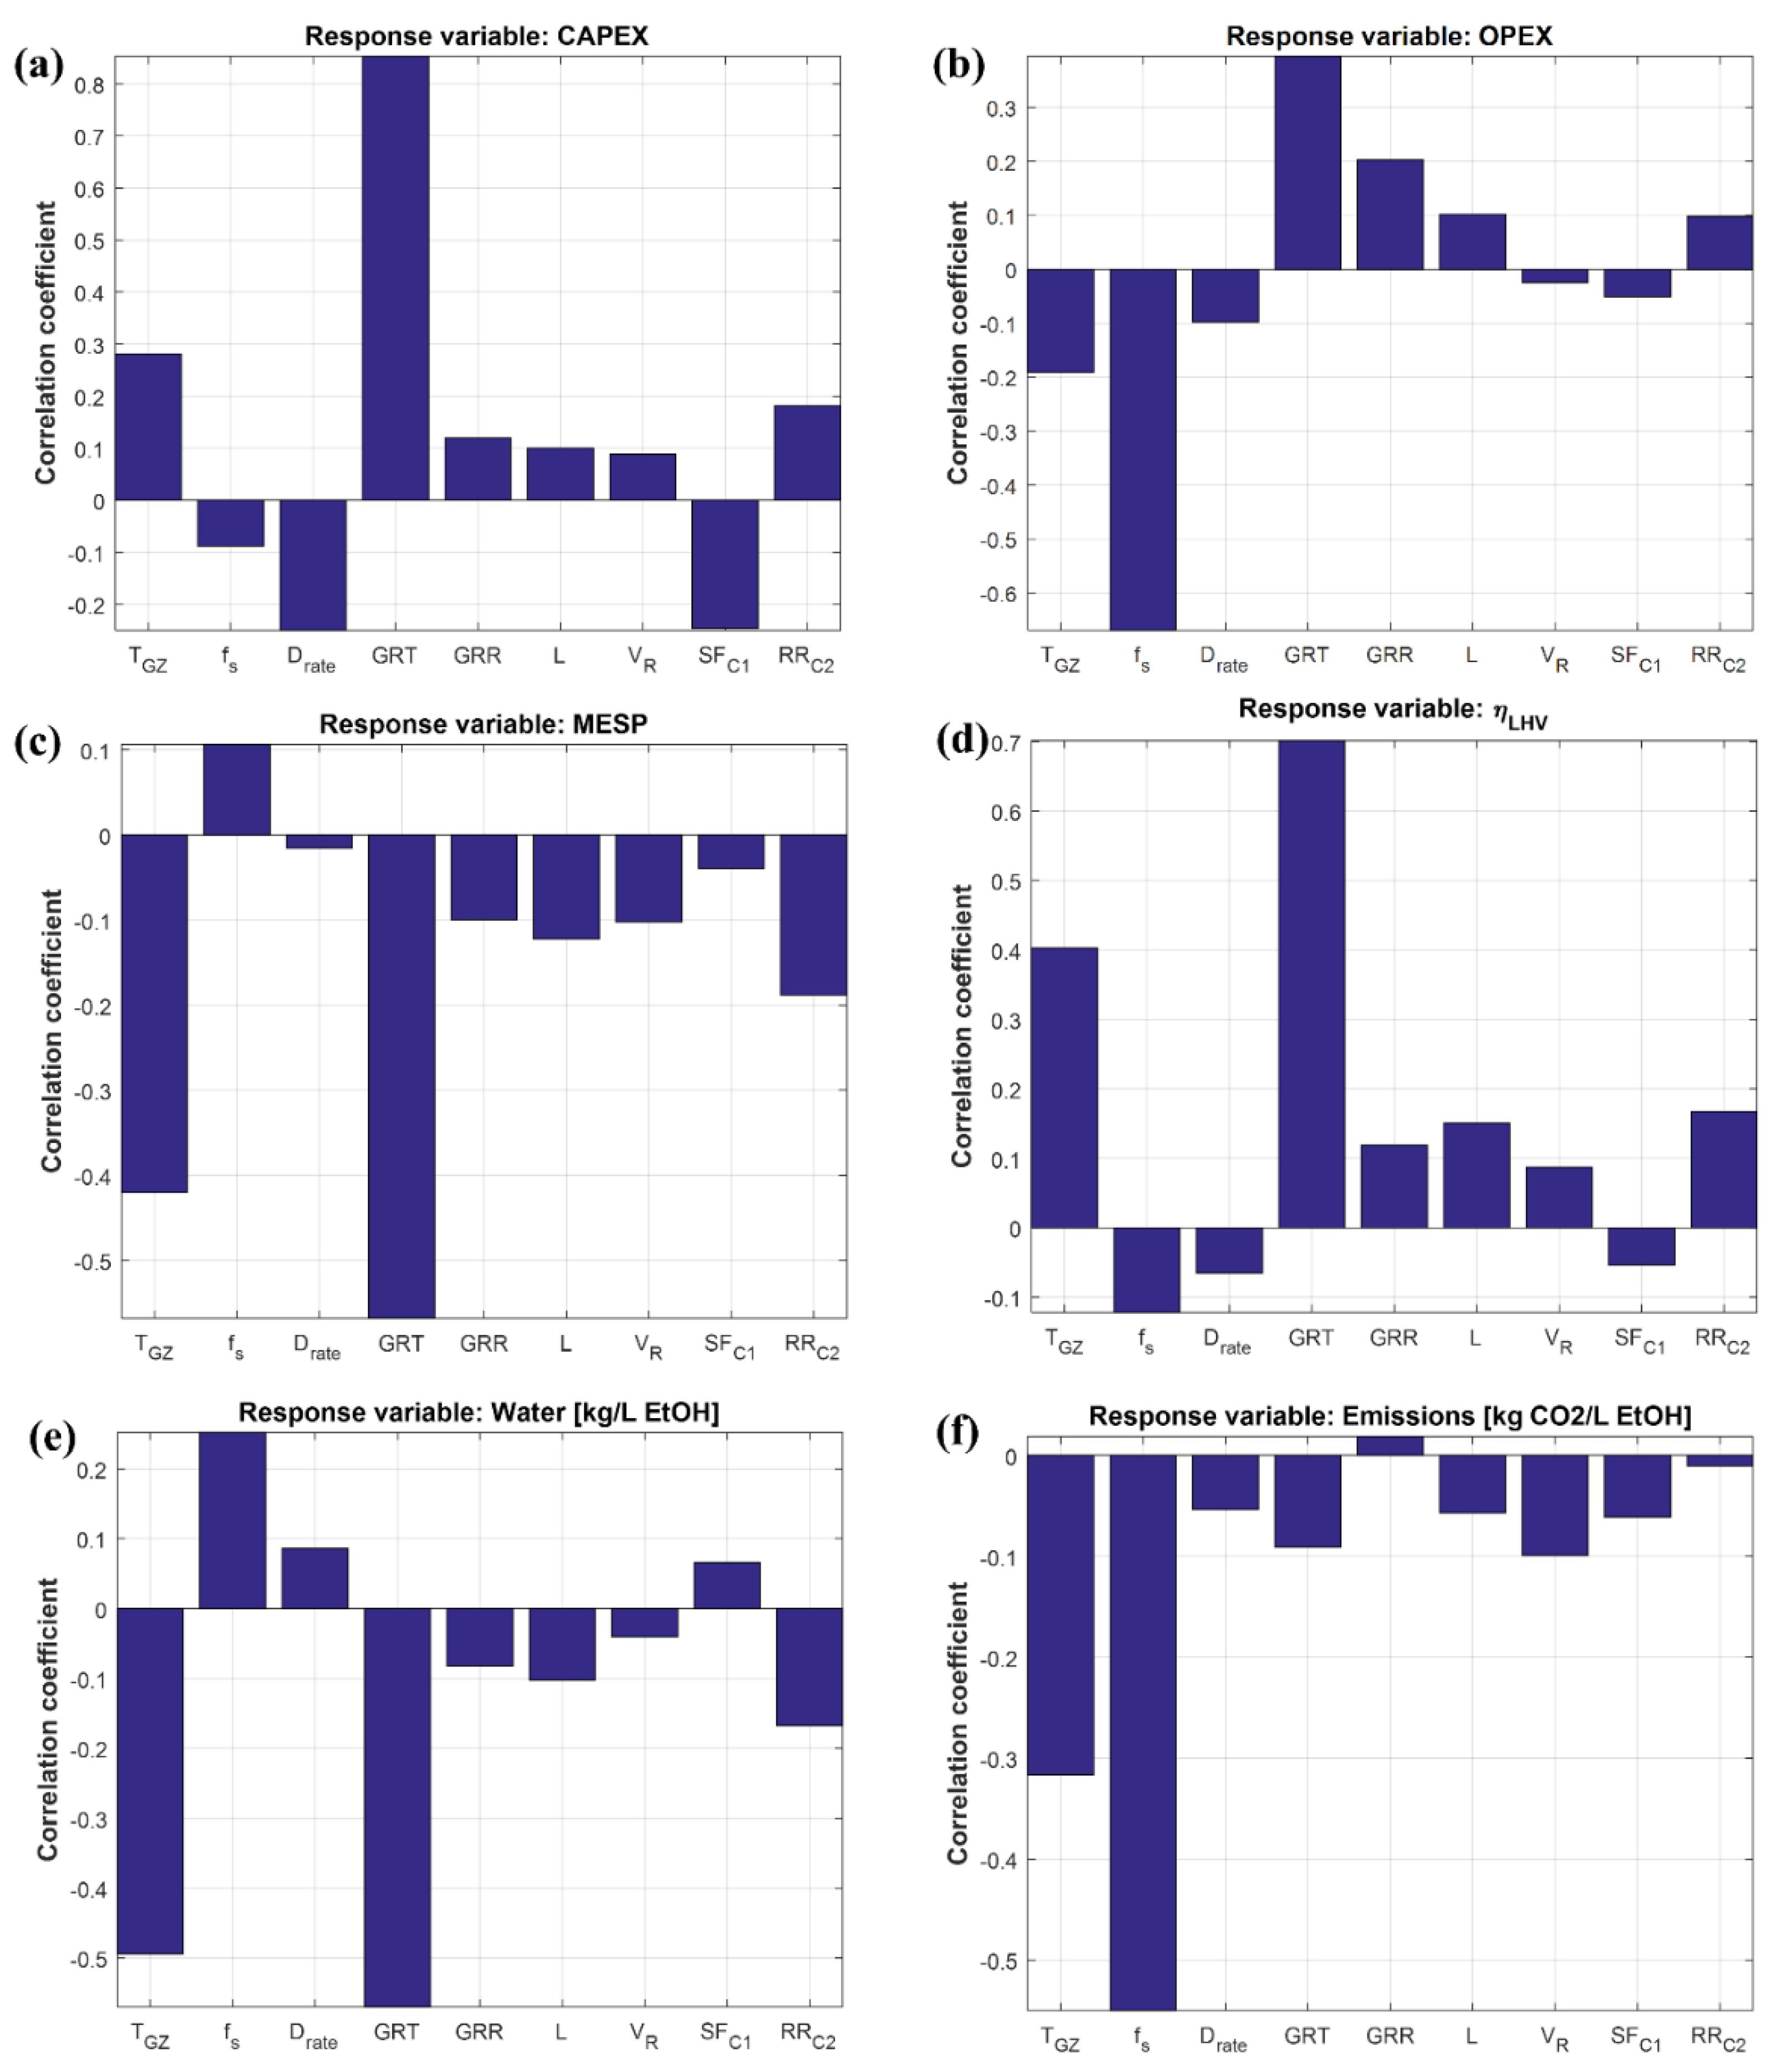
3.3. Global Effects of Input Variables and Correlations between Responses

Within the framework of the entire production process, the model was first used to predict the relevant responses to a set of combinations of decision variables. The results were then used to calculate the correlation coefficients between the decision variables and each of the responses, which are presented in Figure 8. First, it is worth noting that all of the decision variables have absolute correlation coefficients greater than 0.1 for at least one of the responses; for this reason, all of them are kept in the optimization problem. Second, TGZ, fs, and GRT dominate, with the highest correlation coefficients for all of the responses. Moreover, a few interpretations can be highlighted.
GRT is a measure of the amount of fresh syngas fed to the bioreactor: for a fixed reactor volume, the higher the value of GRT, the lower the fresh gas volumetric flow rate fed to each vessel, which means that for the same syngas production rate (an outcome of the gasification unit), the number of reactor vessels must be increased, hence the large positive effect on CAPEX. The effect on OPEX is not straightforward because as seen in Figure 7, increasing the GRT increases the gas conversion but also decreases the ethanol titer (which means that more resources are used downstream). MESP and ηLHV show similar correlation coefficients but with opposite signs, also meaning that lower values of MESP are an indication of higher energy efficiency. The effect on the water use is approximately opposite to the energy efficiency, corroborating that higher energy use per liter of the product also prompts a higher cooling water requirement and therefore, more water make-up.
The split fraction of the unreformed syngas that was diverted to combustion (fs) has large negative effects on both, the OPEX and the carbon footprint, since increasing fs implies decreasing the input of external energy to the plant, hence lower costs and CO2eq emissions. However, as seen in Figure 8c, fs also has a small positive effect on MESP, meaning that the abovementioned gains are overshadowed by the reduced ethanol production.
Although increasing the temperature in the gasification zone (TGZ) means sacrificing more biomass to combustion (Figure 6b), this loss is compensated by the reduced formation of char (Figure 6a), thus a higher syngas yield, plus a higher production of H2 (Figure 5), which favors ethanol production during fermentation. The small increase in CAPEX (probably due to higher gas flow rates) is therefore repaid by these gains, as observed with the correlation coefficients of this variable compared to other responses.
To conduct the sustainability optimization, MESP was elected as the main economic indicator, while the other responses shown in Figure 8, apart from CAPEX and OPEX, were initially considered as objectives. The results of the correlation analysis described above also indicated existing correlations between the responses (e.g., between MESP, ηLHV, and water); such hypothesis was verified using principal component analysis (PCA). PCA takes a set of multidimensional data and reduces the dimensions by creating new variables (principal components) that are linear combinations of the original variables. The values of these linear coefficients (sometimes called loadings) can then be compared to find correlations among the variables. In the present case, two principal components were found to explain more than 90% of the variance in the original data set; therefore, the coefficients of the first two components provide an accurate overview of these correlations, as depicted in Figure 9. As expected, MESP, −η, and water use are clustered in the same region with similar coordinates. Based on these results, we decided to exclude the water footprint from the multi-objective optimization and to proceed with three minimization objectives only: (i) MESP, (ii) −η (because one of the goals is to maximize the energy efficiency), and (iii) carbon footprint.

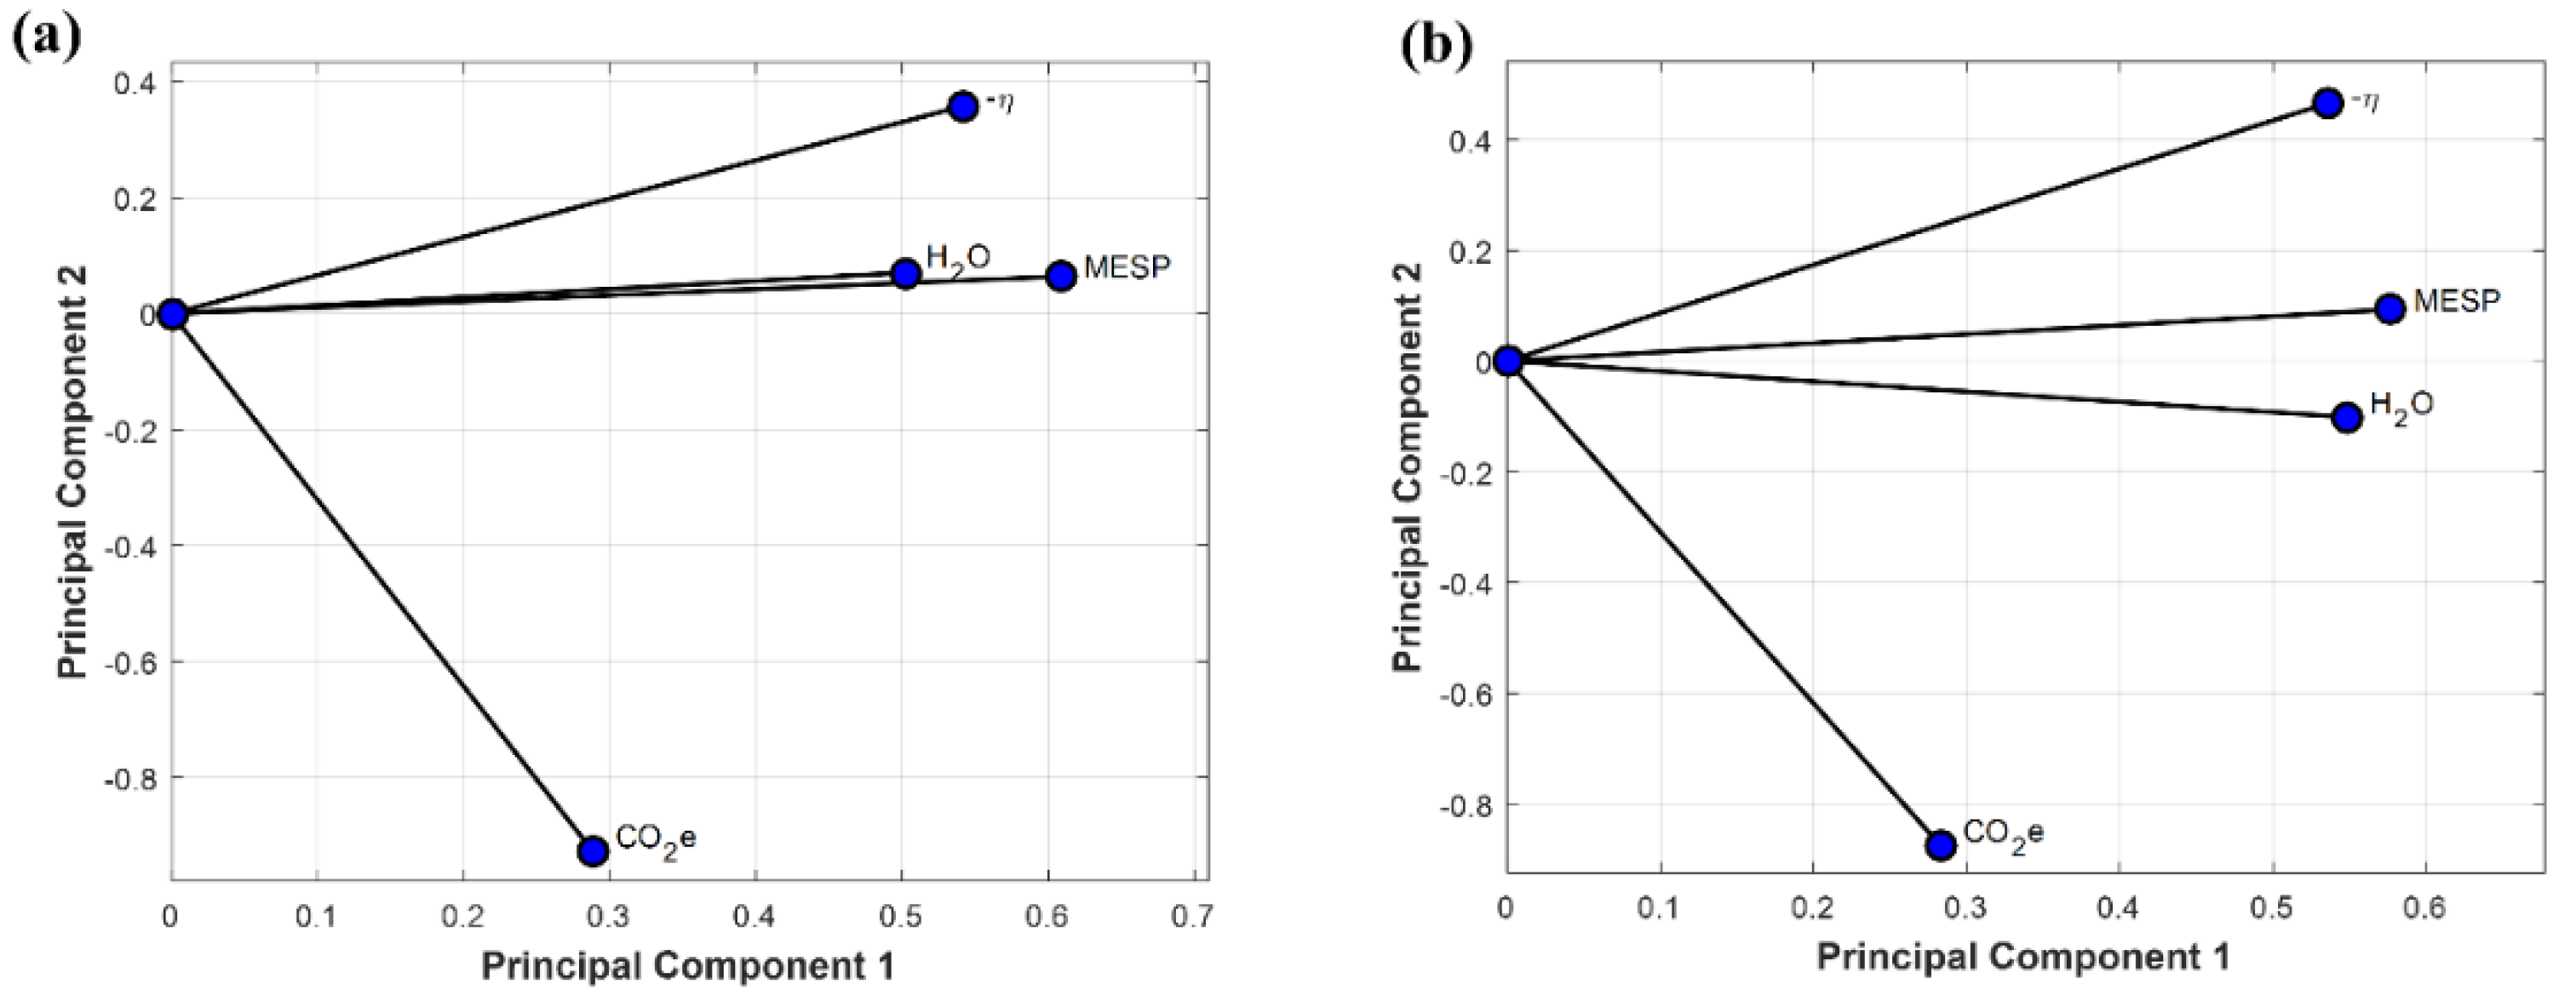
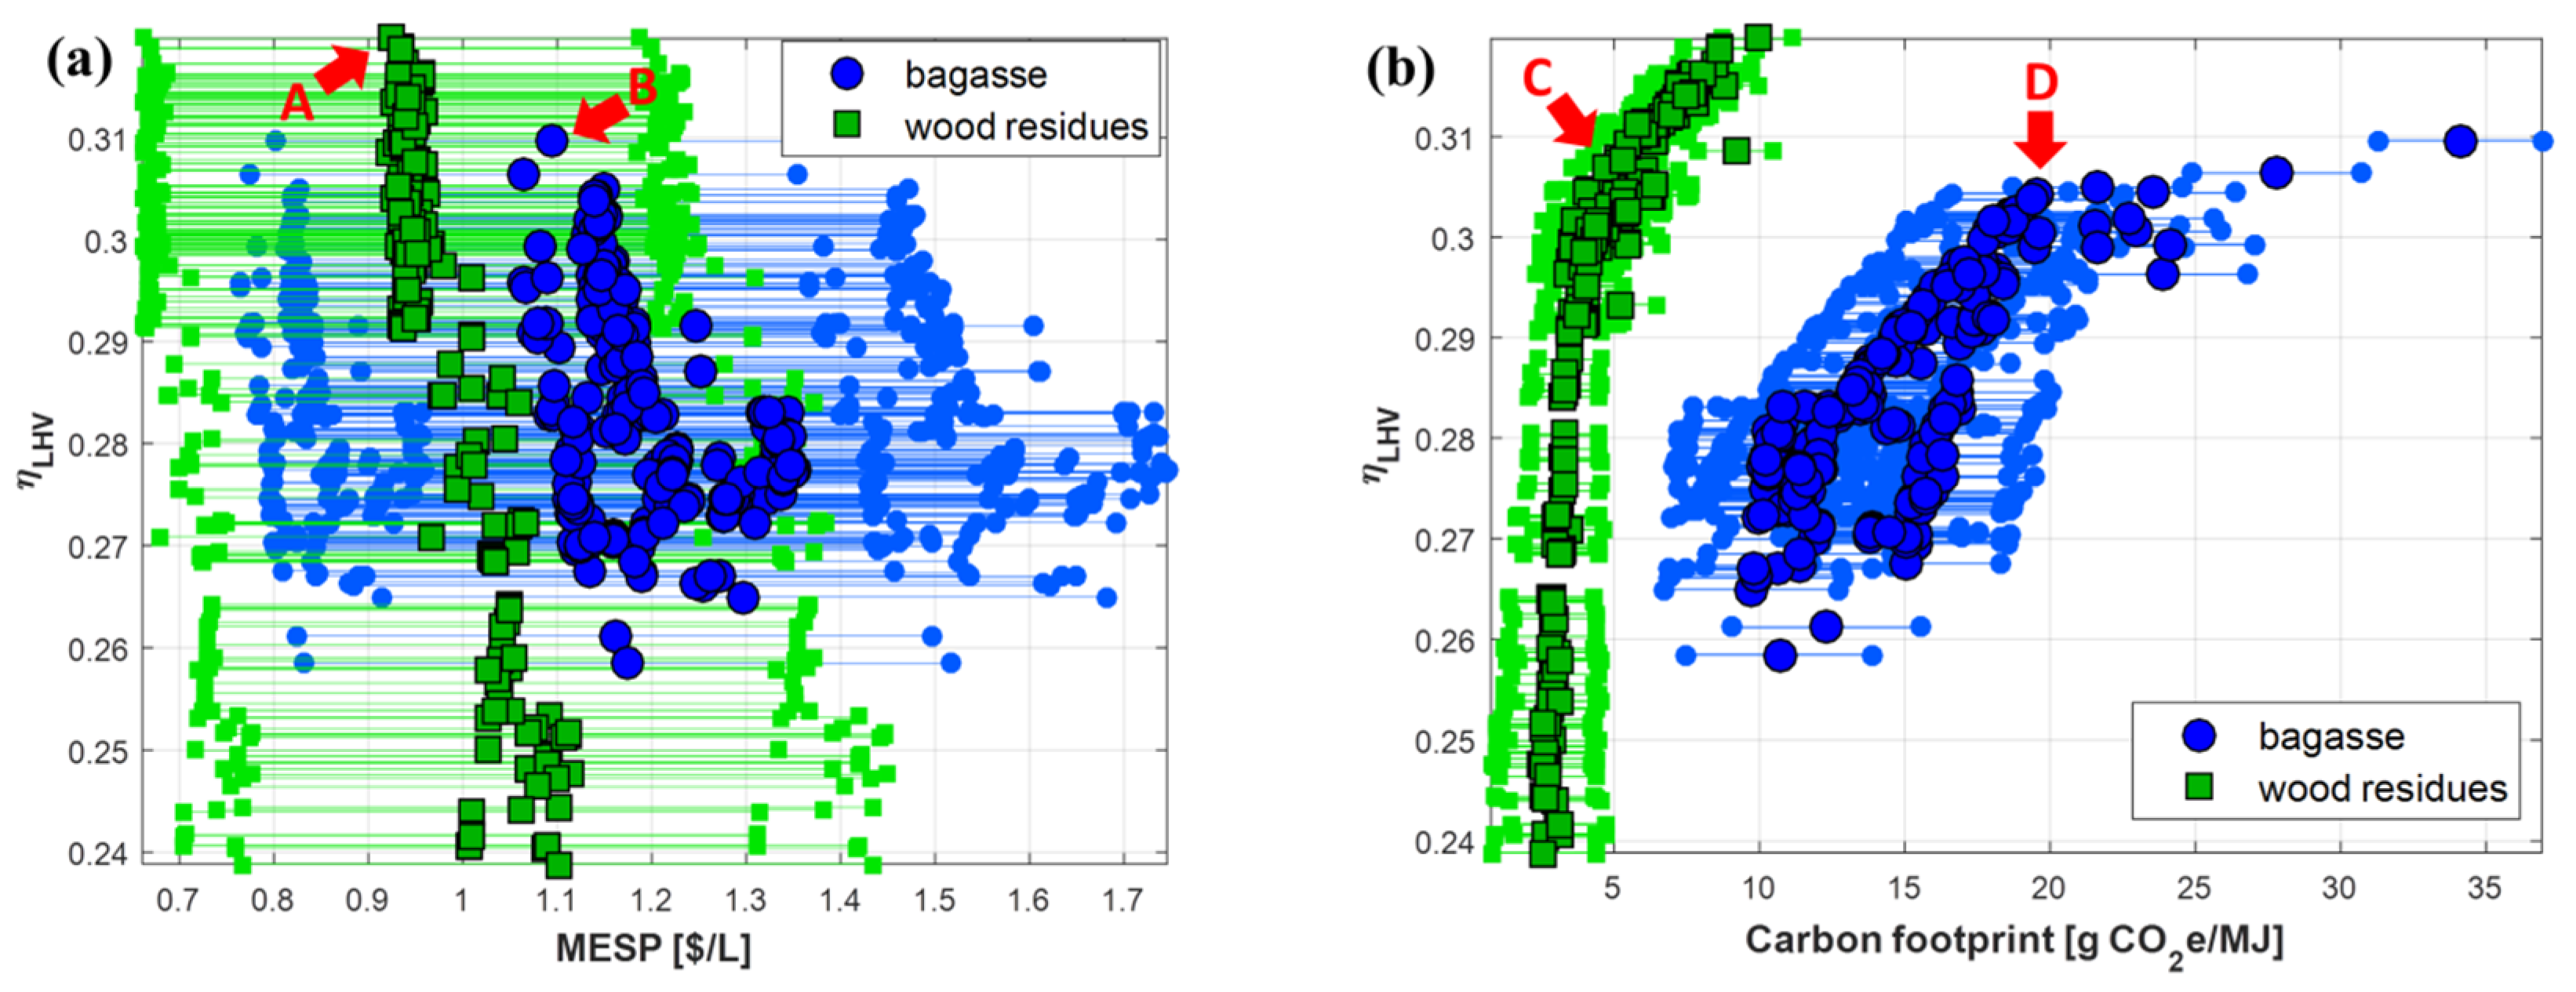
3.4. Multi-Objective Sustainability Optimization

Figure 10 presents the Pareto fronts and their respective interpolant surfaces that were obtained for the two feedstocks. Significantly lower carbon footprint and MESP values can be obtained with wood residues (0.93 USD/L against 1 USD/L and 3g CO2eq/MJ against 10 g CO2eq/MJ). The main reasons behind these results are the lower feedstock price, the lower feedstock-related emissions, and the initial moisture of the wood residues. The energy efficiency however approached 32% in both cases, a result that is lower than a previous estimation (η = 38%) [25] that considered a much more simplistic bioreactor model. Indeed, as demonstrated in de Medeiros et al. [18], an optimistic estimation of the gas–liquid mass transfer coefficient (kLa) can lead to a substantial improvement in energy efficiency and a reduction of MESP. Considering the high values of MESP, even under optimal conditions, and its dependence on the energy efficiency, the results presented here and in de Medeiros et al. [18] corroborate the need for improvement in the bioreactor, be it with novel reactor designs that facilitate gas–liquid mass transfer while keeping low cost or with genetic improvement of the microorganisms. These changes must, however, be followed by new optimization studies to re-evaluate the optimal process conditions.
For both feedstocks, the optimal MESP can be decreased at the cost of higher GHG emissions; however, even at the lowest MESP values, the process still represents a significant emission reduction compared to gasoline (94 gCO2eq/MJ) [35] and 1st-generation ethanol (38.5–44.9 g CO2eq/MJ) [36]; however, it should be mentioned that our calculations do not take into account the emissions related to the distribution of ethanol. The results are comparable to other combinations of 2G technology and feedstock, for example, the biochemical route using wheat straw (16 g CO2eq/MJ) [2] or sugarcane residues (17.5 gCO2eq/MJ) [27]. Similarly, Handler et al. [29] reported GHG emissions from gas fermentation between 8.0 gCO2eq/MJ for corn stover and 31.4 for basic oxygen furnace gas.
There are different sources of uncertainty in the modeling framework. First, those associated with the process models: for example, in the correlations used to predict syngas composition as a function of temperature or in the equations and parameters used for the calculation of the gas–liquid mass transfer coefficient (kLa) and reaction rates in the bioreactor model. These are uncertainties that can be attenuated with research to deliver more experimental data, either laboratory or industrial, to validate and improve the models. The other type of uncertainty is related to economic and environmental parameters and assumptions that are unrelated to process models, such as the price of raw materials, capital cost correlations, and emission factors. For example, biomass residues are not traditional materials with established market prices, but they acquire a so-called opportunity price as second-generation technologies or as other types of biomass valorization processes gain popularity. Similarly, one can expect that values of CO2eq emissions due to feedstock procurement to depend not only on the location and type of biomass but also on the impact assessment methodology and database used for the calculation of these emission factors. In this context, Figure 11 presents the two-dimensional projections of the Pareto fronts from Figure 10 along with the uncertainty intervals obtained when four economic and environmental assumptions are varied within ± 30% ranges: (i) feedstock price; (ii) CAPEX calculation; (iii) feedstock emission factor; and (iv) electricity emission factor. The points A, B, C, and D were selected as the most desirable candidates, as discussed further in Section 3.4.
The large uncertainty intervals demonstrate the importance of being transparent about the assumptions and limitations of techno-economic and environmental assessments. Nevertheless, the main contribution of this paper is not the calculation of MESP, energy efficiency, and carbon footprint, but rather the strategies presented for sustainability optimization and the insights regarding the effects of interconnected input variables and their behavior at optimal solutions. This is illustrated in Figure 12 for the most relevant variables: TGZ, fs, Drate, and GRT. As seen in Section 3.3, these variables showed the strongest correlations with the responses, which is why they are also more dispersed along the Pareto fronts. Other variables, however, were limited to more narrow ranges of optimal values when compared to their original search space. Ranges of Pareto-optimal values obtained for all of the decision variables are shown in Table 2, together with their original search space.
The optimal trends presented in Figure 12 reinforce, to some extent, the correlations discussed in Section 3.3 (Figure 8). For example, lower MESP (and higher efficiency) can be achieved with a higher gasification temperature, while the opposite is observed for the variable fs (fraction of unreformed syngas that is sent to combustion). The optimal values of Drate are constrained to the range 0.055–0.08 h−1, similar to what was observed in de Medeiros et al. [18]. Finally, GRT is spread over the range 22–32 min, but although its patterns are not as evident as seen for TGZ and fs, there seems to be a rough tendency of a higher GRT leading to a higher MESP (and lower η), which is, at first sight, in contrast to the results presented in Figure 8. However, when considering the entire GRT search space (see Table 2), the optimal values are closer to the upper bound than to the lower bound, therefore confirming that higher GRT is better for both MESP and η. It is when the data set is limited to the Pareto fronts that this pattern is not clear anymore, demonstrating that other input variables also exert strong effects on the optimal results.
Although the Pareto-optimal solutions are, by definition, equally optimal, points A, B, C, and D from Figure 11 can be selected as the best candidates according to the following criteria: first, given the current context, in which profitability is still the prevailing standard, points A and B are those for which both profitability and energy efficiency are maximized. It should be noted that it is not always the case that these two targets can be optimized at the same time (for example, see de Medeiros et al. [18]). Points C and D take into account the carbon footprint but do not consider it the most crucial target: beyond these points, minor improvements in the energy efficiency are followed by a proportionally larger increase in carbon emissions. Table 3 presents the values of the decision variables at these four solutions along with the corresponding values of the three targets. The main differences between the two types of solutions (A and B against C and D) are related to the gasification temperature (slightly lower in the second case), the bioreactor volume (also lower in the second case), and, more notably, the syngas fraction fs, which is much higher when the carbon footprint is taken into account.
Water footprint was also included in the analysis as a measure of direct water use (i.e., excluding the water footprint to produce the feedstock and raw materials), but as explained in Section 3.3, it was excluded from the multi-objective optimization due to its high correlation with both MESP and η. In Figure 13a the water footprint of the Pareto-optimal points is plotted against the corresponding results of MESP, with the minimum values being around 5 kg of water per liter of ethanol for both the bagasse and wood residues. As a comparison, Dutta et al. [26] reported 2.0 kg/L for ethanol production from wood via gasification and mixed alcohol synthesis, yet the LanzaTech process is expected to consume around 8.5 kg/L [29]. The ethanol yields (Figure 13b) are also comparable to other 2G processes found to be in the range 205–330 L/ton dry biomass [25,26,37].
Finally, Figure 14 illustrates the trade-off between energy efficiency and self-sufficiency. The results indicate that energy self-sufficiency is not necessarily beneficial, as higher values of efficiency can be achieved when energy is purchased (in the form of steam and electricity) instead of produced entirely inside the plant, which sacrifices syngas that could be converted into ethanol. Though this conclusion may seem counterintuitive, it can be clarified by comparing Figure 14 with Figure 13b: as the energy demand increases with η, so does the ethanol yield, with gains that outweigh the extra energy requirement (MESP and η go in different directions, as seen in Figure 10 and Figure 11a).

4. Conclusions

This work shows how the sustainability of a gasification–fermentation route can be improved and optimized by tuning the process conditions and design parameters related to different units of the process. The modeling framework of the whole process, from biomass to ethanol fuel, and the interconnected effects of input variables on multiple outcomes are discussed. The correlation coefficients among various decision variables and each of the responses were obtained from the parametric studies of gasification and fermentation models. A multi-objective optimization was applied as a tool for sustainability optimization that does not rely on assigning weights to goals of different natures (e.g., economic and environmental) and optimal trade-offs, were also discussed. Wood residue feedstock was found to be better in terms of a lower MESP and carbon footprint (0.93 USD/L, and 3 g CO2eq/MJ) compared to sugarcane bagasse (1 USD/L, and 10 g CO2eq/MJ). This is due to the lower price of the wood, lower feedstock-related emissions, and lower initial moisture. The optimal energy efficiency was found to be the same (32%) in both cases.
Further, the Pareto-optimal solutions and uncertainties in the economic and environmental factors that were used were illustrated. Although early stage economic calculations bear large uncertainties, the optimization results indicate the low competitiveness of this technology against current ethanol production from sugarcane or corn, unless improvements are made to increase the efficiency of bioreactors or if other actions are considered, such as subsidy schemes or carbon taxes; however, this was not evaluated in the present work. The water usage of this integrated process was shown to be lower than that of the current existing production processes, and the purchasing energy was found to be the better option over the energy self-sufficient process at the expense of syngas.

Supplementary Materials

The following are available online at https://0-www-mdpi-com.brum.beds.ac.uk/article/10.3390/fermentation7040201/s1, Figure S1: Aspen flowsheet of the gasification unit. Figure S2: Correlation coefficients between decision variables and responses (a) CAPEX, (b) OPEX, (c) MESP, (d) ηLHV, (e) Water use and (f) CO2eq emissions. Results shown only for wood residues. Table S1: Elemental analysis (% dry basis) and moisture (%) of sugarcane bagasse and wood residues.

Author Contributions

Conceptualization, E.M.d.M., H.N., R.M.F., and J.A.P.; methodology, E.M.d.M., H.N., and J.A.P.; software, E.M.d.M.; validation, E.M.d.M., H.N., and J.A.P.; formal analysis, E.M.d.M.; investigation, E.M.d.M.; resources, H.N., R.M.F., and J.A.P.; data curation, E.M.d.M.; writing—original draft preparation, E.M.d.M.; writing—review and editing, H.N., R.M.F., and J.A.P.; visualization, E.M.d.M.; supervision, H.N., and J.A.P.; project administration, H.N., R.M.F., and J.A.P.; funding acquisition, H.N., R.M.F., and J.A.P. All authors have read and agreed to the published version of the manuscript.

Funding

This research received financial support from CAPES-BRAZIL, CTBE/CNPEM (Brazilian Bioethanol Science and Technology Laboratory), DSM, and the BE-Basic Foundation. This work was conducted as part of a Dual Degree PhD project under an agreement between UNICAMP and TU-DELFT.

Institutional Review Board Statement

Not applicable.

Informed Consent Statement

Not applicable.

Acknowledgments

The authors acknowledge the support from the Dual Degree PhD Programme and also acknowledge the efforts of Haneef Shijaz and Eduardo Almeida Benalcázar for their contributions to the review process.

Conflicts of Interest

The authors declare no conflict of interest.

References

  1. Ayodele, B.V.; Alsaffar, M.A.; Mustapa, S.I. An Overview of Integration Opportunities for Sustainable Bioethanol Production from First- and Second-Generation Sugar-Based Feedstocks. J. Clean. Prod. 2020, 245, 118857. [Google Scholar] [CrossRef]
  2. Padella, M.; O’Connell, A.; Prussi, M. What Is Still Limiting the Deployment of Cellulosic Ethanol? Analysis of the Current Status of the Sector. Appl. Sci. 2019, 9, 4523. [Google Scholar] [CrossRef] [Green Version]
  3. Polprasert, S.; Choopakar, O.; Elefsiniotis, P. Bioethanol Production from Pretreated Palm Empty Fruit Bunch (PEFB) Using Sequential Enzymatic Hydrolysis and Yeast Fermentation. Biomass Bioenergy 2021, 149, 106088. [Google Scholar] [CrossRef]
  4. Lak Kamari, M.; Maleki, A.; Nazari, M.A.; Sadeghi, M.; Rosen, M.A.; Pourfayaz, F. Assessment of a Biomass-Based Polygeneration Plant for Combined Power, Heat, Bioethanol and Biogas. Appl. Therm. Eng. 2021, 198, 117425. [Google Scholar] [CrossRef]
  5. Kirkels, A.F.; Verbong, G.P.J. Biomass Gasification: Still Promising? A 30-Year Global Overview. Renew. Sustain. Energy Rev. 2011, 15, 471–481. [Google Scholar] [CrossRef]
  6. Hrbek, J. Status Report on Thermal Gasification of Biomass and Waste 2019: IEA Bioenergy Task 33 Special Report; IEA Bioenergy: Vienna, Austria, 2019; ISBN 9781910154656. [Google Scholar]
  7. Munir, M.T.; Mardon, I.; Al-Zuhair, S.; Shawabkeh, A.; Saqib, N.U. Plasma Gasification of Municipal Solid Waste for Waste-to-Value Processing. Renew. Sustain. Energy Rev. 2019, 116, 109461. [Google Scholar] [CrossRef]
  8. Latif, H.; Zeidan, A.A.; Nielsen, A.T.; Zengler, K. Trash to Treasure: Production of Biofuels and Commodity Chemicals via Syngas Fermenting Microorganisms. Curr. Opin. Biotechnol. 2014, 27, 79–87. [Google Scholar] [CrossRef] [Green Version]
  9. Posada, J.A.; Osseweijer, P. Socio-economic and environmental considerations for sustainable supply and fractionation of lignocellulosic biomass in a biorefinery context. In Biomass Fractionation Technologies for a Lignocellulosic Feedstock Based Biorefinery; Mussatto, S.L., Ed.; Elsevier: Amsterdam, The Netherlands, 2016; p. 674. [Google Scholar]
  10. Noorman, H.J.; Heijnen, J.J. Biochemical Engineering’s Grand Adventure. Chem. Eng. Sci. 2017, 170, 677–693. [Google Scholar] [CrossRef]
  11. De Medeiros, E.M.; Posada, J.A.; Noorman, H.; Filho, R.M. Dynamic Modeling of Syngas Fermentation in a Continuous Stirred-Tank Reactor: Multi-Response Parameter Estimation and Process Optimization. Biotechnol. Bioeng. 2019, 116, 2473–2487. [Google Scholar] [CrossRef]
  12. Chen, J.; Gomez, J.A.; Höffner, K.; Barton, P.I.; Henson, M.A. Metabolic Modeling of Synthesis Gas Fermentation in Bubble Column Reactors. Biotechnol. Biofuels 2015, 8, 89. [Google Scholar] [CrossRef] [Green Version]
  13. Benalcázar, E.A.; Noorman, H.; Maciel Filho, R.; Posada, J.A. Modeling Ethanol Production through Gas Fermentation: A Biothermodynamics and Mass Transfer-Based Hybrid Model for Microbial Growth in a Large-Scale Bubble Column Bioreactor. Biotechnol. Biofuels 2020, 13, 59. [Google Scholar] [CrossRef]
  14. Norman, R.O.J.; Millat, T.; Schatschneider, S.; Henstra, A.M.; Breitkopf, R.; Pander, B.; Annan, F.J.; Piatek, P.; Hartman, H.B.; Poolman, M.G.; et al. Genome-Scale Model of C. Autoethanogenum Reveals Optimal Bioprocess Conditions for High-Value Chemical Production from Carbon Monoxide. Eng. Biol. 2019, 3, 32–40. [Google Scholar] [CrossRef]
  15. Abrahamson, B. Conceptual Design and Evaluation of a Commercial Syngas Fermentation Process. Master’s Thesis, Technische Universiteit Delft, Delft, The Netherlands, 2019. [Google Scholar]
  16. Benalcázar, E.A.; Gevers-Deynoot, B.; Noorman, H.; Osseweijer, P.; Posada, J.A. Production of Bulk Chemicals from Lignocellulosic Biomass via Thermochemical Conversion and Syngas Fermentation: A Comparative Techno-Economic and Environmental Assessment of Different Site-Specific Supply Chain Configurations: Techno-Economic and Environmental Assessment of Bulk Chemicals Production Though Biomass Gasification and Syngas Fermentation. Biofuels Bioprod. Biorefining 2017, 11, 861–886. [Google Scholar] [CrossRef]
  17. De Medeiros, E.M.; Posada, J.A.; Noorman, H.; Filhob, R.M. Modeling and Multi-Objective Optimization of Syngas Fermentation in a Bubble Column Reactor. Comput. Aided Chem. Eng. 2019, 46, 1531–1536. [Google Scholar] [CrossRef]
  18. De Medeiros, E.M.; Noorman, H.; Maciel Filho, R.; Posada, J.A. Production of Ethanol Fuel via Syngas Fermentation: Optimization of Economic Performance and Energy Efficiency. Chem. Eng. Sci. X 2020, 5, 100056. [Google Scholar] [CrossRef]
  19. Almeida Benalcázar, E.; Noorman, H.; Maciel Filho, R.; Posada, J. Assessing the Sensitivity of Technical Performance of three Ethanol Production Processes based on the Fermentation of Steel Manufacturing Offgas, Syngas and a 3:1 Mixture Between H2 and CO2. In Computer Aided Chemical Engineering; Elsevier: Amsterdam, The Netherlands, 2020; Volume 48, pp. 589–594. ISBN 978-0-12-823377-1. [Google Scholar]
  20. Ramachandriya, K.D.; Kundiyana, D.K.; Sharma, A.M.; Kumar, A.; Atiyeh, H.K.; Huhnke, R.L.; Wilkins, M.R. Critical Factors Affecting the Integration of Biomass Gasification and Syngas Fermentation Technology. AIMS Bioeng. 2016, 3, 188–210. [Google Scholar] [CrossRef]
  21. Bertsch, J.; Müller, V. Bioenergetic Constraints for Conversion of Syngas to Biofuels in Acetogenic Bacteria. Biotechnol. Biofuels 2015, 8, 210. [Google Scholar] [CrossRef] [PubMed] [Green Version]
  22. Pinto, T.; Flores-Alsina, X.; Gernaey, K.V.; Junicke, H. Alone or Together? A Review on Pure and Mixed Microbial Cultures for Butanol Production. Renew. Sustain. Energy Rev. 2021, 147, 111244. [Google Scholar] [CrossRef]
  23. Yang, C.; Dong, L.; Gao, Y.; Jia, P.; Diao, Q. Engineering Acetogens for Biofuel Production: From Cellular Biology to Process Improvement. Renew. Sustain. Energy Rev. 2021, 151, 111563. [Google Scholar] [CrossRef]
  24. Liakakou, E.T.; Infantes, A.; Neumann, A.; Vreugdenhil, B.J. Connecting Gasification with Syngas Fermentation: Comparison of the Performance of Lignin and Beech Wood. Fuel 2021, 290, 120054. [Google Scholar] [CrossRef]
  25. De Medeiros, E.M.; Posada, J.A.; Noorman, H.; Osseweijer, P.; Filho, R.M. Hydrous Bioethanol Production from Sugarcane Bagasse via Energy Self-Sufficient Gasification-Fermentation Hybrid Route: Simulation and Financial Analysis. J. Clean. Prod. 2017, 168, 1625–1635. [Google Scholar] [CrossRef]
  26. Humbird, D.; Davis, R.; Tao, L.; Kinchin, C.; Hsu, D.; Aden, A.; Schoen, P.; Lukas, J.; Olthof, B.; Worley, M.; et al. Process Design and Economics for Conversion of Lignocellulosic Biomass to Ethanol. NREL Tech. Rep. 2011, 303, 275–3000. [Google Scholar]
  27. Junqueira, T.L.; Chagas, M.F.; Gouveia, V.L.R.; Rezende, M.C.A.F.; Watanabe, M.D.B.; Jesus, C.D.F.; Cavalett, O.; Milanez, A.Y.; Bonomi, A. Techno-Economic Analysis and Climate Change Impacts of Sugarcane Biorefineries Considering Different Time Horizons. Biotechnol. Biofuels 2017, 10, 50. [Google Scholar] [CrossRef] [Green Version]
  28. Turton, R.; Bailie, R.C.; Whiting, W.B.; Shaeiwitz, J.A. Analysis, Design and Synthesis of Chemical Processes; Prentice Hall: Boston, MA, USA, 2008; ISBN 9780135129661. [Google Scholar]
  29. Handler, R.M.; Shonnard, D.R.; Griffing, E.M.; Lai, A.; Palou-Rivera, I. Life Cycle Assessments of Ethanol Production via Gas Fermentation: Anticipated Greenhouse Gas Emissions for Cellulosic and Waste Gas Feedstocks. Ind. Eng. Chem. Res. 2016, 55, 3253–3261. [Google Scholar] [CrossRef]
  30. Capaz, R.S.; de Medeiros, E.M.; Falco, D.G.; Seabra, J.E.A.; Osseweijer, P.; Posada, J.A. Environmental Trade-Offs of Renewable Jet Fuels in Brazil: Beyond the Carbon Footprint. Sci. Total Environ. 2020, 714, 136696. [Google Scholar] [CrossRef]
  31. Wilk, V.; Hofbauer, H. Conversion of Fuel Nitrogen in a Dual Fluidized Bed Steam Gasifier. Fuel 2013, 106, 793–801. [Google Scholar] [CrossRef]
  32. Lane, J. Digest Feedback May Help Explain INEOS Bio’s High Levels of HCN Gas. 2014, pp. 1–2. Available online: https://www.biofuelsdigest.com/bdigest/2014/09/08/feedback-may-help-explain-ineos-bios-high-levels-of-hcn-gas/ (accessed on 21 September 2021).
  33. Oswald, F.; Zwick, M.; Omar, O.; Hotz, E.N.; Neumann, A. Growth and Product Formation of Clostridium Ljungdahlii in Presence of Cyanide. Front. Microbiol. 2018, 9, 1213. [Google Scholar] [CrossRef] [PubMed]
  34. Kumagai, S.; Hosaka, T.; Kameda, T.; Yoshioka, T. Removal of Toxic HCN and Recovery of H2-Rich Syngas via Catalytic Reforming of Product Gas from Gasification of Polyimide over Ni/Mg/Al Catalysts. J. Anal. Appl. Pyrolysis 2017, 123, 330–339. [Google Scholar] [CrossRef]
  35. Elgowainy, A.; Han, J.; Cai, H.; Wang, M.; Forman, G.S.; Divita, V.B. Energy efficiency and greenhouse gas emission intensity of petroleum products at US refineries. Environ. Sci. Technol. 2020, 48, 7612–7624. [Google Scholar] [CrossRef] [PubMed] [Green Version]
  36. Mekonnen, M.M.; Romanelli, T.L.; Ray, C.; Hoekstra, A.Y.; Liska, A.J.; Neale, C.M.U. Water, Energy, and Carbon Footprints of Bioethanol from the U.S. and Brazil. Environ. Sci. Technol. 2018, 52, 14508–14518. [Google Scholar] [CrossRef] [Green Version]
  37. Wei, L.; Pordesimo, L.O.; Igathinathane, C.; Batchelor, W.D. Process Engineering Evaluation of Ethanol Production from Wood through Bioprocessing and Chemical Catalysis. Biomass Bioenergy 2009, 33, 255–266. [Google Scholar] [CrossRef]
Figure 1. Block flow diagram of the thermo-biochemical route for ethanol production from biomass. Dashed lines: electricity streams; blue lines: cooling or chilled water; red lines: steam.
Fermentation 07 00201 g001
Figure 2. Schematic representation of dual fluidized bed reactor in A100.
Fermentation 07 00201 g002
Figure 3. Simplified process flow diagram of A100: drying, gasification, and tar reformer. D-01: biomass dryer; SP-01 to SP-03: stream splitters; R-01 and R-02: gasification (GZ) and combustion (CZ) zones of dual bed gasifier; S-01 to S-04: cyclones; R-03 and R-04: tar reformer and catalyst regenerator; C-01: air blower; E-01: air pre-heater.
Fermentation 07 00201 g003
Figure 4. Rankine cycle with reheat. E-01 to E-05: heat exchangers (units represent series of exchangers); ST-01 and ST-02: steam turbine, 1st and 2nd stages; P-01 and P-02: water pumps.
Fermentation 07 00201 g004
Figure 5. Molar composition of syngas (dry basis): (a) after gasifier; (b) after tar reformer (other species are not shown due to negligible concentrations).
Fermentation 07 00201 g005
Figure 6. Main differences between the predictions of the gasifier model for bagasse and wood residues: (a) char yield; (b) required fraction of biomass sent to the combustion zone.
Fermentation 07 00201 g006
Figure 7. Bubble column reactor, sensitivity of Drate, and GRT on model outcomes: (a) ethanol concentration (g.L−1) in the liquid phase; (b) ethanol productivity (g.L−1.h−1); (c) energy efficiency ηLHV; (d) CO conversion.
Fermentation 07 00201 g007
Figure 8. Correlation coefficients between decision variables and responses: (a) CAPEX, (b) OPEX, (c) MESP, (d) ηLHV, (e) Water use and (f) CO2eq emissions. Results are presented for sugarcane bagasse only (results for wood residues are presented in Figure S2 in the Supplementary Materials).
Fermentation 07 00201 g008
Figure 9. PCA of model responses showing the principal component coefficients (loadings) of the first two principal components: (a) sugarcane bagasse; (b) wood residues.
Fermentation 07 00201 g009
Figure 10. Pareto surfaces obtained with three-objective optimization of the thermo-biochemical route (Pareto-optimal solutions represented by red spheres): (a) sugarcane bagasse; (b) wood residues.
Fermentation 07 00201 g010
Figure 11. Projections of three-objective Pareto fronts in pairs, including intervals of ± 30% uncertainty in economic and environmental assumptions: (a) MESP; (b) carbon footprint.
Fermentation 07 00201 g011
Figure 12. Pareto-optimal values of most relevant decision variables: (a) TGZ; (b) fs; (c) Drate; (d) GRT.
Fermentation 07 00201 g012
Figure 13. Pareto-optimal values of other performance indicators: (a) water footprint; (b) ethanol yield.
Fermentation 07 00201 g013
Figure 14. Pareto-optimal values of global energy balance (consumed minus produced in the plant): (a) power; and (b) heat (steam).
Fermentation 07 00201 g014
Table 1. Prices and carbon footprint considered in this study.
Raw MaterialPriceCarbon Footprint
Sugarcane bagasseUSD 45/t (db) (Bonomi et al., 2016)0.042 kg CO2eq/kg (db) (Capaz et al., 2020)
Wood residuesUSD 11.3/t (db) (SEAB, 2019)0.0189 kg CO2eq/kg (db) (Capaz et al., 2020)
ElectricityUSD 0.14/kWh (CPFL Energia, 2019)0.17 kg CO2eq/kWh (Capaz et al., 2020)
Steamvariable (Ulrich and Vasudevan, 2006)70 kg CO2eq/GJ (Ecoinvent)
Natural gasUSD 0.274/kg2.63 kg CO2eq/kg (Ecoinvent)
Table 2. Multi-objective optimization of thermo-biochemical route: ranges of the Pareto-optimal solutions.
Decision VariablesSearch SpaceBagasseWood Residues
TGZ (°C)700–1000839–989909–983
fs0–0.350.00182–0.2800.111–0.330
Drate (h−1)0.05–0.150.0568–0.0800.0560–0.0644
GRT (min)5–4021.6–32.121.7–33.0
GRR0–0.50.0990–0.2930.124–0.304
L (m)30–5043.1–47.240.4–48.9
VR (m3)400–900455–600418–596
SFC10.06–0.130.0894–0.09400.0886–0.0950
RRC23–64.84–5.954.75–5.87
Table 3. Multi-objective optimization of thermo-biochemical route: selected optimal points.
Decision VariablesA (Wood)B (Bagasse)C (Wood)D (Bagasse)
MESP (USD.L−1)0.9341.090.9581.14
η0.3190.3100.3050.304
g CO2eq/MJ8.6034.14.1119.4
TGZ (°C)974974961962
fs0.1190.001820.1860.119
Drate (h−1)0.05720.0600.0580.058
GRT (min)30.328.931.829.8
GRR0.2450.2480.2470.283
L (m)45.846.047.445.1
VR (m3)503554485551
SFC10.09400.09200.09300.0921
RRC25.115.135.105.00
Publisher’s Note: MDPI stays neutral with regard to jurisdictional claims in published maps and institutional affiliations.

