Article

Influence of Environmental Microbiota on the Activity and Metabolism of Starter Cultures Used in Coffee Beans Fermentation

by
Vanessa Bassi Pregolini
1,
Gilberto Vinícius de Melo Pereira
2,*,
Alexander da Silva Vale
2,
Dão Pedro de Carvalho Neto
3 and
Carlos Ricardo Soccol
2,*
1
Departament of Bioprocess Engineering and Biotechnology, Federal Technological University of Paraná (UTFPR), Ponta Grossa 84017-220, PR, Brazil
2
Department of Bioprocess Engineering and Biotechnology, Federal University of Paraná (UFPR), Curitiba 81531-970, PR, Brazil
3
Federal Institute of Education, Science and Technology of Paraná (IFPR), Londrina 86060-370, PR, Brazil
*
Authors to whom correspondence should be addressed.
Submission received: 28 October 2021 / Revised: 22 November 2021 / Accepted: 23 November 2021 / Published: 25 November 2021
(This article belongs to the Special Issue Yeast Biotechnology 5.0)

Abstract

:
Microbial activity is an integral part of agricultural ecosystems and can influence the quality of food commodities. During on-farm processing, coffee growers use a traditional method of fermentation to remove the cherry pulp surrounding the beans. Here, we investigated the influence of the coffee farm microbiome and the resulting fermentation process conducted with selected starter cultures (Pichia fermentans YC5.2 and Pediococcus acidilactici LPBC161). The microbiota of the coffee farm (coffee fruits and leaves, over-ripe fruits, cherries before de-pulping, depulped beans, and water used for de-pulping beans) was dominated by Enterobacteriaceae and Saccharomycetales, as determined by llumina-based amplicon sequencing. In addition, 299 prokaryotes and 189 eukaryotes were identified. Following the fermentation process, Pichia and the family Lactobacillaceae (which includes P. acidilactici) represented more than 70% of the total microbial community. The positive interaction between the starters resulted in the formation of primary metabolites (such as ethanol and lactic acid) and important aroma-impacting compounds (ethyl acetate, isoamyl acetate, and ethyl isobutyrate). The success competitiveness of the starters towards the wild microbiota indicated that coffee farm microbiota has little influence on starter culture-added coffee fermentation. However, hygiene requirements in the fermentation process should be indicated to prevent the high microbial loads present in coffee farm soil, leaves, fruits collected on the ground, and over-ripe fruits from having access to the fermentation tank and transferring undesirable aromas to coffee beans.

Graphical Abstract

1. Introduction

Coffee is a tropical crop grown in more than 50 countries, with the largest producers being Brazil, Vietnam, Colombia, Indonesia, Ethiopia, and Honduras [1]. To produce coffee beans suitable for transportation and roasting, it is necessary to separate the seeds from the outer layers (skin, pulp, mucilage, and parchment). This process can be carried out by three different methods, namely dry, semi-dry, or wet processing, which reduces the moisture of the coffee beans from 65% to 12% [2]. In the dry processing, intact coffee fruits are exposed to the sun for approximately 30 days until they reach 12% moisture. Then the fruits are mechanically crushed to separate the beans from the outer layers. Wet processing is relatively more complex, as the fruits are mechanically depulped and placed in tanks containing large volumes of water for a natural fermentation to occur for 24 to 48 h. The fermentation process removes the mucilage layer adhered to the seeds, which are finally sun-dried to reach the desired moisture content. Finally, semi-dry processing presents stages of both dry and wet methods, where the coffee fruits are mechanically depulped and then submitted to sun-drying [3].
Recent studies using next-generation sequencing (NGS) have shown that more than 100 microbial genera are involved in coffee beans fermentation from Brazil, Ecuador, Colombia, Honduras, and Australia [4,5,6,7,8,9,10]. However, temporal analyses of the fermentations revealed that the core microbiome is distinguished in three stages; (i) Enterobacteriaceae, acetic acid bacteria (AAB), and lactic acid bacteria (LAB) are present in higher frequencies at the beginning of the fermentation, (ii) LAB (mainly Leuconostoc, Lactococcus or Lactobacillus) dominate the fermentation after 6 h and (iii) acid-tolerant LAB remains until the end of the process. Among the eukaryotic community, generally, yeasts belonging to the genus Pichia show a high prevalence throughout fermentation [6,7,11,12].
The success of coffee fermentation depends on the indigenous microbiota associated with coffee farm microbiome. Recently, the use of starter cultures has been indicted to replace this empirical process, making coffee fermentation more predictable and controlled [11,12]. One limitation in the use of starter cultures is that fermentations are usually carried out in open tanks, which can favor contamination by the natural microbiota. Due to this lack of control, the starters must establish dominance over the high load of indigenous microorganisms. In recent years, several studies have shown that yeast and LAB species (e.g., Lactobacillus plantarum, Leuconostoc mesenteroides, Pichia kluyveri, Pichia anomala, Pichia fermentans, Hanseniaspora uvarum, Saccharomyces cerevisiae, Debaryomyces hansenii, and Torulaspora delbrueckii, Candida railenensis) were able to suppress the indigenous microbiota during coffee fermentation, as well as produce coffee beverages with desired characteristics [13,14,15,16,17]. However, the existence of a connection between coffee farm microbiome and the resulting starter culture-added, coffee fermentation has not yet been investigated.
It was recently demonstrated that co-inoculation of Pichia fermentans YC5.2 and Pediococcus acidilactici LPBC161 increases the production of metabolites (lactic acid, ethanol, and ethyl acetate) during coffee fermentation, evidencing a positive interaction between these two microbial groups [18]. In this sense, this study aimed to use a next-generation sequencing (NGS) to evaluate the influence of the microbial communities from coffee farm processing and coffee fermentation using P. fermentans YC5.2 and P. acidilactici LPBC161. In addition, the metabolite changes that occurred during the fermentation process were studied by chromatographic techniques.

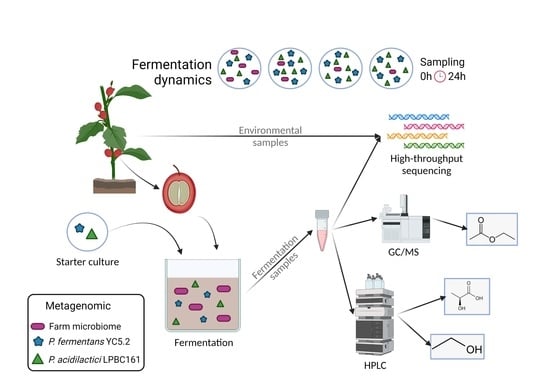
2. Material and Methods

2.1. Cultivation of Lactic Acid Bacteria and Yeast

The starter cultures used in this study include the lactic acid bacterium Pediococcus acidilactici LPBC161 and the yeast Pichia fermentans YC5.2. These microbial cultures were previously isolated, identified and selected from spontaneous coffee fermentations, as reported by Pereira et al. [13] and Muynarsk [19], and are deposited in the Microbial Cultures Collection of the Department of Bioprocess and Biotechnology Engineering of the Federal University of Paraná, UFPR, Curitiba, PR, Brazil. P. acidilactici LPBC161 and P. fermentans YC5.2 were reactivated in MRS (Merck Millipore, Burlington, MA) and YEPG broth (Himedia, Marg, India), respectively, at 30 °C for 24 h. To achieve a concentration of approximately 109 CFU/mL, 0.4 L of a culture of P. acidilactici LPBC161 was inoculated in Erlenmeyer containing 3.6 L of a culture medium composed of glucose (5 g/L), yeast extract (5 g/L), ammonium citrate (5 g/L), ammonium phosphate (5 g/L), sodium acetate (2 g/L), manganese sulfate (0.05 g/L) and Tween 80 (0.1%) [20]. P. fermentans YC5.2 was also cultivated and inoculated in the same way, but a culture medium containing only glucose (5 g/L) yeast extract (5 g/L) was used. Yeasts and bacteria were incubated at 30 °C for 24 h. After this period, the cells were centrifuged at 5000× g for 10 min and resuspended in 250 mL of sterile saline solution (0.9% NaCl) and stored at 4 °C until their proper use.

2.2. Area of Study and Sampling Procedure

The experiments were conducted at Shalom farm situated in Patrocínio, Minas Gerais state, Brazil (18°56′38″ S 46°59′34″ O). The environmental samples were collected in triplicate and are composed of: (i) 100 g of soil collected at 10 cm depth in an area of 1 m2 in the treetops; (ii) 10 g of coffee leaves collected from the soil surface; (iii) 20 fruits collected from the soil surface; (iv) 10 g of leaves collected from the branches 30 cm from the apical region; (v) 20 cherries collected from the coffee tree; (vi) 20 cherries before de-pulping; (vii) 20 over-ripe fruits collected from the coffee tree; (viii) 100 g depulped beans; (ix) 50 mL water used for de-pulping beans. The samples were stored in falcon sterile tubes (50 mL) and transported to the Center of Agroindustrial Biotechnology of Paraná (CENBAPAR, Curitiba, Brazil) under refrigeration and maintained at −20 °C until further analysis.
Later, coffee cherries (Coffea arabica var. Catuaí Amarelo) were harvested manually and mechanically pulped. Approximately 100 kg of pulped coffee beans were deposited in a 1 m3 concrete tank containing about 50 L of water, in accordance with the local wet processing method. Before inoculation, the cell viability of the starter cultures was determined by spread plate and the results were expressed in CFU/mL. Thus, the appropriate inoculum concentration of P. fermentans YC5.2 and P. acidilactici LPBC161 were adjusted to achieve an initial concentration of 107 CFU/mL and inoculated simultaneously in the fermentation tanks. About 100 g of coffee beans plus the liquid fraction of the coffee pulp were collected at 0, 8, 19, and 24 h. The liquid fraction was frozen in Falcon tubes sterilized at −20 °C for further analysis. Finally, the coffee beans sampled from each point were sun-dried to 12% moisture. Fermentation and sample collection were performed in triplicates.

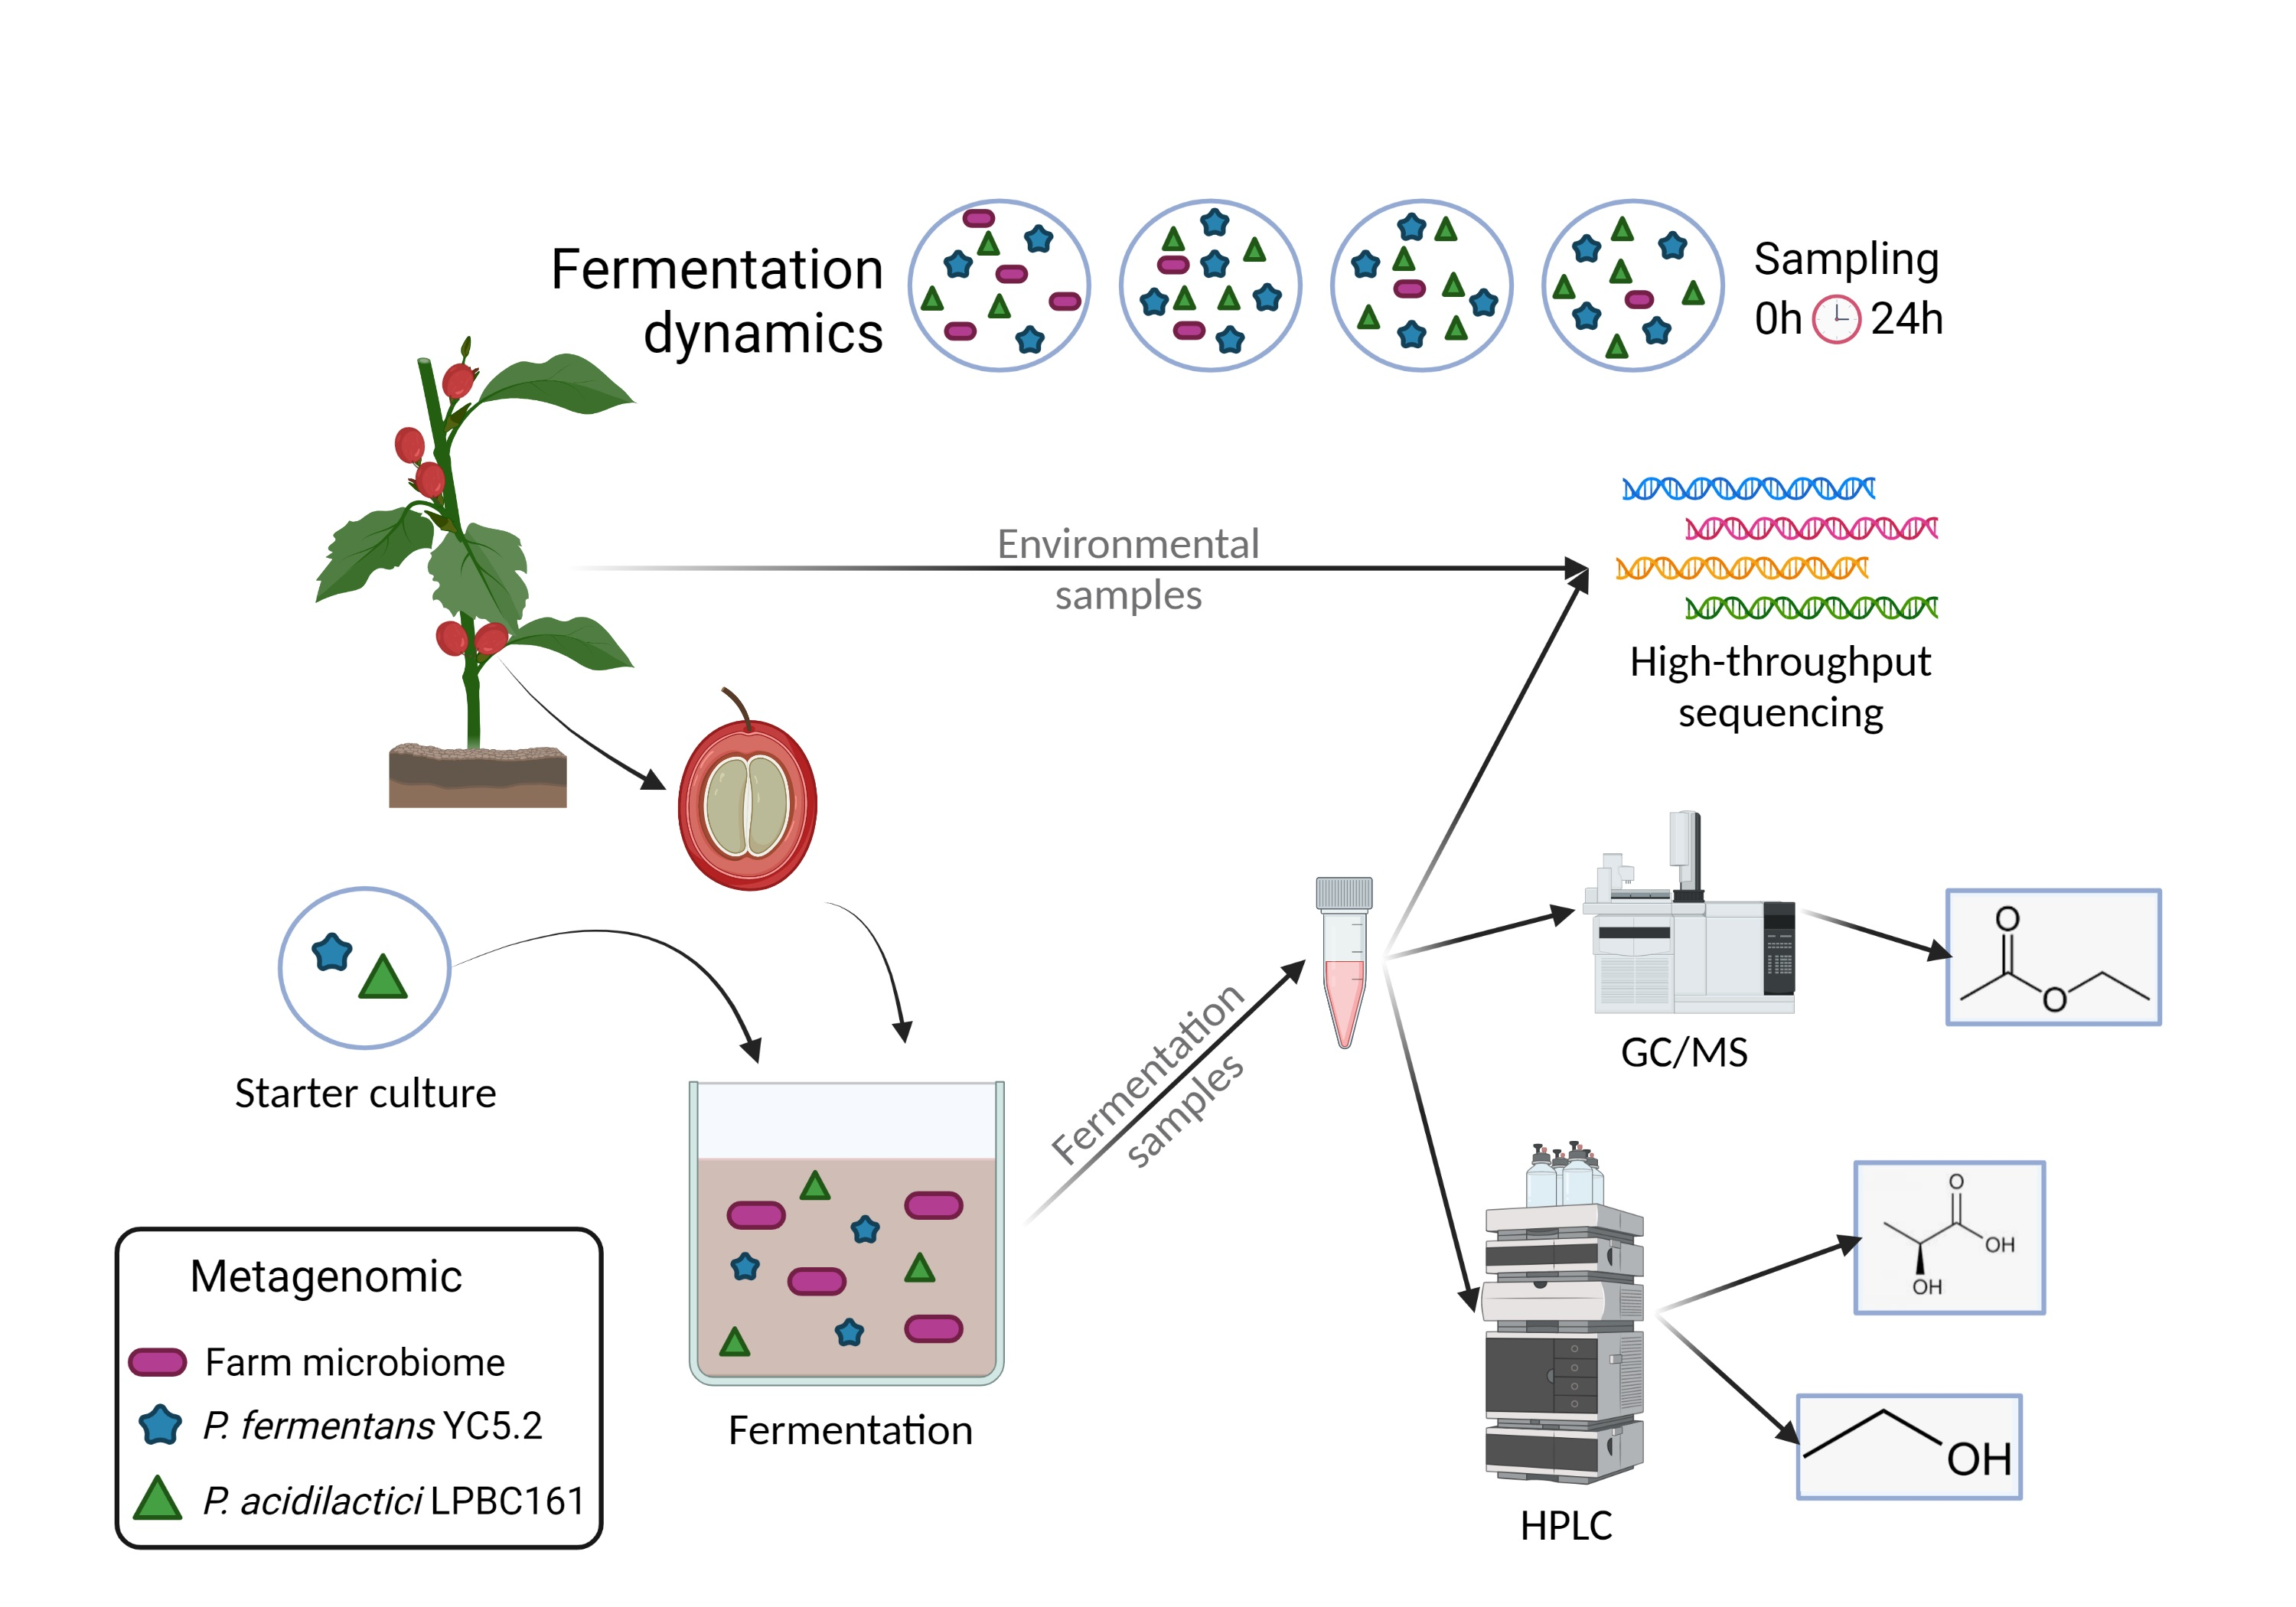
2.3. Microbial Community Analysis by High-Throughput Sequencing

Before performing the total DNA extraction of the environmental samples, the microbial cells present in the samples were taken out. About 2.5 g of each sample was added to a tube containing 10 mL of saline solution (0.9% NaCl) and vigorously agitated by vortex (two treated for 2 min with an interval of 15 min). To eliminate coarse impurities, the solution was filtered through a 0.45 μm filter. Fermentation samples and water used for de-pulping beans were not submitted to this process. The total DNA extraction of the samples was performed by the Phenol-Chloroform method described by Carvalho Neto et al. [21]. Group-specific loci of both bacterial and fungal DNA were amplified through PCR. 20 ng of DNA containing Illumina platform adapters [22], were used to amplify the hypervariable region V3/V4 of the bacterial 16S rRNA gene using the 515F-806R primers. The ITS fungal region was amplified by ITS1-ITS2 primers. Barcoded amplicons were generated by PCR under the following conditions: 95 °C for 3 min, and 18 cycles at 95 °C for 30 s, 50 °C for 30 s and 68 °C for 60 s, followed by a final extension at 68 °C for 10 min. Samples were sequenced in the MiSeq platform using the 500 V2 kits, following standard Illumina protocols. Bioinformatics analyses were performed according to Vale et al. [10].

2.4. HPLC Analysis of Fermenting Coffee Pulp

The concentration of reducing sugars (glucose and fructose) and organic acids (lactic, citric, succinic, acetic and propionic acids) in the liquid fraction of the coffee pulp mass in fermentation was determined by High-Performance Liquid Chromatography (HPLC). The samples were analyzed in an HPLC® Agilent Technologies coupled to a refraction index (RID) and diode matrix (DAD) detector. The separation of the compounds was obtained using a Hiplex-H column (300 × 7.7 mm) (Bio-Rad, Richmond, CA, USA) with an isocratic mobile phase composed of 4.0 mM H2SO4, with a flow rate of 0.5 mL min−1 for 30 min. The temperatures of the sample, column, and RID detector used during the entire race were 25, 70 and 50 °C, respectively. The quantification of organic acids was performed in DAD at 210 nm while reducing sugars were determined in RID.

2.5. GC/MS Analysis of Coffee Pulp and Beans

The determination of volatile compounds presents in the fermentation liquid fraction and the chemical constitution of the coffee beans collected during the fermentation process were determined by Gas Chromatography Coupled to Mass Spectrophotometry (GC/MS). Briefly, the compounds were analyzed by Solid Phase Microextraction (SPME), using a DVB/CAR/PDMS Fibre (Supelco Co., Bellefonte, PA, USA) and injected into GC/MS connected to an autosampler (GCMS2010 Plus, TQ8040, AO 5000; Shimadzu, Tokyo, Japan). The injection parameters used were according to the procedures described by Junqueira et al. [6].

2.6. Statistical Analysis

Statistical significance was calculated using a post-hoc comparison of means using Tukey’s test. Analyses were performed using the Statistica program, version 10.0 (Statsoft Inc., Tulsa, OK, USA). The level of significance was established using a two-sided p-value < 0.05. A principal component analysis (PCoA) based on Weighted UniFrac Distances was constructed using the microbial relative prevalence data (at both family and genus levels). Analyses were performed using the Statistica program, version 10.0 (Statsoft Inc., Tulsa, OK, USA).

3. Results and Discussion

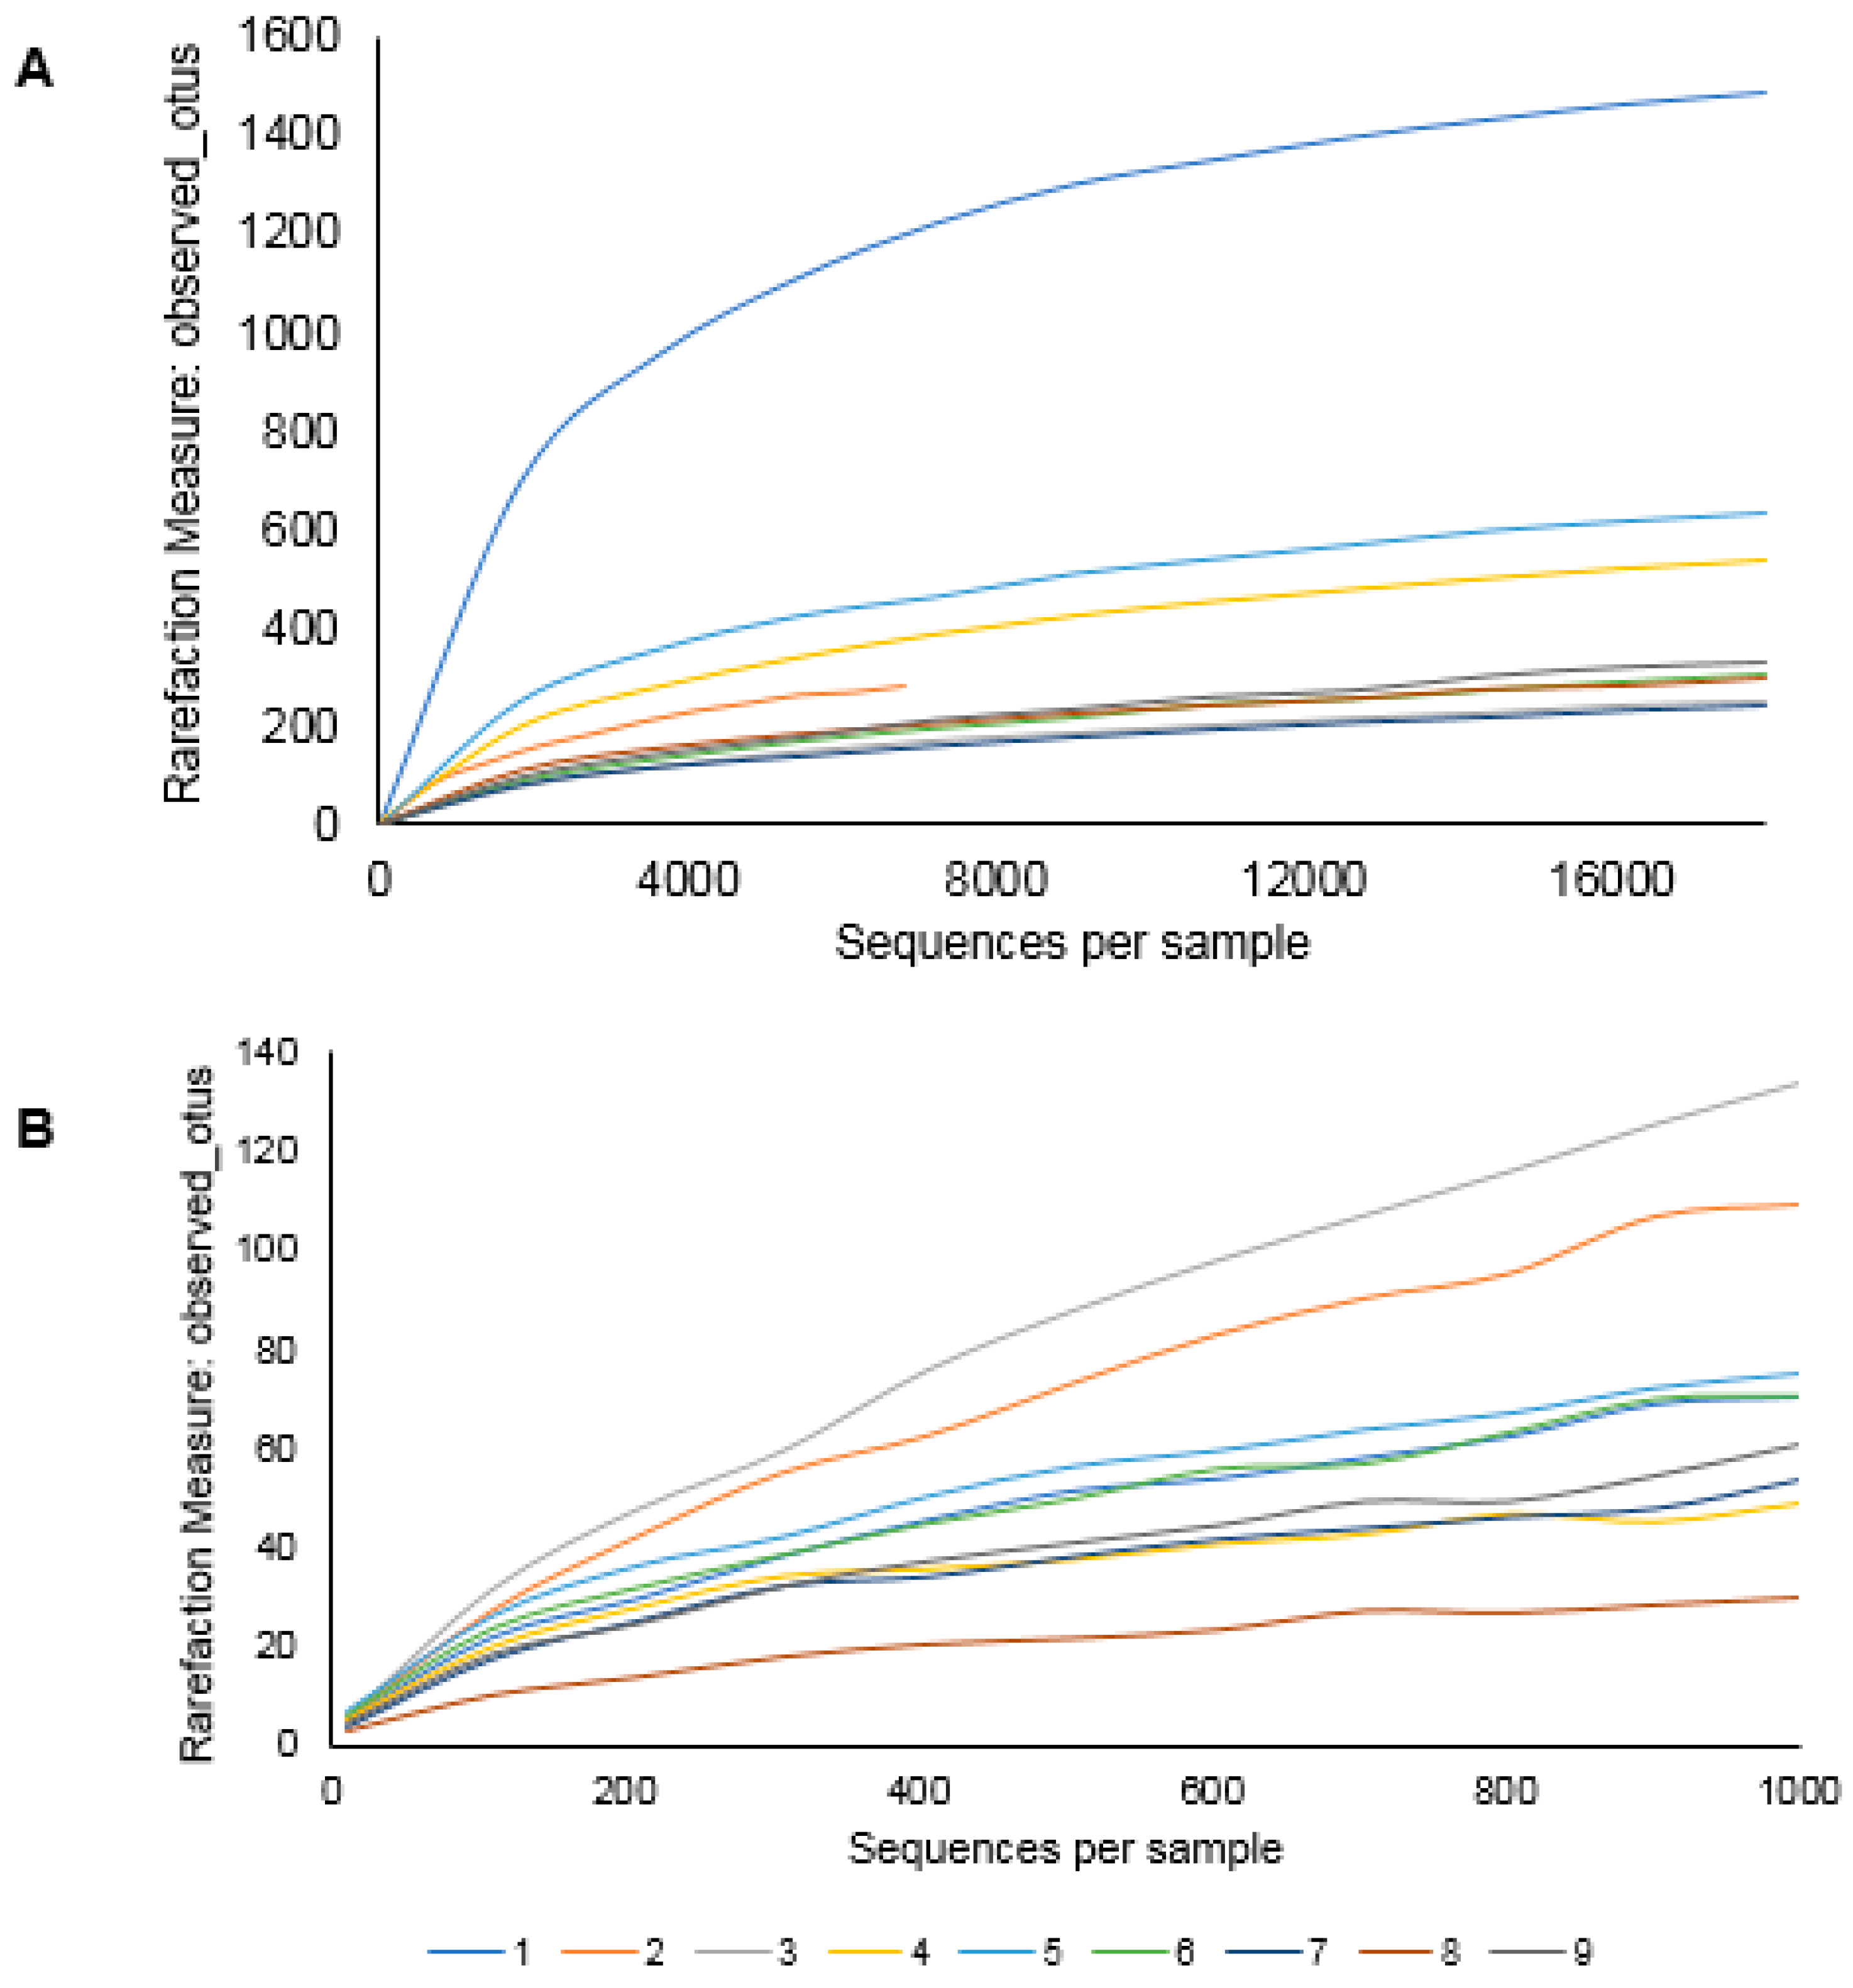
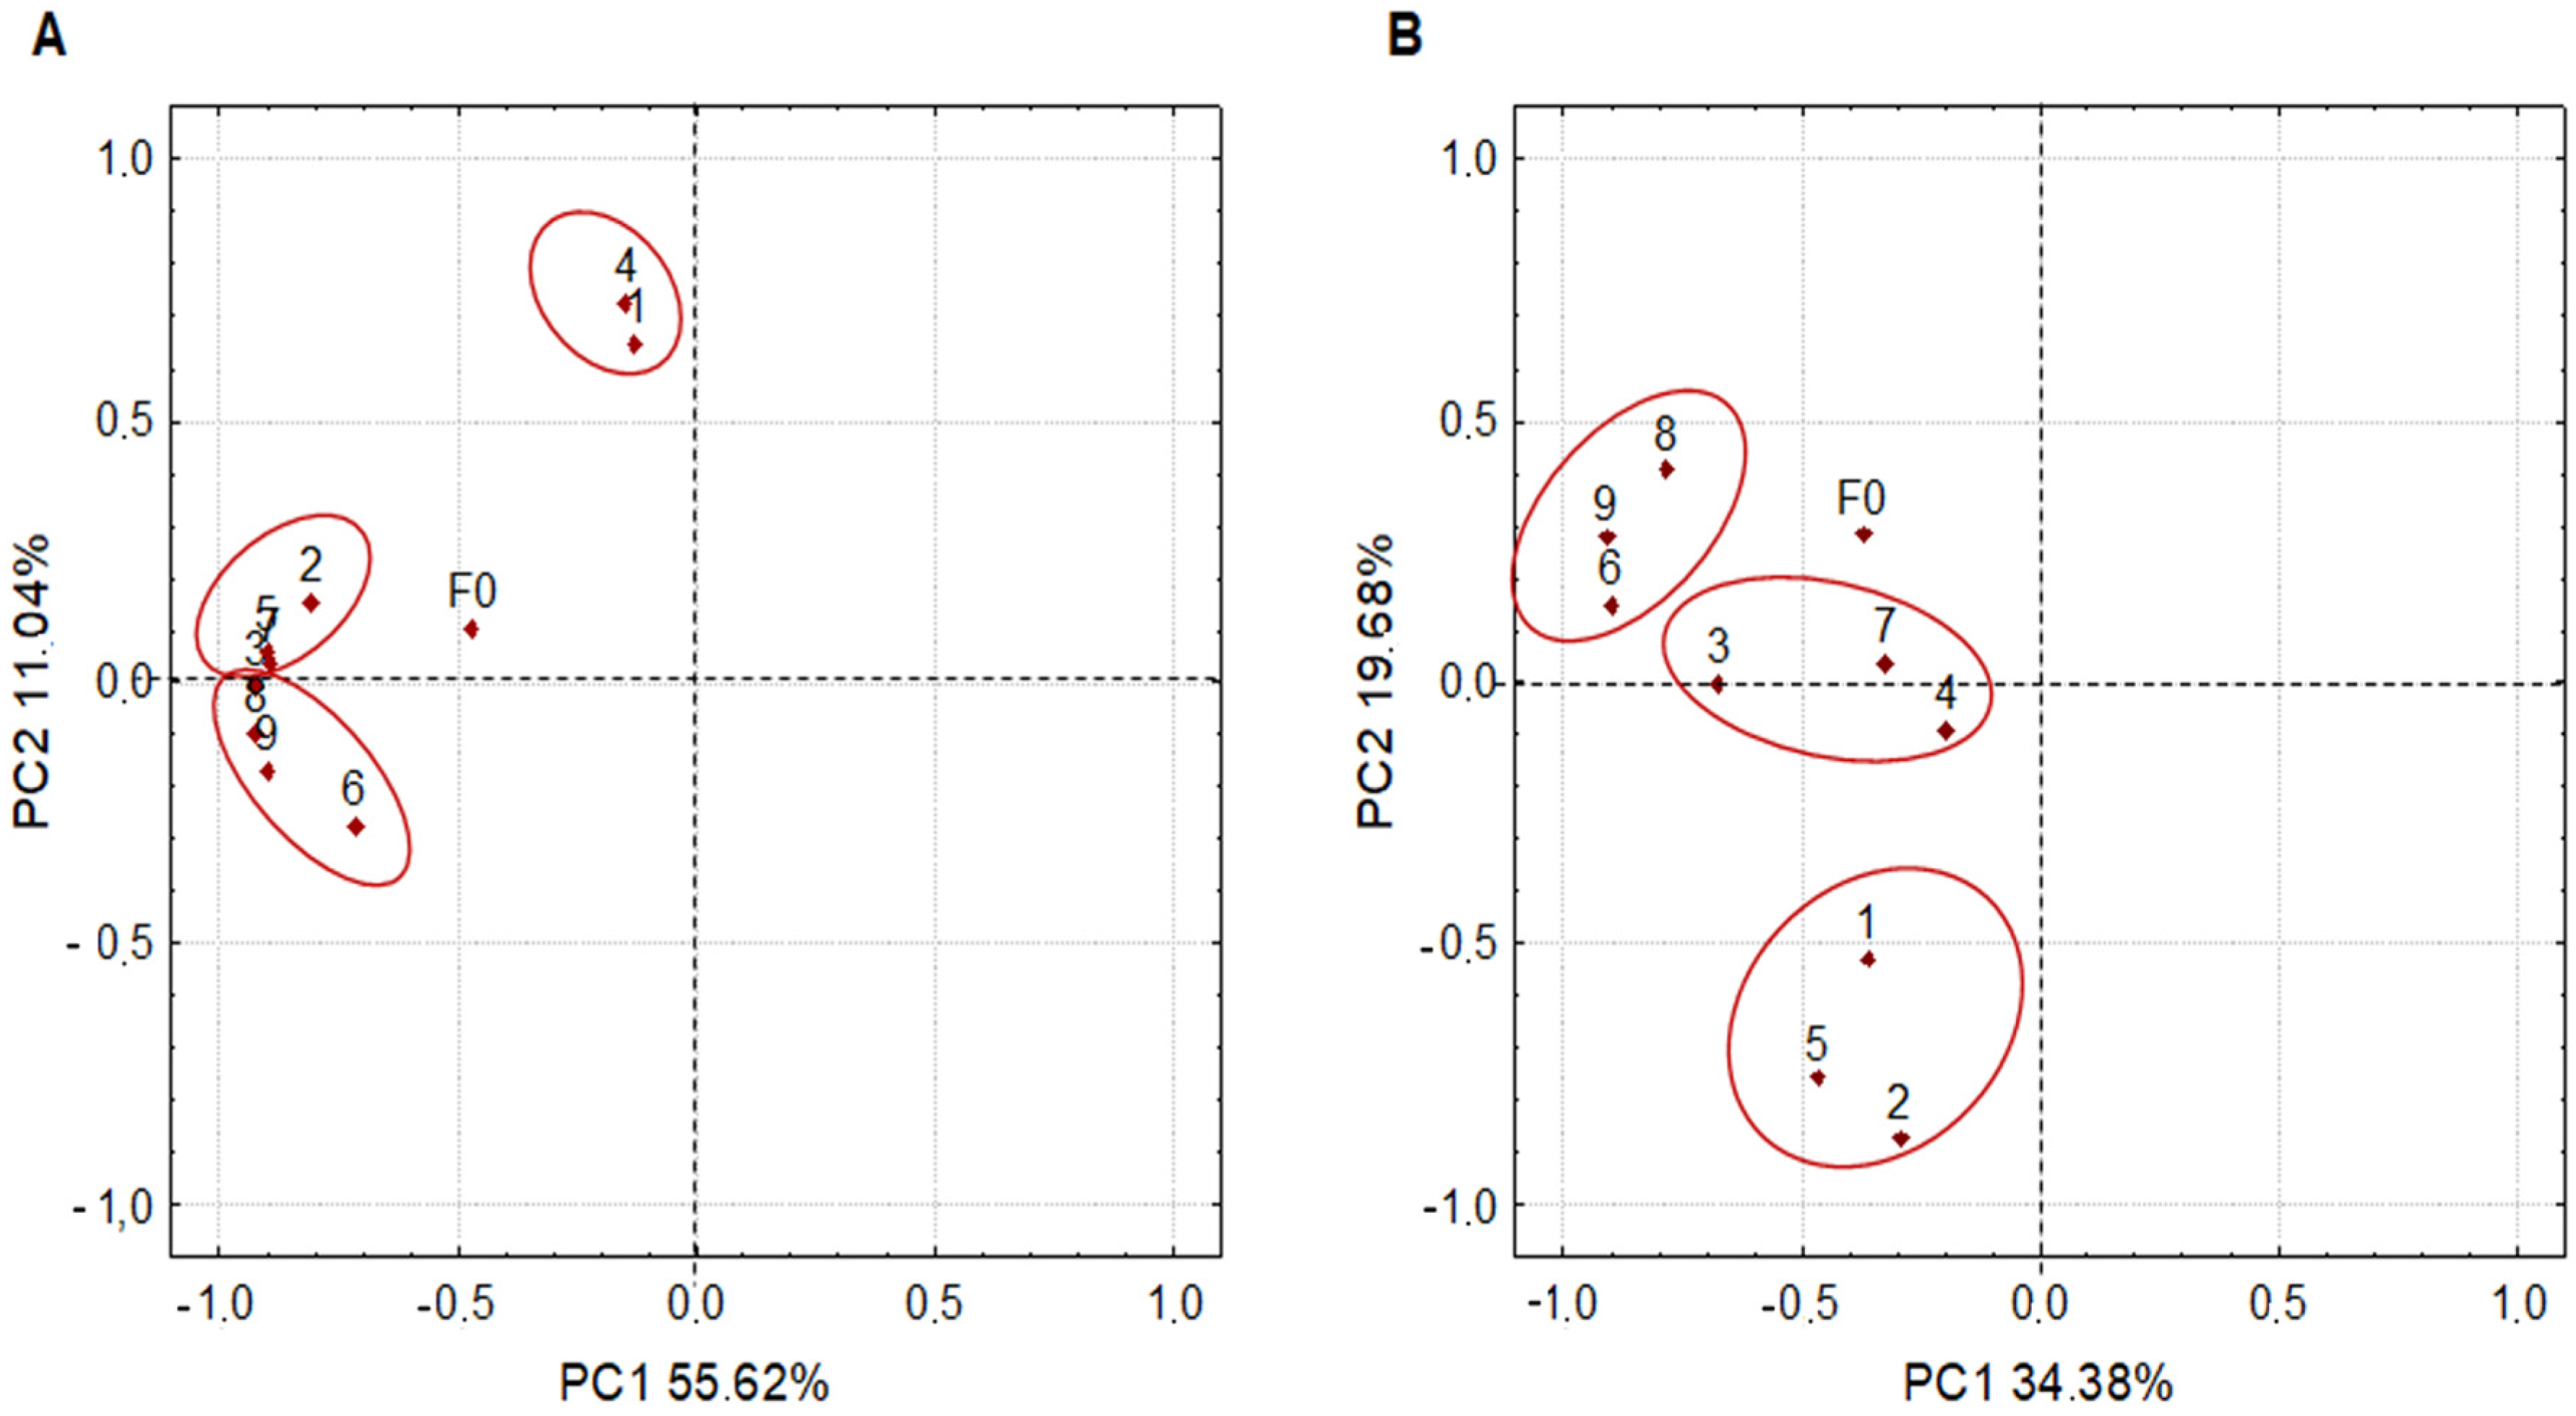
3.1. Farm Microbiome

To elucidate the influences of the environmental microbiota on the fermentation process, coffee fruits and leaves (collected from the coffee farm and on the ground), over-ripe fruits, cherries before de-pulping, depulped beans and water used for de-pulping beans, were collected to analyze the bacterial and fungal communities. A total of 282.288 sequences from the hypervariable region V3-V4 of the 16S rRNA gene and 158.316 from the Internal Transcribed Spacer (ITS) rDNA gene were obtained from all samples. Sequences that presented identity above 97% were considered the same Operational Taxonomic Unit (OTUs). Thus, 299 prokaryotes and 189 eukaryotes were identified (Table S1). The rarefaction curves were satisfactory, suggesting that most bacterial and fungal communities were covered (Figure 1).
The presence and abundance of the major bacteria and fungi, defined as taxa with proportional abundance ≥2%, are reported in Figure 2. In general, Enterobacteriaceae and Saccharomycetales were the most abundant microbial groups. To facilitate visualization of the results, PCA analysis was constructed to group the coffee farm samples according to microbial abundance and diversity (Figure 3). Among the eukaryotes, the samples were divided into three clusters; (i) cherries before de-pulping, depulped beans and water, characterized by the marked presence of the Saccharomycetales family; (ii) soil, leaves and fruits collected on the ground, and fruits collected from the coffee tree, characterized by a low frequency of Saccharomycetales and dominance of specific groups such as Pleosporales, Mycosphaerellaceae and Colletotrichum; and (iii) fruits collected on the ground, leaves collected from the coffee tree and over-ripe fruits, characterized by the dominance of Candida, Lecanoromycetes, and Fusarium, respectively. These results suggest that the first grouping (mainly cherries before de-pulping and depulped beans) may favor the fermentative process due to the high incidence of Saccharomycetales. This order comprises about 1000 known species, including the yeasts Pichia, Saccharomyces, Meyerozyma, Candida and Hanseniaspora that have been widely selected as starter cultures for coffee fermentation [8,18,23]. Moreover, it is likely that most of the yeasts found in these samples are endophytic, since the coffee cherries collected from the coffee trees had a low incidence of Saccharomycetales (1.33%), while the depulped fruits contained a high frequency (69.15%) (Figure 2B). On the other hand, the marked presence of filamentous fungi, such as Cladosporium, Colletotrichum, Fusarium and Mycosphaerellaceae are undesirable in the fermentation process and control measures should be adopted to reduce the contact of soil, leaves, fruits collected from the ground and over-ripe fruits with the fermentation tank. Interestingly, the genera Cladosporium and Fusarium were also observed at high frequency in soil from a Honduran coffee farm [10].
The bacterial group was also divided into three clusters; (i) leaves and fruits collected from the ground, cherries collected from the coffee tree and over-ripe fruits, by the high incidence of Enterobacteriaceae and Erwinia; (ii) cherries before de-pulping, depulped beans and water, with high frequencies of Enterobacteriaceae and Leuconostoc; and (iii) soil and leaves collected from the coffee tree, with high dominated of Amycolatopsis and Methylobacterium, respectively, and low frequency of Enterobacteriaceae. Lactococcus and Lactobacillus were also identified in high populations in the coffee leaves (Figure 2A).
High incidence of Enterobacteriaceae has already been reported in grape and coffee plantations [9,10,24]. In vineyards, this family is considered beneficial because they produce proteases, chitinases and glucanases, which make them excellent antagonistic microorganisms [25]. In addition, over 80% of the bacterial community of coffee fruits collected on the ground and over-ripe fruits was composed of Enterobacteriaceae and Erwinia, showing the ability of this group to secrete hydrolytic enzymes to support their growth on decaying organic matter [26]. However, these microorganisms are not undesirable in coffee fermentation, as a correlation analysis performed by Zhang et al. [9] showed that the main alcohols and esters produced from the course of the fermentation process were not associated with enterobacteria. In addition, Enterobacteriaceae are mainly associated formation of off-flavor metabolites, such as 3-isopropyl-2-methoxy-5-methylpyrazine, 2,3-butanediol and butyric acid [27]. Leuconostoc was observed in the coffee cherries before de-pulping (53.48%), depulped beans (20.24%) and in the water used for de-pulping beans (25.60%) (Figure 2A). After harvesting, coffee fruits are usually placed in storage bags for a few hours until they are processed. During this period, micro-cracks can be generated in the fruit skin and several amino acids and phosphorylated carbohydrates present in the coffee pulp become accessible to the epiphytic microbiota of the cherries. The abundance of Leuconostoc in these samples may be associated with its ability to produce a wide range of saccharolytic enzymes, as well as having an elaborate carbohydrate uptake system [7]. Shotgun metagenomic analysis of a coffee fermentation identified a gene that encodes hexose 6 phosphate: phosphate antiporter (uhpT). This transporter may favor Leuconostoc proliferation since phosphorylated hexoses can be transported into bacterial cells without ATP consumption [7].
The coffee farm soil showed a rich and complex microbial diversity, with 214 bacterial groups (Table S1). The high diversity found in the soil was also observed in other coffee-producing regions, such as China, Ecuador, Mexico, Brazil, and Honduras [9,10,28,29,30]. However, most of the bacterial groups that have been identified in coffee farm soils (e.g., Amycolatopsis, Bacillus, Bradyrhizobium, Pseudolabrys, Rhodoplanes, and Sphingomonas) are not associated with the fermentation process, so it should be avoided from having access to the fermentation tank.
Interestingly, coffee leaves showed a relatively high population of Lactococcus and Lactobacillus, which had not been reported so far. The ability of these strains to grow on leaves suggests that these microorganisms possess a metabolic versatility not yet explored, as LAB are auxotrophic for some amino acids and vitamins that are not bioavailable in coffee leaves [9,10,28,29,30,31]. In addition, these LAB produce lactic acid as a primary fermentation product, so they are useful for coffee processing [32].

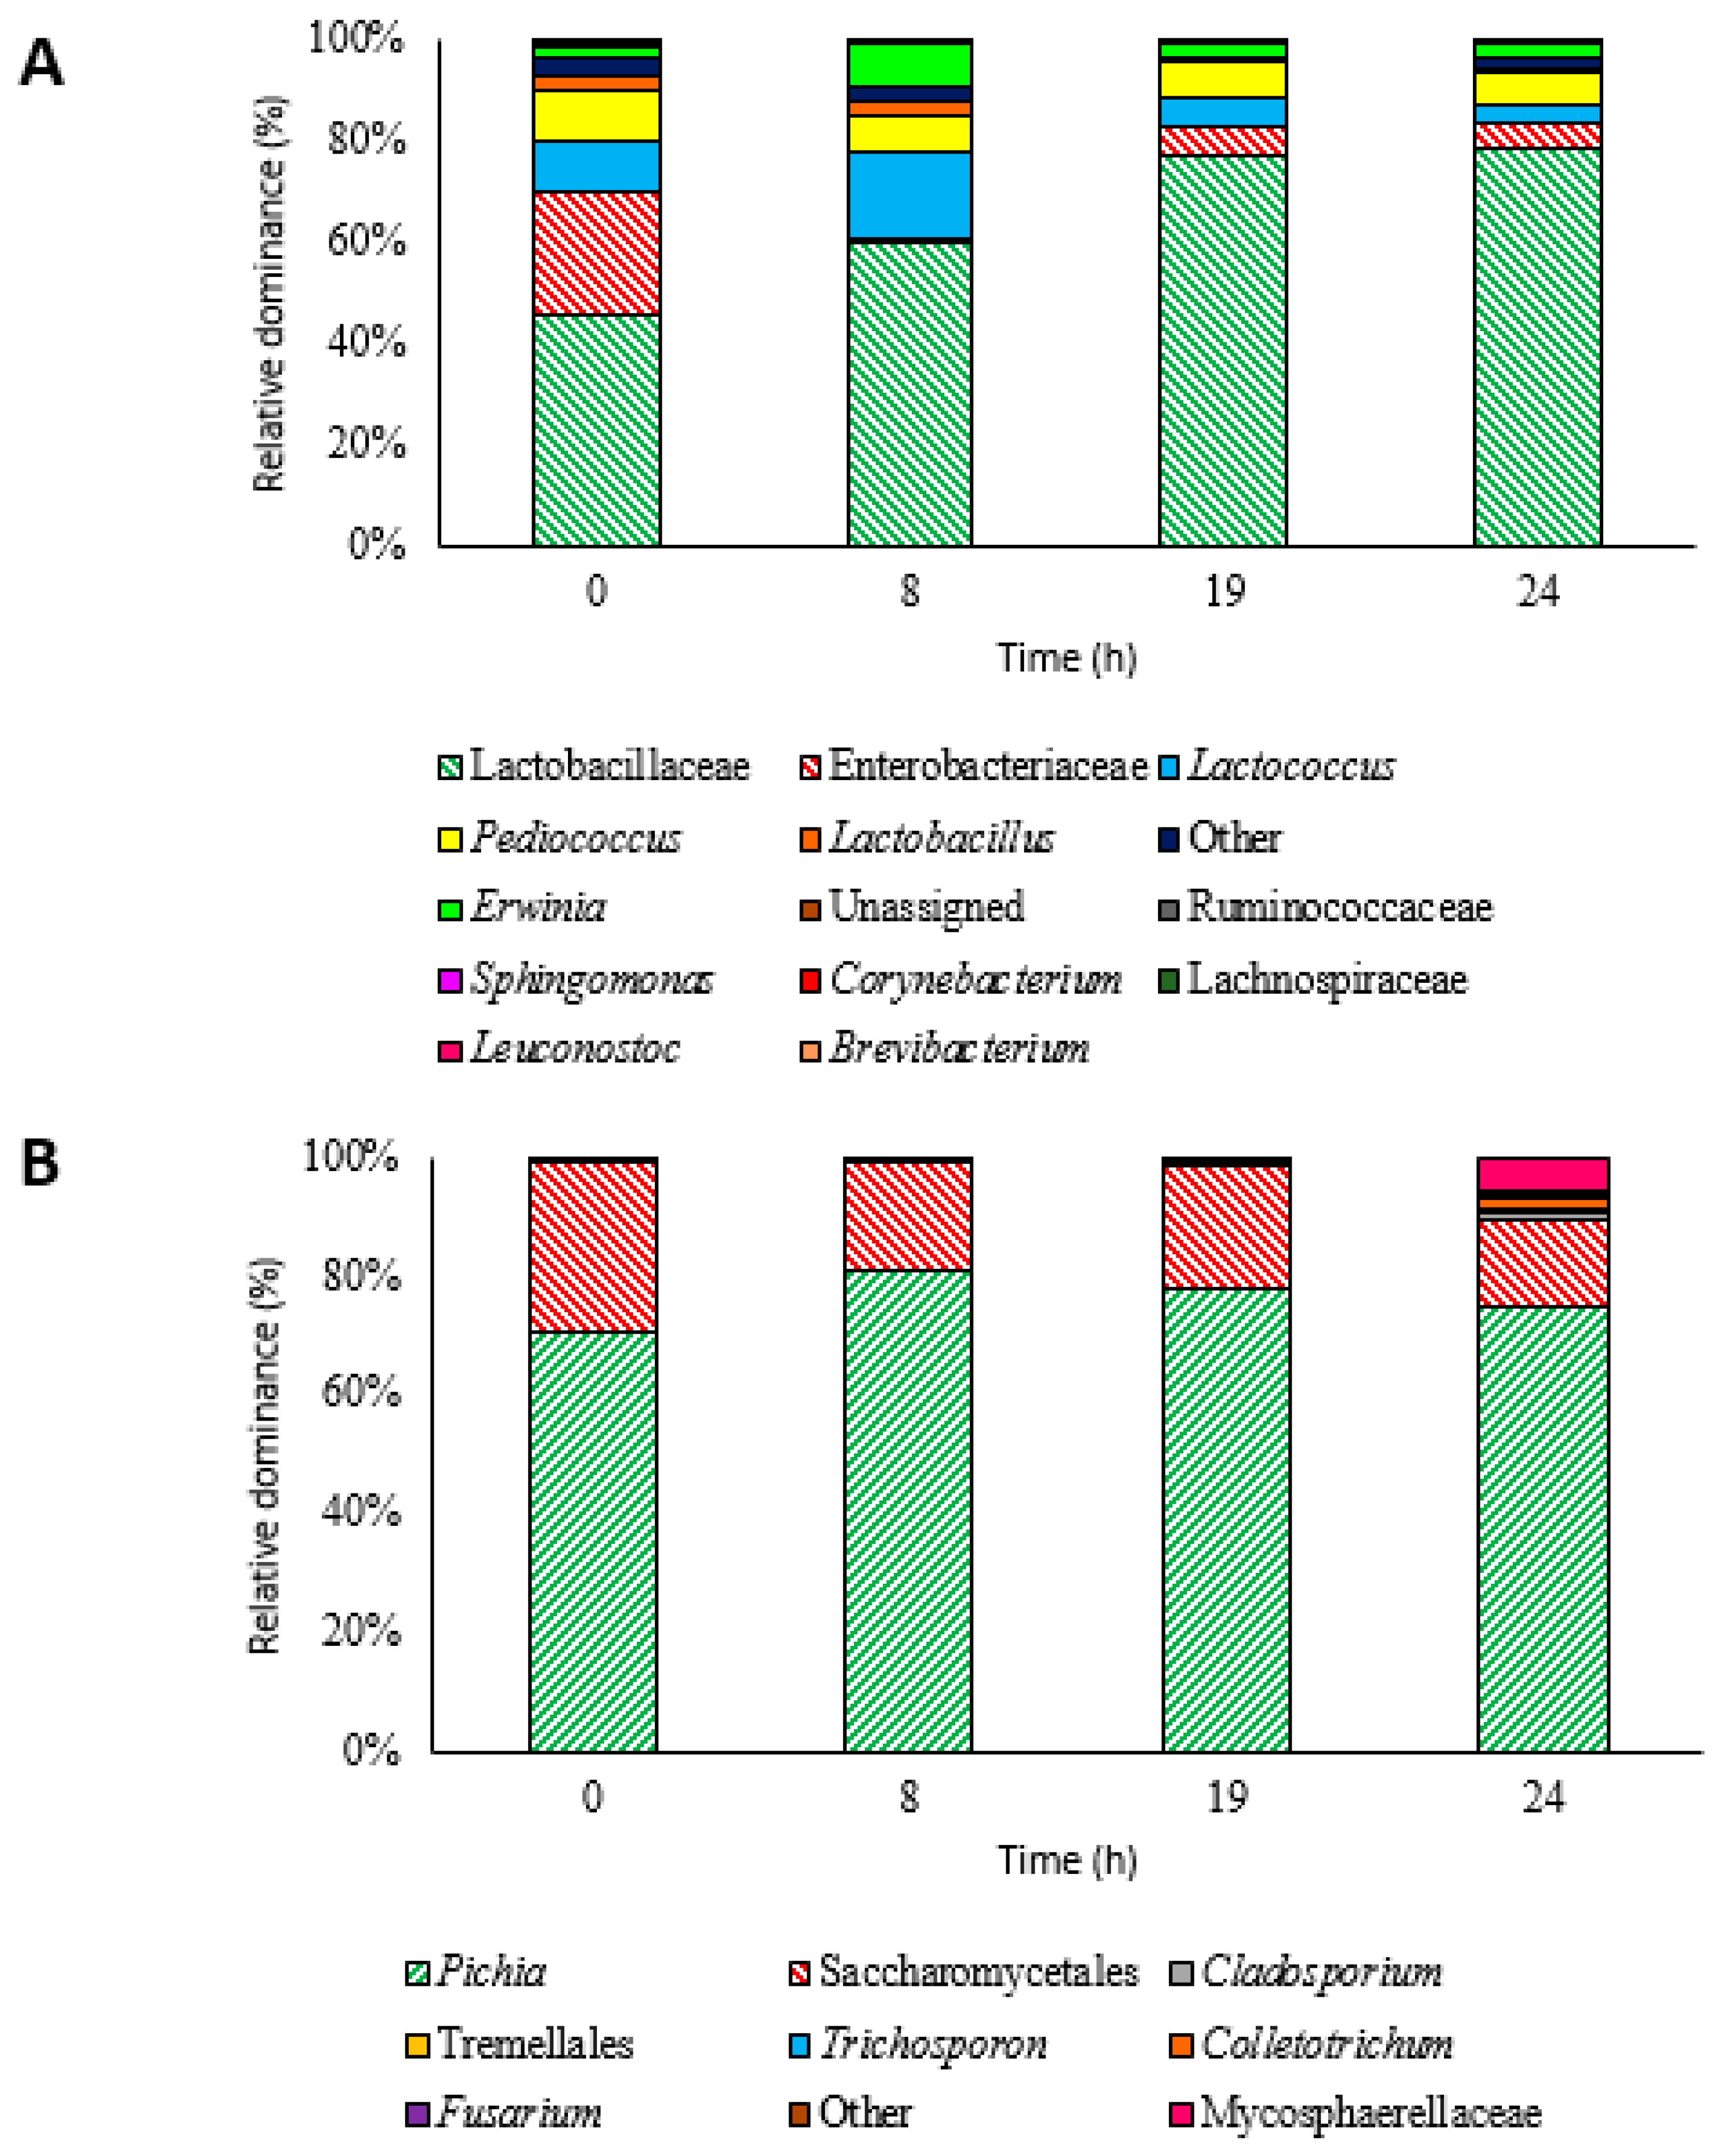
3.2. Microbiota Dynamics during Inoculated Coffee Fermentation

To improve the quality and complexity of fermented beverages, co-inoculation of LAB and yeast has been widely employed in the wine industry and more recently in coffee fermentations [10,33,34]. However, the starter cultures used in these processes must be able to suppress the growth of wild microbiota. The results reported in this study showed that co-inoculation favored the growth of the starter cultures (Figure 4). Pichia showed a population over 70% throughout the fermentative process. The family Lactobacillaceae, which includes Pediococcus, was also dominant at the beginning of the fermentative process (45.13%) followed by Enterobacteriaceae (23.85%) and Lactococcus (10.11%). After 8 h, the OTU readings attributed to Lactobacillaceae increased to 59.38%, suppressing the growth of Enterobacteriaceae (0.45%) and other species. At the end of the process, the reading of Lactobacillaceae increased to 77.40% (Figure 4).
The predominance of P. fermentans YC5.2 over the wild microbiota is mainly associated with the metabolic versatility of this yeast in tolerating osmotic pressure (growth detected with up to 50% glucose and fructose), ability to grow over a wide pH range (pH 2.0–8.0), growth at temperatures ranging from 30 to 43 °C, and tolerance to the main metabolites (ethanol, lactic acid and acetic acid) produced in the course of the fermentation [13]. Recently, analysis of the P. acidilactici LPBC161 genome performed by Muynarsk et al. [19] showed that its high fermentative capacity can be explained by the presence of several genes involved in the metabolism of sugars present in the coffee pulp, in addition to genes encoding proteins related to oxidative and alkaline stress. Vale et al. [18] also demonstrated that there is a positive synergistic interaction between LAB and yeast. The possible hypotheses to explain these interactions are (i) yeast autolysis releases nutrients, such as polysaccharides, riboflavin, and amino acids, favorable for bacterial growth and (ii) acidification of the fermentation medium by LAB creates a favorable environment for yeast development. Enabling the development and co-dominance of these two species.
Although LAB and yeast are the main microbial groups involved in coffee fermentations, the dominance of both these microbial groups may not be observed during spontaneous process. For instance, codominance of AAB (Gluconobacter and Acetobacter), LAB (Leuconostoc and Lactococcus), yeasts (Hanseniaspora, Candida, and Pichia) and the filamentous fungus Fusarium was recently observed in a spontaneous fermentation conducted in Honduras [10]. The microbial dynamics of another spontaneous fermentation conducted in Australia also showed some peculiarities. Although LAB increased during the fermentation process, it was noted that the population of Enterobacteriaceae and other subdominant microbial groups remained high after 36 h of fermentation [14]. Thus, the use of starter cultures is seen as essential to ensure the growth of beneficial microorganisms (i.e., yeast and LAB) during coffee fermentation.
Interestingly, during the entire fermentation process, a total of 135 and 115 prokaryotic and eukaryotic groups were identified, respectively (Table S2). The fermentation started with only 86 prokaryotes and 45 eukaryotes. It was noted that some species (e.g., Trichococcus, Terriglobus, Fusobacterium, Passalora and Lecanosticta) were not associated with the farm microbiome, suggesting that these microorganisms may have been introduced into the fermentation by human contact. In addition, several microbial genera (e.g., Penicillium, Malassezia, Debaryomyces, Enterobacter, Pseudomonas and Kaistobacter), associated with farm microbiome, were detected only 8 h after the start of the fermentation process. Besides human contact, one of the contamination routes is likely to air since the coffee fermentations are carried out in open tanks. However, it is important to note that all these contaminants were present at frequencies ≤0.01%, showing that the starter cultures were able to suppress their growth. Thus, the use of starter cultures proves to be extremely important for maintaining desirable microbial groups during coffee beans fermentation.

3.3. Chemical Analysis of the Fermentation Liquid Fraction and Coffee Beans

The sugar consumption profile and metabolic formation showed the activity of the initial cultures used during the fermentation process. Glucose and fructose were consumed during fermentation and transformed mainly into lactic acid (associated with the metabolism of P. acidilactici LPBC161) and ethanol (associated with the metabolism of P. fermentans YC5.2) as shown in Table 1. It is possible to observe a decrease in sugars (glucose and fructose) during the 24 h of fermentation (Table 1). Both glucose and fructose were partially consumed until the end of the process. During the fermentation process, sugars were used for microbial growth and a significant amount of ethanol and lactic acid were produced, causing a drop in pH (5.16 to 4.13). The reduction of pH levels below 4.5 is a method widely used by coffee producers to determine the end of the fermentation of coffee beans during the wet processing method [11,35]. In addition, in conjecture with organic acid production, ethanol generation inhibits the growth of undesirable microorganisms during the fermentation process.
HPLC analysis of the liquid fermentation fraction revealed the high presence of lactic acid and ethanol. These compounds were associated with LAB and yeast metabolism, respectively. Lactic acid was the main organic acid produced, reaching a concentration of 1.41 g/L at 24 h (Table 1). This primary metabolite is mainly produced by the central carbon metabolism of homofermentative LAB [35]. The diffusion of acids in the grains can influence the flavor and final quality of the beverage [13,17]. Lactic acid is known to attribute desirable lactic sensory notes and contribute to the acidity and body of the final drink [15]. Ethanol showed a constant increase throughout fermentation (0.8 g/L), indicating a high metabolic activity of non-Saccharomyces yeasts [8].
Among the volatiles, GC-MS analyses identified nine compounds, two higher alcohols, four esters and three aldehydes (Table 1). Ethyl acetate was the most abundant compound formed during fermentation. P. fermentans YC5.2 was selected based mainly on the production of this metabolite, which plays an important role in the development of aroma for coffee beans [13]. The diffusion and persistence of ethyl acetate in the grain contributes to the development of desirable fruit notes and nuances of grape/cherry in the coffee beverage [3]. Other volatile compounds produced during fermentation, associated with the metabolism of early cultures, include isoamyl acetate and ethyl isobutyrate.
In addition to aromatic function, yeast used in this study as an initial culture has been reported in previous studies as producers of pectinitic enzymes. Thus, it assists in the degradation of pectin present in coffee pulp and mucilage, producing metabolites that spread into coffee beans, favoring the flavor formation of the final beverage [36]. Significantly, the roasted grains of fermentation with the inoculation of YC5.2 and LPBC161 brought these metabolites derived from yeast. Table 2 shows the compounds detected inside the coffee beans during the fermentation process. Twenty-five compounds were identified: three organic acids, seven upper alcohols, eight aldehydes, one terpene, two terpenes, one pyrazine, one ketone and two hydrocarbons. Although the identified compounds fluctuated throughout the fermentation process, acetic acid, isorvalériic acid, butanal, 3-methyl, hexanal, benzeacetaldehyde, benzaldehyde and acetone were observed in high proportions. Interestingly, even though the main compound is identified in the liquid fraction of fermentation, ethyl acetate was only identified in coffee beans after 7 pm. In addition, isoamyl acetate and ethyl isobutyrate were not identified, which may also come from the initial metabolism.
The diffusion of volatile compounds in coffee beans is not fully understood. However, Salem et al. [36] demonstrated that the compounds butanal, 2-fenontanol and isoamyl acetate presented different transfer rates from culture medium to coffee beans. The study suggested that the differences observed in the diffusion of compounds in grains may be associated with three processes (i) the parchment layer is a barrier, which “acts” as a filter; (ii) the compounds suffered metabolic reactions, decreasing their amount in coffee beans; (iii) there is an interaction between volatiles and yeast, significantly reducing the transfer of these compounds.
Finally, several other compounds identified in the roasted grains in the fermentation process were detected. These volatiles can be generated mainly during the course of fermentation by biochemical reactions within the bean or even by reactions that occur during the roasting process. It is known that the volatile fraction of coffee beans develops mainly in the form of alcohols, acids, esters and aldehydes [37]. Compounds of these classes are associated with flavor during coffee fermentation.

4. Conclusions

The coffee farm microbiome is composed of a rich microbiome diversity dominated by Saccharomycetales and Enterobacteriaceae. Coffee cherries before de-pulping and depulped beans harbour beneficial microorganisms (yeast and LAB) for the fermentation process. On the other hand, enterobacteria, filamentous fungi and other microbial groups presents in soil, leaves, fruits collected from the ground and over-ripe fruits may transfer unwanted aromas to coffee beans. Therefore, they should be prevented from having access to the fermentation tank. Thus, cleaning procedures should be performed to prevent the growth of these unwanted microbial groups.
The inoculation with high titers of selected yeast and LAB start culture modulates the overall fermentation over wild microbiota, with efficient sugar mucilage consumption and aroma compounds formation. Thus, the results of this study showed that the introduction of starter cultures is essential to control the coffee fermentation process in terms of both kinetics and quality of the resulting product.

Supplementary Materials

The following are available online at https://0-www-mdpi-com.brum.beds.ac.uk/article/10.3390/fermentation7040278/s1, Table S1: Relative abundance (%) of fungi and bacteria detected in environmental samples collected from Brazil coffee plantations. Table S2: The relative abundance (%) of fungi and bacteria during the inoculated fermentation process.

Author Contributions

Conceptualization, C.R.S.; Data curation, A.d.S.V.; Formal analysis, V.B.P. and D.P.d.C.N.; Funding acquisition, G.V.d.M.P. and C.R.S.; Investigation, G.V.d.M.P. and D.P.d.C.N.; Methodology, A.d.S.V.; Project administration, G.V.d.M.P. and C.R.S.; Writing—original draft, V.B.P. and G.V.d.M.P.; Writing—review & editing, A.d.S.V., D.P.d.C.N. and C.R.S. The authors are responsible for all the aspects of the manuscript. All authors have read and agreed to the published version of the manuscript.

Funding

This work was supported by the Brazilian National Council for Scientific and Technological Development (CNPq) (project number 429560/2018-4).

Institutional Review Board Statement

Not applicable.

Informed Consent Statement

Not applicable.

Acknowledgments

The authors thank the CNPq for fellowships in research (grant numbers 303254/2017-3 and 151885/2019-2).

Conflicts of Interest

The authors declare no conflict of interest.

References

  1. ICO. Coffee year production by country. Data 2021, 2021, 7–9. [Google Scholar]
  2. de Melo Pereira, G.V.; Soccol, V.T.; Brar, S.K.; Neto, E.; Soccol, C.R. Microbial ecology and starter culture technology in coffee processing. Crit. Rev. Food Sci. Nutr. 2017, 57, 2775–2788. [Google Scholar] [CrossRef] [PubMed]
  3. de Melo Pereira, G.V.; de Carvalho Neto, D.P.; Júnior, A.I.M.; Vásquez, Z.S.; Medeiros, A.B.P.; Vandenberghe, L.P.S.; Soccol, C.R. Exploring the impacts of postharvest processing on the aroma formation of co ff ee beans–A review. Food Chem. 2019, 272, 441–452. [Google Scholar] [CrossRef]
  4. de Carvalho Neto, D.P.; de Melo Pereira, G.V.; Tanobe, V.O.A.; Soccol, V.T.; da Silva, B.J.G.; Rodrigues, C.; Soccol, C.R. Yeast diversity and physicochemical characteristics associated with coffee bean fermentation from the Brazilian Cerrado Mineiro region. Fermentation 2017, 3, 11. [Google Scholar] [CrossRef]
  5. De Bruyn, F.; Zhang, S.J.; Pothakos, V.; Torres, J.; Lambot, C.; Moroni, A.V.; Callanan, M.; Sybesma, W.; Weckx, S.; De Vuysta, L. Exploring the Impacts of Postharvest Processing on the Microbiota and. Appl. Environ. Microbiol. 2017, 83, 1–16. [Google Scholar] [CrossRef] [Green Version]
  6. de Oliveira Junqueira, A.C.; de Melo Pereira, G.V.; Coral Medina, J.D.; Alvear, M.C.R.; Rosero, R.; de Carvalho Neto, D.P.; Enríquez, H.G.; Soccol, C.R. First description of bacterial and fungal communities in Colombian coffee beans fermentation analysed using Illumina-based amplicon sequencing. Sci. Rep. 2019, 9, 8794. [Google Scholar] [CrossRef] [PubMed] [Green Version]
  7. Pothakos, V.; De Vuyst, L.; Zhang, S.J.; De Bruyn, F.; Verce, M.; Torres, J.; Callanan, M.; Moccand, C.; Weckx, S. Temporal shotgun metagenomics of an Ecuadorian coffee fermentation process highlights the predominance of lactic acid bacteria. Curr. Res. Biotechnol. 2020, 2, 1–15. [Google Scholar] [CrossRef]
  8. Elhalis, H.; Cox, J.; Zhao, J. Ecological diversity, evolution and metabolism of microbial communities in the wet fermentation of Australian coffee beans. Int. J. Food Microbiol. 2020, 321, 108544. [Google Scholar] [CrossRef]
  9. Zhang, S.J.; De Bruyn, F.; Pothakos, V.; Torres, J.; Falconi, C.; Moccand, C.; Weckx, S.; De Vuyst, L. Following coffee production from cherries to cup: Microbiological and metabolomic analysis of wet processing of Coffea arabica. Appl. Environ. Microbiol. 2019, 85, e02635-18. [Google Scholar] [CrossRef] [Green Version]
  10. da Silva Vale, A.; de Melo Pereira, G.V.; de Carvalho Neto, D.P.; Sorto, R.D.; Goés-Neto, A.; Kato, R.; Soccol, C.R. Facility-specific ‘house’ microbiome ensures the maintenance of functional microbial communities into coffee beans fermentation: Implications for source tracking. Environ. Microbiol. Rep. 2021, 13, 470–481. [Google Scholar] [CrossRef]
  11. Carvalho Neto, D.P.; de Melo Pereira, G.V.; Finco, A.M.O.; Letti, L.A.J.; da Silva, B.J.G.; Vandenberghe, L.P.S.; Soccol, C.R. Efficient coffee beans mucilage layer removal using lactic acid fermentation in a stirred-tank bioreactor: Kinetic, metabolic and sensorial studies. Food Biosci. 2018, 26, 80–87. [Google Scholar] [CrossRef]
  12. de Carvalho Neto, D.P.; Vinícius De Melo Pereira, G.; Finco, A.M.O.; Rodrigues, C.; De Carvalho, J.C.; Soccol, C.R. Microbiological, physicochemical and sensory studies of coffee beans fermentation conducted in a yeast bioreactor model. Food Biotechnol. 2020, 34, 172–192. [Google Scholar] [CrossRef]
  13. de Melo Pereira, G.V.; Soccol, V.T.; Pandey, A.; Medeiros, A.B.P.; Andrade Lara, J.M.R.; Gollo, A.L.; Soccol, C.R. Isolation, selection and evaluation of yeasts for use in fermentation of coffee beans by the wet process. Int. J. Food Microbiol. 2014, 188, 60–66. [Google Scholar] [CrossRef] [PubMed]
  14. Elhalis, H.; Cox, J.; Frank, D.; Zhao, J. Microbiological and biochemical performances of six yeast species as potential starter cultures for wet fermentation of coffee beans. LWT 2021, 137, 110430. [Google Scholar] [CrossRef]
  15. de Melo Pereira, G.V.; de Carvalho Neto, D.P.; Medeiros, A.B.P.; Soccol, V.T.; Neto, E.; Woiciechowski, A.L.; Soccol, C.R. Potential of lactic acid bacteria to improve the fermentation and quality of coffee during on-farm processing. Int. J. Food Sci. Technol. 2016, 51, 1689–1695. [Google Scholar] [CrossRef]
  16. Ribeiro, L.S.; da Cruz Pedrozo Miguel, M.G.; Martinez, S.J.; Bressani, A.P.P.; Evangelista, S.R.; e Batista, C.F.S.; Schwan, R.F. The use of mesophilic and lactic acid bacteria strains as starter cultures for improvement of coffee beans wet fermentation. World J. Microbiol. Biotechnol. 2020, 36, 1–15. [Google Scholar] [CrossRef]
  17. Evangelista, S.R.; Silva, C.F.; da Cruz Miguel, M.G.P.; de Sauza Cordeiro, C.; Pinheiro, A.C.M.; Duarte, W.F.; Schwan, R.F. Improvement of coffee beverage quality by using selected yeasts strains during the fermentation in dry process. Food Res. Int. 2014, 61, 183–195. [Google Scholar] [CrossRef] [Green Version]
  18. Vale, A.; de Melo Pereira, G.V.; de Carvalho Neto, D.P.; Rodrigues, C.; Pagnoncelli, M.G.B.; Soccol, C.R. Effect of Co-Inoculation with pichia fermentans and pediococcus acidilactici on metabolite produced during fermentation and volatile composition of coffee beans. Fermentation 2019, 5, 67. [Google Scholar] [CrossRef] [Green Version]
  19. Muynarsk, E.S.M.; de Melo Pereira, G.V.; Mesa, D.; Thomaz-soccol, V.; Pagnoncelli, M.G.B.; Soccol, C.R. Draft Genome Sequence of Pediococcus acidilactici Strain. Microbiol. Resour. Announc. 2019, 8, e00332-19. [Google Scholar] [CrossRef] [Green Version]
  20. Feltrin, V.P.; Sant’Anna, E.S.; Porto, A.C.S.; Torres, R.C.O. Produçao de lactobacillus plantarum em melaço de cana-de-açûcar. Braz. Arch. Biol. Technol. 2000, 43, 119–124. [Google Scholar] [CrossRef] [Green Version]
  21. de Carvalho Neto, D.P.; de Melo Pereira, G.V.; de Carvalho, J.C.; Soccol, V.T.; Soccol, C.R. High-throughput rRNA gene sequencing reveals high and complex bacterial diversity associated with brazilian coffee bean fermentation. Food Technol. Biotechnol. 2018, 56, 90–95. [Google Scholar] [CrossRef]
  22. Caporaso, J.G.; Lauber, C.L.; Walters, W.A.; Berg-Lyons, D.; Huntley, J.; Fierer, N.; Owens, S.M.; Betley, J.; Fraser, L.; Bauer, M.; et al. Ultra-high-throughput microbial community analysis on the Illumina HiSeq and MiSeq platforms. ISME J. 2012, 6, 1621–1624. [Google Scholar] [CrossRef] [Green Version]
  23. Bressani, A.P.P.; Martinez, S.J.; Sarmento, A.B.I.; Borém, F.M.; Schwan, R.F. Organic acids produced during fermentation and sensory perception in specialty coffee using yeast starter culture. Food Res. Int. 2020, 128, 108773. [Google Scholar] [CrossRef]
  24. Nisiotou, A.A.; Rantsiou, K.; Iliopoulos, V.; Cocolin, L.; Nychas, G.J.E. Bacterial species associated with sound and Botrytis-infected grapes from a Greek vineyard. Int. J. Food Microbiol. 2011, 145, 432–436. [Google Scholar] [CrossRef] [PubMed]
  25. Pinto, C.; Pinho, D.; Sousa, S.; Pinheiro, M.; Egas, C.; Gomes, A.C. Unravelling the diversity of grapevine microbiome. PLoS ONE 2014, 9, e85622. [Google Scholar] [CrossRef] [Green Version]
  26. Zhou, S.; Ingram, L.O. Synergistic hydrolysis of carboxymethyl cellulose and acid-swollen cellulose by two endoglucanases (CelZ and CelY) from Erwinia chrysanthemi. J. Bacteriol. 2000, 182, 5676–5682. [Google Scholar] [CrossRef] [PubMed] [Green Version]
  27. Gueule, D.; Fourny, G.; Ageron, E.; Le Flèche-Matéos, A.; Vandenbogaert, M.; Grimont, P.A.D.; Cilas, C. Pantoea coffeiphila sp. nov., cause of the ‘potato taste’ of Arabica coffee from the African great lakes region. Int. J. Syst. Evol. Microbiol. 2015, 65, 23–29. [Google Scholar] [CrossRef] [Green Version]
  28. Zhao, Q.; Xiong, W.; Xing, Y.; Sun, Y.; Lin, X.; Dong, Y. Long-Term Coffee Monoculture Alters Soil Chemical Properties and Microbial Communities. Sci. Rep. 2018, 8, 6116. [Google Scholar] [CrossRef]
  29. Cabrera-Rodríguez, A.; Trejo-Calzada, R.; García-De la Peña, C.; Arreola-Ávila, J.G.; Nava-Reyna, E.; Vaca-Paniagua, F.; Díaz-Velásquez, C.; Meza-Herrera, C.A. A metagenomic approach in the evaluation of the soil microbiome in coffee plantations under organic and conventional production in tropical agroecosystems. Emir. J. Food Agric. 2020, 32, 263–270. [Google Scholar] [CrossRef]
  30. Veloso, T.G.R.; da Silva, M.d.C.S.; Cardoso, W.S.; Guarçoni, R.C.; Kasuya, M.C.M.; Pereira, L.L. Effects of environmental factors on microbiota of fruits and soil of Coffea arabica in Brazil. Sci. Rep. 2020, 10, 14692. [Google Scholar] [CrossRef]
  31. de Melo Pereira, G.V.; De Carvalho Neto, D.P.; Junqueira, A.C.D.O.; Karp, S.G.; Letti, L.A.J.; Magalhães Júnior, A.I.; Soccol, C.R. A Review of Selection Criteria for Starter Culture Development in the Food Fermentation Industry. Food Rev. Int. 2020, 36, 135–167. [Google Scholar] [CrossRef]
  32. Pereira, G.V.M.; Vale, A.S.; Carvalho Neto, D.P.; Muynarsk, E.S.; Soccol, V.T.; Soccol, C.R. Lactic acid bacteria: What coffee industry should know? Curr. Opin. Food Sci. 2020, 31, 1–8. [Google Scholar] [CrossRef]
  33. Sun, S.Y.; Gong, H.S.; Zhao, K.; Wang, X.L.; Wang, X.; Zhao, X.H.; Yu, B.; Wang, H.X. Co-inoculation of yeast and lactic acid bacteria to improve cherry wines sensory quality. Int. J. Food Sci. Technol. 2013, 48, 1783–1790. [Google Scholar] [CrossRef]
  34. Bressani, A.P.P.; Martinez, S.J.; Batista, N.N.; Simão, J.B.P.; Dias, D.R.; Schwan, R.F. Co-inoculation of yeasts starters: A strategy to improve quality of low altitude Arabica coffee. Food Chem. 2021, 361, 130133. [Google Scholar] [CrossRef] [PubMed]
  35. Dicks, L.M.T.; Endo, A. Taxonomic status of lactic acid bacteria in wine and key characteristics to differentiate species. S. Afr. J. Enol. Vitic. 2009, 30, 72–90. [Google Scholar] [CrossRef] [Green Version]
  36. Silva, B.L.; Pereira, P.V.; Bertoli, L.D.; Silveira, D.L.; Batista, N.N.; Pinheiro, P.F.; de Souza Carneiro, J.; Schwan, R.F.; de Assis Silva, S.; Coelho, J.M.; et al. Fermentation of Coffea canephora inoculated with yeasts: Microbiological, chemical, and sensory characteristics. Food Microbiol. 2021, 98. [Google Scholar] [CrossRef] [PubMed]
  37. Gonzalez-Rios, O.; Suarez-Quiroz, M.L.; Boulanger, R.; Barel, M.; Guyot, B.; Guiraud, J.P.; Schorr-Galindo, S. Impact of “ecological” post-harvest processing on coffee aroma: II. Roasted coffee. J. Food Compos. Anal. 2007, 20, 297–307. [Google Scholar] [CrossRef]
Figure 1. Alpha rarefaction curves of observed OTUs (operational taxonomic units) from the environmental samples. (A) Bacterial analysis, (B) Fungal analysis. 1 = Soil; 2 = Leaves collected from the ground; 3 = Fruits collected from the ground; 4 = Leaves collected from the coffee tree; 5 = Cherries collected from the coffee tree; 6 = Cherries before de-pulping; 7 = Over-ripe fruits; 8 = Depulped beans; 9 = Water used for de-pulping beans.
Fermentation 07 00278 g001
Figure 2. Composition of bacteria (A) and fungi (B) from coffee farm samples. Only microorganisms with prevalence superior to 2% are showed. The complete list of minor microbial groups is reported in the Supporting Information (Table S1).
Fermentation 07 00278 g002
Figure 3. Principal component analysis, based on Weighted UniFrac Distances, according to microbial diversity and abundance. (A) Bacterial analysis, (B) Fungal analysis. 1 = Soil; 2 = Leaves collected from the ground; 3 = Fruits collected from the ground; 4 = Leaves collected from the coffee tree; 5 = Cherries collected from the coffee tree; 6 = Cherries before de-pulping; 7 = Over-ripe fruits; 8 = Depulped beans; 9 = Water used for de-pulping beans; F0 = Fermentation (0 h).
Fermentation 07 00278 g003
Figure 4. Prevalence and detection threshold of the highly persistent bacteria (A) and fungi (B) detected during coffee beans fermentation process conducted with selected starter cultures (Pichia fermentans YC5.2 and Pediococcus acidilactici LPBC161). The complete list of minor microbial groups is reported in the Supporting Information (Table S2).
Fermentation 07 00278 g004
Table 1. Proportion of volatile compounds (area * 105), organic acids, ethanol, and reducing sugars (g/L) during coffee beans fermentation process conducted with selected starter cultures (Pichia fermentans YC5.2 and Pediococcus acidilactici LPBC161). Different letters indicate significant differences over fermentation time.
Compound0 h8 h19 h24 h
GC-MS (area)
Higher alcohols (2)
1-Butanol, 3-methyl0.27 ± 0.02 a0.39 ± 0.02 b0.63 ± 0.00 c0.60 ± 0.00 c
2-Heptanol0.17 ± 0.01 a0.13 ± 0.00 aNDND
Ester (4)
Ethyl acetate4.10 ± 0.13 a2.24 ± 0.78 b3.05 ± 0.10 c4.80 ± 0.02 a
Methyl acetateNDND3.80 ± 0.41 a0.49 ± 0.04 b
Ethyl isobutyrateNDND0.63 ± 0.00ND
Isoamyl acetateND0.25 ± 0.00 a0.37 ± 0.08 a0.27 ± 0.00 a
Aldehyde (3)
Butanal, 3 methyl0.86 ± 0.06 a0.78 ± 0.05 ab0.21 ± 0.00 b0.74 ± 0.28 ab
Butanal, 2 methyl0.63 ± 0.26 a0.34 ± 0.00 a0.13 ± 0.01 a0.32 ± 0.00a
Benzeneacetaldehyde0.23 ± 0.02 a0.33 ± 0.10 aNDND
HPLC (g/L)
Glucose1.08 ± 0.11 a0.75 ± 0.09 ab0.52 ± 0.14 b0.62 ± 0.21 b
Fructose2.52 ± 0.22 a1.78 ± 0.49 b1.26 ± 0.13 b1.47 ± 0.06 b
Lactic acidND0.43 ± 0.04 a1.24 ± 0.21 b1.41 ± 0.12 b
EthanolND0.37 ± 0.12 a0.50 ± 0.09 a0.81 ± 0.08 b
pH5.164.504.174.13
Table 2. Concentration of volatile compounds (area * 105) inside coffee beans collected during coffee fermentation process conducted with selected starter cultures (Pichia fermentans YC5.2 and Pediococcus acidilactici LPBC161). Different letters indicate significant differences over fermentation time.
Compound (Area)0 h8 h19 h24 h
Organic acid (3)
Acetic acid5.35 ± 0.04 a6.03 ± 0.86 a9.99 ± 0.33 b9.73 ± 0.84 b
Butanoic acid, 3-methyl0.33 ± 0.03 a0.44 ± 0.24 ab0.58 ± 0.08 ab0.85 ± 0.18 b
Isovaleric acid0.36 ± 0.06 a1.39 ± 0.18 b0.54 ± 0.12 ac0.77 ± 0.04 c
Higher alcohols (7)
Propanol, 2-methyl0.16 ± 0.00 a0.13 ± 0.00 ab0.11 ± 0.00 b0.11 ± 0.02 b
1-Octen-3-ol0.41 ± 0.03 a0.29 ± 0.05 b0.22 ± 0.00 b0.20 ± 0.03 b
2-Hexanol, 5 methyl0.59 ± 0.10 a0.59 ± 0.06 a0.46 ± 0.05 ab0.33 ± 0.01 b
1-Butanol, 3-methyl-0.60 ± 0.24 a0.28 ± 0.00 a0.59 ± 0.12 a
2-Heptanol, 3-methyl---0.13 ± 0.03
1-Butanol, 2-methyl---0.28 ± 0.00
Phenylethyl Alcohol---0.26 ± 0.03
Aldehyde (8)
Butanal, 3 methyl3.33 ± 0.46 ab4.39 ± 0.33 b2.48 ± 0.18 c1.50 ± 0.79 c
Butanal, 2 methyl0.70 ± 0.07 ab0.76 ± 0.07 b0.26 ± 0.00 ac0.39 ± 0.00 c
Hexanal2.01 ± 0.32 a3.49 ± 0.56 bc3.97 ± 0.52 c2.44 ± 0.27 ab
Heptanal0.20 ± 0.02 a0.07 ± 0.01 b--
Benzeacetaldehyde1.06 ± 0.06 a1.07 ±0.03 a0.94 ± 0.05 ab0.81 ± 0.02 b
Benzaldehyde1.56 ± 0.06 a1.23 ± 0.12 b0.90 ± 0.03 c0.89 ± 0.06 c
Pentanal0.61 ± 0.06 a0.58 ± 0.21 a0.58 ± 0.04 a0.49 ± 0.04 a
Methional0.70 ± 0.00 a0.79 ± 0.22 a0.67 ± 0.12 a0.30 ± 0.04 b
Ester (1)
Ethyl acetate--0.13 ± 0.01 a0.25 ± 0.00 b
Terpenes (2)
Linalol0.65 ± 0.00 a0.71 ± 0.04 ab0.95 ± 0.00 b0.61 ± 0.16 a
Limonene--0.17 ± 0.01-
Pyrazine (1)
2-Isobuttyl-3-methoxypyrazine0.23 ± 0.11---
Ketones (1)
Acetoin0.47 ± 0.05 a3.49 ± 0.51 bc4.15 ± 0.08 c3.30 ± 0.09 b
Hydrocarbons (2)
Toluene0.23 ± 0.10 a0.22 ± 0.01 a--
Nonane, 3-methyl-5-propyl0.27 ± 0.00---
Furanone (1)
Furan, 2-pentyl-0.33 ± 0.07 a0.27 ± 0.06 a0.15 ± 0.03 a
Publisher’s Note: MDPI stays neutral with regard to jurisdictional claims in published maps and institutional affiliations.

