Article

Novel Propagation Strategy of Saccharomyces cerevisiae for Enhanced Xylose Metabolism during Fermentation on Softwood Hydrolysate

by
Andreea Cristina Dobrescu
1,2,
Henrique César Teixeira Veras
1,
Cristiano Varrone
2 and
Jan Dines Knudsen
1,*
1
Terranol A/S, A.C. Meyers Vænge 15, 2450 Copenhagen, Denmark
2
Section for Sustainable Biotechnology, Aalborg University Copenhagen, 2450 Copenhagen, Denmark
*
Author to whom correspondence should be addressed.
Submission received: 5 November 2021 / Revised: 26 November 2021 / Accepted: 28 November 2021 / Published: 29 November 2021
(This article belongs to the Section Industrial Fermentation)

Abstract

:
An economically viable production of second-generation bioethanol by recombinant xylose-fermenting Saccharomyces cerevisiae requires higher xylose fermentation rates and improved glucose–xylose co-consumption. Moreover, xylose-fermenting S. cerevisiae recognises xylose as a non-fermentable rather than a fermentable carbon source, which might partly explain why xylose is not fermented into ethanol as efficiently as glucose. This study proposes propagating S. cerevisiae on non-fermentable carbon sources to enhance xylose metabolism during fermentation. When compared to yeast grown on sucrose, cells propagated on a mix of ethanol and glycerol in shake flasks showed up to 50% higher xylose utilisation rate (in a defined xylose medium) and a double maximum fermentation rate, together with an improved C5/C6 co-consumption (on an industrial softwood hydrolysate). Based on these results, an automated propagation protocol was developed, using a fed-batch approach and the respiratory quotient to guide the ethanol and glycerol-containing feed. This successfully produced 71.29 ± 0.91 g/L yeast with an average productivity of 1.03 ± 0.05 g/L/h. These empirical findings provide the basis for the design of a simple, yet effective yeast production strategy to be used in the second-generation bioethanol industry for increased fermentation efficiency.

1. Introduction

The transportation sector accounts for 15% of the total greenhouse gas emissions [1] and it relies heavily on fossil fuels, with petroleum products providing 94% of total energy consumed in the sector in 2017 [2]. To address this issue, the Renewable Energy Directive Recast set a target of renewables in the transportation sector of minimum 14% by 2030 [3]. Two important mitigation options have been identified in this sector, namely blended biofuels and electricity from renewable sources [4]. However, even in the most optimistic scenario, electric vehicles are predicted to make up a maximum 60% of the market share in the next decade, leaving the transportation industry still heavily reliant on internal combustion engines fuelled by gasoline [5]. In light of this scenario, advances in biofuel production are of particular urgency, as they provide a smaller CO2 impact than petroleum products and are compatible with the already existing fuel distribution infrastructure and engines [6]. Bioethanol is the main biofuel used in current combustion engines worldwide [7]. Currently, it is mainly produced from agricultural crops, such as sugar cane, sugar beet, and corn [8]. These substrates are generally costly and compete with food supplies and arable land allocation, thus raising ethical and sustainable development concerns [9]. As a consequence, over the past few decades, dedicated energy crops and agricultural and forestry residues have gained interest as feedstock for bioethanol production, leading to the development of second-generation bioethanol [10]. However, the production of second-generation bioethanol is even more challenging than that of first-generation ethanol due to the complexity of the biomass sources used [11].
The production of second-generation bioethanol involves the fermentation of lignocellulose derived C6 sugars, e.g., glucose, mannose, and C5 sugars, e.g., xylose, arabinose, by specialised microorganisms [12]. The yeast Saccharomyces cerevisiae is often employed due to its robustness, fermentation capacity and resistance to stress factors found in industrial processes [13]. Wild-type S. cerevisiae strains are, however, not able to utilise xylose, which is the second most abundant sugar found in lignocellulosic biomass [14]; therefore, considerable efforts have been made to produce recombinant strains able to efficiently ferment this sugar [15]. Despite extensive research, xylose consumption rates in the recombinant strains are still lower than those of C6 sugars, and its metabolisation into ethanol is comparatively poor [16]. One important bottleneck in the development of efficient xylose-fermenting strains is the co-consumption of C5 and C6 sugars, which is necessary in order to reduce fermentation time and compete with existing industrial processes [17]. However, xylose is usually consumed only following significant glucose depletion, mainly due to the repressive effect of glucose on xylose uptake and metabolism [18,19]. It was observed that the response induced by xylose does not resemble the one caused by the presence of the fermentable carbon source glucose [20]. Rather, it induced several genes involved in the metabolism of non-fermentable carbon sources, such as ethanol or glycerol [21]. This may, in fact, provide part of the explanation to the poor metabolisation of xylose into ethanol [22].
In bioethanol production processes, a considerable amount of yeast, produced during the propagation step, is required to inoculate the fermentation medium. The preferred substrate for propagation is molasses, where the main sugar component is sucrose [23]. However, due to the Crabtree effect, which manifests in overflow metabolism and decreased biomass yields, efficient yeast propagation on molasses requires that the sucrose concentration is kept below 0.1% (w/v) and the aeration rates are maintained at more than 1 vvm (volume of air per volume of medium per minute) [24]. Such strict monitoring conditions become a challenge at industrial scale, where microorganisms are subjected to fluctuations of substrate and oxygen concentrations, due to imperfect mixing [25]. To avoid the Crabtree effect and obtain high biomass concentration and yield, aerobic fed-batch systems with a concentrated feed stream are generally employed [26,27]. Another strategy to avoid overflow metabolism is controlling the feed rate by the respiratory quotient (RQ), defined as the ratio between the CO2 evolution rate and the oxygen uptake rate of the culture. RQ values for the oxidation of any carbon source can be theoretically calculated based on the reaction stoichiometry [28]. Different RQ values are obtained depending on the utilised carbon source and the products formed [29]. When using molasses as substrate, keeping the RQ to a value of 1 during the cultivation aims to maintain metabolism in a state optimised for biomass formation [30]. During the propagation process, the RQ can be calculated and recorded online, based on oxygen and CO2 content in the outlet gas, measured by gas analysis [31].
Besides its role in the production of yeast biomass, the propagation process has also recently been used to adapt S. cerevisiae to the fermentation medium. Yeast exposed to lignocellulosic hydrolysates during propagation showed improved inhibitor tolerance, higher ethanol yield and productivity, and improved xylose-fermenting capacity during subsequent fermentation [32,33,34,35]. These traits were achieved by short-term adaptation, where exposure to lignocellulosic inhibitors results in the induction of genes that express a resistance phenotype [32,36]. However, the downside of this strategy is that the presence of inhibitors in the propagation medium results in decreased biomass yields [32,37].
An alternative use of short-term adaptation through propagation is the substitution of molasses with another carbon source. An interesting choice would be the use of a non-fermentable carbon source, due to the similar metabolic response to xylose imposed on xylose-fermenting S. cerevisiae [22]. Verstrepen and co-workers proposed combining sucrose with mannitol or sorbitol during propagation, in order to confer a better stress resistance and a faster fermentation rate [38]. However, these two non-fermentable carbon sources are unsuitable for industrial use due to their high costs [39]. A potential substrate could be ethanol, which holds the substantial advantage of higher biomass yields for S. cerevisiae (0.61 g/g) compared to sucrose (0.51 g/g) [40]. However, it is well-known that ethanol can inhibit cell division and specific growth rates even at relatively low concentrations [41]. To counteract the stress imposed by ethanol, a compatible solute, such as glycerol, could be added to the ethanol-containing medium [42].
Using ethanol and glycerol as substrates would offer some additional advantages over traditional, sucrose-based propagations. These non-fermentable carbon sources do not exert the Crabtree effect, which in turn avoids the need for strict substrate monitoring strategies, which are inevitable in carbohydrate-based cultures [43]. Moreover, growth on sucrose is known to decrease the stress resistance of yeast cells by triggering the activation of the Ras/cAMP/PKA pathway [38,44]. This is an undesirable trait, since industrial fermentations exert a wide range of stress factors on fermenting microorganisms [45], and it could be avoided by using a propagation medium containing ethanol and glycerol.
The first objective of this applied study was to exploit the fact that xylose-fermenting S. cerevisiae senses xylose as non-fermentable and aim to improve its xylose utilisation by propagating it on two alternative non-fermentable carbon sources, ethanol and glycerol. The commercial C5/C6-fermenting S. cerevisiae strain cV-110 was employed for this purpose, which is proprietary to Terranol A/S. Following propagation on either ethanol and glycerol or on sucrose, the yeast was subsequently used for fermentations in serum vials on glucose, xylose, or glucose/xylose defined media, as well as batch fermentations on softwood hydrolysate in controlled bioreactors. The sugar consumption rates, ethanol and by-product yields were calculated. Based on the results obtained, the second objective of this study was to develop a propagation protocol applying an automated feed control. This was designed in fed-batch mode, using the RQ to control the feed and ethanol and glycerol as substrate. To the authors’ knowledge, this is the first study addressing the automated propagation of S. cerevisiae on these two substrates.

2. Materials and Methods

2.1. Yeast Strain and Maintenance

The industrial S. cerevisiae strain used in this study, cV-110, was kindly provided by Terranol A/S, Copenhagen, Denmark. This strain is based on S. cerevisiae Meyen ex E.C. Hansen strain, which has been genetically modified by the insertion of a gene encoding a xylulokinase from Scheffersomyces stipitis (previously Pichia stipitis), Ps-Xks1, as well as the genes LIMR (xylose 1-epimerase) and LlXI (xylose isomerase) from Lactococcus lactis, all under the control of native S. cerevisiae promoters and terminators. Furthermore, three S. cerevisiae genes were overexpressed in the genome of this strain: Rki1 (ribose-5-phosphate isomerase), Tkl1 (transketolase), and Tal1 (transaldolase). The strain has also undergone extensive evolutionary adaptation to optimise its C5/C6 co-fermentation capacity, the tolerance towards inhibitors, and eliminate unwanted by-products [46,47]. The yeast was stored at 4 °C on agar plates (20 g/L agar, 20 g/L peptone, 10 g/L yeast extract, 20 g/L ethanol, 20 g/L glycerol) and replated at least once a month from a 15% glycerol stock stored at −80 °C.

2.2. Yeast Pre-Culture

cV-110 was propagated in baffled shake flasks on YP medium (10 g/L yeast extract, 20 g/L peptone, 1 g/L MgSO4·7 H2O, pH 5.5) containing either 50 g/L sucrose or 40 g/L ethanol and 10 g/L glycerol. The flasks were inoculated with yeast collected from agar plates and incubated in an orbital shaker at 30 °C and 120 rpm. The cultivation time varied between 18 and 48 h to ensure that cells were collected during the exponential growth phase. Yeast propagated on sucrose is hereafter referred to as YPS cells, and yeast propagated on ethanol and glycerol as YPEG cells.

2.3. Fermentation on Defined Media

YPS or YPEG cells were inoculated into defined media, containing 3.08 g/L urea, 0.80 g/L KCl, 1.79 g/L diammonium phosphate, 0.60 g/L MgSO4·7 H2O, 50 mg/L ampicillin, citrate buffer at pH 5.5 and either ~110 g/L glucose, 110 g/L xylose, or a combination of 66 g/L glucose and 44 g/L xylose. Vitamins and trace elements were added according to Verduyn et al. [48]: 15.00 mg/L EDTA, 4.50 mg/L ZnSO4·7 H2O, 1.00 mg/L MnSO4·H2O, 0.70 mg/L CoSO4·7 H2O, 0.30 mg/L CuSO4·5 H2O, 0.40 mg/L Na2MoO4·H2O, 4.50 mg/L CaCl2·2 H2O, 3.00 mg/L FeSO4·7 H2O, 1.00 mg/L H3BO3, 0.10 mg/L KI. 4 g/L cell dry weight (gDW/L) was used, and the cells were washed twice with sterile Milli-Q water before inoculation. The experiments were carried out in triplicates in 60 mL serum vials containing 10 mL medium, sealed with rubber stoppers, pierced with a needle to allow CO2 escape, and incubated at 30 °C and 150 rpm. Weight loss was monitored at discrete timepoints throughout the entire length of each experiment.

2.4. Fermentation on Hydrolysate

Batch cultivations were performed in 2 L Biostat B plus laboratory fermentors (Sartorius Stedim Biotech, Goettingen, Germany), using a working volume of 0.67 L. The softwood hydrolysate used as substrate was kindly provided by SEKAB E-technology (Örnsköldsvik, Sweden). This was produced from spruce sawdust using an SO2 pretreatment and contained approximately 52 g/L glucose, 15 g/L xylose, 38 g/L mannose, and 6 g/L acetic acid. The hydrolysate was inoculated with 4 gDW/L YPS or YPEG cells, which were washed twice with sterile Milli-Q water before inoculation.
The hydrolysate was supplemented with nutrients, vitamins, and trace elements in concentrations that can support maximum cell growth considering the concentration of carbon provided. In order to calculate the growth requirements, the average nutrient content of yeast (w/w) was considered as 9.08% nitrogen, 2.10% potassium, 2.00% phosphorus, 0.39% sulphur, and 0.23% magnesium [24]. The concentration of each compound was calculated as described in Equation (1). Due to the Crabtree effect, the biomass yield on sugars was considered 0.1 g/g [49].
Compound   ( g / L ) = Nutrient   content   of   yeast   ( % ) · Carbon   source   ( g / L )   ·   Biomass   yield   ( g / L ) Nutrient   content   of   compound   ( % )  
Accordingly, 3.08 g/L urea, 0.80 g/L KCl, 1.79 g/L diammonium phosphate, 0.60 g/L MgSO4·7 H2O, and 50 mg/L ampicillin were added. The vitamins and trace elements were based on Verduyn et al. [48]: 15.00 mg/L EDTA, 4.50 mg/L ZnSO4·7 H2O, 1.00 mg/L MnSO4·H2O, 0.70 mg/L CoSO4·7 H2O, 0.30 mg/L CuSO4·5 H2O, 0.40 mg/L Na2MoO4·H2O, 4.50 mg/L CaCl2·2 H2O, 3.00 mg/L FeSO4·7 H2O, 1.00 mg/L H3BO3, 0.10 mg/L KI.
The reactor was continuously sparged with 0.05 L/min nitrogen gas (Air Liquide, Taastrup, Denmark). The exhaust gas was diluted with 0.45 L/min compressed atmospheric air and transported to an Innova 1316A-3 multi-gas monitor (LumaSense Technologies A/S, Ballerup, Denmark) where the concentrations of CO2, ethanol, and oxygen were quantified. The output data of the fermentation was monitored using the supervisory control and data acquisition system Sartorius Multi Fermentor Control System MFCS/Win 3.0 (Sartorius Stedim Biotech, Goettingen, Germany). The culture temperature was maintained at 30 °C, the stirring at 250 rpm, and the pH at 5.5 using 6 M NaOH and 2 M H2SO4. For the fermentations using YPEG and YPS cells, off-line samples were taken at different timepoints in order to cover the entire fermentation course. The reproducibility of the process was ensured by following the CO2 off-gas pattern. All fermentations were performed in duplicates.

2.5. Cell Propagation on Ethanol and Glycerol
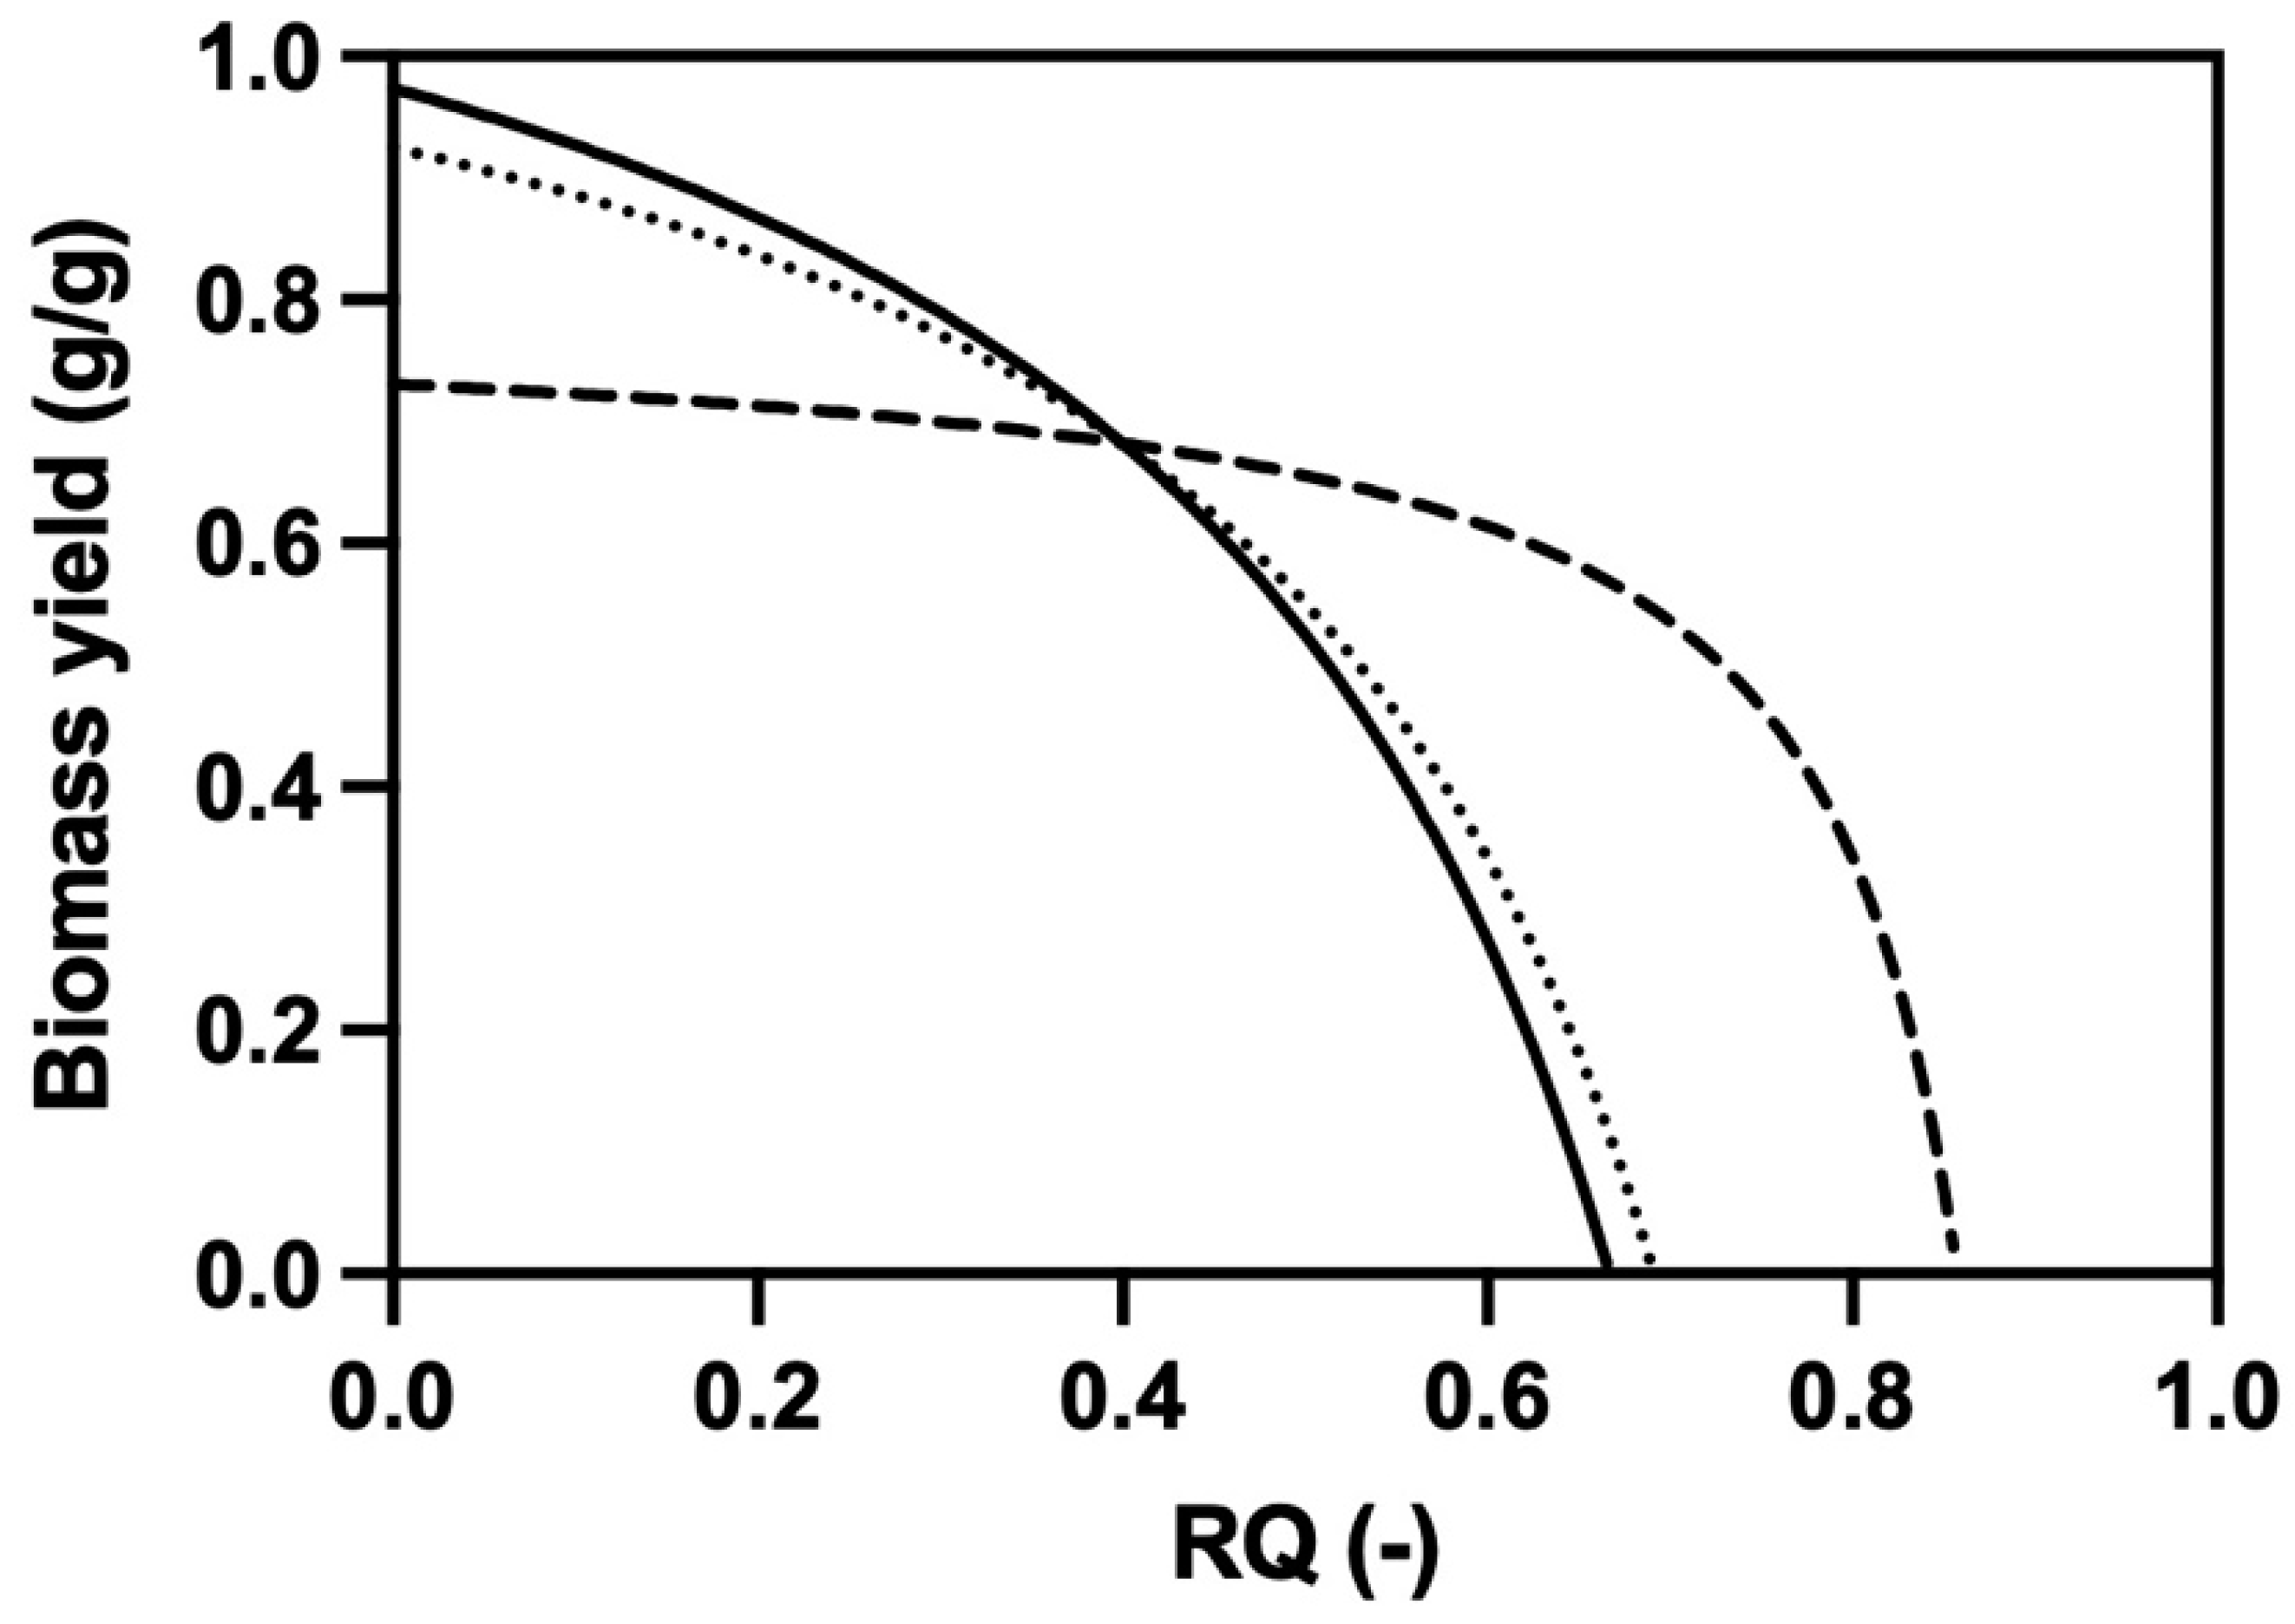
The propagation was performed in fed-batch mode in a 2 L Biostat B plus laboratory fermentor (Sartorius Stedim Biotech, Goettingen, Germany) and controlled by MFCS/Win. The propagation was initiated by the inoculation of 8 gDW/L YPS cells into 360 mL batch medium, containing 8 g/L sucrose, 23.49 g/L urea, 6.12 g/L KCl, 13.64 g/L diammonium phosphate, 4.58 g/L MgSO4·7 H2O, and 50 mg/L ampicillin. The vitamins and trace elements were based on Verduyn et al. (1992): 75.00 mg/L EDTA, 22.50 mg/L ZnSO4·7H2O, 5.00 mg/L MnSO4·H2O, 3.50 mg/L CoSO4·7 H2O, 1.50 mg/L CuSO4·5 H2O, 2.00 mg/L Na2MoO4·H2O, 22.50 mg/L CaCl2·2 H2O, 15.00 mg/L FeSO4·7 H2O, 5.00 mg/L H3BO3, 0.50 mg/L KI. The concentration of each compound was calculated as described by Equation (1), where the biomass yield on ethanol was considered 0.61 [49] and it was assumed that no growth on glycerol would occur [25].
The reactor was sparged with sterile air at 1 vvm, and the exhaust gas was transported to an Innova 1316A-3 multi-gas monitor. The feed was controlled by the RQ value, which was calculated using measured output data from the gas analyser according to Equations (2)–(4).
OUR = F in V · ( C O 2 , in C O 2 , out · C I , in C I , out )
CER = F in V · ( C CO 2 , out · C I , in C I , out )  
RQ = CER OUR
where Fin represents the inlet gas flow (L/min); V volume of the fermentation broth (L); CO2,in and CI,in concentrations of oxygen and inert gas in the inlet gas (mmol/L), respectively; CO2,out, CCO2,out and CI,out concentrations of oxygen, CO2 and inert gas in the outlet gas (mmol/L), respectively.
The RQ was maintained in the range of 0.22–0.69, and feed was pumped into the reactor for 105 s when an RQ value outside of this range was registered, corresponding to a total of 1.93 g ethanol and 0.48 g glycerol. The composition of the feed was similar to the batch feed, except that 200 g/L ethanol and 50 g/L glycerol were used as carbon source instead of sucrose. The oxygen partial pressure of the culture was continuously monitored using a pO2 sensor (Hamilton VisiFerm DO ECS, Gräfelfing, Germany). The stirring in the reactor was constant at 1600 rpm, the pH was adjusted to 5.5 using 6 M NaOH and 2 M H2SO4, and the temperature was maintained at 30 °C. The propagations were performed in duplicates.

2.6. Stoichiometry

The stoichiometric reactions of biomass production from ethanol, glycerol, or both ethanol and glycerol were considered (Equations (5)–(7)) to derive the theoretical correlation between biomass yield and RQ (Equations (8)–(10)). The molar fraction of ethanol and glycerol in the feed was considered when both substrates were provided. The atomic composition of biomass was set as C7H11NO3, with a molar weight of 157 g/mol, according to Watteeuw et al. [50].
C 2 H 6 O + a   O 2 + b   NH 3   c   C 7 H 11 NO 3 + d   CO 2 + e   H 2 O
C 3 H 8 O 3 + a   O 2 + b   NH 3   c   C 7 H 11 NO 3 + d   CO 2 + e   H 2 O
C 2 H 6 O + 0.125   C 3 H 8 O 3 + a   O 2 + b   NH 3   c   C 7 H 11 NO 3 + d   CO 2 + e   H 2 O
Y biomass / ethanol   ( g / g ) = 6   RQ 4 15   RQ 14   ·   M biomass M ethanol  
Y biomass / glycerol   ( g / g ) = 7   RQ 6 15   RQ 14   ·   M biomass M glycerol
Y biomass ethanol + glycerol   ( g g ) = 6.875   RQ 4.750 15   RQ 14   ·   M biomass M ethanol + 0.125   M glycerol
where Mbiomass, Mglycerol, and Methanol represent the molar mass of biomass, glycerol, and ethanol, respectively.

2.7. Analytical Methods

Samples for optical density and dry weight were analysed directly, while samples for HPLC were kept at −20 °C before analysis. Cell growth was monitored by measuring optical density at 600 nm using a spectrophotometer (Shimadzu UV-1800, Kyoto, Japan). Dry weight was determined by washing the cells twice with distilled water and subsequently drying them in a HE73 moisture analyser (Mettler Toledo, Columbus, OH, USA) at a temperature of 105 °C. During HPLC analysis, ethanol and glycerol were separated with an HPX-87H ion-exchange column (Bio-Rad, Hercules, CA, USA) at a temperature of 60 °C, using a 4 mM H2SO4 mobile phase at a flow rate of 0.6 mL/min. Glucose, xylose, and mannose were separated with an HPX-87P column (Bio-Rad, Hercules, CA, USA) at a temperature of 70 °C, using Milli-Q water as mobile phase at a flow rate of 0.5 mL/min. All compounds were quantified using a refractive index detector (RID-6A; Shimadzu, Kyoto, Japan).

3. Results and Discussion

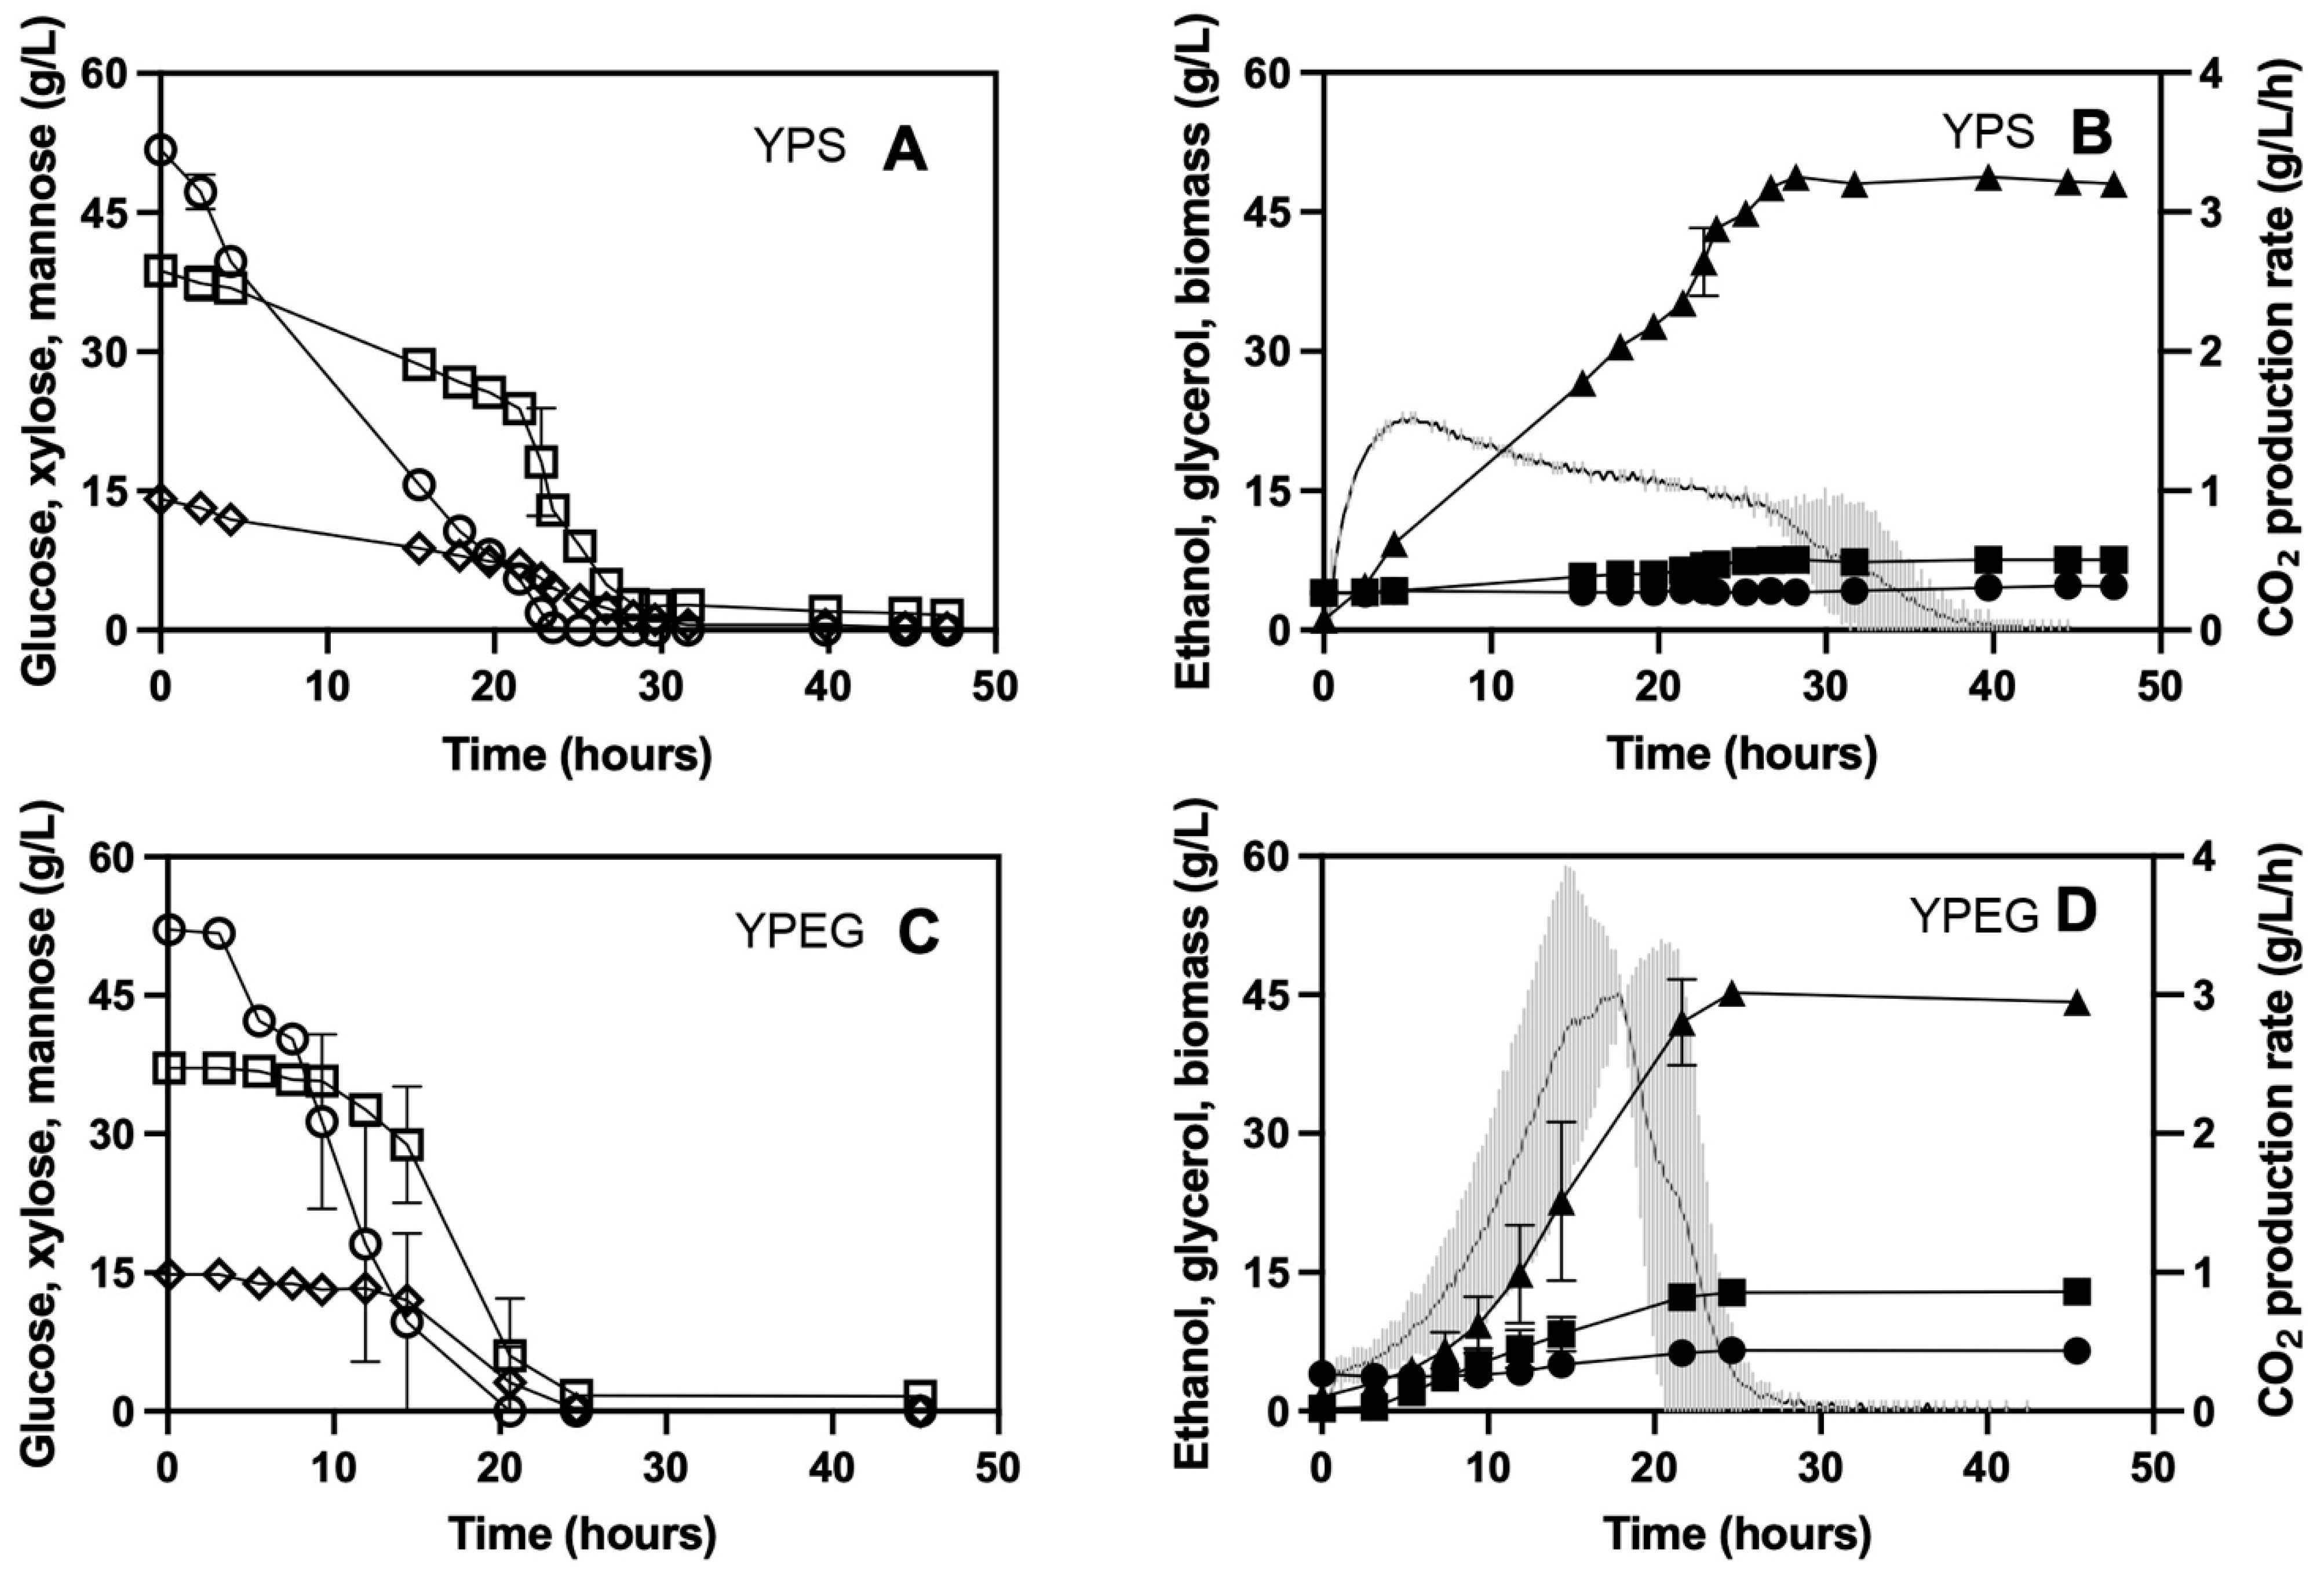
3.1. Fermentation on Defined Glucose/Xylose Media

The first objective of this study was to determine if propagating the S. cerevisiae yeast strain cV-110 on non-fermentable carbon sources would improve subsequent xylose fermentation. To achieve this, the yeast was propagated in shake-flasks in complex media containing either sucrose or ethanol and glycerol as carbon source. Yeast propagated on sucrose will be referred to as YPS cells, and yeast propagated on ethanol and glycerol as YPEG cells.
The fermentation performance of YPS and YPEG cells was initially investigated on defined media containing glucose, xylose, or a mixture of glucose and xylose. The vial weight loss was monitored during the process. As such, the weight loss rate could be calculated, which is indicative of the CO2 production rate and equivalent to the fermentation rate [51]. YPEG cells showed a 30% faster CO2 production rate in the glucose–xylose medium compared to YPS cells, and a 50% faster rate in the xylose medium (Table 1). No significant difference was observed between the two types of cells in the glucose medium. The improved fermentation rates of YPEG cells in media containing xylose might be explained by the yeast metabolic state upon inoculation. It has previously been described how several genes, mostly involved in (i) glucose transport and phosphorylation, e.g., HXK1 [20,22,52,53], HXK2 [20,54,55,56], HXT5 and HXT13 [21,22,52,54,56], (ii) gluconeogenesis, e.g., FBP1 [20,21,22,52,53,55,56,57], PCK1 [20,21,22,54,56], (iii) TCA and glyoxylate cycles, e.g., CIT2 [52,55,56], ICL1 [20,22,52,56], and (iv) electron transport chain, e.g., CYC3 and CYC7 [52,56], are regulated in the same direction, i.e., up- or downregulated, by xylose and non-fermentable carbon sources. Since the metabolic machinery necessary for efficient xylose utilisation is also induced by ethanol and glycerol, the resulting phenotype is expected to readily ferment xylose upon transition from an ethanol/glycerol culture. In contrast, cells collected from a sugar-based culture must undergo significant metabolic changes in order to ferment xylose [52]. Thus, it is believed that the higher xylose consumption rate displayed by YPEG cells can be attributed to a better prepared phenotype for xylose fermentation.
Similar ethanol titres, ranging from 44.57 to 46.74 g/L, were produced by both types of cells in the three media, corresponding to ethanol yields between 0.38 and 0.40 g/g. However, YPEG cells produced significantly more glycerol in all three cases, with yields between 0.10 and 0.12 g/g, compared to yields between 0.07 and 0.11 g/g obtained by YPS cells. This difference was most prominent in the xylose medium, where YPEG cells produced 45% more glycerol than YPS cells (Table 1). The observed excess of glycerol is an indication of surplus NADH. Biomass production generates excess NADH during the biosynthesis of amino acids and organic acids. Under anaerobic conditions, and without the addition of an alternative redox sink, NADH can only be re-oxidised by the formation of glycerol [58]. The higher glycerol yields displayed by YPEG cells could be correlated to a higher TCA activity. Cell growth on non-fermentable carbon upregulates genes involved in the TCA cycle and electron transport chain [59]. These pathways are expressed even under anaerobic conditions in the presence of xylose [52,56], presumably to allow fast utilisation of oxygen when it becomes available [21]. Thus, growth on ethanol and glycerol could have upregulated the TCA cycle, which in turn was the cause of the excess glycerol observed during xylose fermentation. Thus, the novel propagation strategy provides a faster fermentation process in a xylose-containing medium at the expense of increased glycerol production.

3.2. Fermentation on Softwood Hydrolysate

The performance of YPS and YPEG cells was further examined on an industrial feedstock of SO2-pretreated softwood hydrolysate. The fermentations were carried out in batch mode at a working volume of 0.67 L in controlled bioreactor, using the softwood hydrolysate as substrate at an initial sugar concentration of 105 g/L. Sugar consumption and product formation were monitored throughout the course of the fermentation.
As seen during fermentations on defined media, the overall glycerol yield for YPEG cells (0.13 ± 0.00 g/g) was higher than that of YPS cells (0.03 ± 0.00 g/g) (Table 2). This was accompanied by higher biomass yields for YPEG cells (0.03 ± 0.00 g/g). On the other hand, no biomass growth was detected when YPS cells were used. The increased biomass and glycerol yields were thought to occur at the expense of ethanol production. However, it was surprising to notice that there was no significant difference between the ethanol yields produced by the two types of cells (Table 2). This is explained by the slightly different carbon recoveries calculated, i.e., 97.4 ± 0.1% for YPS cells and 102.6 ± 2.5 for YPEG cells (Table S1). Overall, the ethanol productivity of YPEG cells was 25% higher than that of YPS cells. As observed during the fermentations on defined media in Section 3.1, YPEG cells improved the productivity of the process at the expense of higher by-product yields, i.e., glycerol and biomass.
The CO2 production rate is proportional to the overall sugar consumption rate, where the peak of the CO2 production rate pinpoints the time of the highest overall sugar conversion [60]. The maximum CO2 production rate of YPEG cells (3.28 ± 0.42 g/L/h) was detected after 18 h (Figure 1), and the rate was roughly double compared to that of YPS cells (1.55 ± 0.00 g/L/h). The higher sugar consumption rate achieved by YPEG cells can be partly attributed to the higher biomass yield (Table 2). However, even when the substrate consumption rate is normalised to the cell concentration present in the reactor throughout the course of the fermentations, it still remains higher for YPEG cells (Figure S1). The faster fermentation rate displayed by YPEG cells allowed the process to terminate after 30 h, which is 25% earlier than the fermentation using YPS cells. After 21 h of fermentation, three hours after the CO2 peak was detected for the YPEG cells, glucose was completely depleted and residual xylose and mannose concentrations were 3.1 and 6.0 g/L, respectively. In comparison, at the same timepoint, the concentrations of residual glucose, xylose, and mannose for YPS cells were 5.5, 7.1, and 23.9 g/L, respectively.
As explained in Section 3.1, the main reason for the different sugar consumption patterns displayed YPS and YPEG cells is thought to be the different metabolic states upon inoculation. Since propagation can be considered a form of short-term adaptation (Nielsen et al., 2015), it is expected that YPEG cells would further adapt to the substrate provided over the course of a long fermentation, e.g., in continuous mode, and lose the advantage they had over YPS cells. For this reason, the faster fermentation rate observed in this study can mainly be of importance when fermentations are performed in batch mode. The batch mode displays the lowest ethanol productivity compared to continuous and fed-batch approaches [60,61]. By extension, the batch phase of a continuous or fed-batch fermentation is bound to be the least productive step. Thus, a practical application of using YPEG cells is decreasing the process time of a batch fermentation or, even more relevant, shortening the batch phase of a continuous or fed-batch fermentation, by up to 25%. Additionally, the fermentation can be initiated with a small batch volume, thus decreasing the amount of yeast required and reducing the costs associated with yeast production. Once the sugars are consumed, the more productive fed-batch or continuous mode can commence. Not only would such an improvement lead to a faster process, but also serve as a safeguard against contamination. The faster sugar consumption would decrease the risk of contamination, for example by lactic acid bacteria, an often-encountered contaminant in ethanol fermentations [62].
Another interesting feature of YPEG cells is the improved co-consumption of C6 and C5 sugars. The presence of glucose in the fermentation medium represses the utilisation of other less preferred carbon sources, whose consumption generally begins only following substantial glucose depletion [18,19]. During fermentation using YPEG cells, the consumption of mannose and xylose started at higher glucose concentration compared to the fermentation using YPS cells. Specifically, increased mannose and xylose utilisation was initiated at glucose concentrations of approximately 18 and 6 g/L for YPEG and YPS cells, respectively. The enhanced co-consumption can also be attributed to the growth on non-fermentable carbon sources of YPEG cells, which leads to the downregulation of HXK2 and upregulation of HXK1 [20], as well as the upregulation of HXT5 and HXT13 transporter genes [21,56]. These characteristics have been previously linked to improved glucose-xylose co-consumption [63], which in turn increased the productivity of the process by decreasing the fermentation time [54].

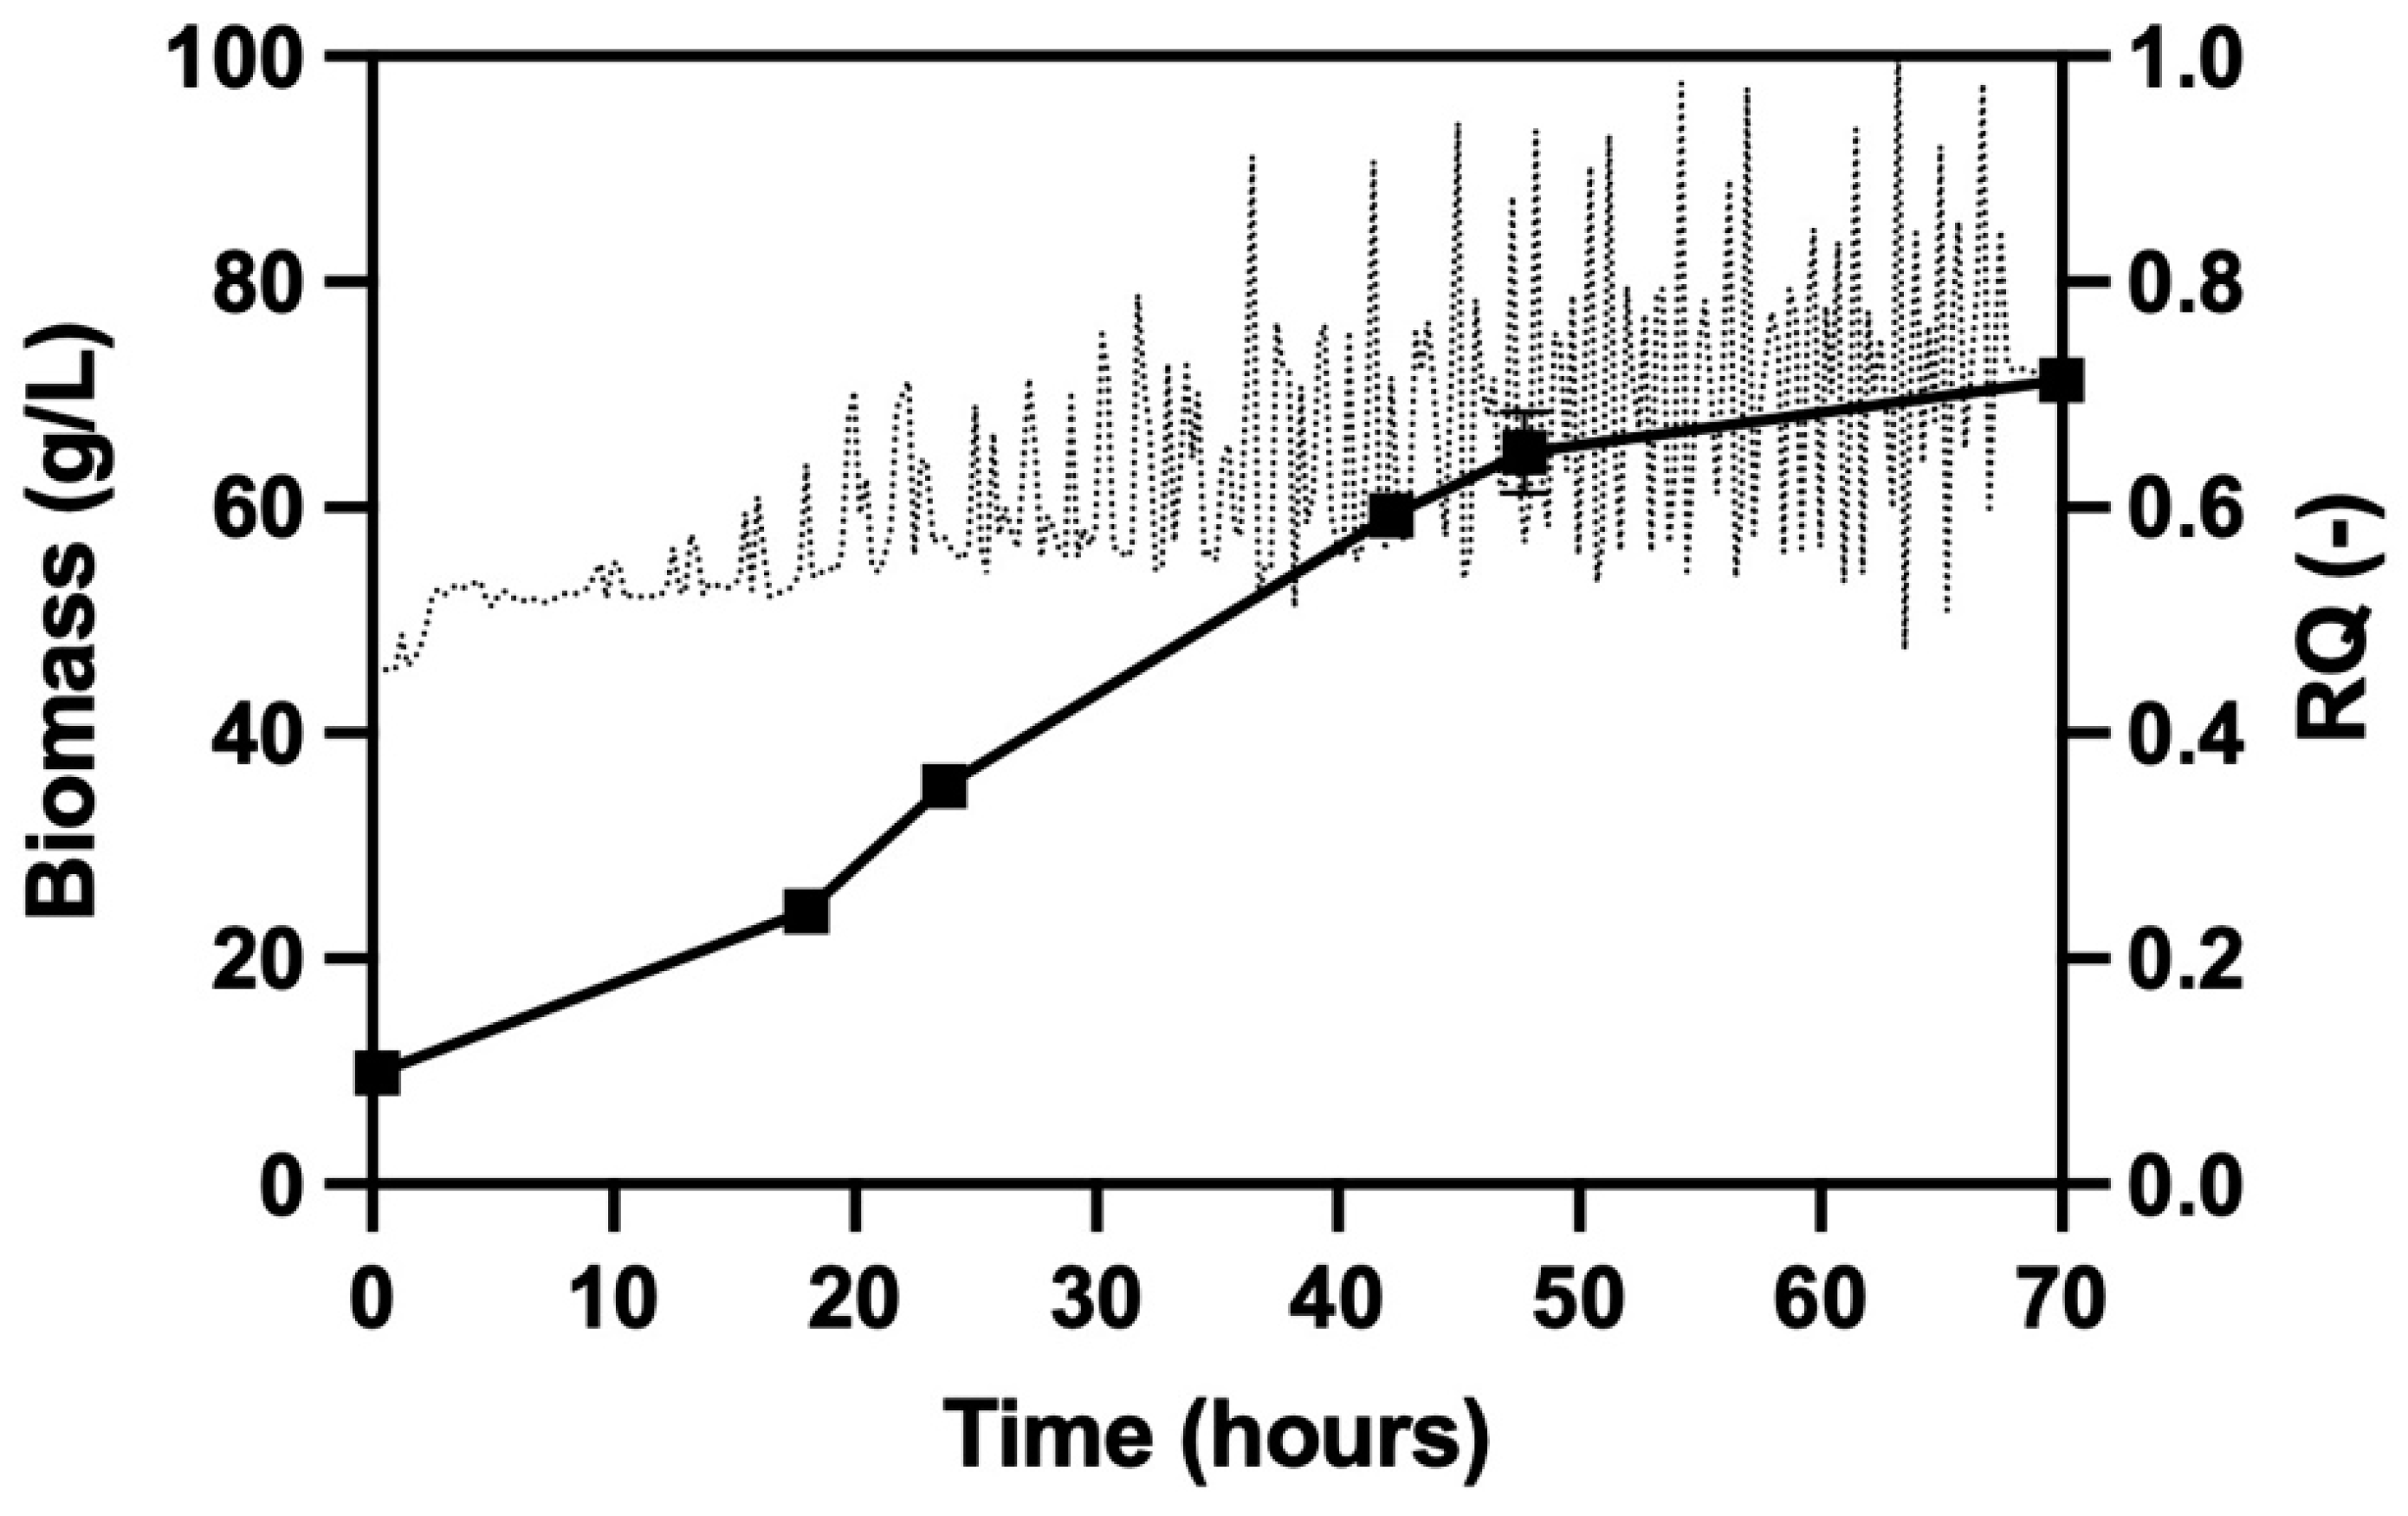
3.3. Development of a Novel Propagation Protocol on Ethanol and Glycerol

Based on the improved fermentation characteristics of YPEG cells, the second objective of this study was to address the upscaling potential of the novel propagation strategy. Thus, an automated propagation protocol, using ethanol and glycerol as carbon sources, was developed. To the authors’ knowledge, this is the first study addressing the automated propagation of S. cerevisiae on these two substrates.
The propagation was performed in fed-batch mode under aerobic conditions, which is the most common strategy for the propagation of S. cerevisiae [27]. The feed was controlled using the respiratory quotient (RQ), which was calculated online using the output data provided by a gas analyser (Equations (2)–(4)). It is known that different RQs are observed depending on the substrate used, as well as the products formed [29]. When using molasses-based media, the RQ is ideally maintained between 1.00 and 1.09, to avoid the Crabtree effect and overflow metabolism [24]. In order to select the most appropriate RQ boundaries for an ethanol and glycerol-containing feed, the stoichiometric relation between RQ and theoretical biomass yield was examined (Figure 2). According to these calculations, the RQ can vary between 0.00 and 0.69, where an RQ of 0 corresponds to the maximum biomass yield of 0.93 g/g, and an RQ of 0.69 indicates no biomass formation. Hence, the upper RQ boundary was taken as 0.69. However, it is physiologically impossible to obtain an RQ of 0, as this would imply that biomass production occurred independent of CO2 production (according to Equation (7)), whereas biomass formation is always coupled to the production of CO2 [64]. In order to define a lower boundary, the experimental study of Watteeuw and co-workers [50], which investigated the production of Candida utilis from ethanol in a fed-batch process, was considered. The authors described that maximum growth on ethanol and cell maintenance on ethanol correspond to RQ values of 0.22 and 0.67, respectively. A similar relation between RQ and cell yield of yeast propagated on glycerol was not found in literature. Thus, the lower RQ boundary was taken as 0.22. The final boundaries were defined as 0.22 and 0.69. The boundaries were not narrowed further, since the purpose of the experiment was to empirically assess if propagation on these two substrates controlled by the RQ is possible, and further narrowing the boundaries could complicate this assessment. Adjusting the boundaries would thus be a later potential optimisation question.
The feeding was initiated when the measured RQ was outside of the two boundaries, i.e., 0.22 and 0.69, after which the feed-pump was turned off and remained turned off while the RQ stayed within the previously defined range. This on/off switch resulted in more frequent fluctuations as the propagation proceeded (Figure 3), which translated into more frequent feeding. Moreover, the RQ progressively increased as more biomass was formed. This can be explained by the fact that the growth rate of the cells decreases (Figure S2), which is known to correlate to increasing maintenance energy [65,66], and according to Watteeuw and colleagues [50], an increasing maintenance energy corresponds to an increasing RQ value. The reason for the decreasing growth rate is oxygen limitation as observed by the gradually decreasing oxygen partial pressure (Figure S3) [29].
The strategy successfully produced 71.3 ± 0.9 gDW/L biomass, with a productivity of 1.03 ± 0.05 gDW/L/h (Table 3). Two other studies were found that studied the propagation of S. cerevisiae on one of these substrates. The only other known propagation protocol on ethanol produced 18 g/L biomass, with a productivity of 0.38 gDW/L/h [50]. More promising results were achieved by Raj and colleagues [67], who developed a propagation protocol for S. cerevisiae using glycerol supplemented with yeast extract, and obtained a maximum cell density of 132 g/L with a productivity of 5.5 g/L/h. However, the use of yeast extract renders the process uneconomical at industrial scale [68]. In comparison, the feed used in this study provided nutrients in the form of a minimal medium, which significantly decreases the cost [69]. Another study using the RQ to guide the feed of a fed-batch propagation process, but with glucose as substrate, produced a slightly higher biomass yield of 86.7 g/L with a productivity of 2.7 g/L/h, which was more than double compared to the productivity observed in the current study [70]. At the same time, the biomass yield obtained in this study is 47.75 ± 0.64% of the maximum theoretical yield, leaving potential for improvement (Table 3). All this suggests that the developed set-up could be further optimised to produce higher cell concentrations with higher productivities. Still, the current protocol provides a simple and automated basis for yeast propagation on ethanol and glycerol.
A potential optimisation strategy could be restricting the RQ boundaries in a way to keep RQ as low as possible, since this would maximise biomass yields according to their stoichiometric relation (Figure 2). It is unclear, however, how this would affect the productivity of the process. Nonetheless, it is important to acknowledge that demand for oxygen will unavoidably exceed the supply capacity when sparging with atmospheric air, and thus the biomass productivity is inevitably limited by oxygen transfer between gas and liquid [71]. This effect could be counteracted by supplementing or substituting the air supply with pure oxygen [72], or by aerating the culture using microbubbles [71,73]. Similarly, altering the type and configuration of the impellers used could further increase oxygen transfer [74,75]. Once the protocol is optimised, a detailed economic analysis should be performed in a future study to assess the feasibility of the process at industrial scale.
It was unclear what proportion of the glycerol provided would be consumed during the process, since most S. cerevisiae strains have been described as poor glycerol-growers, especially in synthetic media [25,76]. However, all carbon provided was consumed by the end of the propagation, which included 43.2 ± 7.1 g/L glycerol (Table 3). In other studies, glycerol uptake was improved when glucose was present in the culture medium [77,78]. This implies that the presence of ethanol in the feed most probably improved the glycerol uptake. A further analysis could be pursued in a future study, but assessing glycerol uptake during the propagation was beyond the scope of this paper.
Overall, the current study developed the first propagation protocol on two non-conventional carbon sources, ethanol and glycerol. Its automatic feed feature required minimal user supervision on a feed containing inexpensive nutrients, thus showing potential for large-scale applications.

4. Conclusions

The fermentation performance of an industrial xylose-fermenting strain of Saccharomyces cerevisiae, cV-110, was evaluated following propagation on sucrose (YPS cells) or ethanol and glycerol (YPEG cells). YPEG cells showed a 50% higher fermentation rate in a defined xylose medium in serum vials, compared to YPS cells. Moreover, YPEG cells displayed a double maximum sugar utilisation rate and superior co-consumption of C5 and C6 sugars, during fermentations on an industrial softwood hydrolysate in batch mode, in a 0.67 L. bioreactor. This ensured a 25% shorter fermentation time compared to YPS cells. Based on these promising results, this study also addressed the development of the first automated fed-batch propagation protocol using ethanol and glycerol as substrates. The respiratory quotient was successfully applied to guide the feed rate, and 71.29 ± 0.91 g/L yeast was produced on a minimal medium, with an average productivity of 1.03 ± 0.05 g/L/h.

Supplementary Materials

The following are available online at https://0-www-mdpi-com.brum.beds.ac.uk/article/10.3390/fermentation7040288/s1, Figure S1, Figure S2 and Figure S3. Figure S1: Specific sugar consumption rates normalised to the biomass concentration observed during bioreactor fermentations on softwood hydrolysate using YPS cells (●) and YPEG cells (■). Figure S2: Cell growth rate during propagation on ethanol and glycerol using the novel propagation strategy. Figrue S3: Oxygen tension (pO2) registered during propagation.

Author Contributions

Conceptualisation, J.D.K.; methodology, A.C.D., J.D.K.; software, J.D.K.; formal Analysis, A.C.D.; investigation, A.C.D., H.C.T.V.; writing—original draft preparation, A.C.D.; writing—review and editing, A.C.D., J.D.K., H.C.T.V., C.V.; visualisation, A.C.D.; supervision, J.D.K. All authors have read and agreed to the published version of the manuscript.

Funding

This research was funded by the European Union’s Horizon 2020 research and innovation programme under grant agreement No 869879.

Institutional Review Board Statement

Not applicable.

Informed Consent Statement

Not applicable.

Data Availability Statement

Not applicable.

Acknowledgments

The authors are thankful to Birgitte Rønnow and Thomas Hvid Andersen for their constructive input and support during the project. SEKAB E-technology (Örnsköldsvik, Sweden) is gratefully acknowledged for providing the applied hydrolysate.

Conflicts of Interest

The authors declare no conflict of interest.

References

  1. Sharma, B.; Larroche, C.; Dussap, C. Comprehensive assessment of 2G bioethanol production. Bioresour. Technol. 2020, 313, 123630. [Google Scholar] [CrossRef] [PubMed]
  2. European Union 2020. Energy Policy Review; International Energy Agency: France, Paris, 2020. [Google Scholar]
  3. Directive (EU). 2018/2001 of the European Parliament and of the Council on the promotion of the use of energy from renewable resources (recast). Off. J. Eur. Union 2018, L 328/82, 125–127. [Google Scholar]
  4. European Union 2020. Trends and projections in Europe 2020. In Tracking Progress Towards Europe’s Climate and Energy Targets; No 13/2020; European Environment Agency: Luxemburg, 2020. [Google Scholar]
  5. Biofuels Digest. Available online: https://www.biofuelsdigest.com/bdigest/2021/08/25/the-fuel-economy-rule-an-epa-that-wont-see-hear-or-speak-to-the-facts/ (accessed on 29 September 2021).
  6. Agarwal, A.K. Biofuels (alcohols and biodiesel) applications as fuels for internal combustion engines. Prog. Energy Combust. Sci. 2007, 33, 233–271. [Google Scholar] [CrossRef]
  7. Del Pecchia, M.; Pessina, V.; Berni, F.; D’Adamo, A.; Fontanesi, S. Gasoline-Ethanol blend formulation to mimic laminar flame speed and auto-ignition quality in automotive engines. Fuel 2020, 264, 116741. [Google Scholar] [CrossRef]
  8. Ayodele, B.V.; Alsaffar, M.A.; Mustapa, S.I. An overview of integration opportunities for sustainable bioethanol production from first-And second-Generation sugar-Based feedstocks. J. Clean. Prod. 2020, 245, 118857. [Google Scholar] [CrossRef]
  9. Callegari, A.; Bolognesi, S.; Cecconet, D.; Capodaglio, A.G. Production technologies, current role, and future prospects of biofuels feedstocks: A state-Of-The-Art review. Crit. Rev. Environ. Sci. Technol. 2020, 50, 384–436. [Google Scholar] [CrossRef]
  10. Saini, J.K.; Saini, R.; Tewari, L. Lignocellulosic agriculture wastes as biomass feedstocks for second-generation bioethanol production: Concepts and recent developments. 3 Biotech 2015, 5, 337–353. [Google Scholar] [CrossRef] [PubMed] [Green Version]
  11. Balan, V. Current Challenges in Commercially Producing Biofuels from Lignocellulosic Biomass. ISRN Biotechnol. 2014, 2014, 463074. [Google Scholar] [CrossRef]
  12. Pasin, T.M.; de Almeida, P.Z.; de Almeida Scarcella, A.S.; da Conceição Infante, J.; de Teixeira de Moraes Polizeli de Lourdes, M. Bioconversion of Agro-Industrial Residues to Second-Generation Bioethanol. In Biorefinery of Alternative Resources: Targeting Green Fuels and Platform Chemicals; Nanda, S., Vo, D.N., Sarangi, P.K., Eds.; Springer: Singapore, 2020; pp. 23–47. [Google Scholar]
  13. Kwak, S.; Jin, Y. Production of fuels and chemicals from xylose by engineered Saccharomyces cerevisiae: A review and per-spective. Microb. Cell Fact. 2017, 16, 82. [Google Scholar] [CrossRef] [PubMed] [Green Version]
  14. Favaro, L.; Jansen, T.; van Zyl, W.H. Exploring industrial and natural Saccharomyces cerevisiae strains for the bio-based economy from biomass: The case of bioethanol. Crit. Rev. Biotechnol. 2019, 39, 800–816. [Google Scholar]
  15. Kim, S.R.; Park, Y.; Jin, Y.; Seo, J. Strain engineering of Saccharomyces cerevisiae for enhanced xylose metabolism. Biotechnol. Adv. 2013, 31, 851–861. [Google Scholar] [CrossRef]
  16. Vilela, L.; de Araujo, V.; Paredes, R.; Bon, E.; Torres, F.; Neves, B.; Eleutherio, E. Enhanced xylose fermentation and ethanol production by engineered Saccharomyces cerevisiae strain. AMB Express 2015, 5, 1–7. [Google Scholar] [CrossRef] [PubMed] [Green Version]
  17. Hoang Nguyen Tran, P.; Ko, J.K.; Gong, G.; Um, Y.; Lee, S. Improved simultaneous co-fermentation of glucose and xylose by Saccharomyces cerevisiae for efficient lignocellulosic biorefinery. Biotechnol. Biofuels 2020, 13, 12. [Google Scholar] [CrossRef] [PubMed]
  18. Subtil, T.; Boles, E. Competition between pentoses and glucose during uptake and catabolism in recombinant Saccharomyces cerevisiae. Biotechnol. Biofuels 2012, 5, 14. [Google Scholar] [CrossRef] [Green Version]
  19. Bergdahl, B.; Sandström, A.G.; Borgström, C.; Boonyawan, T.; van Niel, E.W.J.; Gorwa-Grauslund, M.F. Engineering Yeast Hexokinase 2 for Improved Tolerance Toward Xylose-Induced Inactivation. PLoS ONE 2013, 8, e75055. [Google Scholar] [CrossRef] [PubMed] [Green Version]
  20. Salusjärvi, L.; Kankainen, M.; Soliymani, R.; Pitkänen, J.; Penttilä, M.; Ruohonen, L. Regulation of xylose metabolism in re-combinant Saccharomyces cerevisiae. Microb. Cell Fact. 2008, 7, 18. [Google Scholar] [CrossRef] [Green Version]
  21. Alff-Tuomala, S.; Salusjärvi, L.; Barth, D.; Oja, M.; Penttilä, M.; Pitkänen, J.; Ruohonen, L.; Jouhten, P. Xylose-Induced dynamic effects on metabolism and gene expression in engineered Saccharomyces cerevisiae in anaerobic glucose-Xylose cultures. Appl. Microbiol. Biotechnol. 2016, 100, 969–985. [Google Scholar] [CrossRef]
  22. Jin, Y.-S.; Laplaza, J.M.; Jeffries, T.W. Saccharomyces cerevisiae Engineered for Xylose Metabolism Exhibits a Respiratory Response. Appl. Environ. Microbiol. 2004, 70, 6816–6825. [Google Scholar] [CrossRef] [PubMed] [Green Version]
  23. Rose, A.H.; Vijayalakshmi, G. Baker’s Yeast. In Biochemistry and Genetics of Yeast; Bacila, M., Horecker, B.L., Stoppani, A.O.M., Eds.; Academic Press: New York, NY, USA, 1978; Volume 2, pp. 385–387. [Google Scholar]
  24. Ingledew, W.M. The Alcohol Textbook, 5th ed.; Nottingham Univ. Press: Nottingham, UK, 2009; pp. 152–156. [Google Scholar]
  25. Ochoa-Estopier, A.; Lesage, J.; Gorret, N.; Guillouet, S.E. Kinetic analysis of a Saccharomyces cerevisiae strain adapted for im-proved growth on glycerol: Implications for the development of yeast bioprocesses on glycerol. Bioresour. Technol. 2011, 102, 1521–1527. [Google Scholar] [CrossRef] [PubMed]
  26. Beudecher, R.F.; van Dam, H.W.; van der Plaat, J.B.; Vellega, K. Developments in baker’s yeast production. In Yeast Biotech-nology and Biocatalysis; Verachtert, H., de Mot, R., Eds.; Marcel Dekker: New York, NY, USA, 1990; pp. 103–146. [Google Scholar]
  27. Jørgensen, H.; Olsson, L.; Rønnow, B.; Palmqvist, E. Fed-Batch cultivation of baker’s yeast followed by nitrogen or carbon starvation: Effects on fermentaNive capacity and content of trehalose and glycogen. Appl. Microbiol. Biotechnol. 2002, 59, 310–317. [Google Scholar]
  28. Doran, P.M. Bioprocess. In Engineering Principles; Academic Press: London, UK, 1995; pp. 75–79. [Google Scholar]
  29. Heyman, B.; Tulke, H.; Putri, S.P.; Fukusaki, E.; Büchs, J. Online monitoring of the respiratory quotient reveals metabolic phases during microaerobic 2,3-butanediol production with Bacillus licheniformis. Eng. Life Sci. 2020, 20, 133–144. [Google Scholar] [CrossRef] [Green Version]
  30. Tippmann, S.; Scalcinati, G.; Siewers, V.; Nielsen, J. Production of farnesene and santalene by Saccharomyces cerevisiae using fed-Batch cultivations with RQ-controlled feed. Biotechnol. Bioeng. 2016, 113, 72–81. [Google Scholar] [CrossRef] [PubMed]
  31. Li, X.; Yu, C.; Yao, J.; Wang, Z.; Lu, S. An Online Respiratory Quotient-Feedback Strategy of Feeding Yeast Extract for Efficient Arachidonic Acid Production by Mortierella alpina. Front. Bioeng. Biotechnol. 2018, 5, 83. [Google Scholar] [CrossRef] [Green Version]
  32. Nielsen, F.; Tomás-Pejó, E.; Olsson, L.; Wallberg, O. Short-term adaptation during propagation improves the performance of xylose-fermenting Saccharomyces cerevisiae in simultaneous saccharification and co-fermentation. Biotechnol. Biofuels 2015, 8, 219. [Google Scholar] [CrossRef] [Green Version]
  33. Van Dijk, M.; Erdei, B.; Galbe, M.; Nygård, Y.; Olsson, L. Strain-dependent variance in short-term adaptation effects of two xylose-fermenting strains of Saccharomyces cerevisiae. Bioresour. Technol. 2019, 292, 121922. [Google Scholar] [CrossRef] [PubMed]
  34. Alkasrawi, M.; Rudolf, A.; Lidén, G.; Zacchi, G. Influence of strain and cultivation procedure on the performance of simul-taneous saccharification and fermentation of steam pretreated spruce. Enzyme Microb. Tech. 2006, 38, 279–286. [Google Scholar] [CrossRef]
  35. Zhang, K.; Wells, P.; Liang, Y.; Love, J.; Parker, D.A.; Botella, C. Effect of diluted hydrolysate as yeast propagation medium on ethanol production. Bioresour. Technol. 2019, 271, 1–8. [Google Scholar] [CrossRef] [PubMed]
  36. Li, B.; Yuan, Y. Transcriptome shifts in response to furfural and acetic acid in Saccharomyces cerevisiae. Appl. Microbiol. Biotechnol. 2010, 86, 1915–1924. [Google Scholar] [CrossRef]
  37. Viegas, C.A.; Sa-Correia, I. Activation of plasma membrane ATPase of Saccharomyces cerevisiae by octanoic acid. J. Gen. Microbiol. 1991, 137, 645–651. [Google Scholar] [CrossRef] [PubMed] [Green Version]
  38. Verstrepen, K.J.; Iserentant, D.; Malcorps, P.; Derdelinckx, G.; Van Dijck, P.; Winderickx, J.; Pretorius, I.S.; Thevelein, J.M.; Delvaux, F.R. Glucose and sucrose: Hazardous fast-food for industrial yeast? Trends Biotechnol. 2004, 22, 531–537. [Google Scholar] [CrossRef]
  39. Randez-Gil, F.; Córcoles-Sáez, I.; Prieto, J.A. Genetic and Phenotypic Characteristics of Baker’s Yeast: Relevance to Baking. Annu. Rev. Food Sci. Technol. 2013, 4, 191–214. [Google Scholar] [CrossRef]
  40. Verduyn, C.; Stouthamer, A.H.; Scheffers, W.A.; Van Dijken, J.P. A theoretical evaluation of growth yields of yeasts. Antonie van Leeuwenhoek 1991, 59, 49–63. [Google Scholar] [CrossRef] [PubMed]
  41. Stanley, D.; Bandara, A.; Fraser, S.; Chambers, P.J.; Stanley, G.A. The ethanol stress response and ethanol tolerance of Sac-charomyces cerevisiae. J. Appl. Microbiol. 2010, 109, 13–24. [Google Scholar] [CrossRef] [PubMed]
  42. Welsh, D.T. Ecological significance of compatible solute accumulation by micro-organisms: From single cells to global cli-mate. FEMS Microbiol. Rev. 2000, 24, 263–290. [Google Scholar] [CrossRef] [PubMed]
  43. Klein, M.; Islam, Z.; Knudsen, P.B.; Carrillo, M.; Swinnen, S.; Workman, M.; Nevoigt, E. The expression of glycerol facilitators from various yeast species improves growth on glycerol of Saccharomyces cerevisiae. Metab. Eng. Commun. 2016, 3, 252–257. [Google Scholar] [CrossRef] [Green Version]
  44. Rolland, F.; de Winde, J.H.; Lemaire, K.; Boles, E.; Thevelein, J.M.; Winderickx, J. Glucose-induced cAMP signalling in yeast requires both a G-protein coupled receptor system for extracellular glucose detection and a separable hexose kinase-dependent sensing process. Mol. Microbiol. 2000, 38, 348–358. [Google Scholar] [CrossRef]
  45. Saini, P.; Beniwal, A.; Kokkiligadda, A.; Vij, S. Response and tolerance of yeast to changing environmental stress during ethanol fermentation. Process. Biochem. 2018, 72, 1–12. [Google Scholar] [CrossRef]
  46. Microorganism Expressing Xylose Isomerase. U.S. Patent WO/2010/070549, December 2010.
  47. Microorganism Expressing Aldose-1-Epimerase. U.S. Patent WO/2010/001363, July 2009.
  48. Verduyn, C.; Postma, E.; Scheffers, W.A.; Van Dijken, J.P. Effect of benzoic acid on metabolic fluxes in yeasts: A continu-ous-culture study on the regulation of respiration and alcoholic fermentation. Yeast 1992, 8, 501–517. [Google Scholar] [CrossRef] [Green Version]
  49. Verduyn, C. Physiology of yeasts in relation to biomass yields. Antonie van Leeuwenhoek 1991, 60, 325–353. [Google Scholar] [CrossRef] [PubMed]
  50. Watteeuw, C.M.; Armiger, W.B.; Ristroph, D.L.; Humphrey, A.E. Production of single cell protein from ethanol by fed-batch process. Biotechnol. Bioeng. 1979, 21, 1221–1237. [Google Scholar] [CrossRef]
  51. Ruiz, H.A.; Silva, D.P.; Ruzene, D.S.; Lima, L.F.; Vicente, A.A.; Teixeira, J.A. Bioethanol production from hydrothermal pre-treated wheat straw by a flocculating Saccharomyces cerevisiae strain–Effect of process conditions. Fuel 2012, 95, 528–536. [Google Scholar] [CrossRef] [Green Version]
  52. Matsushika, A.; Goshima, T.; Hoshino, T. Transcription analysis of recombinant industrial and laboratory Saccharomyces cerevisiae strains reveals the molecular basis for fermentation of glucose and xylose. Microb. Cell Factories 2014, 13, 16. [Google Scholar] [CrossRef] [PubMed] [Green Version]
  53. Shen, Y.; Hou, J.; Bao, X. Enhanced xylose fermentation capacity related to an altered glucose sensing and repression network in a recombinant Saccharomyces cerevisiae. Bioengineered 2013, 4, 435–437. [Google Scholar] [CrossRef] [PubMed] [Green Version]
  54. Papapetridis, I.; Verhoeven, M.D.; Wiersma, S.J.; Gouiaan, M.; van Maris, A.J.A.; Pronk, J.T. Laboratory evolution for forced glucose-Xylose co-Consumption enables identification of mutations that improve mixed-Sugar fermentation by xy-Lose-Fermenting Saccharomyces cerevisiae. FEMS Yeast Res. 2018, 18, foy056. [Google Scholar] [CrossRef] [PubMed] [Green Version]
  55. Runquist, D.; Hahn-Hägerdal, B.; Bettiga, M. Increased expression of the oxidative pentose phosphate pathway and gluco-neogenesis in anaerobically growing xylose-Utilizing Saccharomyces cerevisiae. Microb. Cell Fact. 2009, 8, 49. [Google Scholar] [CrossRef] [PubMed] [Green Version]
  56. Zeng, W.-Y.; Tang, Y.-Q.; Gou, M.; Xia, Z.-Y.; Kida, K. Transcriptomes of a xylose-utilizing industrial flocculating Saccharomyces cerevisiae strain cultured in media containing different sugar sources. AMB Express 2016, 6, 1–13. [Google Scholar] [CrossRef] [PubMed] [Green Version]
  57. Mittelman, K.; Barkai, N. The Genetic Requirements for Pentose Fermentation in Budding Yeast. G3 Genes Genomes Genet. 2017, 7, 1743–1752. [Google Scholar] [CrossRef] [Green Version]
  58. Van Dijken, J.P.; Scheffers, W.A. Redox balances in the metabolism of sugars by yeasts. FEMS Microbiol. Lett. 1986, 32, 199–224. [Google Scholar] [CrossRef] [Green Version]
  59. Daran-Lapujade, P.; Jansen, M.L.A.; Daran, J.; van Gulik, W.; de Winde, J.H.; Pronk, J.T. Role of Transcriptional Regulation in Controlling Fluxes in Central Carbon Metabolism of Saccharomyces cerevisiae. A chemostat culture study. J. Biol. Chem. 2004, 279, 9125–9138. [Google Scholar] [CrossRef] [PubMed] [Green Version]
  60. Knudsen, J.D.; Rønnow, B. Extended fed-batch fermentation of a C5/C6 optimised yeast strain on wheat straw hydrolysate using an online refractive index sensor to measure the relative fermentation rate. Sci. Rep. 2020, 10, 6705. [Google Scholar] [CrossRef] [PubMed] [Green Version]
  61. Margono, M.; Kaavessina, M.; Khushairi Mohd Zahari, M.A.; Hisyam, A. Continuous Bioethanol Production Using Uncontrolled Process in a Laboratory Scale of Integrated Aerobic–Anaerobic Baffled Reactor. Period. Polytech. Chem. Eng. 2019, 64, 172–178. [Google Scholar] [CrossRef]
  62. Beckner, M.L.; Ivey, M.; Phister, T.G. Microbial contamination of fuel ethanol fermentations. Lett. Appl. Microbiol. 2011, 53, 387–394. [Google Scholar] [CrossRef]
  63. Lane, S.; Xu, H.; Oh, E.J.; Kim, H.; Lesmana, A.; Jeong, D.; Zhang, G.; Tsai, C.-S.; Jin, Y.-S.; Kim, S.R. Glucose repression can be alleviated by reducing glucose phosphorylation rate in Saccharomyces cerevisiae. Sci. Rep. 2018, 8, 2613. [Google Scholar] [CrossRef] [PubMed] [Green Version]
  64. Hagman, A.; Säll, T.; Compagno, C.; Piškur, J. Yeast “Make-Accumulate-Consume” Life Strategy Evolved as a Multi-Step Process That Predates the Whole Genome Duplication. PLoS ONE 2013, 8, e68734. [Google Scholar] [CrossRef]
  65. Pirt, S.J. The maintenance energy of bacteria in growing cultures. Proc. R. Soc. Lond. Ser. B Boil. Sci. 1965, 163, 224–231. [Google Scholar] [CrossRef]
  66. Vos, T.; Hakkaart, X.D.V.; de Hulster, A.F.; van Maris, A.J.A.; Pronk, J.T.; Daran-Lapujade, P.A.S. Maintenance-energy re-Quirements and robustness of Saccharomyces cerevisiae at aerobic near-Zero specific growth rates. Microb. Cell Factories 2016, 15, 111. [Google Scholar] [CrossRef] [PubMed] [Green Version]
  67. Raj, A.E.; Kumar, H.S.S.; Kumar, S.U.; Misra, M.C.; Ghildyal, N.P.; Karanth, N.G. High-Cell-Density Fermentation of Re-combinant Saccharomyces cerevisiae Using Glycerol. Biotechnol. Prog. 2002, 18, 1130–1132. [Google Scholar]
  68. Ferreira, A.D.; Mussatto, S.I.; Cadete, R.M.; Rosa, C.A.; Silva, S.S. Ethanol production by a new pentose-fermenting yeast strain, Scheffersomyces stipitis UFMG-IMH 43.2, isolated from the Brazilian forest. Yeast 2011, 28, 547–554. [Google Scholar] [CrossRef] [Green Version]
  69. Sperotto, G.; Stasiak, L.G.; Godoi, J.P.M.G.; Gabiatti, N.C.; de Souza, S.S. A review of culture media for bacterial cellulose production: Complex, chemically defined and minimal media modulations. Cellulose 2021, 28, 2649–2673. [Google Scholar] [CrossRef]
  70. Lorenz, E.; Schmacht, M.; Stahl, U.; Senz, M. Enhanced incorporation yield of cysteine for glutathione overproduction by fed-batch fermentation of Saccharomyces cerevisiae. J. Biotechnol. 2015, 216, 131–139. [Google Scholar] [CrossRef]
  71. Raghavendran, V.; Webb, J.P.; Cartron, M.L.; Springthorpe, V.; Larson, T.R.; Hines, M.; Mohammed, H.; Zimmerman, W.B.; Poole, R.K.; Green, J. A microbubble-sparged yeast propagation–fermentation process for bioethanol production. Biotechnol. Biofuels 2020, 13, 1–104. [Google Scholar] [CrossRef]
  72. Shiloach, J.; Fass, R. Growing E. coli to high cell density—A historical perspective on method development. Biotechnol. Adv. 2005, 23, 345–357. [Google Scholar] [CrossRef]
  73. Hanotu, J.; Kong, D.; Zimmerman, W.B. Intensification of yeast production with microbubbles. Food Bioprod. Process. 2016, 100, 424–431. [Google Scholar] [CrossRef] [Green Version]
  74. Devi, T.T.; Kumar, B. Mass transfer and power characteristics of stirred tank with Rushton and curved blade impeller. Eng. Sci. Technol. Int. J. 2017, 20, 730–737. [Google Scholar] [CrossRef] [Green Version]
  75. Schaepe, S.; Kuprijanov, A.; Sieblist, C.; Jenzsch, M.; Simutis, R.; Lübbert, A. kLa of stirred tank bioreactors revisited. J. Biotechnol. 2013, 168, 576–583. [Google Scholar] [CrossRef] [PubMed]
  76. Aßkamp, M.R.; Klein, M.; Nevoigt, E. Saccharomyces cerevisiae exhibiting a modified route for uptake and catabolism of glycerol forms significant amounts of ethanol from this carbon source considered as ‘non-fermentable’. Biotechnol. Biofuels 2019, 12, 257. [Google Scholar] [CrossRef] [PubMed]
  77. Lages, F.; Lucas, C. Contribution to the physiological characterization of glycerol active uptake in Saccharomyces cerevisiae. Biochim. Biophys. Acta 1997, 1322, 8–18. [Google Scholar]
  78. Sutherland, F.C.W.; Lages, F.; Lucas, C.; Luyten, K.; Albertyn, J.; Hohmann, S.; Prior, B.A.; Kilian, S.G. Characteristics of Fps1-dependent and -independent glycerol transport in Saccharomyces cerevisiae. J. Bacteriol. 1997, 179, 7790–7795. [Google Scholar] [CrossRef] [Green Version]
Figure 1. Substrate consumption and product formation over the course of 48 h of fermentation using (A,B) YPS cells and (C,D) YPEG cells. Glucose (○), xylose (◇), mannose (□), ethanol (▲), glycerol (■), biomass (●), and CO2 (—). Standard deviations derived from two independent experiments are indicated by error bars. For the fermentations using YPS cells, metabolite samples were taken at different timepoints for each duplicate, which means that standard deviations are only available for selected data points. The CO2 exhaust was continuously monitored during all fermentations, and it is an indicator of the overall sugar conversion rate. The grey shadow depicts the standard deviation of the CO2 curve.
Fermentation 07 00288 g001
Figure 2. Stoichiometric relation between RQ and biomass yield on ethanol (____), glycerol (- - -), or the combination of ethanol and glycerol provided in the feed (……), i.e., a molar ratio of ethanol:glycerol of 8:1. The three curves were calculated using Equations (8)–(10).
Fermentation 07 00288 g002
Figure 3. Biomass concentration (■) obtained throughout the course of the propagation in fed-batch mode. The RQ (……) represents the ratio between the CO2 produced and the oxygen consumed. The values are averages of two duplicates. Standard deviations of biomass concentrations are shown.
Fermentation 07 00288 g003
Table 1. Maximum fermentation rates and product yields at the end of fermentations on defined media in serum vials. The yeast was collected from a sucrose (YPS) preculture or an ethanol and glycerol (YPEG) preculture. The initial sugar concentration was 110 g/L, with a weight ratio of glucose to xylose of 3:2 in the medium containing both sugars. The substrates were fully depleted when experiments were ceased. Averages and standard deviations of three individual experiments are presented.
MediaPrecultureMax. Substrate Degradation Rate (g/L/h)Final Ethanol Titre (g/L)Ethanol Yield (g/g)Glycerol Yield (g/g)
GlucoseYPS4.75 ± 0.0445.13 ± 1.070.39 ± 0.010.09 ± 0.00
YPEG4.73 ± 0.1044.57 ± 0.240.38 ± 0.000.12 ± 0.00
XyloseYPS1.62 ± 0.1846.74 ± 1.180.39 ± 0.000.07 ± 0.00
YPEG2.54 ± 0.1145.81 ± 0.640.38 ± 0.010.10 ± 0.00
Glucose–XyloseYPS3.19 ± 0.2346.10 ± 0.310.40 ± 0.000.11 ± 0.00
YPEG4.14 ± 0.0245.45 ± 0.430.39 ± 0.000.12 ± 0.00
Table 2. Product yields of fermentations performed with YPS and YPEG cells on softwood hydrolysate in a 0.67 L controlled bioreactor. Averages and standard deviations of two individual experiments are presented.
PrecultureEthanol Productivity (g/L/h)Ethanol Yield (g/g)Glycerol Yield (g/g)Biomass Yield (g/g)
YPS1.19 ± 0.020.47 ± 0.010.03 ± 0.000.00 ± 0.00
YPEG1.47 ± 0.010.45 ± 0.010.13 ± 0.000.03 ± 0.00
Table 3. Relevant process parameters observed during propagation of S. cerevisiae cV-110 on ethanol and glycerol in fed-batch mode in an automatic bioreactor.
Process ParameterValue ± Std
Average biomass yield (g/g)0.39 ± 0.00
Percent biomass yield (%) 147.8 ± 0.64
Average volumetric productivity (g/L/h)1.03 ± 0.05
Final biomass concentration (g/L)71.3 ± 0.91
Ethanol consumed (g/L)174 ± 28.9
Glycerol consumed (g/L)43.2 ± 7.14
1 The percent biomass yield was calculated as the ratio between the observed biomass yield and the maximum theoretical biomass yield corresponding to an RQ of 0.22, which was imposed as the minimum RQ boundary. The maximum theoretical yield was calculated according to Equation (10).
Publisher’s Note: MDPI stays neutral with regard to jurisdictional claims in published maps and institutional affiliations.

