Article

Changes in Bioactive Compounds of Coffee Pulp through Fermentation-Based Biotransformation Using Lactobacillus plantarum TISTR 543 and Its Antioxidant Activities

School of Cosmetic Science, Mae Fah Luang University, Chiang Rai 57100, Thailand
*
Author to whom correspondence should be addressed.
Submission received: 9 November 2021 / Revised: 26 November 2021 / Accepted: 26 November 2021 / Published: 30 November 2021
(This article belongs to the Section Fermentation Process Design)

Abstract

:
The use of biotransformation has become a popular trend in the food and cosmetic industry. Lactic acid bacteria (LAB) are widely used due to their safety and beneficial effects on human health. Coffee pulp, a by-product obtained from coffee production, has antioxidant activity because it contains different classes of phenolic compounds. To investigate the factors affecting the biotransformation process of coffee pulp using L. plantarum TISTR 543, a systematic study using 23 factorial designs in a completely randomized design (CRD) was done. After the coffee pulp was bio-transformed, its bacterial count, pH, phenol contents, flavonoid contents, tannin contents, changes in bioactive compounds by LC-QQQ, and antioxidant properties were studied. The highest phenolic content was obtained in the sample containing the substrate, water, and sugar in the ratio of 3:10:3 with a 5% starter. After the fermentation was done, for 24–72 h, total bacteria count, total phenol contents, and antioxidant activities significantly increased compared to their initial values. Protocatechuic acid also markedly increased after 24 h of the biotransformation process. Hence, the fermentation of coffee pulp with L. plantarum TISTR 543 can produce substances with a higher biological activity which can be further studied and used as functional foods or active ingredients in cosmetic application.

1. Introduction

Coffee is one of the beverages that are highly consumed recently and its production has also increased globally. According to Adam et al. [1], there has been an increase in the global coffee production from 9.5 million tons in 2017–2018 to 10.2 million tons in 2018–2019. Among coffee varieties, Arabica coffee (Coffea arabica) is the most popular one, accounting for 60% of the world’s total output due to its pleasant taste and aroma, stimulant effects, and other health benefits attributed to coffee [2].
After the wet process of coffee production, coffee pulp, the main residue, accounts for approximately 30% of the weight of dry coffee cherries [3], and up to 9.4 million tons of coffee pulp are generated annually [4]. The large-scale disposal of coffee pulp as an agricultural waste might cause serious environmental issues. Today, several attempts have been made to valorize coffee pulp, including the production of bioethanol [5], biogas [6], vermicompost and compost [3,7], sugar [3,7], cascara [8], and other aroma compounds [9].
Cascara, coffee cherry tea, which can be produced by infusion of dried coffee pulp, has become a huge part of the globally growing market of functional foods. Recently, it has been extensively studied due to its composition of coffee pulp that contains different major classes of phenolic compounds, such as chlorogenic acid, which is a predominant phenolic compound [10], followed by anthocyanidins, flavan-3-ols, hydroxycinnamic acids, and flavonols [11]. It has been reported that these phenolic compounds found in coffee pulp have important health benefits, including antioxidant, anticarcinogenic, anti-inflammatory, and anti-hypoglycemic effects [12].
As industrially useful chemistry needs extreme conditions of pH, temperatures, and pressures for operation, the usage of biotransformation has become a trend in recent production because it can operate at near-neutral pH, ambient temperatures, and atmospheric pressures. More importantly, biocatalysts, for example, enzymes produced from microorganisms, are highly specific for the reaction [13]. LAB (a group of bacteria that produce lactic acid from their metabolism) are used in the biotransformation processes in the food and cosmetic industry. They are Generally Recognized as Safe (GRAS) and well known for their beneficial effects on human health due to their therapeutic and functional properties. Recently, this group of bacteria is utilized to transform secondary substances in nature, such as phenolics and flavonoids, into a more potent substance by the action of enzymes produced during the biotransformation process of LAB [14]. L. plantarum has been reported as a potential microorganism that can be used in the biotransformation of phenolic-rich compounds due to its enzymatic activities, including β-glucosidase, amylase, lactate, decarboxylase, dehydrogenase, phenolic acid decarboxylase, phenol reductase, tannase, etc. [15]. L. plantarum can produce powerful antioxidant compounds from the transformation of hydroxybenzoic acids, such as the transformation of gallic acid into pyrogallol [16]. Apart from being able to transform of hydroxybenzoic acids, they are also used for the degradation of hydrolyzable tannins to gallic acid and the transformation of hydroxycinnamic acids [15]. Additionally, L. plantarum is known as the probiotics that promote health benefits and play an important role in disease prevention, such as irritable bowel syndrome, inflammation, metabolic diseases, and dermatological health [17]. Therefore, L. plantarum has been selected as a starter for this study.
Although several studies have examined the effects of the fermentation process of coffee pulp with different types of microorganisms on the changes in phenolic compounds and the antioxidant activity of coffee pulp extracts, the study on the factors affecting the biotransformation of coffee pulp using LAB is limited. This study aims to investigate the factors affecting the biotransformation process of coffee pulp by using L. plantarum TISTR 543 and the changes in bioactive compounds and antioxidant properties of coffee pulp after the biotransformation process to be used as functional food, dietary supplements, or active ingredients in cosmetic application.

2. Materials and Methods

2.1. Materials and Microorganisms

Fresh coffee pulp (Coffea arabica) was collected during the cropping season (February 2021) from Baan Doi Chaang, Mae Suai District, Chiang Rai, Thailand. It was stored at -20 degrees Celsius until further use. Cane sugar was purchased from the local market (Chiang Rai, Thailand). Lactobacillus plantarum TISTR 543 was obtained from the Thailand Institute of Scientific and Technological Research (TISTR), Thailand. Folin–Ciocalteu’s phenol reagent, Aluminium chloride, Potassium persulfate, Ferric chloride hexahydrate, Ferrous sulfate heptahydrate, Sodium carbonate anhydrous, and Sodium acetate trihydrate were purchased from Loba Chemie Pvt Ltd. (Mumbai, India). Quercetin, 2,2-diphenyl-1-picrylhydrazyl (DPPH), 2,2-azino-bis (3-ethylbenzothiazoline-6-sulfonic acid) (ABTS), 2,4,6-Tri(2-pyridyl)-s-triazine (TPTZ) were obtained from Sigma-Aldrich (St. Louis, MO, USA). Absolute ethanol, 98% sulfuric acid, and 37% hydrochloric acid were acquired from RCI-Labscan (Bangkok, Thailand). LC-MS grade water and acetonitrile (ACN) were supplied by J.T. Baker (Phillipsburg, NJ, USA). Formic acid (LC-MS grade) was obtained from Thermo Fisher Scientific (Sydney, Australia). All the other reagents were of analytical grade or the highest pure grade.

2.2. Starter Culture Preparation

L. plantarum TISTR 543 was used as a starter culture in this study. One loopful of L. plantarum stock was inoculated on preculture de Man, Rogosa, and Sharpe (MRS) agar plate and incubated at 30 ± 2 °C for 48 h. The obtained single colony was then transferred to MRS broth and incubated at 30 ± 2 °C for 24 h, to obtain an approximate cell concentration of 109 CFU/mL. The inoculum was prepared in the range of 5–15 % for coffee pulp fermentation [18].

2.3. Fermentation

The actual and coded levels and the experimental layouts used for 23 factorial designs in CRD are listed in Table 1 and Table 2, respectively. Prior to the fermentation process, the coffee pulp was homogenized and blended by mechanical crushing. The blended coffee pulp, water, and sugar were mixed, as seen in Table 2. The samples were autoclaved at 121 °C and 15 lbs for 15 min. After cooling, the sterilized substrates were inoculated with a starter culture (109 CFU/mL stock) under aseptic conditions, as seen in Table 2. The resultant flasks were incubated at 30 °C for the fermentation process, and samples were collected to assess the total phenolic content [18].

2.4. Determination of the Optimum Fermentation Time

The fermentation condition that could yield the maximum phenolic content was chosen to study the effect of fermentation time. The samples were collected at 0, 24, 72, 120, and 168 h to determine the pH and bacterial enumeration, total phenolic content, total flavonoid content, total tannin content, antioxidant activities, and the determination of bioactive compounds.

2.5. Microbial Enumeration and pH Determination

Conventional microbiological methods were used to evaluate the microbial enumeration. Microbial counts of LAB were measured by serial dilution and plate count method using a previously described protocol [18]. LAB was incubated at 30 °C for 48 h under anaerobic conditions. Each analysis was carried out in triplicate. After the appropriate incubation period, colonies were counted, and all bacterial counts were expressed as Log10 CFU/mL. The pH of the fermented coffee pulp samples was determined using a pH meter (Singapore).

2.6. Determination of Total Phenolic Content

Total phenolics content was determined by the Folin–Ciocalteu method, which was adapted from the method described by Saelee et al. [18]. Briefly, 80 µL of the fermented coffee pulp sample at the appropriate dilution was incubated with 20 µL of Folin–Ciocalteu’s reagent and 100 µL of 7.5% Na2CO3 solution, respectively. The reaction was kept at room temperature in the dark for 30 min. Then, the absorbance of the solution was carried out at 765 nm. The values were expressed as mg gallic acid equivalent (GAE) per gram of the sample.

2.7. Determination of Total Flavonoid Content

The total flavonoid content (TFC) for each coffee extract was assessed using the method described by Haile and Kang [19], with some modifications. Seventy microliters of an appropriate dilution of the fermented coffee pulp was mixed with 15 µL of 5% NaNO2 and incubated for 5 min. Then, 10% AlCl3 solution (25 µL) was added to the reaction. The reaction was kept at room temperature for 6 min, and 1 M NaOH solution (100 µL) was added to it. The reaction mixture was incubated for 10 min. The absorbance of the solution was assessed at 510 nm. The amount of flavonoids in the coffee pulp was expressed as mg quercetin equivalent (QE) per gram of the coffee pulp.

2.8. Determination of Tannin Content

Total tannin content was measured as per the method of Haile and Kang [19]. Briefly, 125 µL of the sample was mixed with 25 µL of Folin & Ciocalteu’s reagent followed by adding 35% Na2CO3 solution (50 µL) into 96-well plates. After incubation at room temperature for 30 min, the absorbance was determined at 700 nm using DI water as a blank. Results were represented as mg tannic acid equivalent (TAE) per gram of the sample.

2.9. Antioxidant Activity Assays

2.9.1. 1,1-diphenyl-2-picryl-hydrazil (DPPH) Radical Scavenging Assay

The DPPH assay was done based on a previously stated protocol [18] to determine the antioxidant capacity of coffee pulp extract at different fermentation stages. The DPPH activity of coffee pulp extract was evaluated before (control) and after treatments. Briefly, 40 μL of the samples was mixed with 135 μL of 0.1 mM DPPH solution and incubated at room temperature in the dark for 30 min. After incubation, the absorbance of the samples was measured at 517 nm. The results were represented as mg Trolox equivalents (TE) antioxidant capacity per gram of the sample. The DPPH radical scavenging activity was calculated as follows:
DPPH radical scavenging activity (%) = [(Abs. of control − Abs. of sample)/Abs. of control] × 100.

2.9.2. 2,2′-azino-bis-3-ethylbenzthiazoline-6-sulphonic Acid (ABTS) Radical Scavenging Assay

The ABTS assays were performed based on a previous method, with some modifications [18]. ABTS•+ stock solution was prepared by mixing 7 mM ABTS and 2.45 mM potassium persulfate. It was incubated at room temperature in the dark for 12–16 h. Then, 5 mL of stock solution of ABTS•+ and 95 mL of deionized water were mixed to prepare the working solution. Forty microliters of the sample or Trolox (as a standard solution) was mixed with 160 μL of ABTS•+ working solution and incubated at room temperature in the dark for 30 min. The absorbance of the reaction was measured at 734 nm. The results were expressed as mg Trolox equivalent antioxidant capacity (TEAC) per gram of the sample. The ABTS radical scavenging activity was calculated as follows:
ABTS radical scavenging activity (%) = [(Abs. of control − Abs. of sample)/Abs. of control] × 100.

2.9.3. Ferric Reducing Antioxidant Power Assay (FRAP)

The FRAP assay was evaluated using a previous protocol [20], with slight modifications. FRAP reagent was freshly prepared by mixing 30 mM Acetate Buffer pH 3.6, 10 mM TPTZ solution in 40 mM HCl, and 20 mM FeCl3 • 6H2O solution in the ratio of 10:1:1, respectively. The FRAP reagent was stored in a light-protected bottle until use. Twenty microliters of the diluted sample was mixed with 180 μL of the FRAP reagent. Subsequently, the reaction mixture was incubated at room temperature for 4 min. The absorbance of the solution was quantified at 593 nm. Results were represented as mg FeSO4 equivalents per gram of the sample.

2.10. Determination of Bioactive Compounds by LC-QQQ

The phenolic compounds in the coffee pulp samples were determined performed by using a Shimadzu Nexera X2 UHPLC system equipped with LC-30AD binary gradient pumps, SIL-30AC autosampler, CTO-20AC column oven, and DGU-20A5R degasser coupled to a Shimadzu LCMS-8060 triple quadrupole mass spectrometer (QQQ) equipped with an electrospray ionization (ESI) source (Shimadzu, Kyoto, Japan) operating in both positive and negative ionization modes. Chromatographic separation was carried out by a C18 reversed-phase Avantor® ACE® Excel® C18-PFP (100 mm × 2.1 mm, 1.7 μm) analytical column. The column temperature was maintained at 30 °C. The mobile phase consisted of mobile phase A (0.2% formic acid in water) and mobile phase B (LC-MS grade ACN) at the flow rate of 0.3 mL/min. The elution gradient condition is as follows: 10% B at the beginning −0.30 min, 10% to 15% B at 0.30–2.40 min, 15% to 20% B at 2.40–3.25 min, 20% B at 3.25–3.60 min, 20–95% B at 3.60–6.20 min, 95% B at 6.20–7.00 min, 95–10% B at 7.00–7.50 min, and 10% B at 7.50–11.0 min. All samples were filtered through a 0.22 µm nylon syringe filter before analysis and injected at 1 μL. The ESI condition was settled as follows: interface temperature of 300 °C, DL temperature of 250 °C, heat block temperature of 400 °C, nebulizing gas flow (nitrogen); 3.0 L/min and drying gas flow (nitrogen); 10.0 L/min. The analytes were quantified a using multiple reaction monitoring (MRM) mode. The data of LC–QQQ were gathered and processed by LabSolutions software (Shimadzu, Kyoto, Japan). Finally, the bioactive compounds in were verified the samples were verified by comparing the precursor ions (m/z), product ions (m/z), retention times (RT, min) as shown in Table 3. The quantification of the bioactive compounds was assessed by the peak areas of the samples with the bioactive compound standards. The contents were expressed as µg/mL [21].

2.11. Statistical Analysis

The experiments were carried out in triplicate. The factorial analysis of variance (ANOVA) and the calculation of regression coefficients calculated with Statistical Package for the Social Sciences (SPSS) software (IBM Inc., Armonk, NY, USA), version 23.0, were used to statistically analyze the data obtained from 23 factorial designs in CRD. The difference in pH and bacterial enumeration, bioactive compounds, and antioxidant activities at each fermentation time were evaluated by one-way ANOVA. The least significant difference tests were used to further analyze the data groups that exhibited a statistical significance (p < 0.05). All values were represented as the mean ± standard deviation.

3. Results and Discussion

3.1. Fermentation

To evaluate the interactions between response variables and predictor variables, the factorial designs are used to provide the most efficient experimental runs and data collection plan and also estimate all possible interactions between variables [22]. In this study, we studied the effect of substrate, sugar, and starter interactions by observing the changes in the phenolic contents of the coffee pulp as the contents of phenolic compounds. The most significant variables affecting the production of phenolic content by L. plantarum were screened and evaluated using 23 factorial designs in CRD. Three variables (substrate concentration, sugar concentration, and starter amount) were assessed through 8 experimental runs. The data are presented in Figure 1 and Table 4.
The highest amount of total phenol content was found in standard condition no. 3 which contained the substrate, water, and sugar ratio of 3:10:3 with 5% starter (3.34 ± 0.10 mg GAE/g substrate), while the lowest amount of total phenol content was seen in standard condition no. 6 which contained the substrate, water, and sugar ratio of 7:10:1 with 15% starter (0.98 ± 0.04 mg GAE/g substrate). The statistical analysis of data (type III sum of squares, degree of freedom, mean square, F-value, p-value, coefficient of determination (R squared)) by this design is shown in Table 4. The result of the F-value of 358.897 states that the design is significant for changes in the total phenolic compound by L. plantarum. Substrate concentration, sugar content, and the amount of starter, the interaction between substrate concentration and sugar content, and the interaction between all three variables had a significant impact on the transformation of phenolic compound (p < 0.05). The effect of variables on the biotransformation of the phenolic compound by L. plantarum demonstrated that substrate concentration, starter amount, and interaction between substrate and sugar content had negative effects while the sugar content had a positive impact. In terms of substrate concentration, the phenolic content was expected to increase when the substrate concentration increased up to its maximum level. In this study, the substrate concentration had negative effect on total phenolic content. This finding has been supported by previous study [23]. According to Starzyńska and Stodolak [24], the negative impact of the starter may be related to the increase in polyphenol oxidase that catalyzes the phenolic compounds to quinones resulting in the decrease in phenolic contents. The results agreed with Sandhya et al. [25], in which the contents of phenolic compounds in cocoa bean fermentation decreased significantly when there was an increase in inoculum concentration. However, Sripo et al. [26] reported that the contents of phenolic compounds increased at higher inoculum concentrations of the lactobacilli in a fermented rice solution. The results may vary due to the different substrates and different strains of lactobacilli used in the fermentation. When sugar concentration was considered, there was a report that high concentrations of sugar increased the phenolic contents and also antioxidant activity of the sauerkrauts as it serves as the energy resources for the growth of the LAB [27]. Furthermore, Dewi et al. [28] reported that total phenolic contents in fermented seaweed increased by the addition of sugar cane and palm sugar. Our results are in line with these findings. The coefficient of determination (R squared) was 0.994, and the adjusted coefficient of determination (adjusted R squared) was 0.991. This means that 99.4% of the data fit the regression model. This result suggests there is a strong linear relationship between total phenolic content and these three independent variables. The regression equation resulting from the design is presented as follows:
Y (total phenolic content) = 1.959 − 0.707A + 0.308B − 0.105C − 0.209 (A × B) + 0.007 (A × C) + 0.018 (B × C) + 0.062 (A × B × C),
where Y = the predicted response, A = Substrate concentration, B = Sugar content, and C = Starter amount.
The optimal condition of the substrate concentration, sugar content, and the amount of starter identified and screened by 23 factorial designs in CRD using response surface methodology was found in standard condition no. 3, which was used for further procedures.

3.2. Determination of the Optimum Fermentation Time

3.2.1. pH Measurement and Microbial Enumeration

The results of pH measurement and microbial enumeration are shown in Figure 2. The coffee pulp extract became more acidic with increased fermentation time (p < 0.05). The pH values of the samples decreased eventually after 120-h fermentation and then increased again after 168-h fermentation (Figure 2a). The decrease in pH value after fermentation was correlated with organic acids produced by L. plantarum, which pointed out that the metabolic activities could change the pH of the fermented culture [29].
The number of lactic acid bacteria of the fermented coffee pulp revealed that there was a significant difference (p < 0.05) in the bacterial count at different fermentation times, as shown in Figure 2b. The bacterial count of LAB increased gradually and reached its peak at 72 h of fermentation. After that, it went down slightly again after 120-h and 168-h fermentation, respectively. The biotransformation of primary metabolites to secondary metabolites in the late stage might also cause the decline of the growth of lactobacilli [29]. The rapid increase in the bacteria load correlated with the decreased pH value of the samples. The result is in accordance with Thongruck et al. [30], who reported that this rapid growth of LAB decreased the pH to lower than 4.55 within 2 days after shrimp fermentation. However, Kaprasob et al. [29] reported that the viable bacteria decreased at the initial phase of the fermentation and became stable after 48-h fermentation of fresh and concentrated cashew apple juice using L. plantarum.

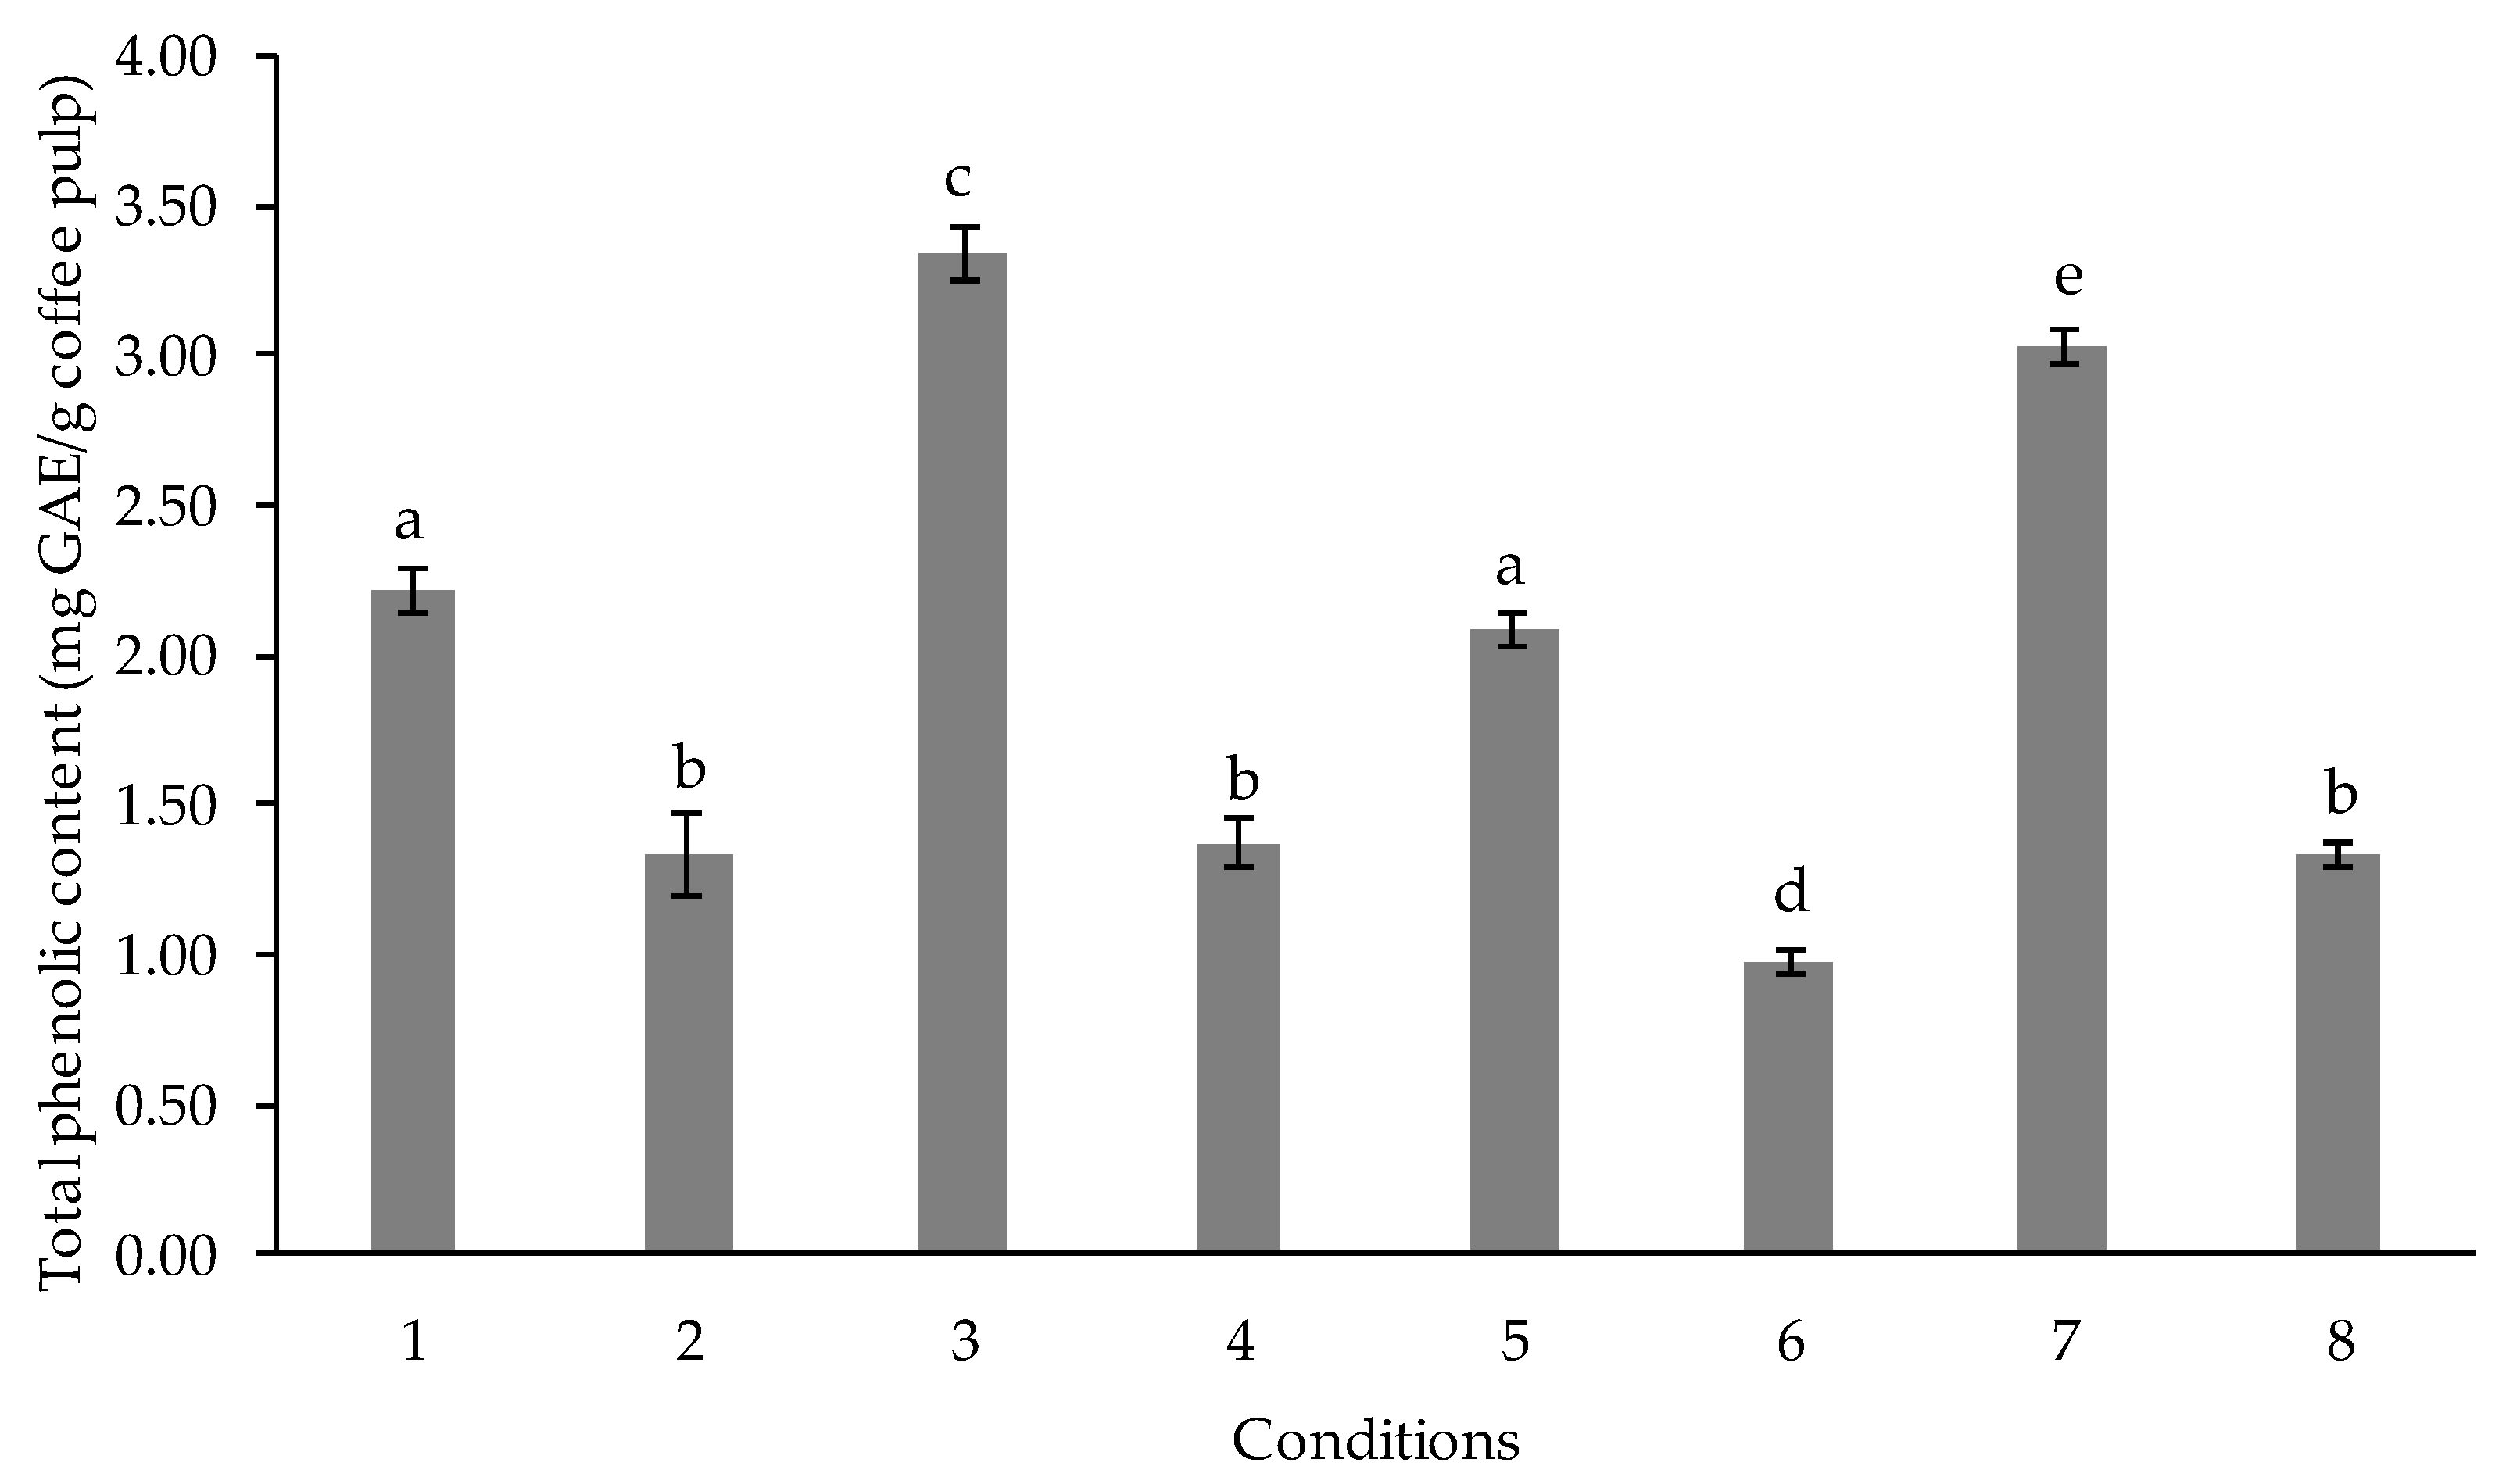
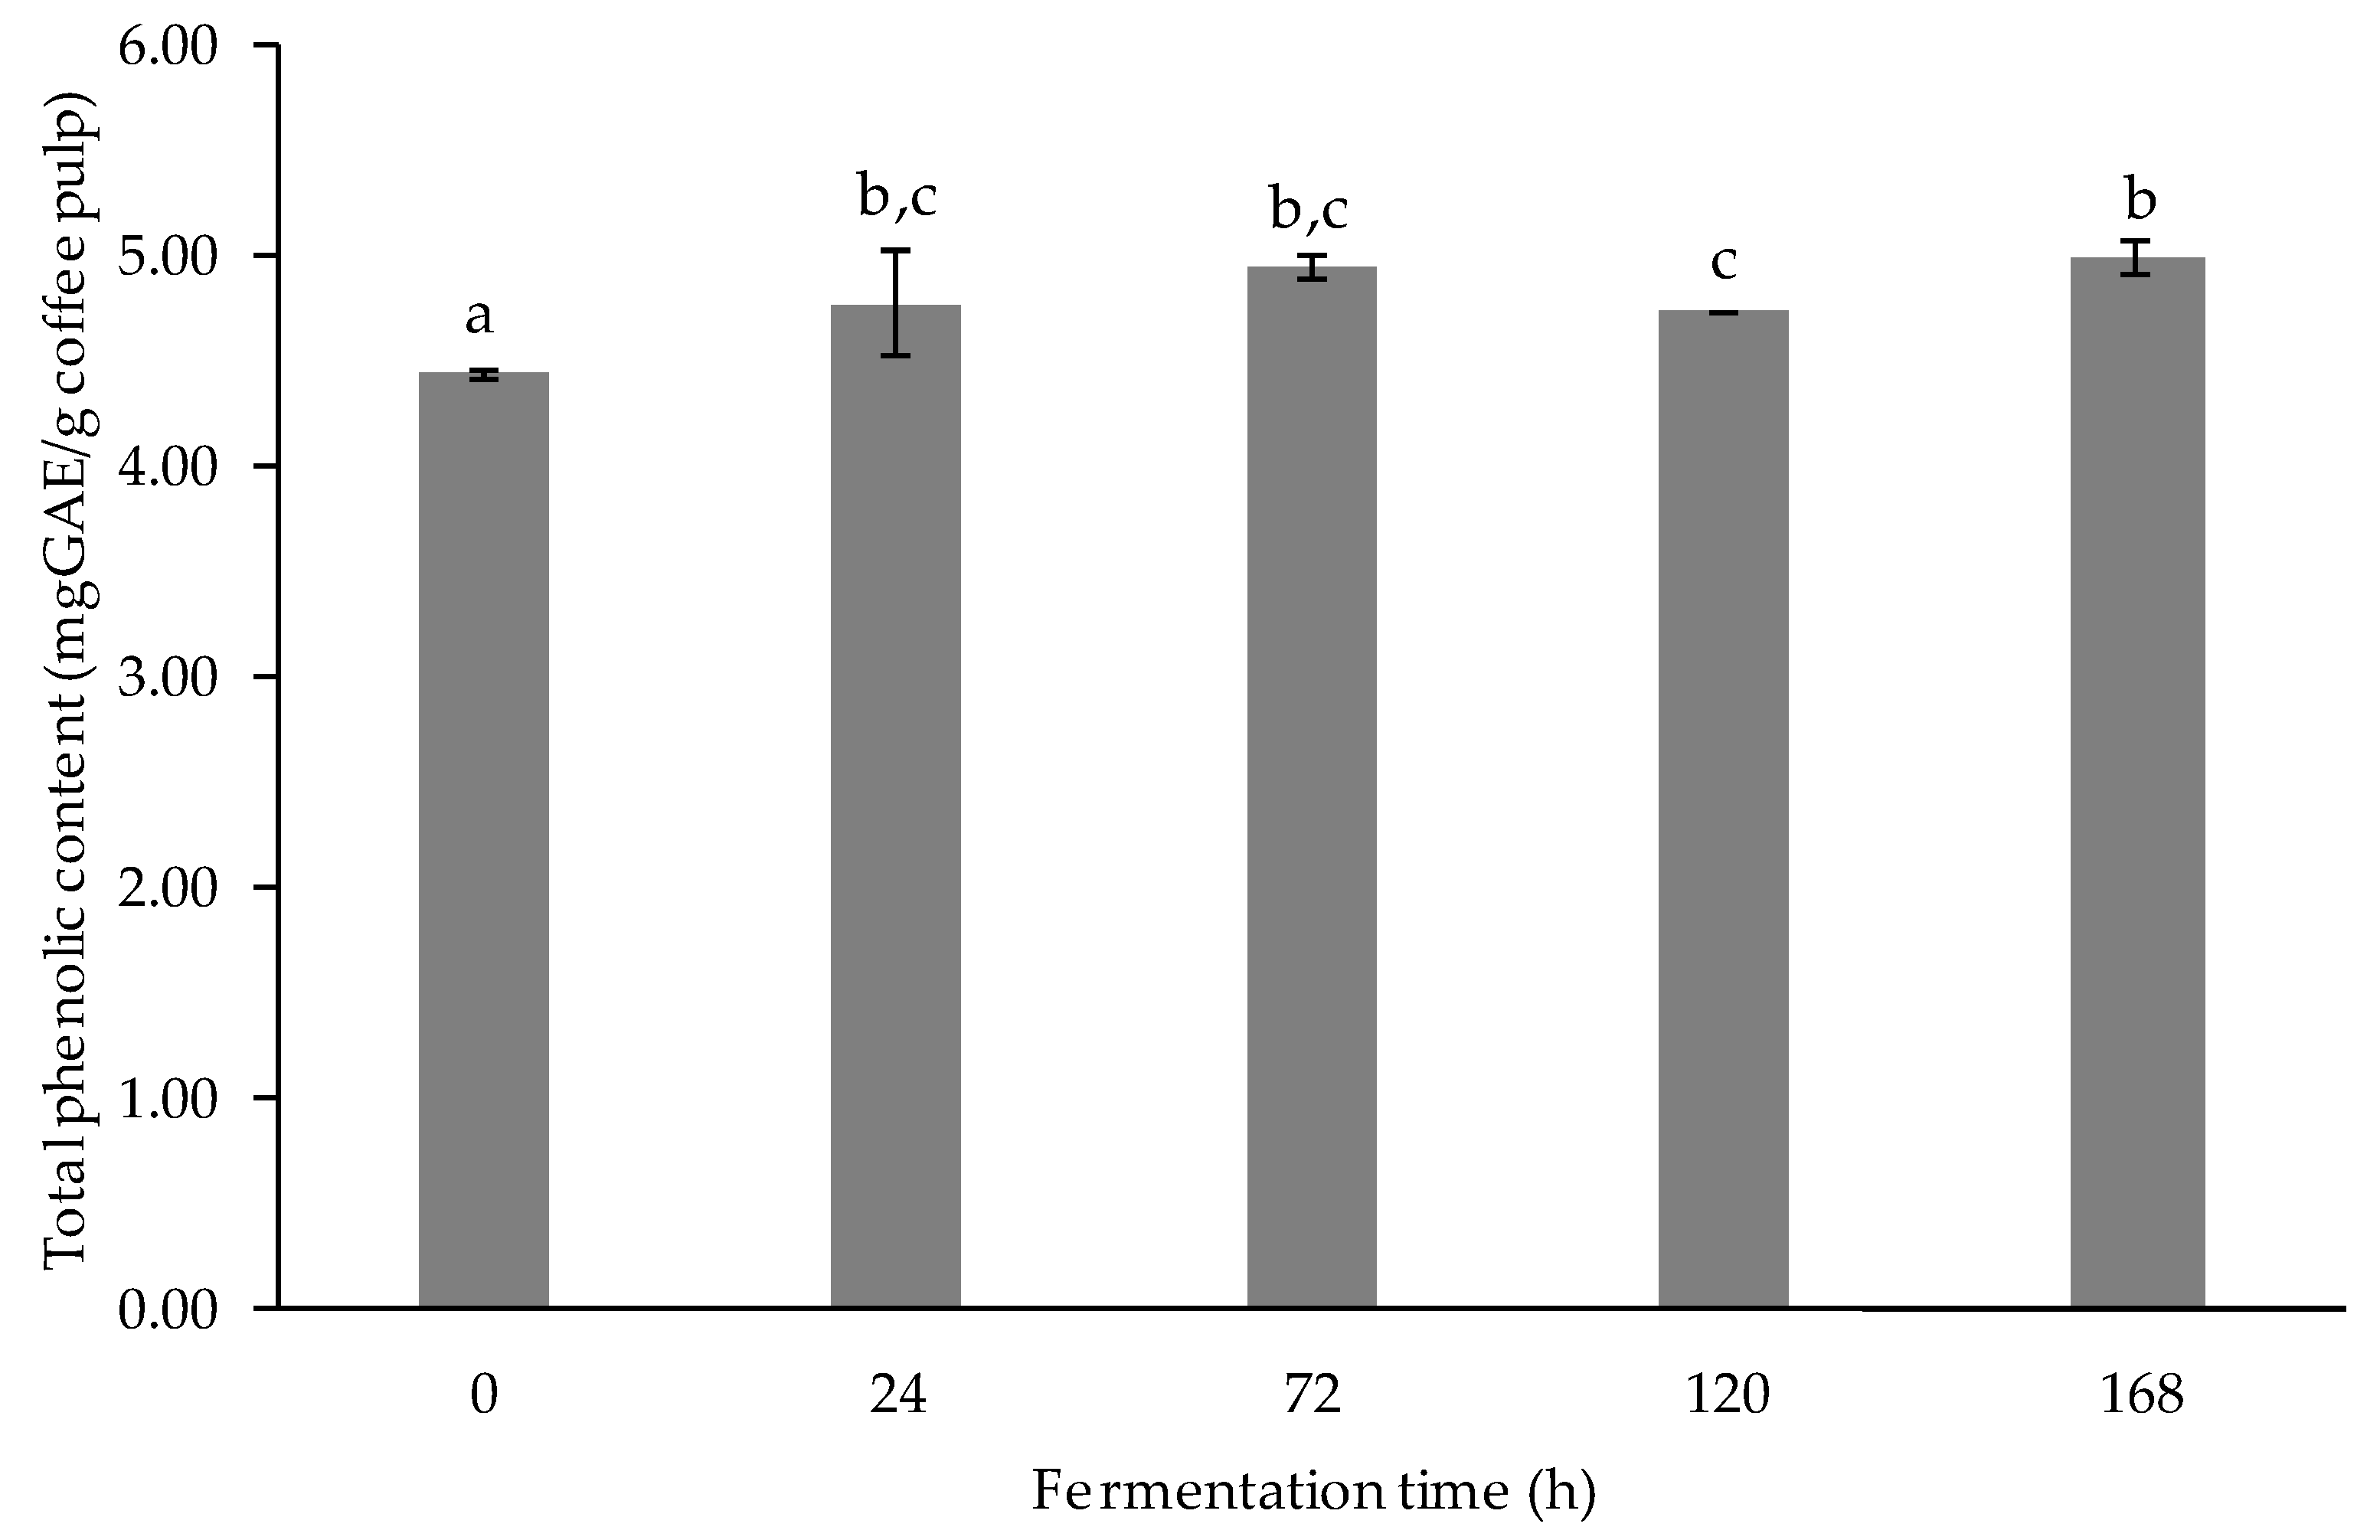
3.2.2. Determination of Total Phenolic Content

The phenolic compounds, found abundantly in plants, are secondary metabolites derived from phenylalanine and tyrosine. The phenolic compound structure contains hydroxyl groups that can scavenge free radicals [31]. The result of total phenolic content determination is presented in Figure 3. After fermentation, the total phenolic content markedly increased when compared with their initial value (p < 0.05). The highest value of total phenolic content was found after 24-, 72-, and 168-h fermentation. The gradual rise of phenolic content from the starting phase of the fermentation to 168-h fermentation may be due to the increase in bioactive compounds, such as phenolic acids, through LAB-mediated fermentation [32,33]. The increase in phenolic contents was further explained by Zubaidah et al. [34], in which, during fermentation, complex bonds between phenolic and other compounds were broken by enzymes, such as invertase, cellulase, and amylase, leading to the increase in total phenolic content. In this study, a slight decrease in phenolic content at 120-h fermentation may be related to the fact that the phenolics of coffee pulp extract might bind with sugar, leading to reduced solubility of phenolic compounds, or it might be degraded during fermentation [29].

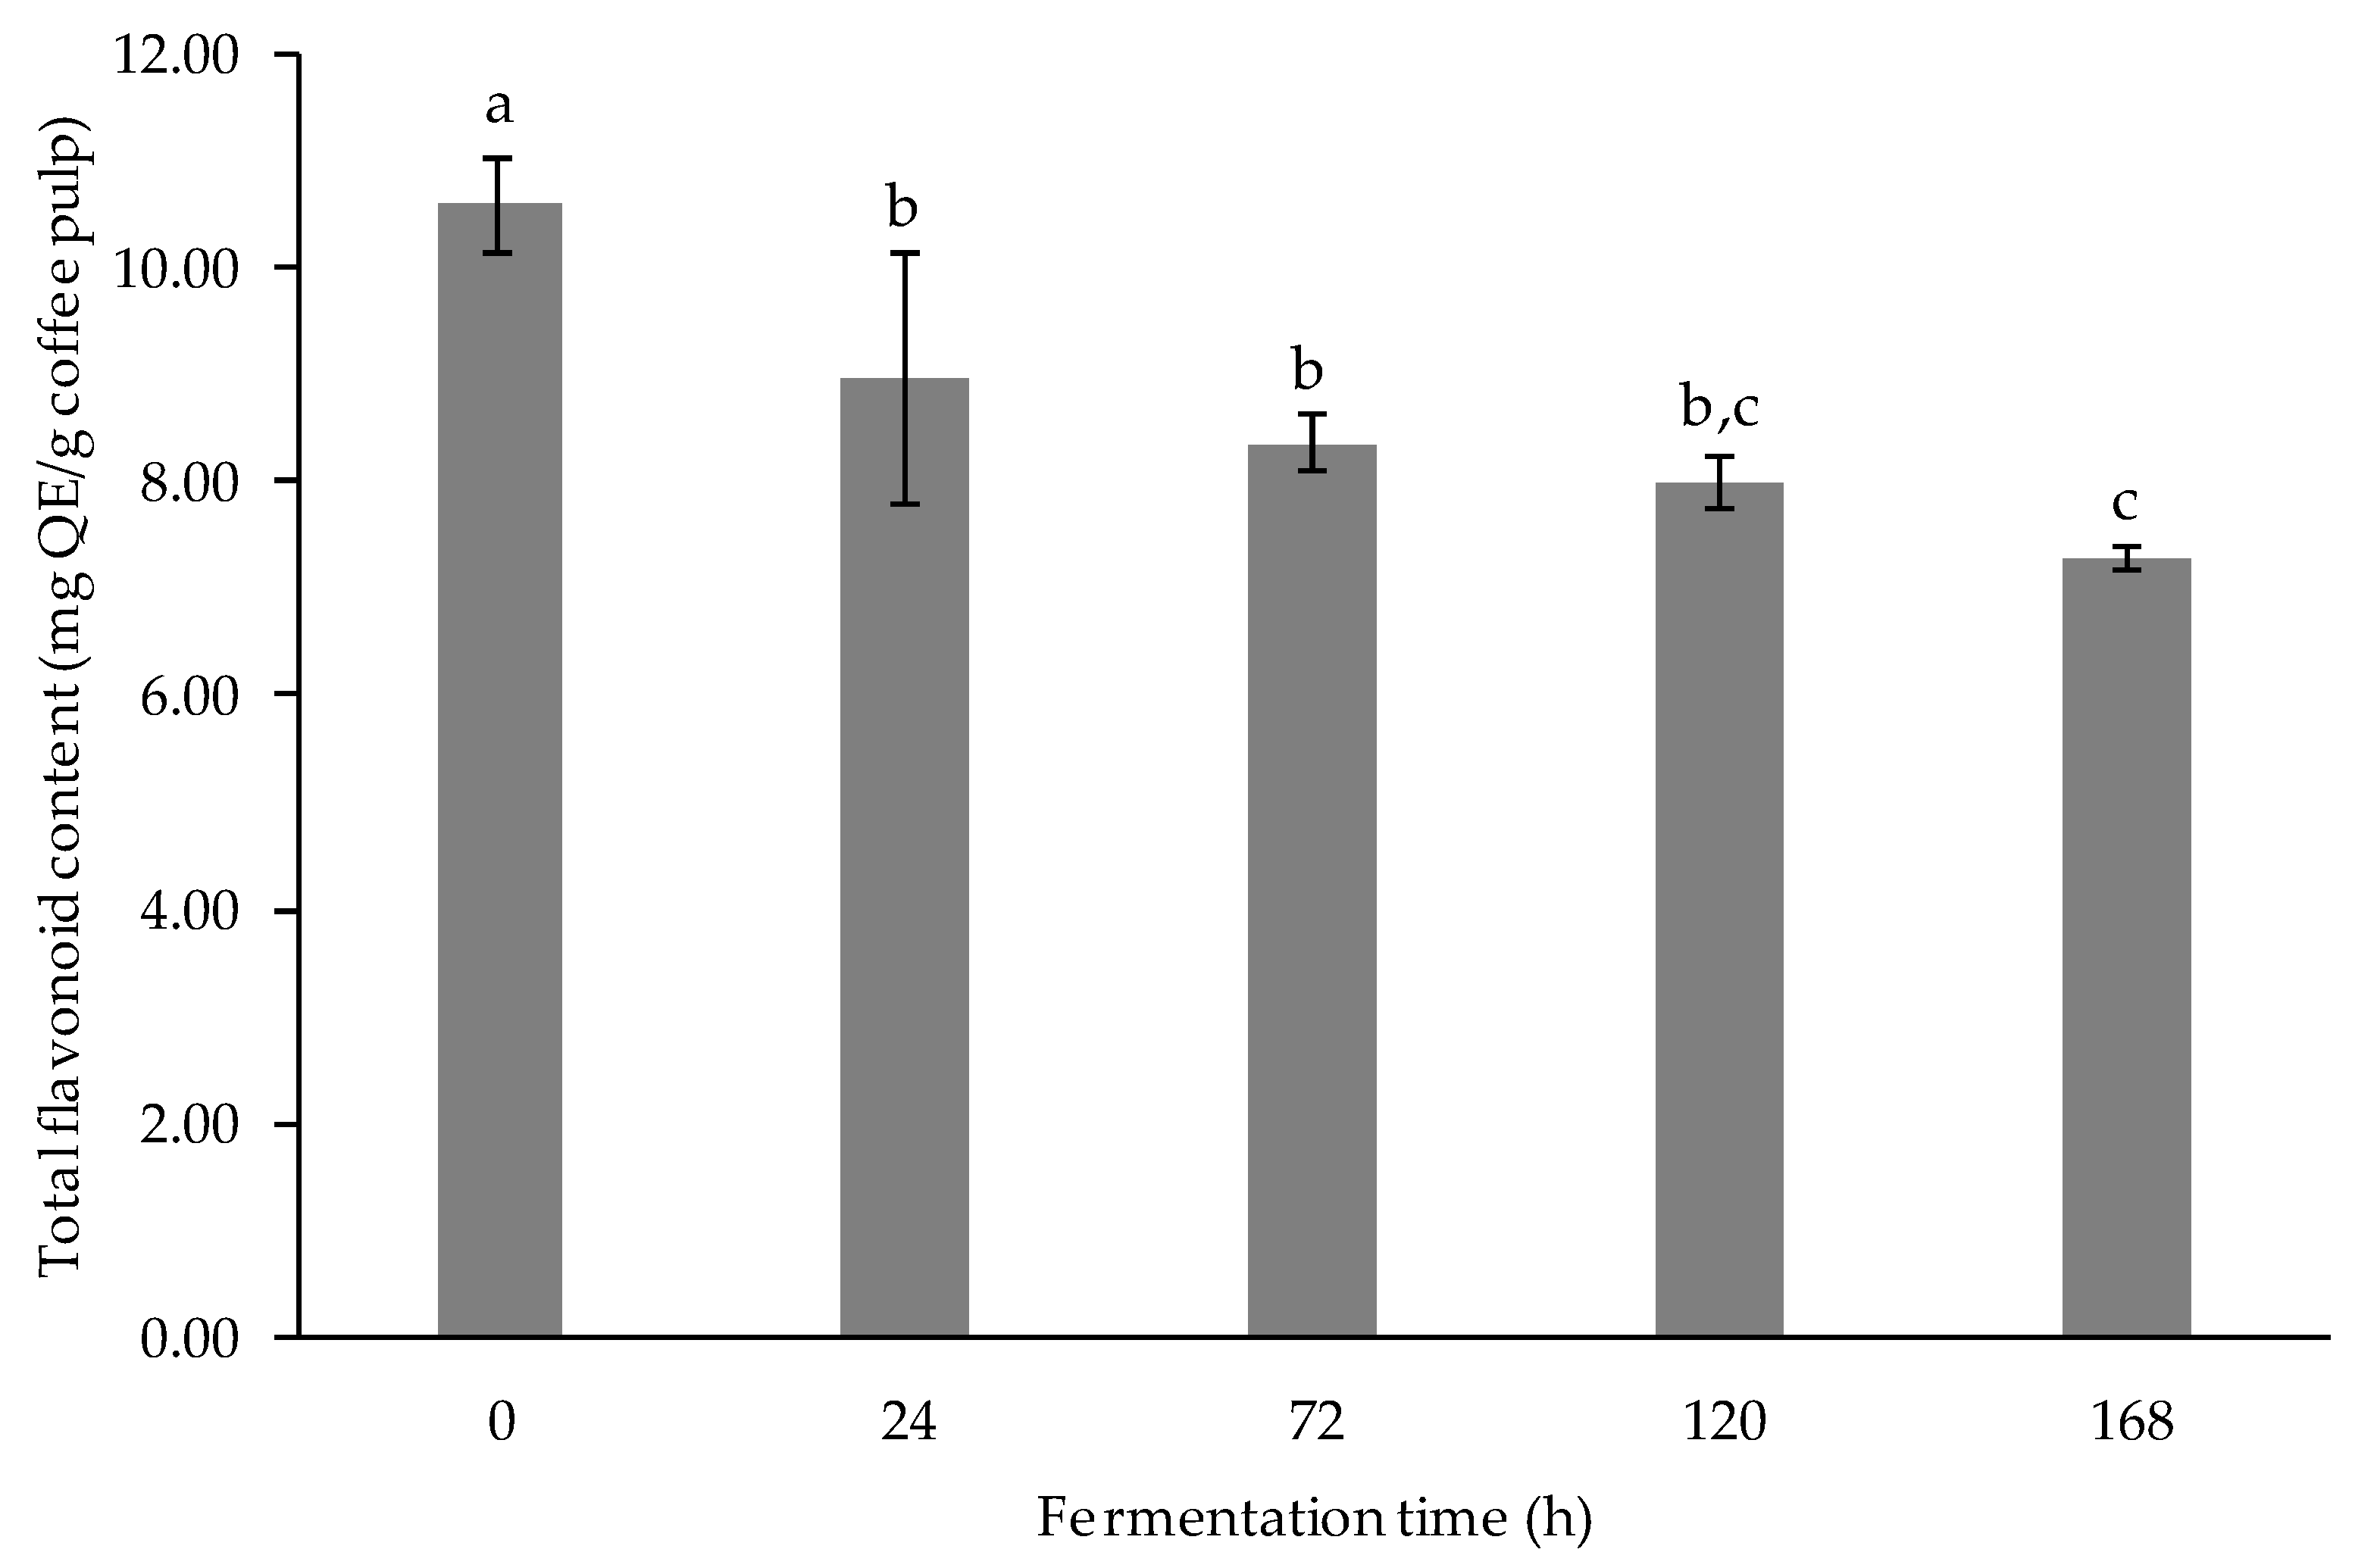
3.2.3. Determination of Total Flavonoid Content

Flavonoids contribute to nearly two-thirds of phenolic compounds; most of them are glycosides, some are esters, and rarely are they free compounds. The radical scavenging capacity of flavonoids is directly affected by glycosylation. Glycosides are less active than aglycone [15]. The result of total flavonoid content is presented in Figure 4. Initially, the coffee pulp extract exhibited a 10.59 ± 0.44 mg QE/ g sample of total flavonoid content. The flavonoid content of the samples decreased gradually (p < 0.05) after 24-, 72-, 120-, and 168-h of fermentation. There was no statistical significance between the flavonoid content after 24-, 72-, and 120-h fermentation. However, the flavonoid content of the fermented coffee pulp after 168-h fermentation process significantly decreased compared to 24 and 72 h. In this study, there was a significant decrease in total flavonoid contents of the fermented samples in response to fermentation time. This result is supported by Wijayanti and Setiawan [35], who found that the total flavonoid content of fig fruit decreased after fermentation with L. acidophillus, L. bulgaricus, L. casei, and L. plantarum. The available glucose in the extract might be consumed by LAB to produce highly hydroxylated free aglycones or hydroxyl groups with lower steric hindrance [36]. It led to the production of higher antioxidant metabolites. The sample concentration or the duration of the fermentation process is responsible for this significant reduction in total flavonoid content, as reported by Adetuyi and Ibrahim [37].

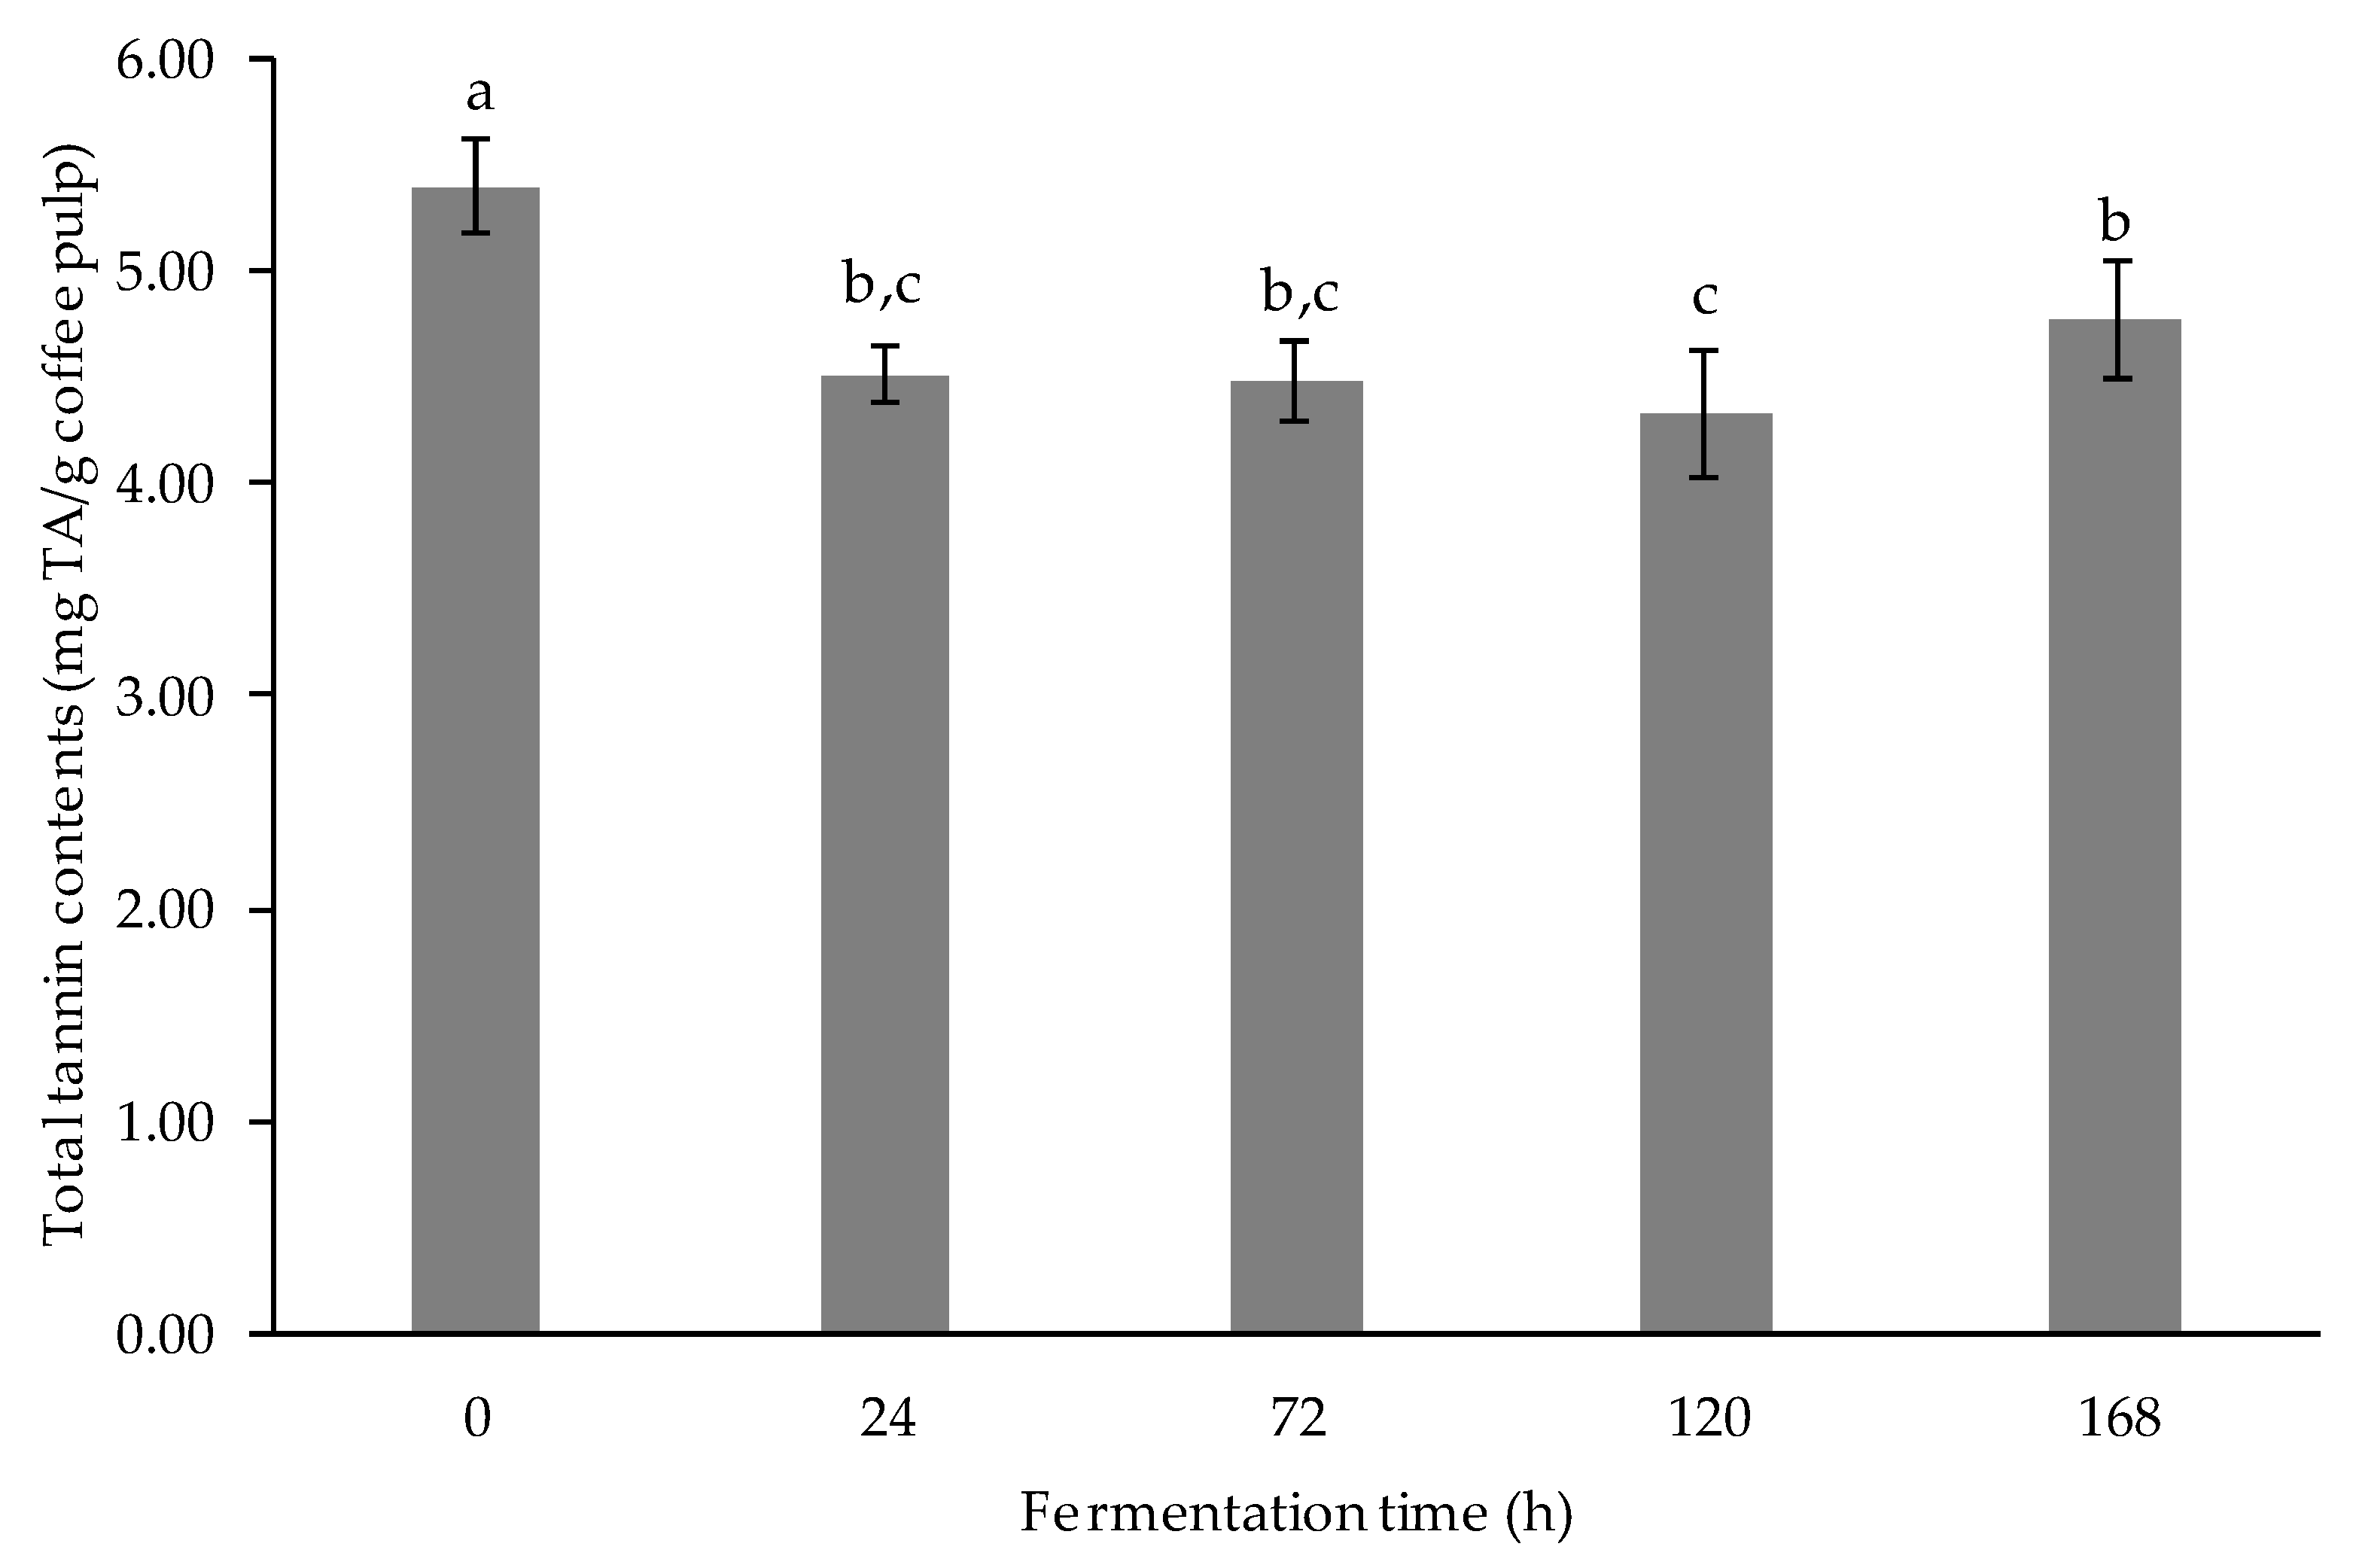
3.2.4. Determination of Tannin Content

The results of the tannin content of the extract are demonstrated in Figure 5. A significant difference was found in the total tannin content of fermented coffee pulp extract over fermentation time (p < 0.05). The lowest tannin content was seen after 120-h fermentation. The tannin content decreased steadily to the lowest point after 120-h fermentation and then slightly increased after 168-h fermentation. The overall result showed that tannin content greatly decreased during LAB-mediated fermentation. This result is supported by Shang et al., in 2019 [38], who found that LAB-mediated fermentation of Xuan Mugua fruit significantly decreased tannin contents as most of the contents were decomposed into smaller structures, such as catechin, gallic acid, etc., by the action of LAB. The possible mechanism of the action of LAB was explained by Landete et al. [39], in that ester bonds were hydrolyzed by tannase produced by L. plantarum, resulting in a decrease in tannin content.

3.2.5. Antioxidant Activities

The antioxidant activities of the fermented coffee pulp by LAB were assessed by using the DPPH assay, ABTS assay, and the FRAP assay as they are easy and accurate methods that can provide fast and reproducible results [40]. The results of antioxidant assays (DPPH, ABTS, and ferrous reducing activity) of the extracts are presented in Table 5. Regarding DPPH assay, the highest value was found after 24-h fermentation (4.57 ± 0.25 mg TE/g sample). After it reached its peak at 24-h fermentation, it gradually decreased after 72-h fermentation, and the DPPH radical scavenging ability returned to its initial value after 168 h. This result is in agreement with earlier reports [34,41,42]. In the ABTS assay, the maximum value was found after 24-h and 72-h fermentation (4.91 ± 0.08 and 4.91 ± 0.40 mg TE/g sample), respectively, while the minimum value was seen after 168-h fermentation (3.59 ± 0.08 mg TE/g sample). The increase of the ABTS assay is in accordance with the DPPH assay. This result is in agreement with Li et al. [36], who stated that the fermented apple juice using L. plantarum exhibited a significant increase in percentage of DPPH and ABTS inhibition after 24-, 48-, and 72-h fermentation. In the FRAP assay, there was a significant increase in the reducing power (p < 0.05) of the fermented coffee pulp with increased fermentation time. The reducing power reached the highest value after 24-h and 72-h fermentation (9.09 ± 0.13 and 8.64 ± 0.14 mg FeSO4/g sample), respectively. This result is supported by Adetuyi and Ibrahim [37], who found that the reducing capacity of okra seeds increased significantly at 24-h fermentation and then decreased as the fermentation time increased. The overall antioxidant activities revealed that the highest activity value was found at 24-h fermentation in all the assays, and the trends in the reducing power and antioxidant activities of the fermented coffee pulp extract were consistent with the changes in bioactive compounds of the extract. These findings are supported by References [37,43], in which, during fermentation, antioxidant activities increased as the structure of the phenolic compounds was broken down by microorganisms, and the resultant free compounds acted as antioxidants.

3.2.6. Determination of Bioactive Compounds by LC-QQQ

Bioactive compounds of the fermented coffee pulp were quantified using LC-QQQ. The phenolic acids, flavonoids, and alkaloid compounds of the coffee pulp extracts are presented in Table 6. The most abundant phenolic and alkaloid compounds in the fermented coffee pulp extracts are chlorogenic acid and caffeine, respectively. Caffeine, theobromine, and trigonelline are the major alkaloids found in coffee [44]. The result shows that caffeine and theobromine content in coffee pulp extract exhibited no statistically significant difference in the fermentation times (p ≥ 0.05); however, a statistically significant decrease of trigonelline content was seen in the extract as the fermentation time increased (p < 0.05). The lowest trigonelline value was observed after 120-h fermentation. Sandhya et al. [25] reported that the fermentation treatment significantly affected trigonelline content in cocoa bean, which was found to decrease during the fermentation of all the treatments.
In terms of phenolic compounds, a significant difference was observed in the fermented coffee pulp in terms of chlorogenic acid and protocatechuic acid content in the extract when there was increase in the fermentation time (p < 0.05). The chlorogenic acid content in the extract did not show a significant difference at initial and after 24-h fermentation. The content decreased serially and significantly at 72-h, 120-h, and 168-h fermentation (p < 0.05). The protocatechuic acid content in the extract increased significantly (p < 0.05) at 24-h fermentation. Subsequently, it decreased significantly after 120-h fermentation compared with the initial content. Moreover, there was an increase in % change of caffeic acid at 24-h fermentation and gallic acid at 72-h fermentation from the initial value. These findings are in accordance with the decrease in chlorogenic acid and tannin contents. The possible mechanism of these findings was explained by Muñoz et al. [15] that L. plantarum could produce broad range esterase enzymes (esterase, tannase) that could catalyze the conversion of chlorogenic acid to caffeic acid, as well as the conversion of tannin to gallic acid, respectively. For flavonoids, there was a decrease in % change of quercetin-3-O-rutinoside which was glycoside throughout the fermentation as compared to the initial value, while there was an increasing trend in % change of 4′,5,7-trihydroxyflavone which was aglycone after 72-h fermentation as compared to the initial value. This result is confirmed by our previous result related to the total flavonoid content. As glycosides are less active than aglycone [15], an increase in 4′,5,7-trihydroxyflavone will cause higher antioxidant activity, and these findings are consistent with an increase in antioxidant activity in all assays.
Optimum fermentation time was investigated based on the highest bacterial growth, phenolic content, antioxidant activity, and bioactive compounds by LC-QQQ. In all parameters except bioactive compounds by LC-QQQ, the highest values were presented at 24- and 72-h fermentation. However, their values were not significantly different in most of the parameters. The highest amount of phenolic compounds determined by LC-QQQ was found at 24-h fermentation.

4. Conclusions

A systematic study using 23 factorial designs in CRD has been conducted to investigate the factors affecting the biotransformation process of coffee pulp and the changes observed in the bioactive compounds and antioxidant properties of the coffee pulp after the biotransformation process. L. plantarum TISTR 543 was used as a starter for the fermentation of coffee pulp extract. At optimal time of fermentation (24–72 h), phenolic content and antioxidant activities of the bacteria fermented coffee pulp extract significantly increased compared with that of the initial value. Hence, we can conclude that the fermentation of coffee pulp with L. plantarum TISTR 543 can produce higher bioactive compounds that could yield higher antioxidant activities to be used as functional food, dietary supplements, or active ingredients in cosmetic applications, such as fermented cascara beverage, natural mouthwash, and anti-aging products. The researcher hopes to apply the results of this research to develop a key ingredient in cosmetic products and functional foods to obtain important substances with higher biological activity and to reduce the use of chemicals and energy. In addition, the researcher hopes to develop the production process of important cosmetic substances that are environmentally friendly.

Author Contributions

Conceptualization, N.K.-U.; methodology, H.M. and N.K.-U.; formal analysis, N.K.-U.; investigation, H.M. and N.K.-U.; writing—original draft preparation, H.M.; writing—review and editing, N.K.-U. and N.N.; project administration, H.M., N.K.-U. and N.N.; funding acquisition, N.K.-U. All authors have read and agreed to the published version of the manuscript.

Funding

This research was funded by Mae Fah Luang University (Chiang Rai, Thailand) with grant no. 641A02004. This research was also partially supported by the funding for the graduate research assistantships from Reinventing University Program 2021.

Institutional Review Board Statement

Not applicable.

Informed Consent Statement

Not applicable.

Data Availability Statement

Not applicable.

Acknowledgments

All the authors gratefully acknowledge Mae Fah Luang University and Reinventing University Program 2021 for the financial support. NK would like to thank Punyawatt Pintathong, Thiwanya Choeisoongneen, and Manee Saelee for their guidance. The authors acknowledge Tea and Coffee Institute of Mae Fah Luang University for communication between researchers and coffee farmers and all laboratory staff members at Scientific & Technological Instruments Center, Mae Fah Luang University for laboratory support.

Conflicts of Interest

The authors declare no conflict of interest.

References

  1. Adam, A.; Hakim, M.N.; Oktaviani, L.; Inderaja, B.M.; Manurung, R.; Putra, R.-a.E.; Abduh, M.Y. Techno-economic evaluation for integrated cultivation of coffee and stingless bees in West Java, Indonesia: Integrated cultivation of coffee and stingless bees. Biol. Nat. Resour. Environ. J. 2020, 3, 28–36. [Google Scholar] [CrossRef]
  2. Gamonal, L.E.; Vallejos-Torres, G.; López, L.A. Sensory analysis of four cultivars of coffee (Coffea arabica L.), grown at different altitudes in the San Martin region—Peru. Cienc. Rural. 2017, 47. [Google Scholar] [CrossRef] [Green Version]
  3. Murthy, P.S.; Madhava Naidu, M. Sustainable management of coffee industry by-products and value addition—A review. Resour. Conserv. Recycl. 2012, 66, 45–58. [Google Scholar] [CrossRef]
  4. Bakker, R.R.C. Availability of Lignocellulosic Feedstocks for Lactic Acid Production—Feedstock Availability, Lactic Acid Production Potential and Selection Criteria; Wageningen UR Food & Biobased Research: Wageningen, The Netherlands, 2013. [Google Scholar]
  5. Menezes, E.G.; do Carmo, J.R.; Alves, J.G.; Menezes, A.G.; Guimaraes, I.C.; Queiroz, F.; Pimenta, C.J. Optimization of alkaline pretreatment of coffee pulp for production of bioethanol. Biotechnol. Prog. 2014, 30, 451–462. [Google Scholar] [CrossRef]
  6. Corro, G.; Paniagua, L.; Pal, U.; Bañuelos, F.; Rosas, M. Generation of biogas from coffee-pulp and cow-dung co-digestion: Infrared studies of postcombustion emissions. Energy. Convers. Manag. 2013, 74, 471–481. [Google Scholar] [CrossRef]
  7. Pandey, A.; Soccol, C.R.; Nigam, P.; Brand, D.; Mohan, R.; Roussos, S. Biotechnological potential of coffee pulp and coffee husk for bioprocesses. Biochem. Eng. J. 2000, 6, 153–162. [Google Scholar] [CrossRef]
  8. Heeger, A.; Kosińska-Cagnazzo, A.; Cantergiani, E.; Andlauer, W. Bioactives of coffee cherry pulp and its utilisation for production of Cascara beverage. Food Chem. 2017, 221, 969–975. [Google Scholar] [CrossRef]
  9. Bonilla-Hermosa, V.A.; Duarte, W.F.; Schwan, R.F. Utilization of coffee by-products obtained from semi-washed process for production of value-added compounds. Bioresour. Technol. 2014, 166, 142–150. [Google Scholar] [CrossRef]
  10. Rodriguez-Duran, L.V.; Ramirez-Coronel, M.A.; Aranda-Delgado, E.; Nampoothiri, K.M.; Favela-Torres, E.; Aguilar, C.N.; Saucedo-Castaneda, G. Soluble and bound hydroxycinnamates in coffee pulp (Coffea arabica) from seven cultivars at three ripening stages. J. Agric. Food Chem. 2014, 62, 7869–7876. [Google Scholar] [CrossRef]
  11. Ramirez-Coronel, M.A.; Marnet, N.; Kolli, V.S.; Roussos, S.; Guyot, S.; Augur, C. Characterization and estimation of proanthocyanidins and other phenolics in coffee pulp (Coffea arabica) by thiolysis-high-performance liquid chromatography. J. Agric. Food Chem. 2004, 52, 1344–1349. [Google Scholar] [CrossRef]
  12. Matsui, T.; Ueda, T.; Oki, T.; Sugita, K.; Terahara, N.; Matsumoto, K. α-Glucosidase inhibitory action of natural acylated anthocyanins. 1. Survey of natural pigments with potent inhibitory activity. J. Agric. Food Chem. 2001, 49, 1948–1951. [Google Scholar] [CrossRef]
  13. Collins, A.M.; Kennedy, M.J. Biotransformations and bioconversions in New Zealand: Past endeavours and future potential. Australas. Biotechnol. 1999, 9, 86–94. [Google Scholar]
  14. Rodríguez, H.; Curiel, J.A.; Landete, J.M.; de las Rivas, B.; de Felipe, F.L.; Gómez-Cordovés, C.; Mancheño, J.M.; Muñoz, R. Food phenolics and lactic acid bacteria. Int. J. Food Microbiol. 2009, 132, 79–90. [Google Scholar] [CrossRef] [PubMed] [Green Version]
  15. Muñoz, R.; de las Rivas, B.; López de Felipe, F.; Reverón, I.; Santamaría, L.; Esteban-Torres, M.; Curiel, J.A.; Rodríguez, H.; Landete, J.M. Biotransformation of phenolics by Lactobacillus plantarum in fermented foods. In Fermented Foods in Health and Disease Prevention; Frias, J., Martinez-Villaluenga, C., Peñas, E., Eds.; Academic Press: Boston, MA, USA, 2017; Chapter 4; pp. 63–83. [Google Scholar]
  16. Rodríguez, H.; Landete, J.M.; Rivas, B.d.l.; Muñoz, R. Metabolism of food phenolic acids by Lactobacillus plantarum CECT 748T. Food Chem. 2008, 107, 1393–1398. [Google Scholar] [CrossRef] [Green Version]
  17. Darby, T.M.; Jones, R.M. Beneficial influences of Lactobacillus plantarum on human health and disease. In The Microbiota in Gastrointestinal Pathophysiology; Floch, M.H., Ringel, Y., Allan, W., Eds.; Academic Press: Boston, MA, USA, 2017; pp. 109–117. [Google Scholar]
  18. Saelee, M.; Sivamaruthi, B.S.; Sirilun, S.; Sirithunyalug, J.; Peerajan, S.; Chaiyasut, C. The influence of pasteurization and starter culture on methanol content and bio-profile of fermented Morinda citrifolia linn. (noni) fruit juice. Food Sci. Technol. 2020, 40, 621–628. [Google Scholar] [CrossRef] [Green Version]
  19. Haile, M.; Kang, W.H. Antioxidant activity, total polyphenol, flavonoid and tannin contents of fermented green coffee beans with selected yeasts. Fermentation 2019, 5, 29. [Google Scholar] [CrossRef] [Green Version]
  20. Peerajan, S.; Chaiyasut, C.; Sirilun, S.; Chaiyasut, K.; Kesika, P.; Sivamaruthi, B.S. Enrichment of nutritional value of Phyllanthus emblica fruit juice using the probiotic bacterium, Lactobacillus paracasei HII01 mediated fermentation. Food Sci. Technol. 2016, 36, 116–123. [Google Scholar] [CrossRef] [Green Version]
  21. Saftić, L.; Peršurić, Ž.; Kraljević Pavelić, S. LC-QQQ and LC-QTOF MS methods for comprehensive detection of potential allergens in various propolis extracts. Eur. Food Res. Technol. 2019, 245, 1981–1995. [Google Scholar] [CrossRef]
  22. Pandis, N.; Walsh, T.; Polychronopoulou, A.; Katsaros, C.; Eliades, T. Factorial designs: An overview with applications to orthodontic clinical trials. Eur. J. Orthod. 2013, 36, 314–320. [Google Scholar] [CrossRef] [Green Version]
  23. Filannino, P.; Bai, Y.; Di Cagno, R.; Gobbetti, M.; Gänzle, M.G. Metabolism of phenolic compounds by Lactobacillus spp. during fermentation of cherry juice and broccoli puree. Food Microbiol. 2015, 46, 272–279. [Google Scholar] [CrossRef]
  24. Starzyńska-Janiszewska, A.; Stodolak, B. Effect of inoculated lactic acid fermentation on antinutritional and antiradical properties of grass pea (Lathyrus Sativus ‘Krab’) flour. Pol. J. Food Nutr. Sci. 2011, 61, 245–249. [Google Scholar] [CrossRef] [Green Version]
  25. Sandhya, M.V.S.; Yallappa, B.S.; Varadaraj, M.C.; Puranaik, J.; Rao, L.J.; Janardhan, P.; Murthy, P.S. Inoculum of the starter consortia and interactive metabolic process in enhancing quality of cocoa bean (Theobroma cacao) fermentation. LWT Food Sci. Technol. 2016, 65, 731–738. [Google Scholar] [CrossRef]
  26. Sripo, K.; Phianmongkhol, A.; Wirjantoro, T.I. Effect of inoculum levels and final pH values on the antioxidant properties of black glutinous rice solution fermented by Lactobacillus bulgaricus. Int. Food Res. J. 2016, 23, 2207–2213. [Google Scholar]
  27. Zubaidah, E.; Arum, S.M.; Widyaningsih, D.T.; Rahayu, P.A. Sauerkraut with the addition of Lactobacillus casei: Effects of salt and sugar concentrations on fermentation and antioxidant activity. Curr. Nutr. Food Sci. 2020, 16, 1265–1269. [Google Scholar] [CrossRef]
  28. Dewi, E.; Septiningrum, S.; Rianingsih, L.; Riyadi, P. Optimization of carbon source and concentration for Lactobacillus acidophilus growth, phenolic production and antioxidant activity in fermented seaweed extract. Int. J. Emerg. Technol. 2020, 11, 495–500. [Google Scholar]
  29. Kaprasob, R.; Kerdchoechuen, O.; Laohakunjit, N.; Thumthanaruk, B.; Shetty, K. Changes in physico-chemical, astringency, volatile compounds and antioxidant activity of fresh and concentrated cashew apple juice fermented with Lactobacillus plantarum. J. Food Sci. Technol. 2018, 55, 3979–3990. [Google Scholar] [CrossRef] [PubMed]
  30. Thongruck, K.; Saelao, S.; Sumpavapo, P.; Benjaku, S.; Maneerat, S. Monitoring of changes in lactic acid bacteria during production of Thai traditional fermented shrimp (Kung-Som) by culturing method and PCR-DGGE technique. Songklanakarin J. Sci. Technol. 2017, 39, 41–47. [Google Scholar]
  31. Ernanin Dyah, W.; Nur Candra Eka, S.; Jean Patricia, C. Effect of lactic acid fermentation on total phenolic content and antioxidant activity of fig fruit juice (Ficus carica). In Proceedings of the Health Science International Conference (HSIC 2017), Faculty of Health Science, University of Muhammadiyah Malang, Kota Malang, Indonesia, 4–5 October 2017; pp. 282–289. [Google Scholar]
  32. Escudero-Lopez, B.; Cerrillo, I.; Herrero-Martin, G.; Hornero-Mendez, D.; Gil-Izquierdo, A.; Medina, S.; Ferreres, F.; Berna, G.; Martin, F.; Fernandez-Pachon, M.S. Fermented orange juice: Source of higher carotenoid and flavanone contents. J. Agric. Food Chem. 2013, 61, 8773–8782. [Google Scholar] [CrossRef]
  33. Hernandez, T.; Estrella, I.; Perez-Gordo, M.; Alegria, E.G.; Tenorio, C.; Ruiz-Larrrea, F.; Moreno-Arribas, M.V. Contribution of malolactic fermentation by Oenococcus oeni and Lactobacillus plantarum to the changes in the nonanthocyanin polyphenolic composition of red wine. J. Agric. Food Chem. 2007, 55, 5260–5266. [Google Scholar] [CrossRef]
  34. Zubaidah, E.; Susanti, I.; Yuwono, S.; Rahayu, A.P.; Srianta, I.; Blanc, P. Effect of Lactobacillus plantarum and Leuconostoc mesenteroides starter cultures in lower salt concentration fermentation on the sauerkraut quality. Food Res. 2020, 4, 1038–1044. [Google Scholar] [CrossRef]
  35. Wijayanti, E.D.; Setiawan, N.C.E. The effect of lactic acid fermentation on fig (Ficus carica) fruit flavonoid. Berk. Penelit. Hayati 2017, 23. [Google Scholar] [CrossRef]
  36. Li, Z.; Teng, J.; Lyu, Y.; Hu, X.; Zhao, Y.; Wang, M. Enhanced antioxidant activity for apple juice fermented with Lactobacillus plantarum ATCC14917. Molecules 2018, 24, 51. [Google Scholar] [CrossRef] [Green Version]
  37. Adetuyi, F.O.; Ibrahim, T.A. Effect of fermentation time on the phenolic, flavonoid and vitamin C contents and antioxidant activities of okra (Abelmoschus esculentus) seeds. Niger. Food J. 2014, 32, 128–137. [Google Scholar] [CrossRef] [Green Version]
  38. Shang, Y.F.; Cao, H.; Ma, Y.L.; Zhang, C.; Ma, F.; Wang, C.X.; Ni, X.L.; Lee, W.J.; Wei, Z.J. Effect of lactic acid bacteria fermentation on tannins removal in Xuan Mugua fruits. Food Chem. 2019, 274, 118–122. [Google Scholar] [CrossRef] [PubMed]
  39. Landete, J.M.; Rodriguez, H.; De las Rivas, B.; Munoz, R. High-added-value antioxidants obtained from the degradation of wine phenolics by Lactobacillus plantarum. J. Food Prot. 2007, 70, 2670–2675. [Google Scholar] [CrossRef]
  40. Amorati, R.; Valgimigli, L. Advantages and limitations of common testing methods for antioxidants. Free Radic. Res. 2015, 49, 633–649. [Google Scholar] [CrossRef]
  41. Sawangwan, T.; Porncharoennop, C.; Nimraksa, H. Antioxidant compounds from rice bran fermentation by lactic acid bacteria. AIMS Agric. Food. 2021, 6, 578–587. [Google Scholar] [CrossRef]
  42. Ryu, J.Y.; Kang, H.R.; Cho, S.K. Changes over the fermentation period in phenolic compounds and antioxidant and anticancer activities of blueberries fermented by Lactobacillus plantarum. J. Food Sci. 2019, 84, 2347–2356. [Google Scholar] [CrossRef]
  43. Adebo, O.A.; Gabriela Medina-Meza, I. Impact of fermentation on the phenolic compounds and antioxidant activity of whole cereal grains: A mini review. Molecules 2020, 25, 927. [Google Scholar] [CrossRef] [Green Version]
  44. Ashihara, H. Metabolism of alkaloids in coffee plants. Braz. J. Plant Physiol. 2006, 18, 1–8. [Google Scholar] [CrossRef]
Figure 1. Total phenolic content after 24 h of biotransformation process obtained from 8 standard conditions of 23 factorial designs in CRD. Values are represented as Mean ± SD (n = 3). The bars with different letters indicate a significant difference (p < 0.05) among the conditions.
Fermentation 07 00292 g001
Figure 2. Changes in pH and bacterial count of fermented coffee pulp: (a) pH of fermented coffee pulp; (b) total count of cultured LAB of fermented coffee pulp. Values are represented as Mean ± SD (n = 3). The bars with different letters indicate a significant difference (p < 0.05) in the fermentation times.
Fermentation 07 00292 g002
Figure 3. Total phenolic content (mgGAE/g coffee pulp) of fermented coffee pulp. Values are represented as Mean ± SD (n = 3). The bars with different letters indicate a significant difference (p < 0.05) in the fermentation times.
Fermentation 07 00292 g003
Figure 4. Total flavonoid content (mg QE/g coffee pulp) of fermented coffee pulp. Values are represented as Mean ± SD (n = 3). The bars with different letters indicate a significant difference (p < 0.05) in the fermentation times.
Fermentation 07 00292 g004
Figure 5. Total tannin contents (mgTA/g coffee pulp) of fermented coffee pulp. Values are represented as Mean ± SD (n = 3). The bars with different letters indicate a significant difference (p < 0.05) in the fermentation times.
Fermentation 07 00292 g005
Table 1. The actual and coded levels used in 23 factorial designs in CRD.
FactorsCodeUnitCoded Levels
(−1)(+1)
Substrate ratio of substrate per 10 parts of waterX137
Sugar ratio of sugar per 10 parts of waterX213
StarterX3%515
Table 2. The experimental layouts of 23 factorial designs in CRD.
Standard No.Run No.X1: Substrate Ratio of Substrate per 10 Parts of WaterX2: Sugar Ratio of Sugar per 10 Parts of WaterX3: Starter (%)
14−1−1−1
211−1−1
36−11−1
4211−1
53−1−11
671−11
78−111
85111
Table 3. LC-QQQ parameters of bioactive compounds for the analysis of the fermented coffee pulp sample.
Bioactive
Compounds
Retention Time
(RT, min)
Ionization Mode of the AnalytesPrecursor Ion
(m/z, [M − H])
Product Ion
(m/z)
Phenolic acids
Protocatechuic acid2.627Negative153.25109.05
Chlorogenic acid3.710Negative352.95191.05
Neochlorogenic acid2.547Negative352.95191.05
Caffeic acid4.566Negative178.80135.20
Gallic acid1.639Negative169.10125.20
o-Coumaric acid5.864Negative163.00119.00
p-Coumaric acid5.529Negative162.85119.00
p-hydroxybenzoic acid6.263Negative137.0592.95
Flavonoids
Quercetin-3-O-rutinoside5.487Negative609.05300.20, 271.10
4′,5,7-trihydroxyflavone6.279Negative269.10117.00
Alkaloids
Caffeine3.617Positive195.00138.15, 110.10
Trigonelline0.917Positive138.1092.10, 94.05, 78.05
Theobromine1.763Positive181.10163.10, 138.10, 110.05
Table 4. Analysis of variance (ANOVA) for the experimental results of 23 factorial designs in CRD design.
VariablesType III Sum of SquaresdfMean SquareF-Valuep-Value
Corrected Model15.68272.240358.897<0.001 *
Intercept1.959192.12314,758.693<0.001 *
A: Substrate−0.707111.9961921.813<0.001 *
B: Sugar0.308 12.273364.133<0.001 *
C: Starter −0.10510.26542.456<0.001 *
AB−0.20911.046167.503<0.001 *
AC0.00710.0010.2090.654
BC0.01810.0071.1900.291
ABC0.06210.09314.9760.001 *
Error0.100160.006
Total107.90524
Corrected Total15.78123
R-Squared0.994
Adj. R-Squared0.991
* indicates a statistically significance (p < 0.05).
Table 5. The antioxidant activities of fermented coffee pulp at different fermentation times.
Fermentation Time (h)DPPH
(mg TE/g Sample)
ABTS
(mg TE/g Sample)
FRAP
(mg FeSO4/g Sample)
03.51 ± 0.68 a3.99 ± 0.10 a6.89 ± 0.45 a
244.57 ± 0.25 b4.91 ± 0.08 b9.09 ± 0.13 b
724.35 ± 0.36 b,c4.91 ± 0.40 b8.64 ± 0.14 b,c
1204.16 ± 0.33 a,b,c3.79 ± 0.14 a,c7.72 ± 0.31 d
1683.65 ± 0.10 a,c3.59 ± 0.08 c7.88 ± 0.78 c,d
Values are represented as Mean ± SD (n = 3). Values within the same column with different superscript letters indicate the statistically significant difference (p < 0.05).
Table 6. The amount and change percentage of bioactive compounds obtained in the coffee pulp after the fermentation process.
CompoundsFermented Coffee Pulp (g/mL)% Change from the Initial
0 h24 h72 h120 h168 h24 h72 h120 h168 h
Phenolic acids
Protocatechuic acid1.17 ± 0.05 a1.34 ± 0.04 b1.12 ± 0.07 a,c1.01 ± 0.09 c1.00 ± 0.12 c17.68%−4.98%−15.34%−16.59%
Chlorogenic acid12.81 ± 0.22 a12.73 ± 0.03 a11.71 ± 0.04 b11.29 ± 0.12 c10.70 ± 0.04 d−0.58%−8.49%−11.73%−6.31%
Neochlorogenic acidN.A.N.A.N.A.N.A.N.A.−9.21%−12.51%−10.12%−12.56%
Caffeic acidN.D.N.D.N.D.N.D.N.D.25.25%−32.19%−42.50%−4.60%
Gallic acidN.D.N.D.N.D.N.D.N.D.−2.75%40.81%v22.12%29.42%
o-Coumaric acidN.D.N.D.N.D.N.D.N.D.17.67%77.16%18.11%26.82%
p-Coumaric acidN.D.N.D.N.D.N.D.N.D.47.14%−28.45%−3.32%2.97%
p-hydroxybenzoic acidN.A.N.A.N.A.N.A.N.A.54.68%−82.24%−28.77%−26.74%
Flavonoids
Quercetin-3-O-rutinosideN.A.N.A.N.A.N.A.N.A.−3.57%−27.86%−16.52%−16.29%
4′,5,7-trihydroxyflavoneN.A.N.A.N.A.N.A.N.A.−24.23%4.87%36.43%61.77%
Alkaloids
Caffeine96.50 ± 0.50 ns94.50 ± 1.32 ns95.67 ± 1.61 ns95.33 ± 0.29 ns94.17 ± 0.29 ns−2.22%−1.14%−1.37%−2.49%
Trigonelline65.00 ± 1.73 a65.33 ± 0.58 a62.67 ± 2.31 a,c58.67 ± 1.53 b60.00 ± 1.00 b,c−4.69%−7.39%−8.95%−7.38%
Theobromine1.52 ± 0.15 ns1.50 ± 0.09 ns1.29 ± 0.09 ns1.39 ± 0.04 ns1.38 ± 0.13 ns−1.34%−13.97%−8.02%−8.25%
Values are represented as Mean ± SD (n = 3). Values within the same row with different superscript letters indicate the statistically significant difference (p < 0.05). ns indicates no significant difference (p ≥ 0.05). N.A. indicates unavailable bioactive standards. N.D. indicates not detectable. The percentage change of the bioactive compounds after fermentation was calculated from their change in peak area compared with the peak area of the initial values.
Publisher’s Note: MDPI stays neutral with regard to jurisdictional claims in published maps and institutional affiliations.

