1. Introduction
It is generally accepted that wine is the result of two biological processes of fermentation—alcoholic and malolactic bioconversions—determined by the microorganisms that develop on grapes during ripening. If in the alcoholic fermentation grape sugars are metabolized by yeasts and transformed into ethanol and carbon dioxide, in the case of malolactic fermentation (MLF), under the action of lactic acid bacteria, L-malic acid of wine is decarboxylated to L-lactic acid, with the production of varying concentrations of secondary fermentation metabolites. Broadly, for each gram of malic acid fermented, 0.67 g of lactic acid and 0.33 g of carbon dioxide are produced [
1].
In winemaking, MLF is one of the most difficult processes to control and can affect the aroma and taste balance of the final product [
2]. Conducted under optimum conditions, MLF showed important effects on wine quality: it reduces acidity and slightly increases the pH, increases the biological stability of the wine by avoiding subsequent uncontrolled fermentations, and changes the aroma and taste of the wine, increasing its complexity [
3,
4].
LAB involved in the winemaking process belongs to the
Lactobacillus,
Leuconostoc, Oenococcus, and
Pediococcus genera, with
Oenococcus oeni and
Lactobacillus plantarum as the most used species for conducting controlled MLF [
4,
5,
6]. The selection of new LAB for starter cultures requires the assessment of many properties related to the new strain including resistance to biotic and abiotic stresses, technological performances, and safety aspects [
7]. After isolation from indigenous microbiota, selection of LAB strains for starter cultures involves various screening procedures, including testing of the malolactic bioconversion yield, the ability of bacteria to produce undesirable or even toxic fermentation by-products (acetic acid, ethyl carbamate, biogenic amines, acetoin or diacetyl, acrolein, mannitol). Screening of LAB strains for wine inoculation also requires testing in synthetic media in order to observe their survival in wine-like conditions and monitoring the consumption of L-malic acid
The use in winemaking of the selected LAB starter cultures have the advantage of a controlled fermentation process, but is also beneficial for the complexity of the aromatic profile. Beside primary aroma of grapes, various flavours are produced during fermentation processes by extracellular enzymes secreted by yeasts and bacteria. In the case of spontaneous MLF, the range of extracellular enzymes is much larger and varied due to the participation of many LAB species. This explains why the wines obtained by spontaneous malolactic fermentation have a much more complex aromatic profile, compared to the wines obtained by monoculture innoculation. Thus, the presence of extracellular enzymes influences the wine aromas, increasing the typicity of wines.
It is known that malolactic bacteria strains showed high phenotypic variability in terms of tolerance to harsh environmental conditions and malolactic activity. The survival and growth of the bacteria are dependent on certain conditions, such as temperature, pH, sulfur dioxide, ethanol, and malic acid levels and the ability to synthesize specific enzymes. Selection of LAB strains for wine inoculation should essentially be based on a high malolactic activity under harsh conditions (low pH, high ethanol, and sulphur dioxide concentrations) [
8,
9]. Generally, microorganisms have an optimal pH range of development. Additionally, pH plays an important role in determining which LAB species will survive and develop [
10]. Moreover, different LAB species exhibited versatile enzymatic activities from acidic to alkaline pH conditions [
11]. Temperature influences the rate of cell growth, the duration of the lag phase, and the final density of the bacterial population [
2,
10]. LAB are mesophilic species with an optimal development at temperatures between 27 and 30 °C [
12,
13].
McKay et al. [
14] showed that sulfur dioxide (SO
2) has a much more inhibitory effect on bacteria than on yeasts. For LAB inhibition, a level of free SO
2 above 10 mg/L and a total SO
2 concentration above 30 mg/L was suggested [
4,
15]. Moreover, ethanol strongly interferes with the growth and metabolic activity of LAB [
2]. The development of LAB and implicitly the MLF dynamics decreased with the increase of the alcoholic concentration of the medium to a maximum of 14.50 % (
v/
v) [
16]. Thus, for wines with alcohol concentration above 14–15% (
v/v), an alcohol tolerant LAB strain should be isolated and used.
Given the importance of the biological factors involved in the MLF process, continuous isolation, selection, and characterization of LAB strains from various vineyards is required, being attested that the most appreciated wines, characterized by a higher typicity, are obtained when the microorganisms used for conducting wine biotechnological processes are isolated and selected from the indigenous microbiota of the respective vineyard. The production of wines using selected wild microorganism strains is a useful tool in improving the quality of wines. Moreover, wild strains of lactic acid bacteria may help to produce modern and new wine styles in a climate change viticultural environment [
17].
Considering that in many wine regions of the world the use of LAB starter cultures to initiate MLF has not yet become a routine practice and that the typicity of the wines can be much amplified by the use of carefully selected LAB strains, the aim of this work was the characterisation and assessment of technological properties of new malolactic bacteria strains isolated from red wine microbiota, in order to determine their potential to be used as starter cultures to induce the malolactic fermentation of wine.
2. Materials and Methods
2.1. Climatic Conditions of the Vineyard
The Iaşi vineyard is located in the northeast of Romania, 47°10’ northern latitude and 27°35’ eastern longitude, presenting favorable conditions for the grapevine growing. The climate is temperate continental with excessive nuances, characterized by large contrasts between seasons, with harsh and dry winters, hot and often droughty summers. The plot was planted at an altitude of 184 m, on a slight slope (3%) with southern exposition; orientation of rows N–S. The climate analysis of the last 20 years indicates an average annual temperature of 10.5 °C, with a maximum value of 11.6 °C in 2019 and a minimum of 9.5 °C in 2001. Grapevines were 15 years old, grafted on the hybrid rootstock Kober 5 BB (Vitis berlandieri Planch. × Vitis riparia Michx.).
2.2. Isolation and Purification of Indigenous LAB Strains
Tested LAB strains were isolated after the alcoholic fermentation of grape must (Fermactive CB
S. cerevisiae, Sodinal, France), from red wines (
V. vinifera L. cultivars: Merlot, Cabernet Sauvignon, Arcaş, Fetească neagră and Pinot noir) undergoing spontaneous malolactic fermentation. Wines were obtained from the 2018 harvest through the classic winemaking technology (grape crushing and destemming). The main physico-chemical parameters of wines were determined according to the Compendium of international methods of wine and must analysis of OIV [
18]. Wine samples were collected aseptically, 1 mL of wine being used to obtain decimal dilutions (10
−1 to 10
−4) in sterile distilled water. The dilutions obtained were inoculated on agarised De Man, Rogosa, Sharpe (MRS) medium [
19], supplemented with 5 g/L malic acid, 1% CaCO
3 (pH 4.5) and 100 mg/L of cycloheximide (to suppress yeast growth) and incubated at 30 °C for 5 days in anaerobiosis (GENbag anaerobic
®; BioMérieux, France).
2.3. Preliminary Selection of LAB Strains
For the preliminary selection of the bacterial isolates, a catalase test was performed by rapid technique (a drop of 3% hydrogen peroxide was added to a loopful LAB culture) and Gram staining. After microscopic examination of strain purity, isolates were preserved in MRS broth supplemented with 30% glycerol at −20 °C [
20].
To define the type of fermentative metabolism of glucose, the production of CO2 was highlighted by growing de LAB isolates in Clark-Lubs broth medium (0.5% peptone, 0.5% dipotassium phosphate, 0.5% glucose; pH 7.5), in test tubes with Durham tubes added prior to sterilization. After inoculation (108 CFU/mL), a layer of mineral oil (liquid paraffin) was added to each test tube. Gas accumulation in tubes after 24 h of incubation at 30 °C was taken as the evidence for CO2 production from glucose.
In order to determine the fermentative capacity of LAB strains, the isolates were inoculated in synthetic wine with 12% (
v/v) ethanol (pH 3.5), at 28 °C, without shaking, at a cell density of 10
8 CFU/mL, after prior acclimation in modified MRS broth with 10% (
v/v) ethanol (pH 4.6), according to the protocol presented by Bravo-Ferrada et al. [
21]. Monitoring of the MLF process was performed by thin layer chromatography (TLC), using cellulose plates 20 × 20 cm (Merck, Germany) and a mixture of solvents as mobile phase: n-butanol: distilled water: acetic acid: bromophenol blue, in a ratio of 100:20:20:0.1 (
v/v/v/w).
2.4. Screening of Extracellular Enzyme Production
LAB strains were screened for extracellular enzymes associated with wine aroma: β-glucosidase, esterase, lipase, protease, and pectinase. For all the tests, LAB cells were grown for 48 h on MRS broth at 30 °C, centrifuged (10 min., 4000 RPM), inoculated by loop on Petri dishes with agarised modified MRS medium and specific substrates, and then incubated at 30 °C for 4–5 days.
β-glucosidase activity was determined on modified MRS (0.5% peptone, 1.0% beef extract, 2% agar) supplemented with 0.25% arbutin (pH 5.6). After autoclaving (15 min., 121 °C), 2 mL of 1% ferric ammonium citrate solution were added to 100 mL medium [
22]. LAB that produced β-glucosidase showed a brown halo around the colonies.
Esterase activity was tested on agarised modified MRS (0.5% peptone, 0.5% beef extract, 0.5% yeast extract, 2% agar) supplemented with 0.01% CaCl
2 and 1.5% Tween 20 as substrate (pH 6.8). LAB with esterase activity formed an opaque halo around the colonies. The assay of
protease activity was performed on agarised modified MRS (0.5% yeast extract, 1.0% glucose, 0.5% NaCl, 2% agar), pH 7.0. A solution of pasteurized skimmed milk (<0.1% fat) diluted 1:1 with sterile distilled water was prepared separately. After sterilization of MRS medium, solutions were mixed and homogenized, distributed in Petri dishes and inoculated. Proteolytic LAB that hydrolyse milk casein showed a clear area around the colonies. The
pectinase activity was tested on modified MRS medium (1.0% glucose, 1.5% agar) with 0.5% apple pectin (pH 7.0). Afterwards, the incubation plates were flooded with a 1% hexadecyltrimethylammonium bromide solution (Sigma-Aldrich, Germany). A clear halo around the colonies indicates the pectinase activity.
Lipase activity was tested on modified MRS agar (0.5% peptone, 0.5% beef extract, 0.5% yeast extract, 2% agar) with 10 mL/L of 0.001% rhodamine B solution and 10 mL/L olive oil as substrate. After incubation (3–5 days, 30 °C), plates were revealed by UV irradiation at λ 365 nm [
23]. A commercial
O. oeni strain, Viniflora Oenos
® (Chr. Hansen, Denmark) was used as control for extracellular enzyme production.
2.5. LAB Strains Identification
Identification of LAB species was performed using the API 50 CH kit (BioMérieux, France), which is a standardized system used to differentiate LAB isolates. The API technique consists in the inoculation of a pure bacterial suspension (McFarland standard no. 2), previously grown on MRS medium, in each of the 49 microtubes on the API 50 CH strip, containing different carbohydrates (hexose, pentoses and others), as well as in the control microtube. All microtubes were covered with sterile mineral oil to achieve anaerobiosis. During incubation (48 h, 37 °C), carbohydrates are fermented to acids, causing the pH to drop, detected by the color change of the indicator, yellow indicating a positive character [
5]. LAB identification was achieved after result patterns were analyzed and compared with the identification table provided.
2.6. Characterisation of Indigenous LAB Strains
The ability of LAB to use citrate as the sole source of carbon was tested on Simmon’s citrate agar medium, with bromthymol blue as the pH indicator and sodium citrate as the source of carbon [
24]. LAB that grows on this medium produced a color change from green (neutral) to blue (alkaline).
In order to highlight the production of acetoin (Voges-Proskauer reaction), LAB strains were grown on Clark-Lubs medium, at a cell density of 108 CFU/mL. After three days of incubation at 28 °C, in 1 mL of the centrifuged medium was added 0.6 mL of 5% α-naphthol (in 96% ethanol) and 0.2 mL of 40% KOH, followed by vigorous stirring. After 15 min at room temperature (20 °C), the appearance of a pink-red color indicated the presence of acetoine.
The
amino acid-decarboxylase test was performed in order to assess the production of biogenic amines through decarboxylation of amino acids by the LAB strains. Bacterial cells were plated on MDA medium (Modified Decarboxylating Agar) [
25], with 4 g/L of each tested amino acid (histidine, arginine, lysine, ornithine, and tyrosine), incubated in anaerobiosis at 28 °C, 48 h, after prior acclimation on MRS broth with 1 g/L malic acid and 2 g/L of each amino acid, at a cell density of 10
9 CFU/mL. The appearance of a purple area around the bacterial colonies indicated the ability of the tested strain to decarboxylate the amino acids.
To evaluate the tolerance of LAB isolates to ethanol, pH, SO
2, malic acid and different temperatures and their malolactic performance in various growth conditions, 100 mL of MRS-TJ broth (MRS with 15% tomato juice), with different pH values (3.0, 3.5, 4.0, 4.5), concentrations of malic acid (2.0, 3.0, 5.0 g/L), total SO
2 (0, 10, 30, 50, 70 mg/L) and ethanol (0, 10, 12, 14%
v/v), were inoculated with 10
6 CFU/mL of each tested bacteria and incubated for 10 days at 28 °C, pH 4.0 (except for experimental variants with different pH values), in stationary conditions. In addition, the LAB strains were incubated at different temperature values (15, 22, 28, 35 °C) in Bio concept incubators (Froilabo, France). Bacterial growth was monitored by spectrophotometric analysis of the cell density at λ 600 nm, according to the protocol presented by Bravo-Ferrada et al. [
26]. The residual L-malic acid was determined using an enzymatic kit (code 12803; BioSystems, Spain), involving the activity of L-malate dehydrogenase and glutamate-oxaloacetate transaminase (GOT) at 37 °C and reading the optical density at λ 340 nm with a Pharmaspec
® series 1700 UV-vis spectrophotometer (Shimadzu, Japan).
2.7. Statistical Procedure
Determinations were carried out in triplicate from independent cultures of each bacterial strain. Analysis of variance ANOVA test (XLSTAT 2021.5.1 for Microsoft® Excel) was initiated to investigate significant differences between data. p values lower than 0.05 (p < 0.05) were considered to be significant. The method used to discriminate among the means was Tukey’s test at 95% confidence level. Regression analysis was performed to look for relationships between data. Principal Component Analysis (correlation type) with agglomerative hierarchical clustering (Ward’s method) and histograms were performed to investigate data group formation (XLSTAT 2021.5.1 for Microsoft® Excel).
3. Results and Discussion
3.1. Isolation of Indigenous LAB Strains
Initiated spontaneously after the alcoholic fermentation of grape must, MLF of red wines lasted between 25 and 28 days, at 20 ± 2 °C. At sampling, the wines achieved alcoholic concentrations between 11.50 and 13.50% (
v/v), pH 3.36–3.62 (pH meter InoLab Level 1, with SenTix 81 electrode; WTW, Germany), a total acidity of 5.25 to 6.12 g/L tartaric acid, a volatile acidity of 0.34–0.39 g/L as acetic acid, total sulphur dioxide <15 mg/L, and residual sugars below 1.00 g/L (dry wines). Colonies that were grown on the surface of the agarised MRS medium after the incubation of the wine dilutions were counted, and the number of lactic acid bacteria was calculated in relation to the dilution performed. The number of LAB in wines varied from 16 × 10
3 (Pinot noir) to 58 × 10
3 (Arcaş) CFU/mL (data not shown), concluding that the diversity and density of LAB are influenced by both the grape cultivar and microclimate conditions. Similar findings were previously reported by Muñoz et al. [
27] and Dicks and Endo [
28], which showed that the density of LAB in the initial phases of winemaking (the must phase and onset of alcoholic fermentation) ranges from approximately 10
3 to 10
4 CFU/mL and the numbers and proportions of species vary according to the ripeness and condition of the grapes at the time of harvesting. Moreover, De Orduna mentioned that climate conditions are exerting a profound influence on wine microbiology [
29], while Bokulich et al. introduced the term “microbial terroir” as a determining factor in regional variation among wine grapes [
30].
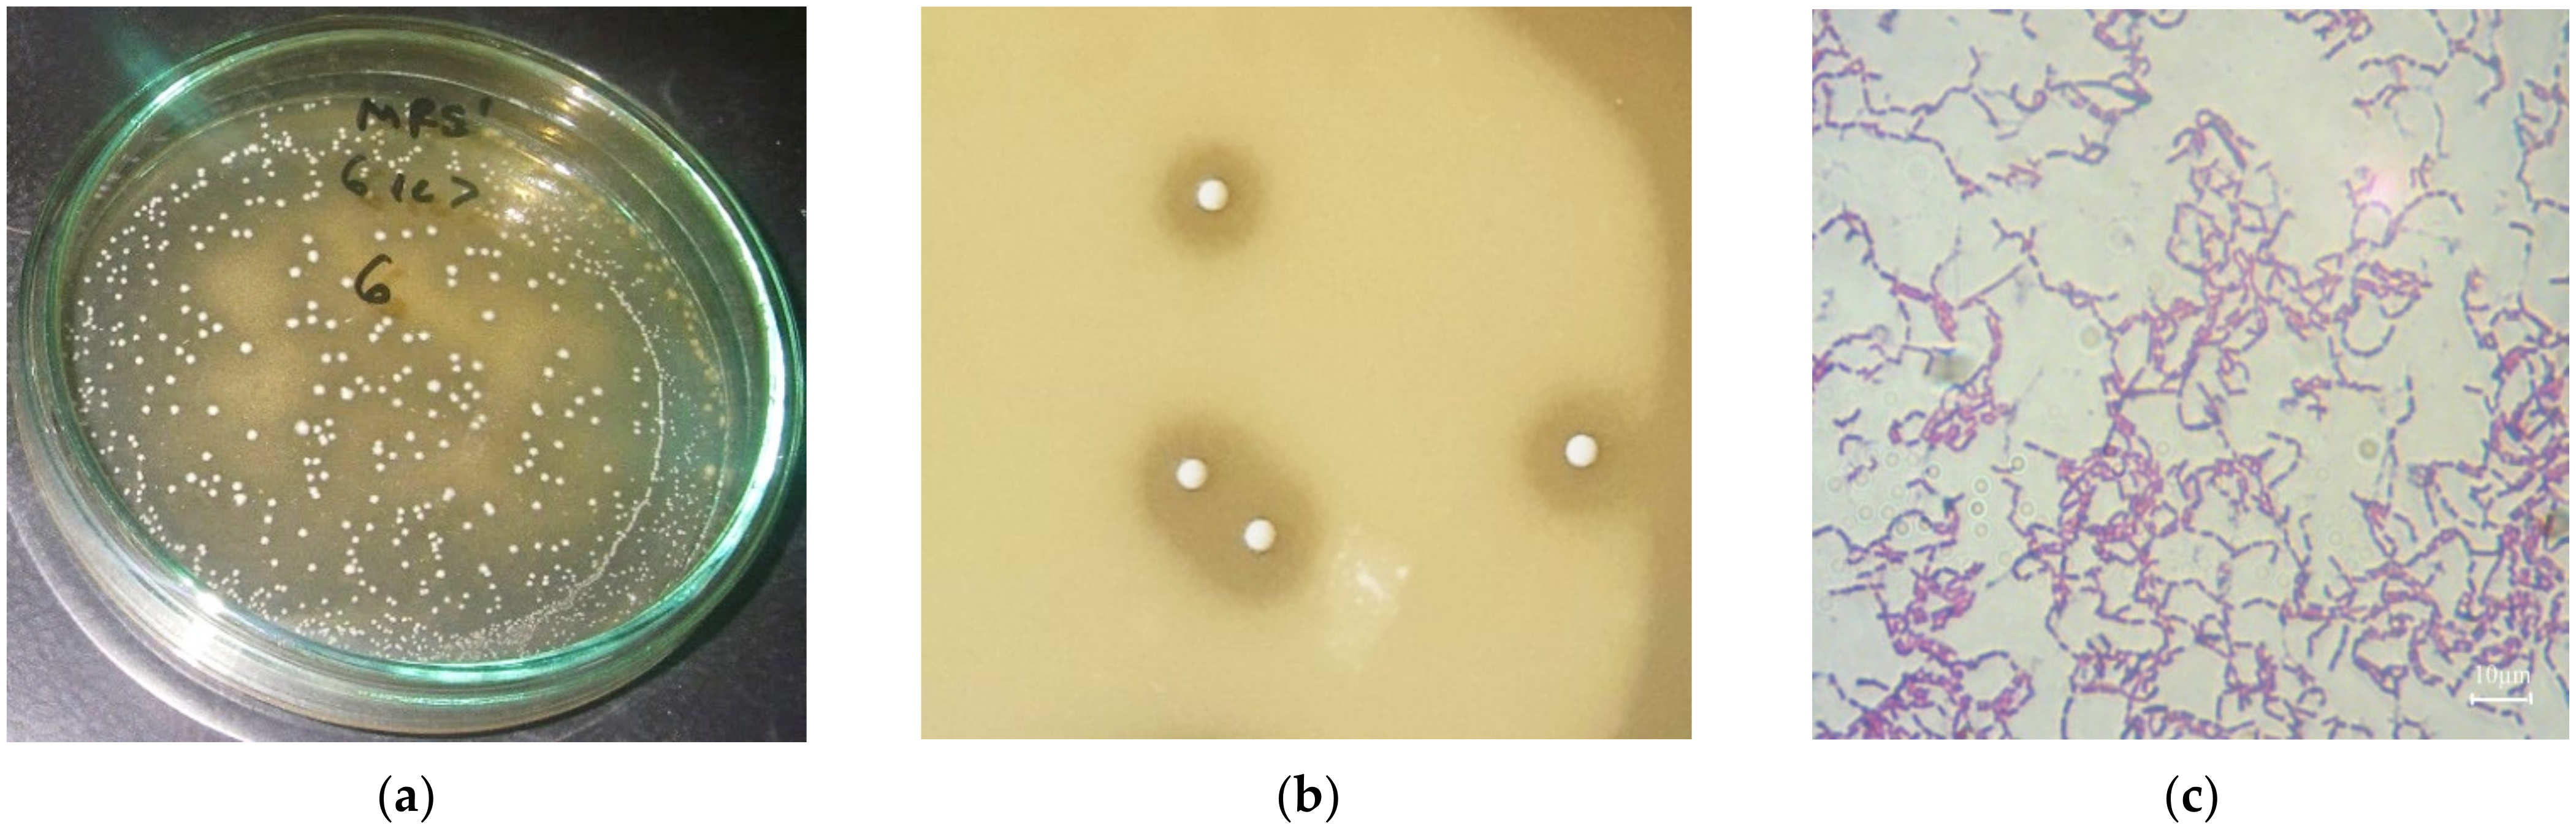
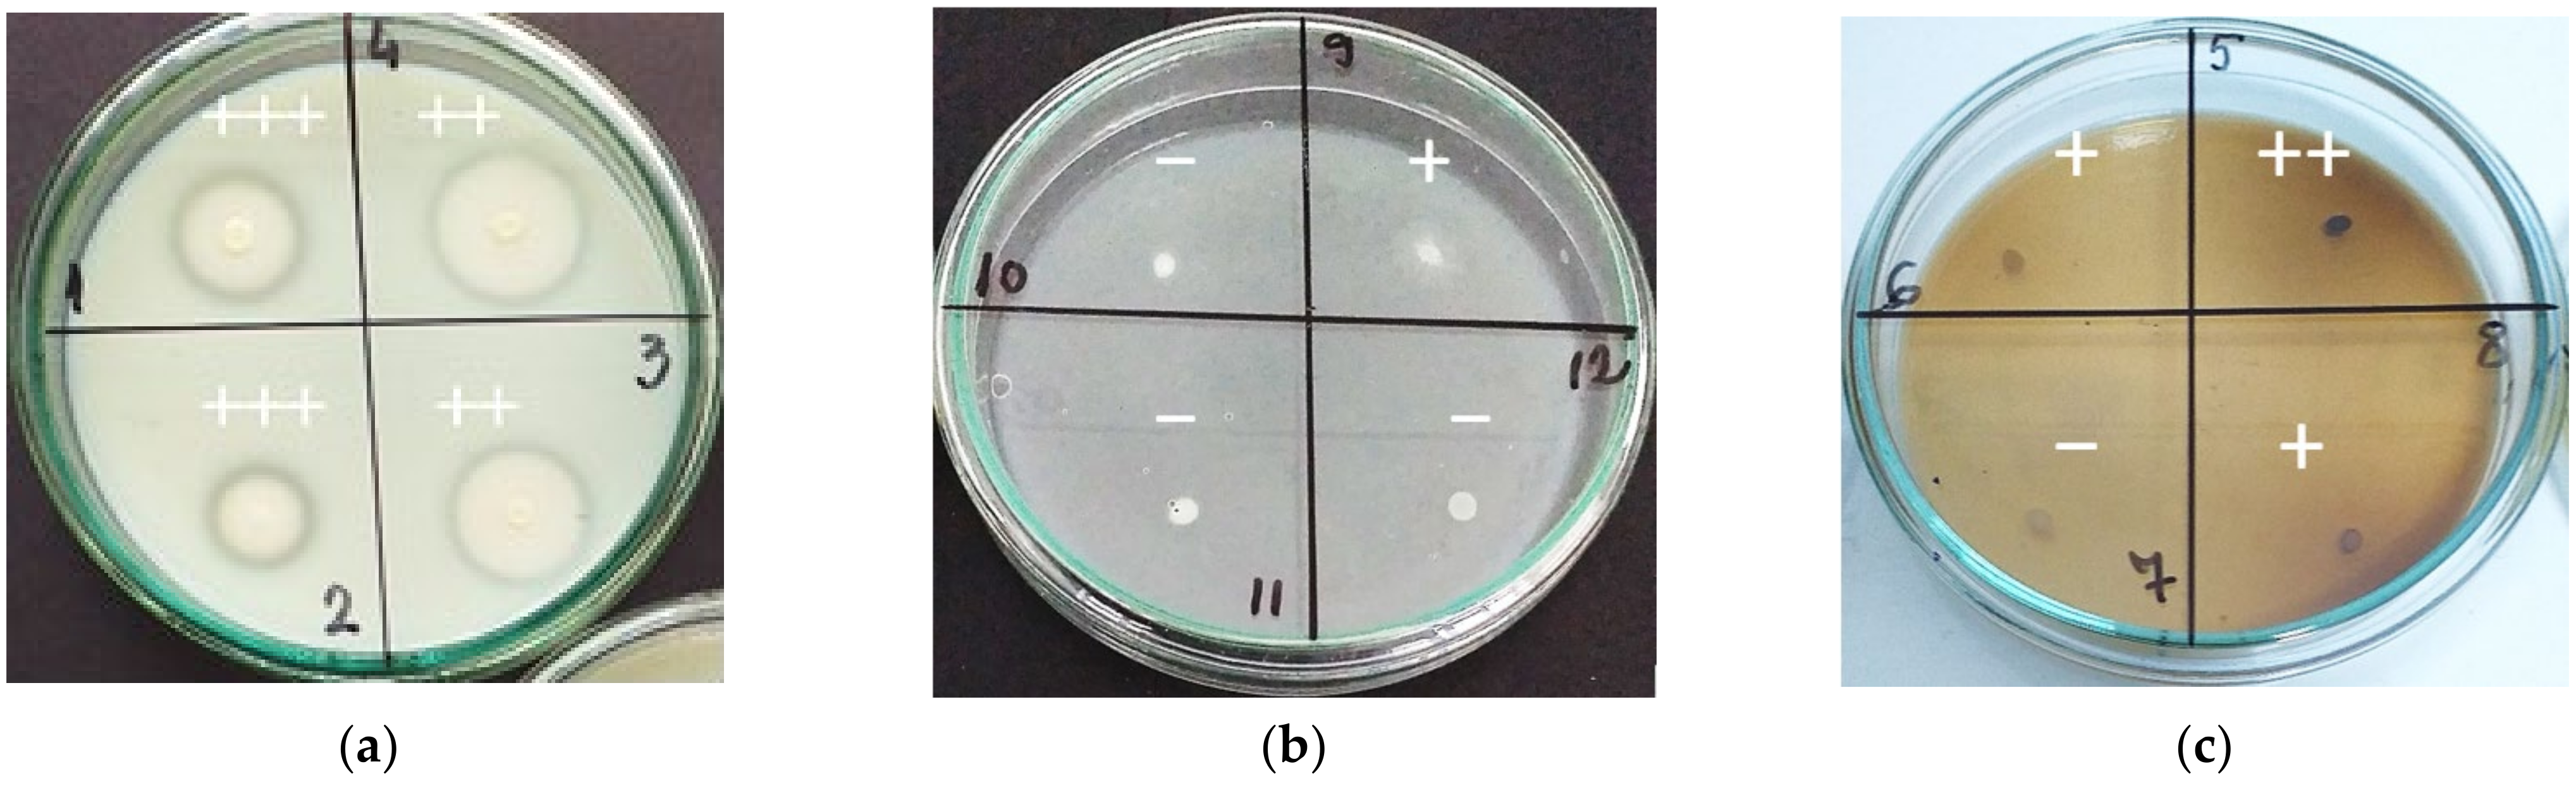
Individualized colonies that showed a clear halo on the carbonated agarised MRS medium (
Figure 1a) were passed in MRS broth with 5 g/L malic acid (pH 4.5) and incubated in anaerobiosis at 30 °C for 5–7 days. For purification, bacterial cells were then cultivated repeatedly on agarised and broth MRS medium, in anaerobiosis, 5 days at 30 °C (
Figure 1b). After five successive subcultures on MRS medium, the colonies obtained were pure (
Figure 1c).
3.2. Preliminary Selection of LAB Strains
LAB are Gram-positive, non-sporulated, immobile, and catalase-negative anaerobic microorganisms, tolerant to high concentrations of acids, bacteria that assimilate carbohydrates both in the homofermentative and heterofermentative pathways [
12,
31]. By macroscopic examination of morphological characteristics, LAB colonies showed circular shape, white color, and a small and milky aspect (
Figure 1b). After microscopic examination of isolates purity, 67 bacterial strains showing LAB specific morphology (shape, sporulation, mobility) were selected and preserved in MRS broth supplemented with 30% glycerol at −20 °C, a procedure that ensures the stability of the bacterial strains during storage.
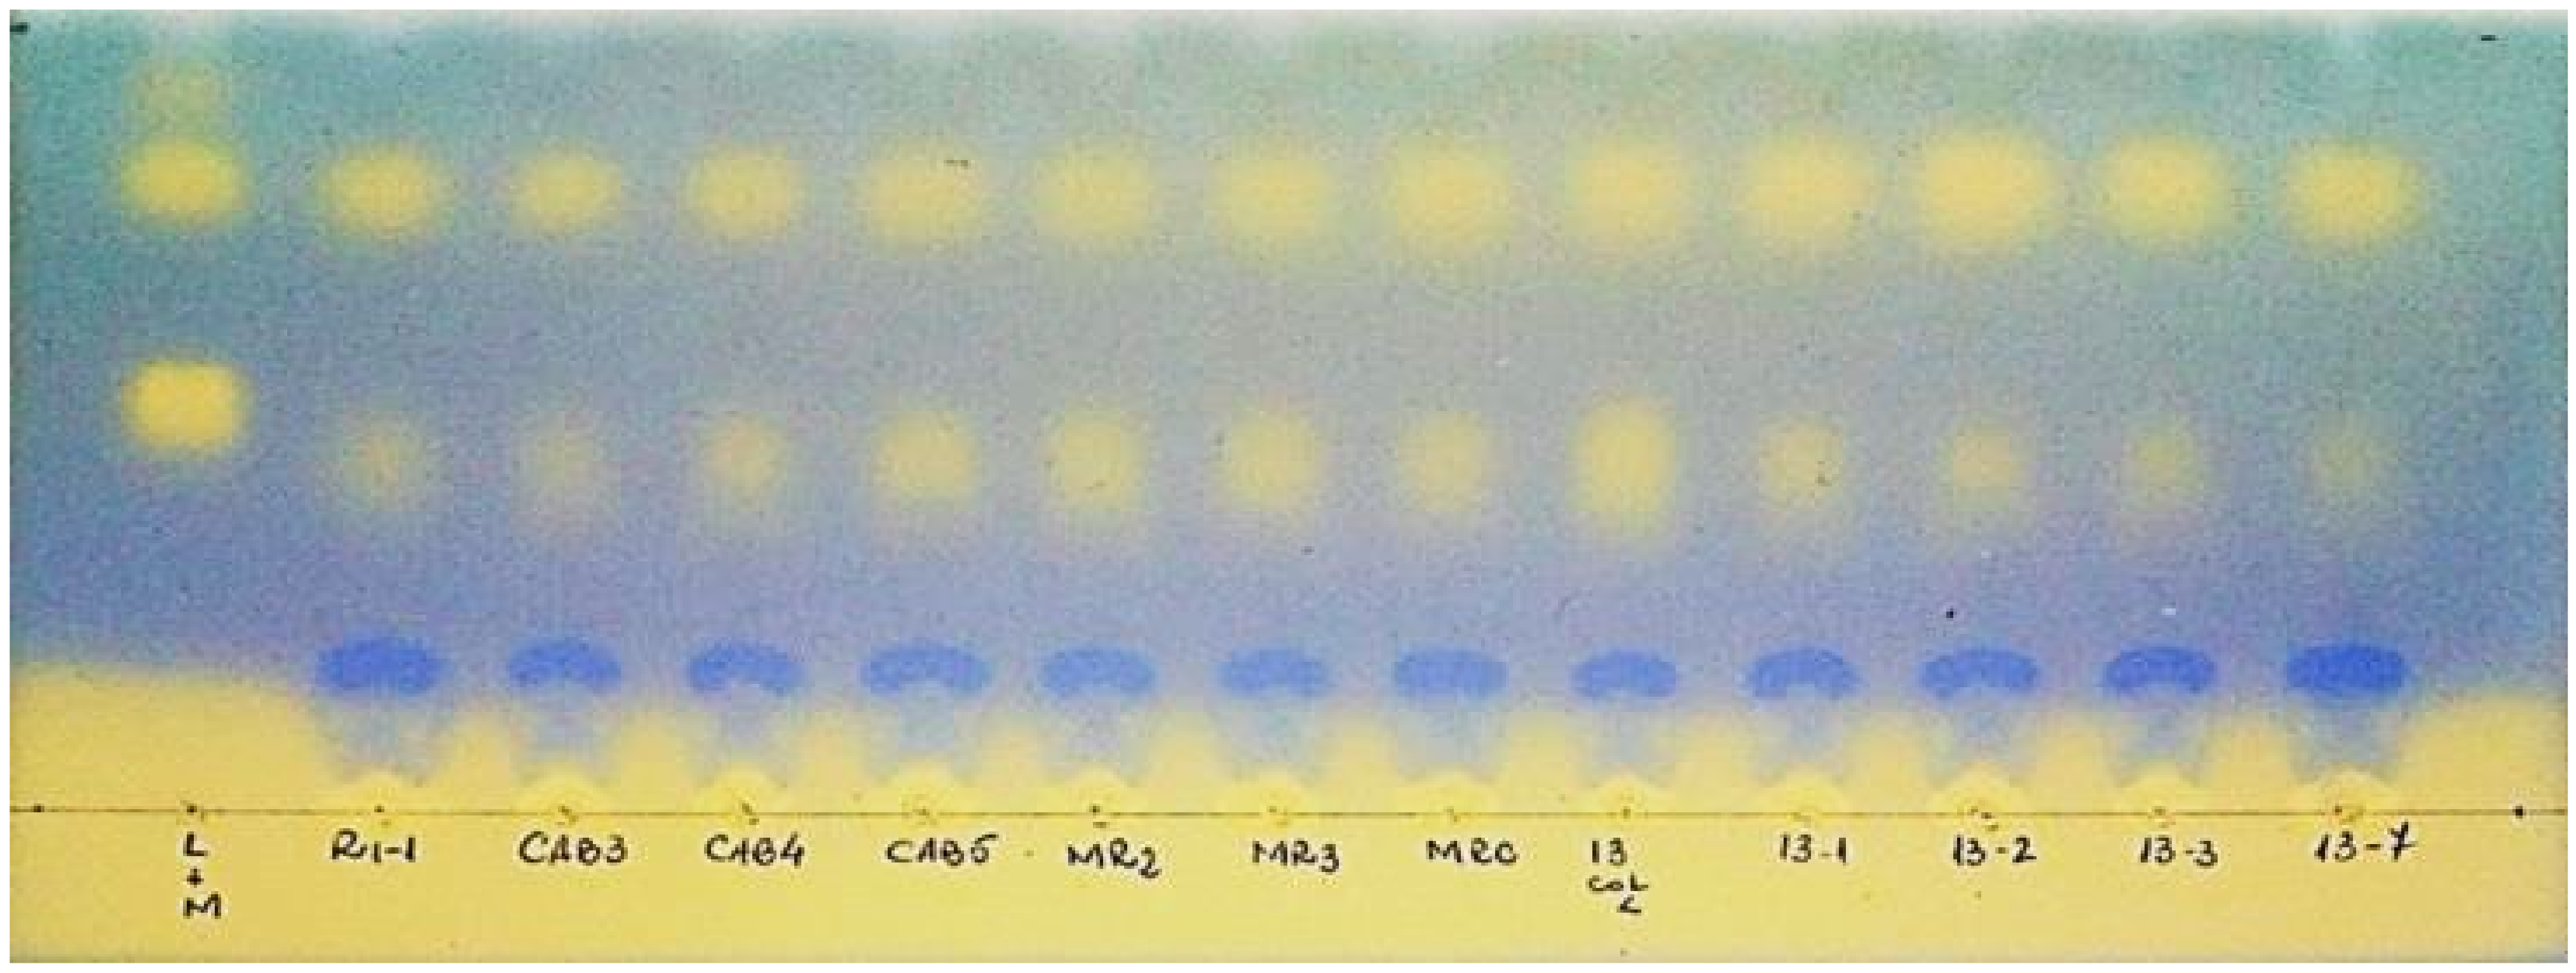
After prior adaptation on MRS broth with 10% ethanol (
v/v), isolated LAB strains were inoculated in synthetic wine with 12% ethanol (
v/v), for 20 days at 28 °C. Monitoring and completion of fermentation process in synthetic wine was performed by thin layer chromatography (TLC) (
Figure 2). The retention factors (Rf) of the lactic and malic acids, calculated at a migration front of 7.5 cm, were: Rf
malic acid = 0.48, respectively, Rf
lactic acid = 0.75.
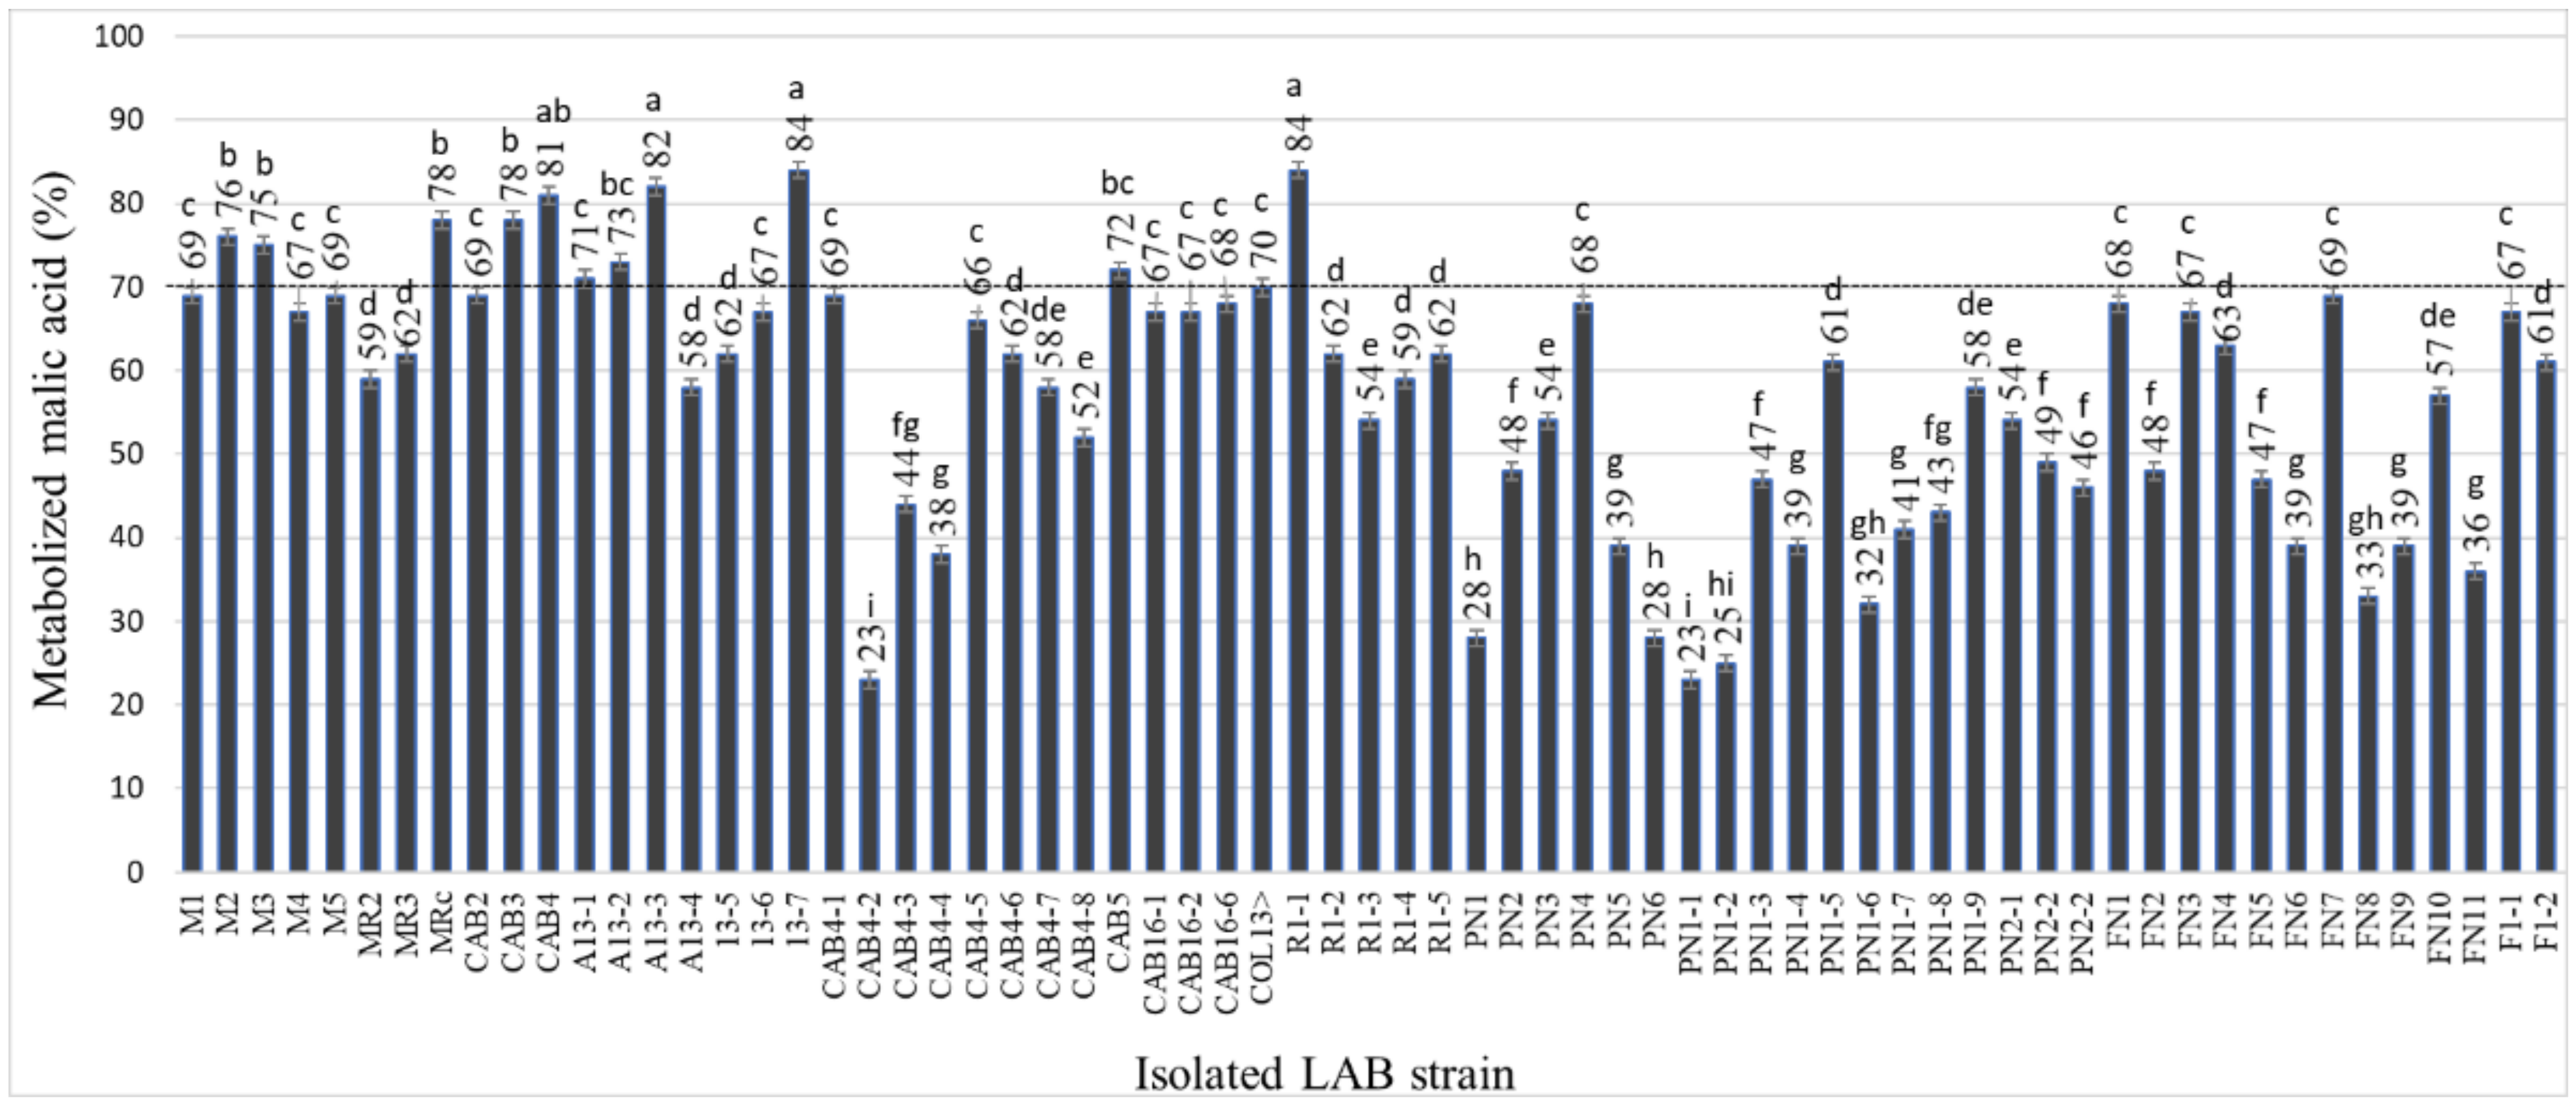
The ability of indigenous LAB strains to metabolize malic acid was significantly different, forming several phenotypic groups: group I—three strains that have metabolized up to 25% of malic acid; group II—19 strains that have metabolized between 25 and 50% of the malic acid; group III—38 strains that have metabolized between 50 and 75% of the malic acid; group IV—seven strains that have metabolized over 75% of the malic acid (
Figure 3).
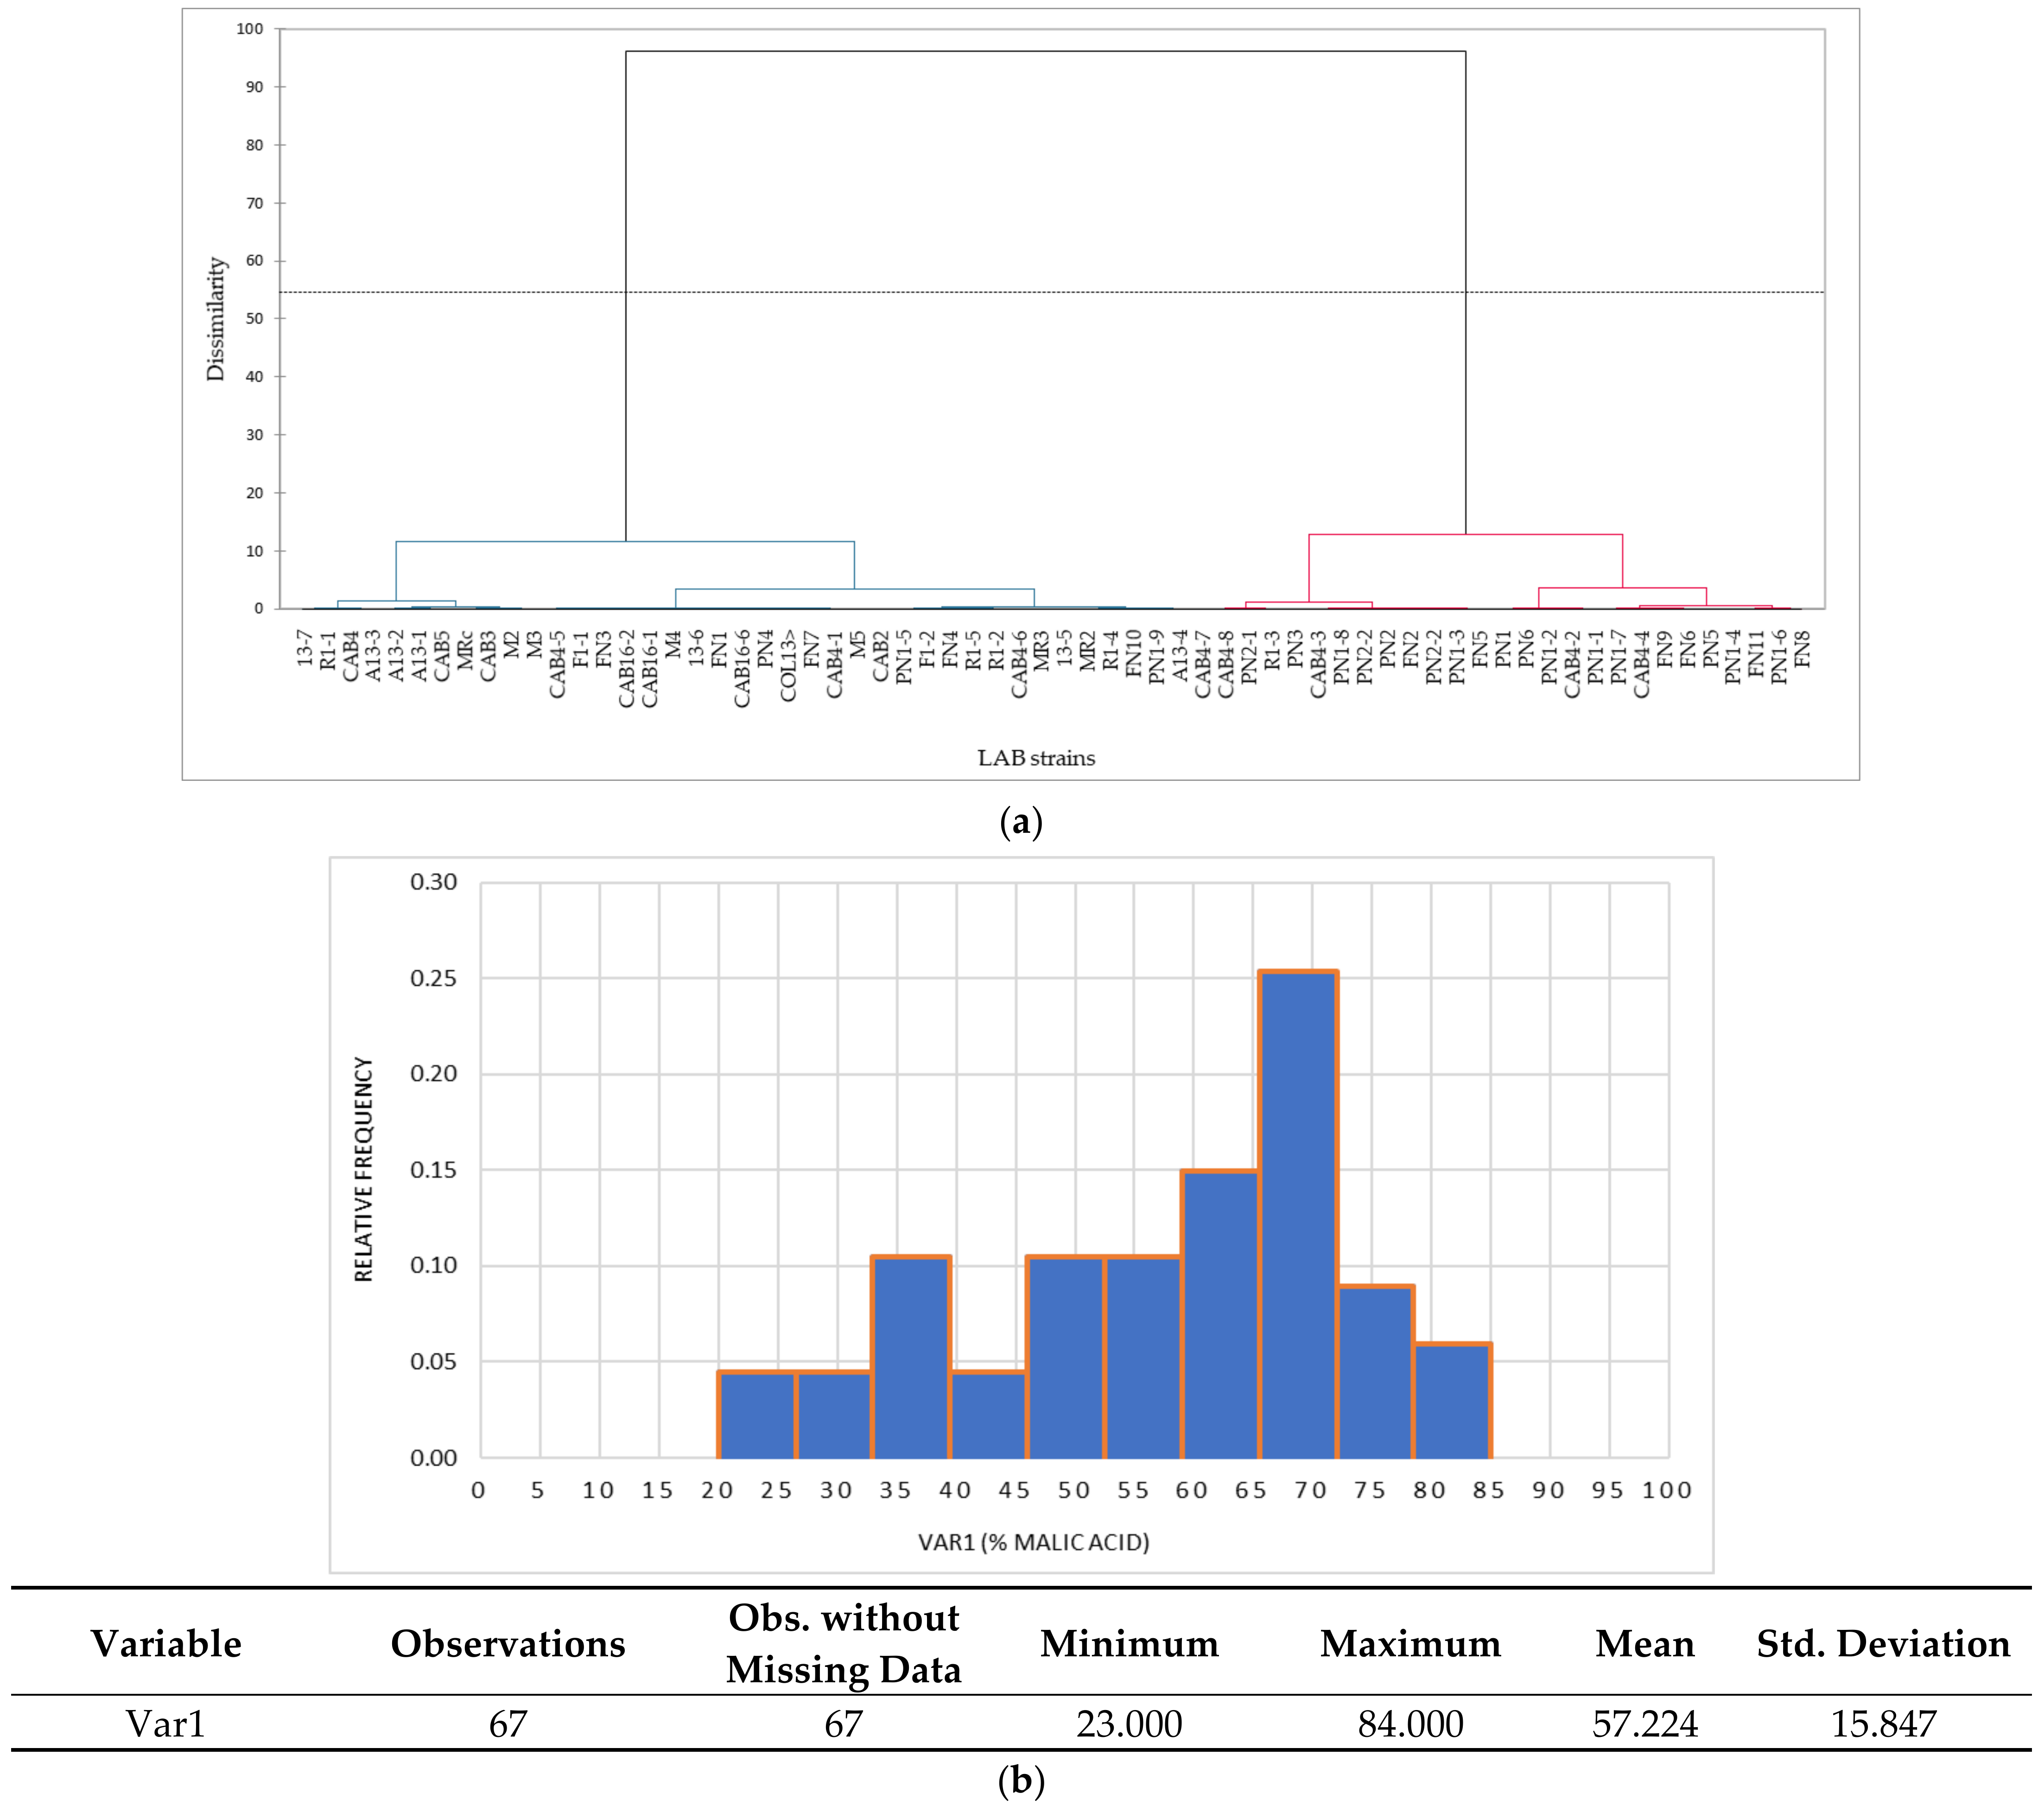
Cluster analysis admits the existence of polythetic groups (similar groups of individuals) and allows the verification of the belonging of an individual to a certain group, as well as the division of individuals into branches according to the principle of dissimilarity or similarity. Agglomerative hierarchical clustering (AHC) and dendrogram drawing based on the biodegradation capacity of malic acid, indicated the formation of two main clusters, obtained by the gradual aggregation of small groups of strains (
Figure 4a). The formation of the two clusters indicates the direction of preliminary LAB screening in the study, respectively the selection of some strains belonging to the two main LAB genera (macro- and microscopic examination),
Lactobacillus sp. and
Oenococcus sp., capable of proper malolactic bioconversion. Moreover, according to the obtained histograms, data analysis revealed that most of the indigenous LAB isolated from the wine microbiota (>40%) metabolized 60 to 75% of the available malic acid (relative frequency = 0.254) (
Figure 4b).
LAB strains that failed to convert at least 70% of the initial malic acid concentration in 20 days of fermentation were not considered technologically valuable. Thus, only 12 strains showing high potential for malolactic bioconversion were retained for the following stages of testing and characterization.
Examination of glucose metabolism revealed that of the 12 selected bacterial strains, 9 showed homofermentative metabolism and 3 heterofermentative metabolism (with CO
2 release). According to Bauer and Dicks [
10],
Oenococcus oeni is a heterofermentative LAB species that produces lactic acid by glucose consumption and a variable number of secondary metabolites. In the case of the genus
Lactobacillus, lactic acid bacteria species can be both heterofermentative and homofermentative [
32]. If gas production is observed, the strain is heterofermentative, but this can also be confirmed by highlighting the presence of ethanol and acetic acid, a phenomenon valid for both genera
Oenococcus and
Lactobacillus.
3.3. LAB Strains Identification
Initially, the identification of LAB isolates was performed at the genus level. Thus, among 12 strains isolated, purified, and preliminary tested, 10 strains were taxonomically classified in the genus Lactobacillus (rod-shaped, bacilli; 9 homofermentative and 1 facultative heterofermentative—weak gas producer) and only 2 strains in the genus Oenococcus (ovoid to short rods, cocobacillus, in pairs and chains; heterofermentative).
Identification of LAB strains at the species level was performed according to the taxonomic keys established in Bergey’s Manual of Systematic Bacteriology [
12], using API 50 CH galleries (BioMerieux, France). API 50 CH tests were used for phenotypic characterization of bacterial species isolated from grape must, wine, and dairy products, previous obtained results being highly correlated with genetic tests [
26,
33,
34,
35]. Each bacterial species ferments certain carbohydrates, making it possible to discriminate between them based on their fermentative preferences. After incubation and comparison of the results with the standard biochemical keys, the isolation of 10 bacterial strains belonging to the
Lactobacillus plantarum species and 2 strains of
Oenococcus oeni was confirmed. The differences were represented by the ability of the
L. plantarum strain to ferment mannitol, melibiosis, sucrose, gentiobiosis, D-arabitol, and gluconate, while the
O. oeni strain was able to ferment D-xylose and D-lixose.
3.4. Screening of Extracellular Enzyme Production
LAB may produce a wide range of enzymes such as: proteases, peptidases, polysaccharide degrading enzymes, ureases, lipases, amylases, esterases, and phenoloxidases [
4]. Different strains of malolactic bacteria may increase or decrease the intensity of wine aroma and flavor attributes [
4,
36]. Depending on the number of extracellular enzymes, four groups of LAB strains were distinguished: group I—four strains with four extracellular enzymes (only
L. plantarum strains); group II—two strains with three extracellular enzymes (only
L. plantarum strains); group III—five strains with two extracellular enzymes, and group IV—one strain with one extracellular enzyme (
O. oeni). All tested LAB strains showed extracellular protease with variable activity (
Table 1).
Isolated
O. oeni strains showed average activity of protease, similar to the commercial
O. oeni control strain. All tested
L. plantarum strains showed high protease activity (
Figure 5a), only four strains showed variable esterase activity (
Figure 5b), six strains presented lipase activity, while seven strains expressed β-glucosidase activity (
Figure 5c). Davis et al. [
37] found no wine LAB strains positive for extracellular protease; lipases were produced only by several strains of
O. oeni and one strain of
Lactobacillus sp., but the majority of LAB strains produced esterases.
β-glycosidase are enzymes involved in the hydrolysis of flavor precursors, releasing monoterpenes from the glycosylated form. Volatile compounds released from glycoside complexes play an important role in obtaining varietal aromas. Moreover, “lipolytic enzymes” such as lipases and esterases showed the ability to hydrolyze hydrophobic long- and short chain carboxylic acid esters [
7]. Genetic studies performed by Lerm [
38] by PCR detection of the associated genes demonstrated the presence of genes encoding β-glucosidase, esterase, and protease activity in
L. plantarum strains, and esterase and protease in
O. oeni strains. The
L. plantarum strains were found to possess more diverse enzymatic profiles related to wine aroma than
O. oeni, the biggest difference being for the presence of β-glucosidase.
3.5. Characterisation of Indigenous LAB Strains
Citrate-positive LAB are able to degrade citrate during MLF. These bacteria possess enzymes such as citrate-permeate and citrate-lyase, responsible for the degradation of citrate, while citrate-negative LAB lack these enzymes [
4]. Citrate metabolism results in the production of various compounds (D-lactate, acetate, diacetyl, acetoin, 2,3-butanediol), which can influence the quality of wine [
39]. Inoculated on Simmon’s citrate agar medium, citrate-positive LAB strains weakly alkalized the culture medium, proving a reduced ability to metabolize citric acid (
Figure 6a).
Of the 12 LAB strains tested, only 4
L. plantarum strains showed the ability to use citrate as the sole source of carbon and energy (
Table 2).
The production of acetoin (acetylmethylcarbinol) from both glucose and citrate was tested by centrifugation of bacterial cell suspension of Simmon’s broth and Clark-Lubs broth media and adding to the supernatant α-naphthol as the catalyst and KOH as the oxidizing agent, which hastens the oxidation of acetoin to diacetyl (Voges-Proskauer test). The appearance of the pink-red color after vigorous aeration indicated the presence of acetoin (
Figure 6b). The content of diacetyl found in wine is dependent on the LAB species used as a starter culture for MLF [
2,
40]. At low concentrations (0.5–4 mg/L) diacetyl is associated with the buttery character of wine, while at high concentrations (>5–7 mg/L) it confers undesirable aromas [
41,
42]. Among the tested LAB isolates, five
L. plantarum strains and one
O. oeni strain were able to produce acetoin from glucose metabolism, while only four
L. plantarum strains were capable to produce acetoin from citrate (
Table 2). LAB strains that consumed citrate as the sole source of carbon, also produced acetoine from citrate metabolization.
Biosynthesis of biogenic amines is achieved by decarboxylation of α-amino acids by amino acid decarboxylase enzyme. These amines are compounds with low molecular weight, but with important biological activity. Relatively small amounts of biogenic amines as aliphatic polyamides (putrescine, cadaverine, spermine and spermidine are found in wine [
43]. Heterofermentative LAB may degrade arginine during MLF via the arginine deiminase pathway, leading to the formation of ammonia, ornithine, citrulline, ATP, and CO
2 [
44]. Most biogenic amines are toxic to the body due to the physiological effects they produce in the presence of alcohol and acetaldehyde (headaches, hypotension, digestive disorders) and can imprint an unpleasant odor to wine [
45]. In addition, the catabolism of arginine by LAB in wine can produce citrulline-like precursors for the formation of ethyl carbamate (urethane), a compound known for its carcinogenic activity [
46]. Considering these food safety issues, spontaneous malolactic fermentation must be less and less present in wine technology, and research in this field needs to focus on the isolation and selection of new superior LAB strains to be used as starter cultures.
Tested LAB isolates did not show the ability to decarboxylate the amino acids tyrosine, ornithine, and lysine. Only two
L. plantarum strains were able to decarboxylate histidine, but most of the LAB isolates (seven
L. plantarum and one
O. oeni) showed the capacity to decarboxylate arginine, with the formation of the corresponding amines (
Figure 6c;
Table 2).
In the experimental screening procedures, indigenous LAB isolates that were capable of producing biogenic amines and acetoin by using glucose or citrate were eliminated from the study. Thus, after performing the screening procedures, two bacterial strains belonging to the species Lactobacillus plantarum (strain R1-1) and Oenococcus oeni (strain 13-7), respectively, were retained and further characterized. The selected bacterial strains showed a rate of malic acid conversion of over 80% in synthetic wine, and were not able to consume citric acid or to produce biogenic amines or acetoin, also showing high cultivability characteristics (short lag phase and increased biomass production).
3.6. Influence of Abiotic Factors on Indigenous LAB Development and Malolactic Bioconversion
3.6.1. PH
PH, along with temperature, is an essential parameter in biosynthesis processes, limiting the development of LAB species, determining which species will survive and develop as well as the growth rate of the bacteria [
10]. Regarding the tested LAB strains, a pH above 3.5 allowed the normal development of bacterial cells. Lowering the pH to 3.0 hindered bacterial growth, but did not inhibit it. The lag phase was prolonged mainly in the case of the
L. plantarum strain R1-1, to over five days (
Figure 7a). For
O. oeni strain 13-7, the lag phase at pH 3.0 was shorter (three days) and the final value of OD 600 nm was higher than in the case of
L. plantarum strain (
Figure 7c).
The maximum optical density of the culture (OD 600 nm) was reached in the medium with pH 4.5 after about three days of incubation for
L. plantarum strain R1-1 (2.509) and after two days of incubation for
O. oeni strain 13-7 (2.561). At the same time, the degradation of malic acid was not influenced at pH values between 3.5 and 4.5, both strains managed to consume malic acid in high proportions (>90%). At pH 3.0, the amount of malic acid metabolized was significantly lower,
O. oeni strain 13-7 degraded 27% of the initial malic acid (
Figure 7b), while
L. plantarum strain R1-1 consumed only 24% of the malic acid in ten days of incubation (
Figure 7d).
3.6.2. Sulphur Dioxide
The addition of sulphur dioxide (SO
2) to the fermentation medium is a traditional practice in winemaking to avoid the development of spoilage microorganisms, also as antioxidant and inhibitor of oxidizing enzymes. In the bacterial cell, the molecular form of SO
2 reacts with various cellular components (e.g., proteins), affecting the growth of LAB [
47]. Henick-Kling et al. [
15] showed that most of LAB are sensitive to SO
2 concentrations above 20 mg/L, while at concentrations higher than 150 mg/L SO
2 MLF can no longer take place. In the current study, total SO
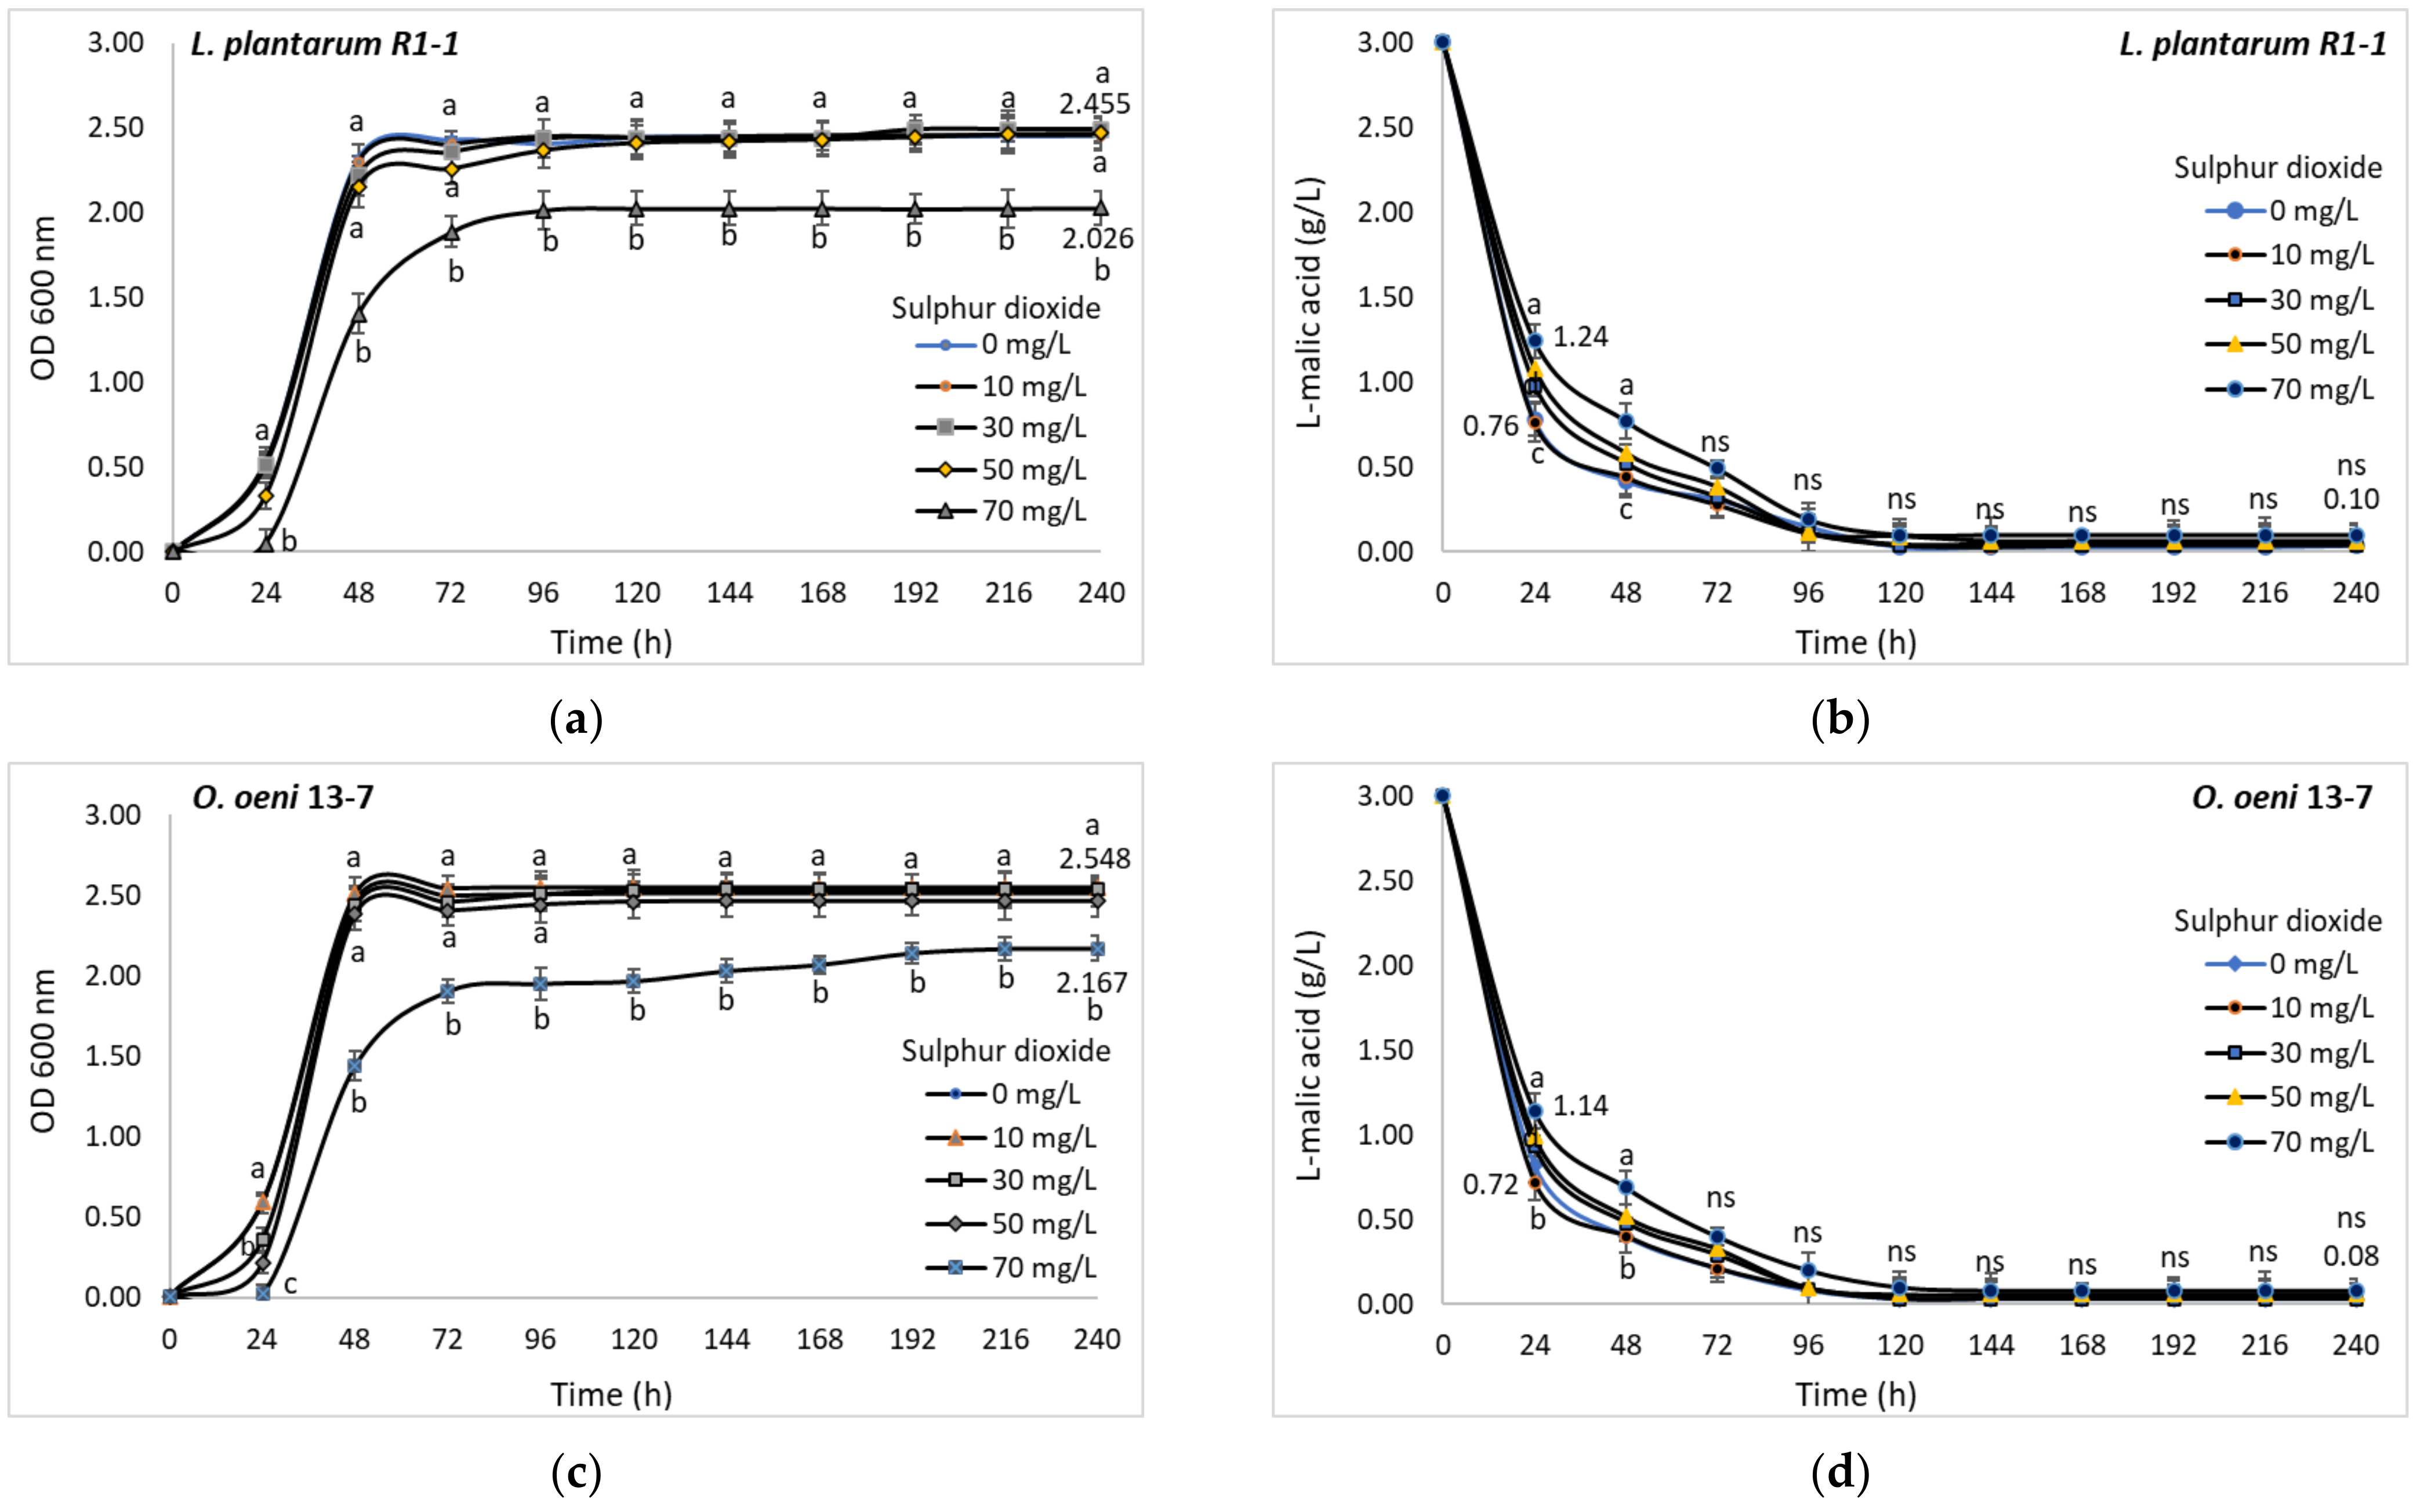
2 concentrations between 10 and 50 mg/L did not affect the normal development of the tested bacterial cultures, the exponential growth phase taking place in less than 24 h, and the maximum optical density of the cultures being reached in 48 h. Increasing SO
2 concentration up to 70 mg/L led to a significant decrease in final cell density by about 17% in the case of
L. plantarum strain R1-1 (
Figure 8a) and only 15% in the case of
O. oeni strain 13-7 (
Figure 8c). Regardless of the dose of SO
2 used, the degradation of malic acid occurred in a proportion of over 90% in the first five days of incubation (
Figure 8b,d).
However, in the first two days of incubation, statistically significant differences were registered between the malic acid amount degraded in the control (without SO2) and the samples with SO2 concentrations between 30 and 70 mg/L.
3.6.3. Temperature
Temperature influences the rate of cell growth, the lag phase duration, and the density of the active population of lactic acid bacteria [
10]. The wine LAB are mesophilic species, and the tolerance to low temperature appears to be a strain level characteristic. Henick-Kling et al. [
15] have shown that the optimal growth rate of
O. oeni strains is close to 25 °C, while Ribéreau-Gayon et al. [
48] reported that the optimum temperature for
O. oeni growth in wine is 20 °C. However, the temperature during MLF should be between 18 and 25 °C to ensure optimum malolactic activity [
10,
16].
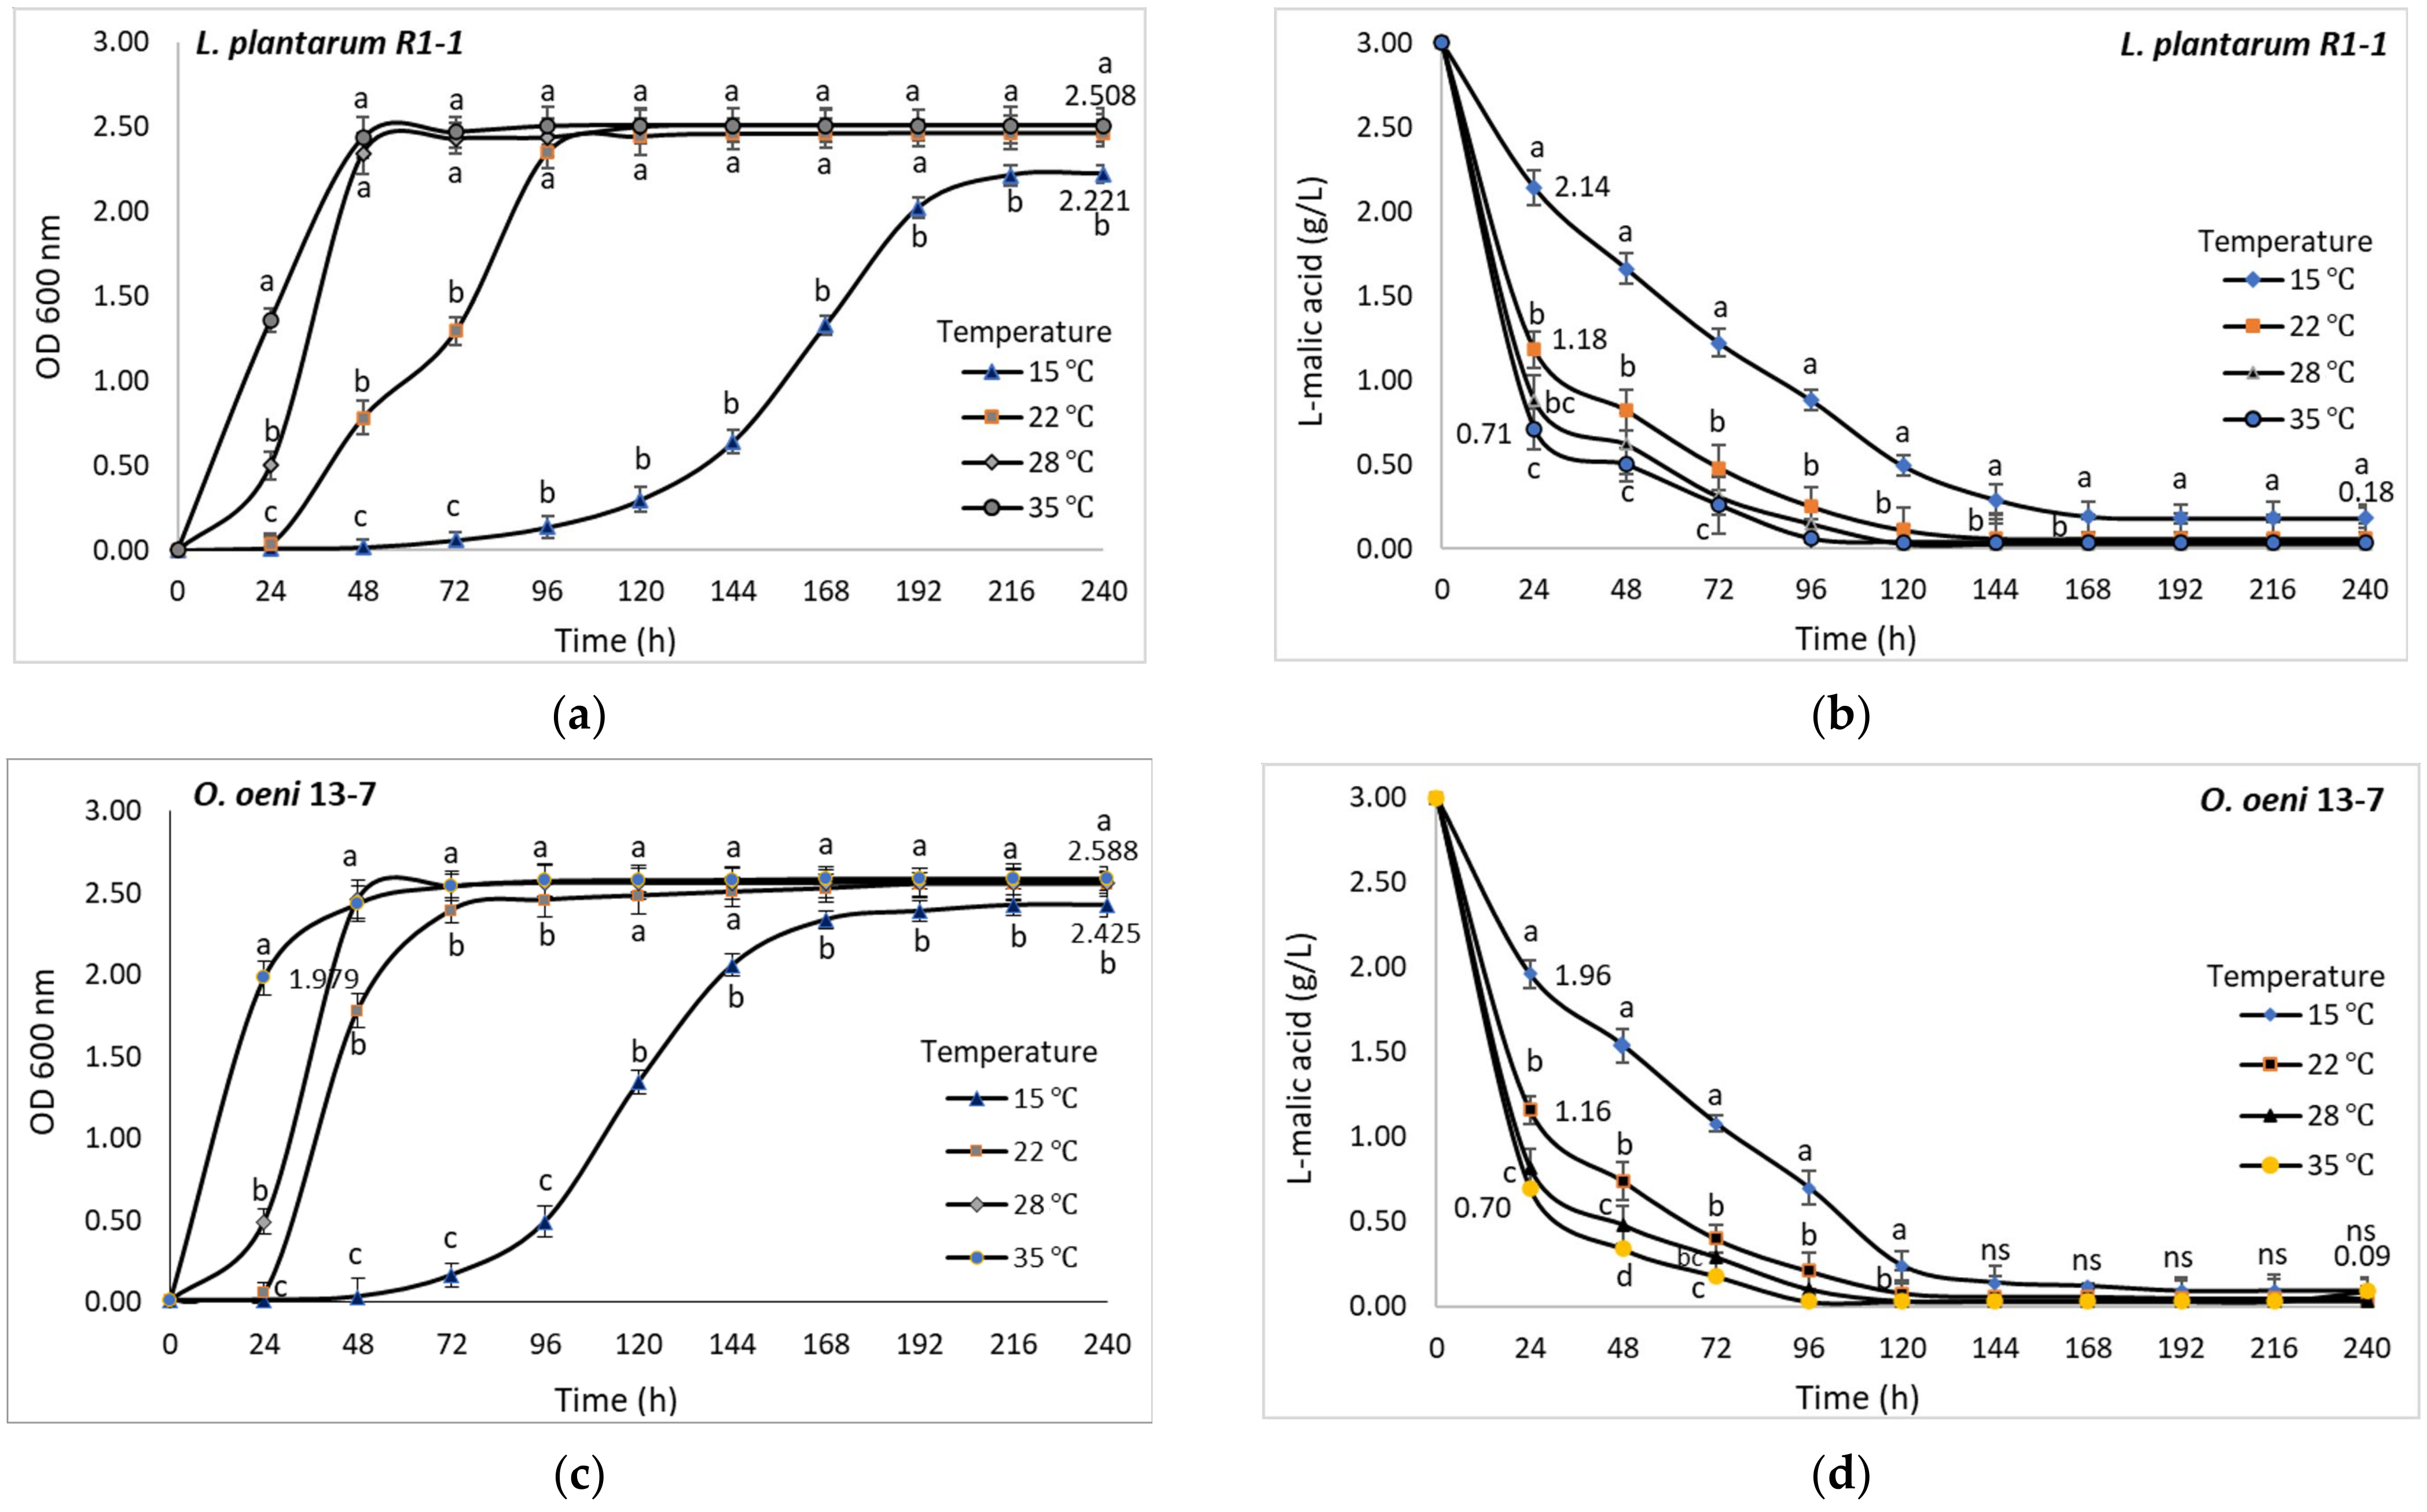
In the case of the tested indigenous LAB isolates, the temperature significantly influenced both the cell growth and the degradation of malic acid. Mainly, the lag phase was affected by increasing its duration up to 3 days with the decrease of the temperature to 15 °C. At 22 °C, both LAB straines reached maximum cell density after five days, while at 35 °C the lag phase unfolded very quickly and the maximum cell density was reached in 48 h. However, the
O. oeni strain withstood low temperatures better (
Figure 9c), the optical density of the bacterial culture being higher in comparison to
L. plantarum strain (
Figure 9a).
Although both tested bacterial strains were able to survive at 15 °C, the conversion of malic acid was slow and lasted longer. In 24 h at 15 °C,
L. plantarum strain R1-1 succeeded the degradation of 28.6% of the malic acid (
Figure 9b), while
O. oeni strain 13-7 metabolized 34.6% of the initial malic acid (
Figure 9d). After the 10 days of incubation, over 90% of malic acid was metabolized by both LAB strains, but significant concentrations of residual malic acid were identified in the
L. plantarum strain R1-1 medium. According to Krieger-Weber et al. [
49], low temperatures (around 10 °C) are not lethal for LAB strains but decrease their enzymatic activity.
3.6.4. Ethanol
Ethanol strongly interferes with the growth and metabolic activity of LAB [
10,
50].
Lactobacillus strains are more tolerant to high ethanol concentrations than
O. oeni [
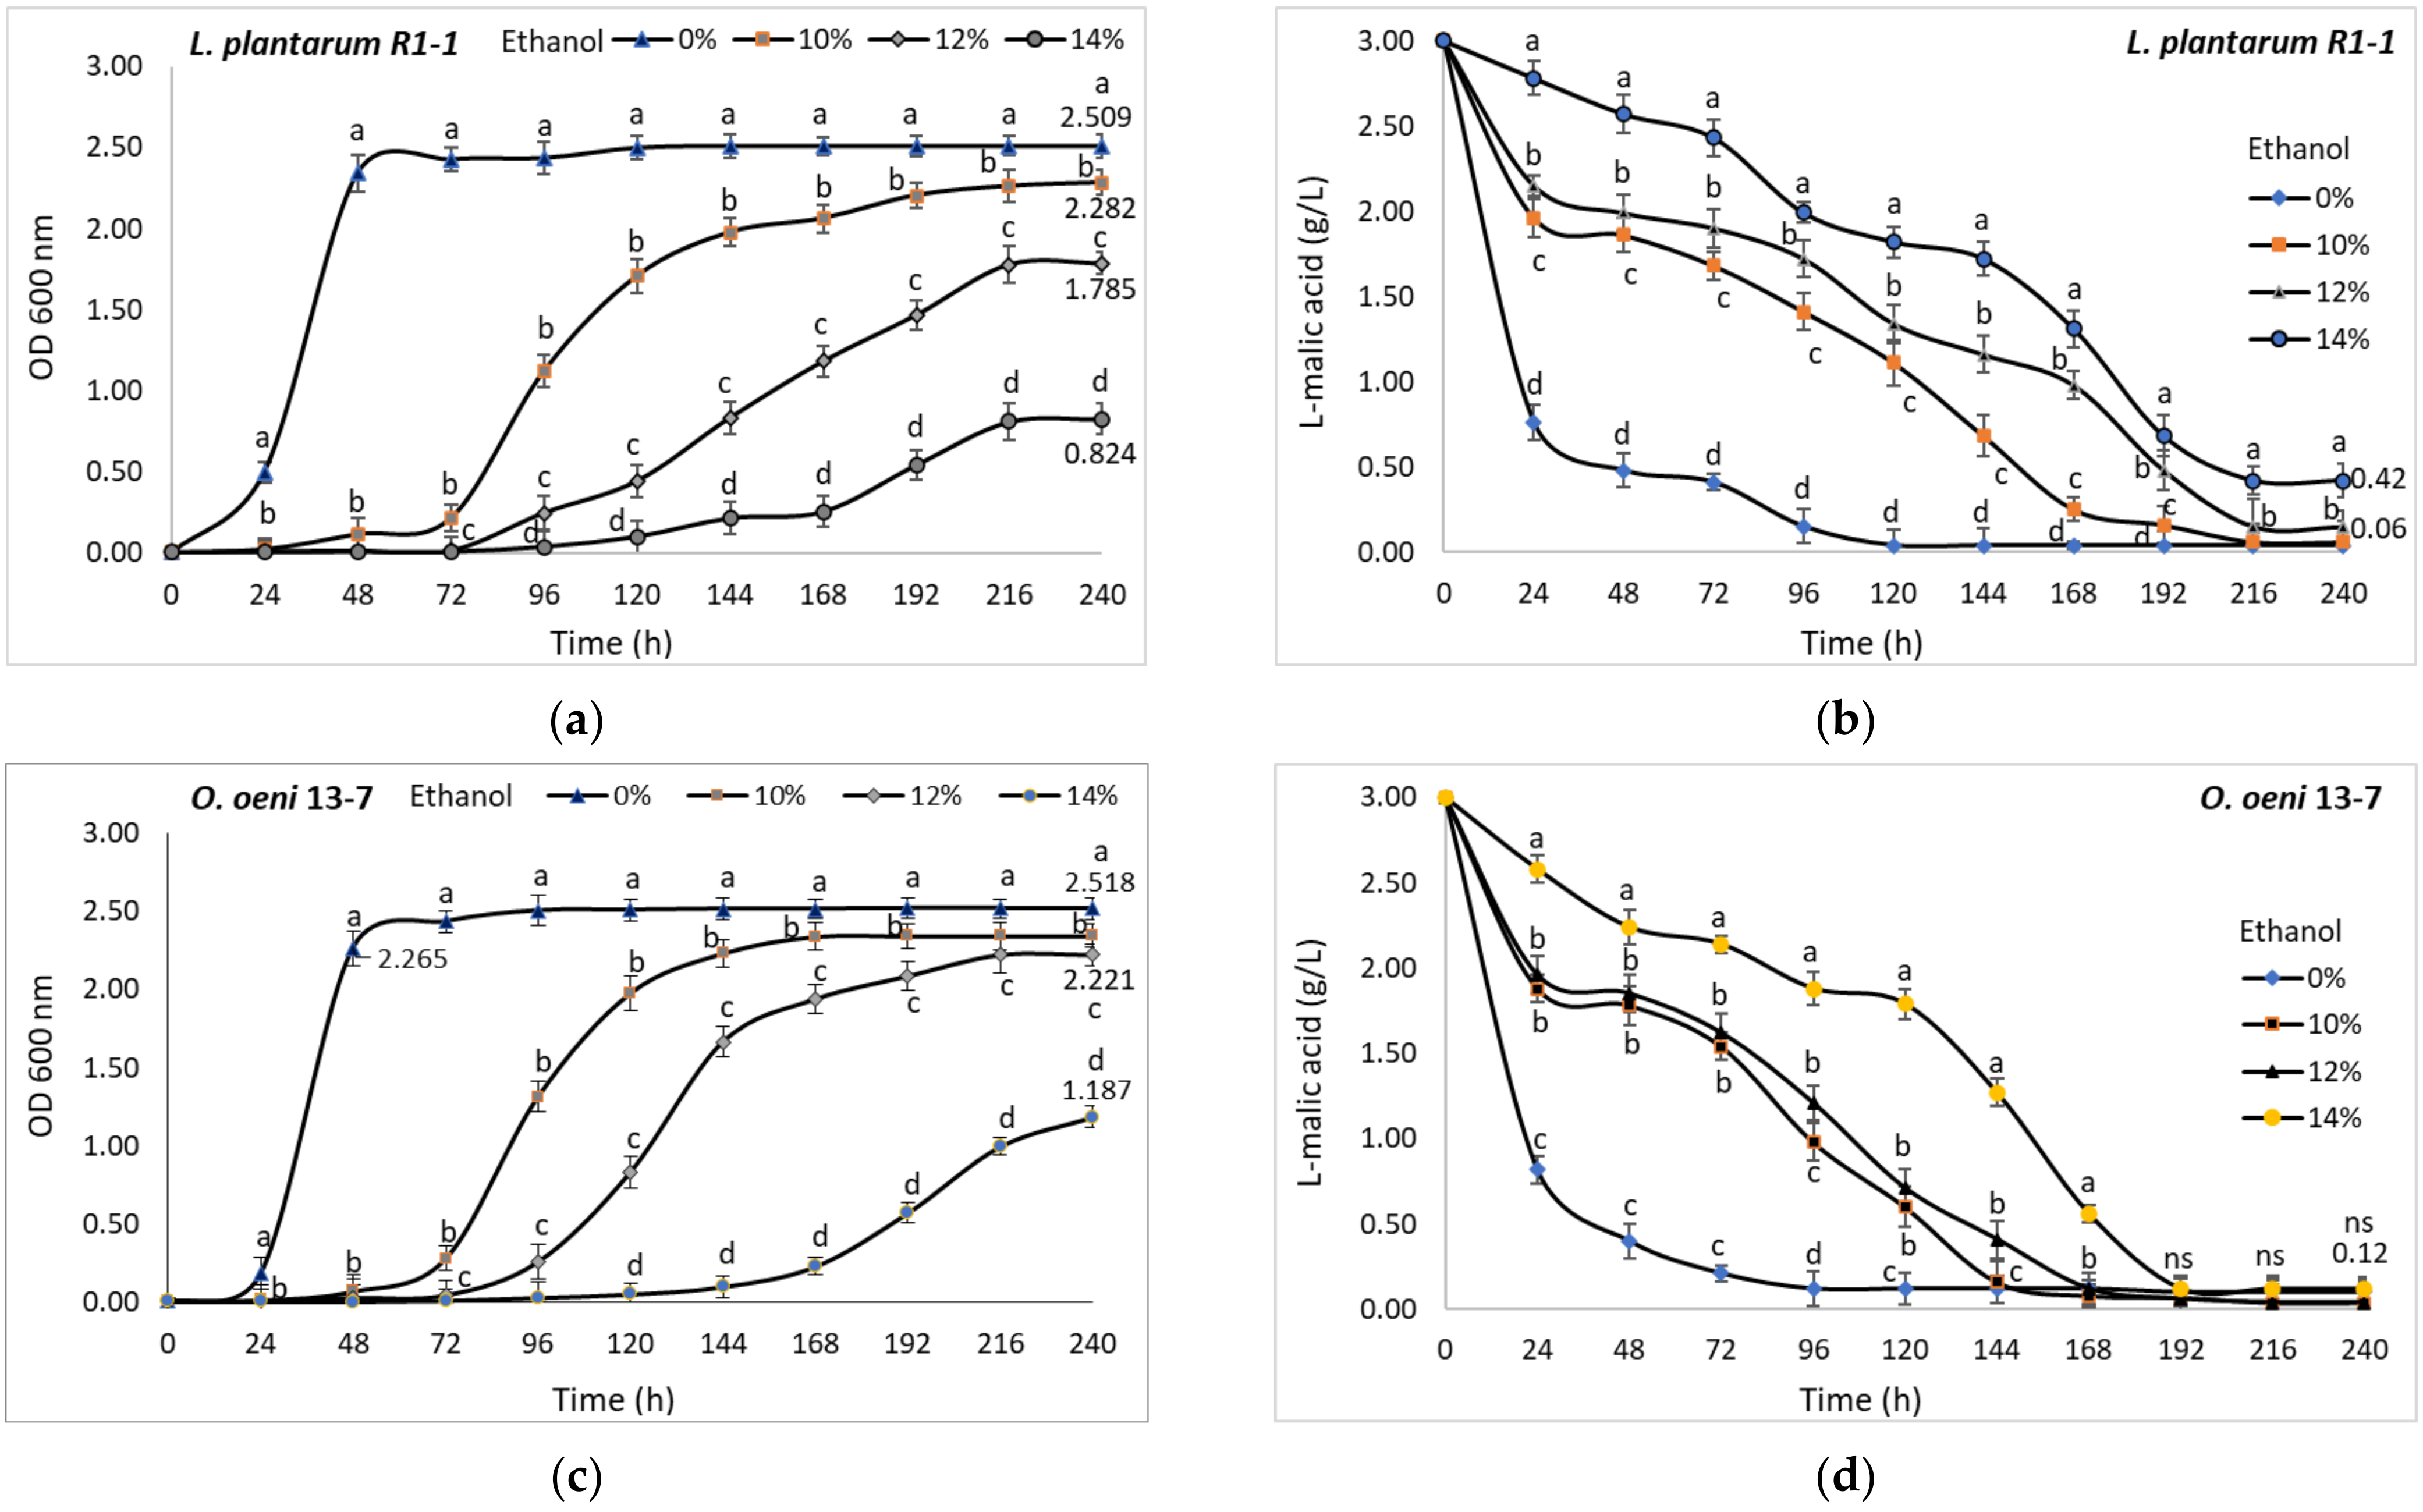
37]. In the current study, the presence of ethanol in the growth medium has significantly hindered LAB isolates cell development. If at an alcoholic strength of 10% (
v/v) the lag phase lasted for two days, the increase of the ethanol concentration to 14% (
v/v) led to a lag phase extended up to four days for the
L. plantarum strain R1-1 and to five days for
O. oeni strain 13-7. Thus, the final cell density in the medium with 14% (
v/v) ethanol was about 67% lower in the case of the
L. plantarum strain R1-1 (0.824) (
Figure 10a) and only 50% lower for the
O. oeni strain 13-7 (1.187) (
Figure 10c) compared to ethanol-free cultures. These results are consistent with those obtained by Lonvaud-Funel [
40], which showed that
O. oeni usually grows more slowly than other LAB, but in the end predominates due to its high tolerance to the combination of ethanol and acid.
The degradation of malic acid showed fluctuating dynamics, but both strains
L. plantarum R1-1 (
Figure 10b) and
O. oeni 13-7 (
Figure 10d) consumed more than 90% of the malic acid during the 10 days of incubation at 28 °C, regardless of the ethanol concentration. In similar conditions, Bravo-Ferrada et al. reported that high ethanol concentrations negatively influenced only the development of different
O. oeni strains, not their malolactic activity [
26]. However, the ethanol tolerance of LAB is very strain dependent [
49].
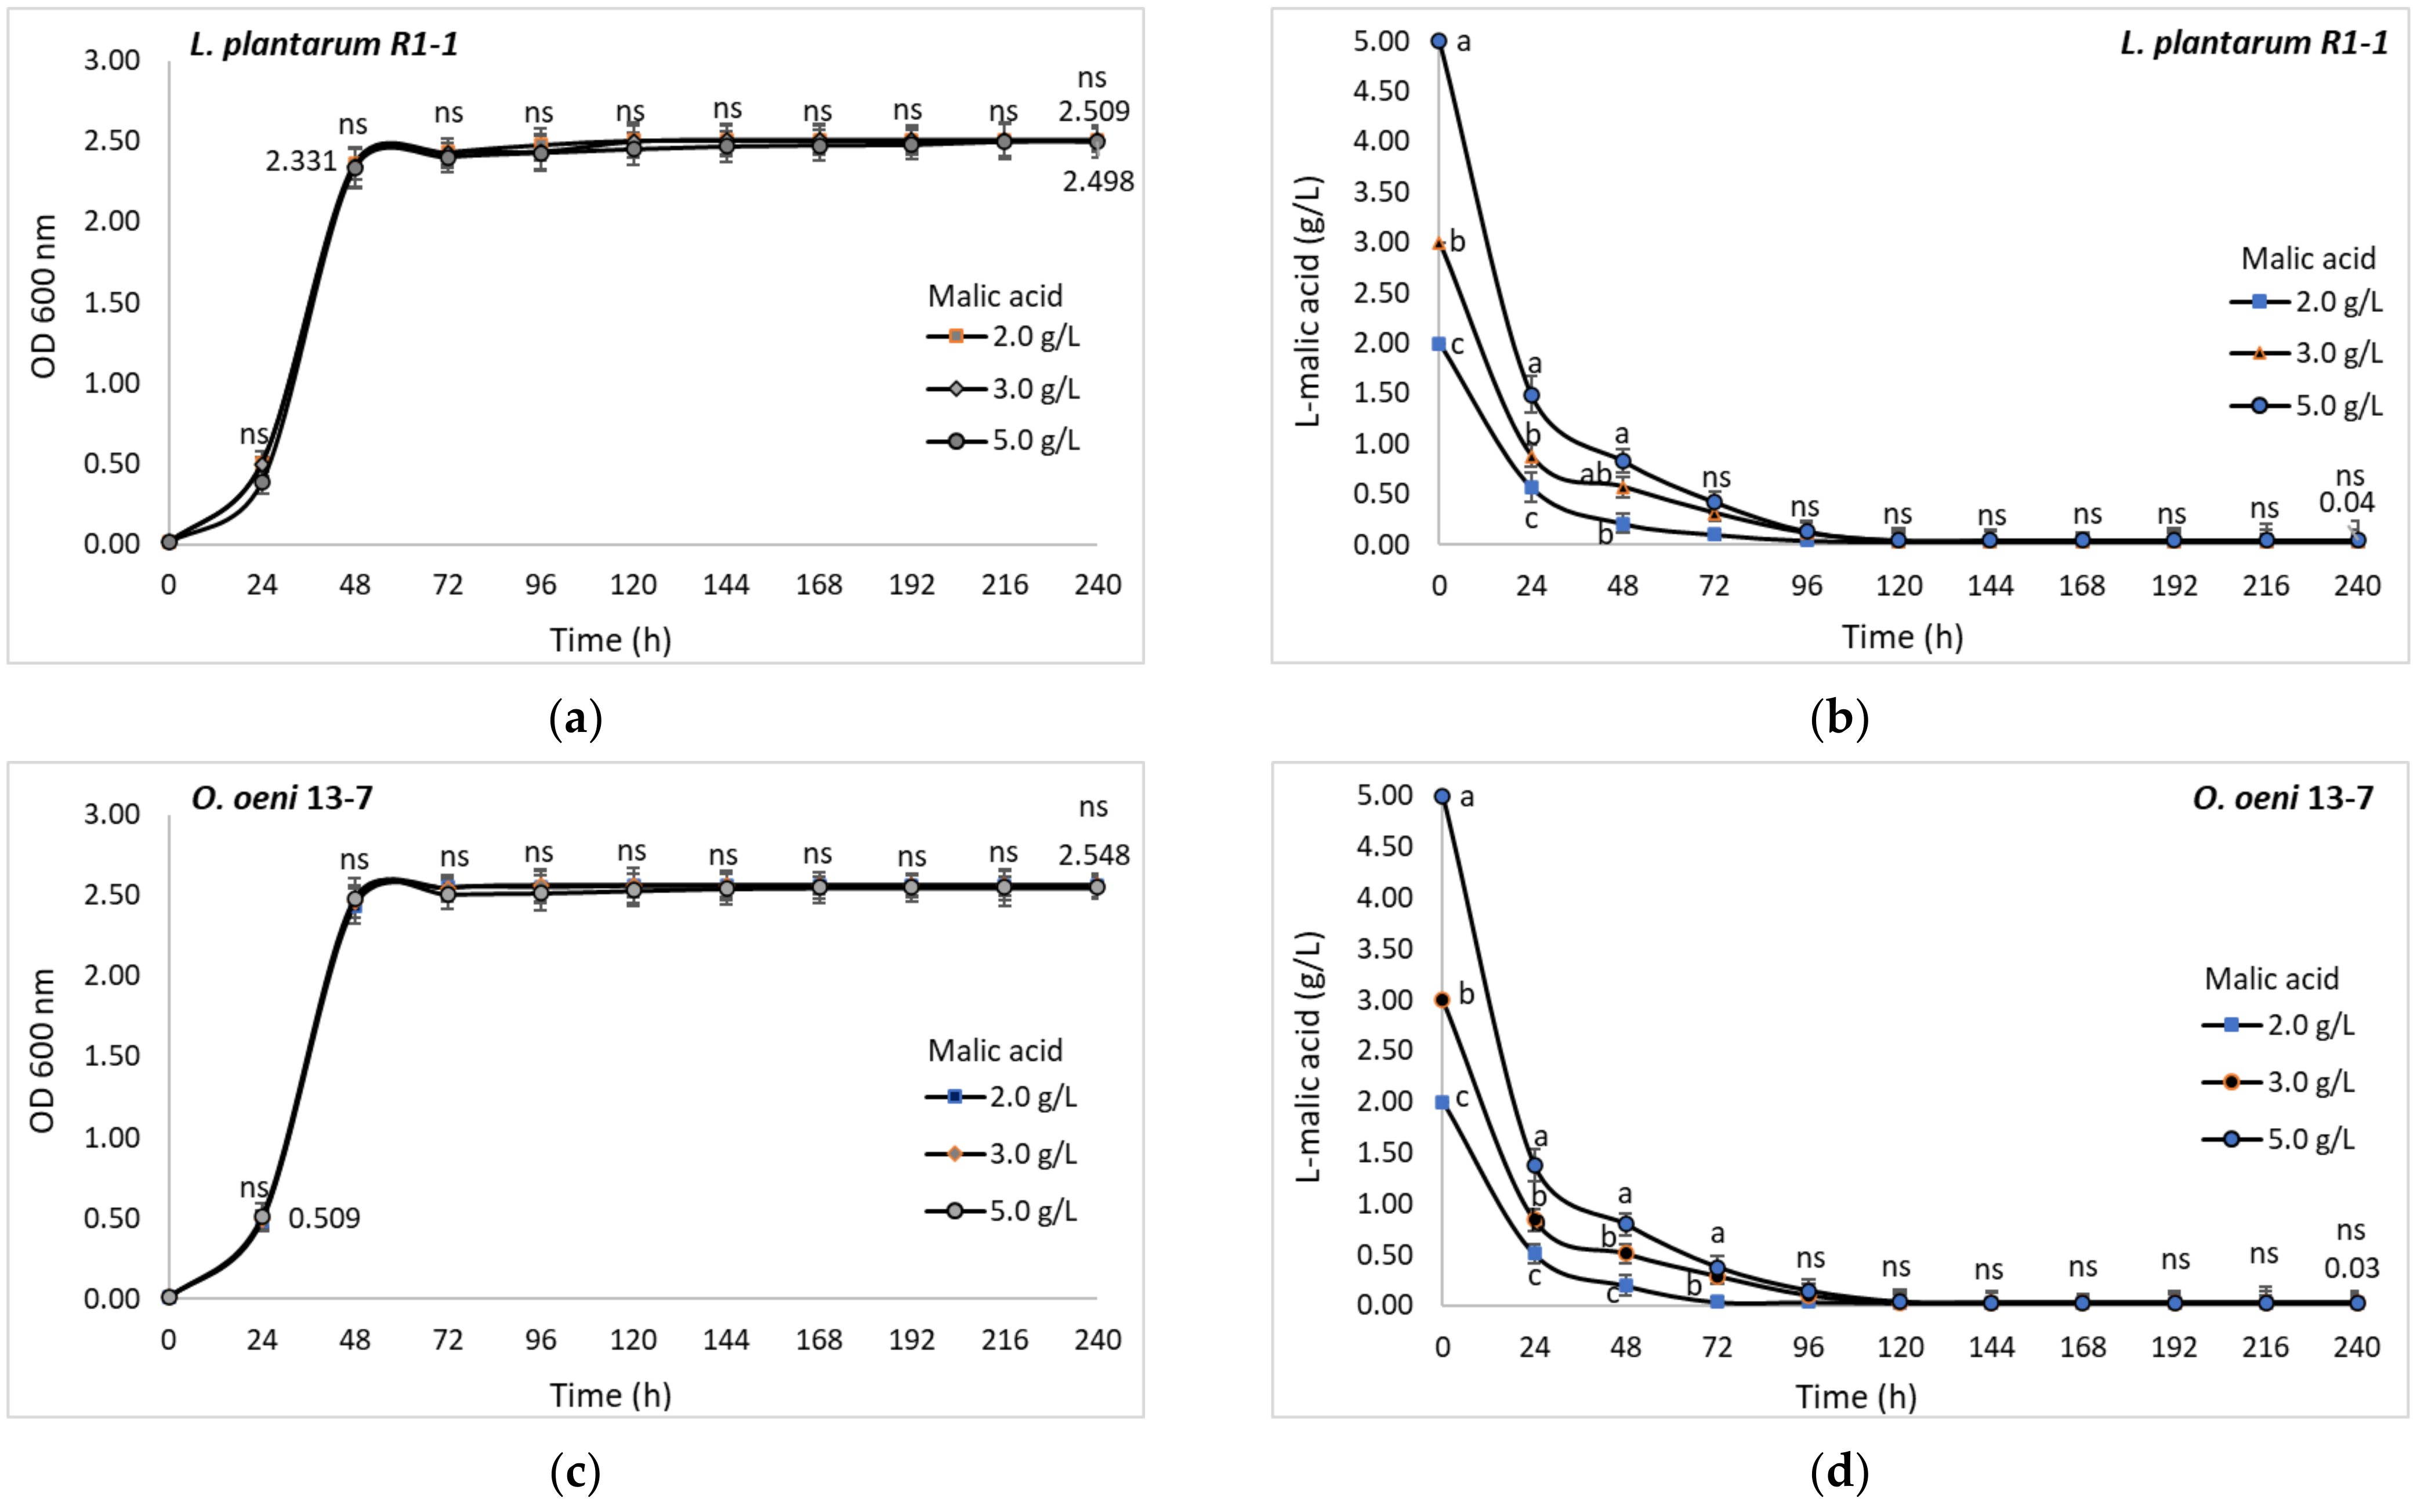
3.6.5. Malic Acid
Malic acid is the second major acid of grape wines, in concentrations that may vary from 2.0 to 5.0 g/L in grapes from cool climate to 1.0–2.0 g/L in musts from warm climates [
10,
51]. For this reason it is necessary for LAB strains to be able to convert different concentrations of malic acid depending on the climate area, cultivar, and type of wine. For both isolated LAB, the optical density of the bacterial cells did not significantly change with the increase of malic acid concentrations from 2 to 5 g/L. During the 10 days of incubation, the values followed the same trend up to an optical density between 2.487 and 2.509 for
L. plantarum strain R1-1 (
Figure 11a), and up to 2.561 for
O. oeni strain 13-7 (
Figure 11c).
Regardless of the initial acid concentrations, tested LAB consumed up to 99% of malic acid during 10 days of incubation in MRS-TJ broth at 28 °C (pH 4.0) (
Figure 11b,d). In this case, a clear overall correlation between optical density at 600 nm and malic acid conversion was found (r
2 = −0.8234).


 ,
, 


