Article

Valorization of Fruit Peels into Biovanillin and Statistical Optimization of Process Using Enterobacter hormaechei through Solid-State Fermentation

1
Institute of Biochemistry and Biotechnology, University of Veterinary and Animal Sciences, Lahore 54000, Pakistan
2
Centre for Applied Molecular Biology (CAMB), University of the Punjab, Lahore 53700, Pakistan
3
Scripps Institution of Oceanography, University of California San Diego, 9500 Gilman Drive, La Jolla, CA 92093, USA
4
Department of Food Science and Human Nutrition, University of Veterinary and Animal Sciences, Lahore 54000, Pakistan
5
Department of Biotechnology, University of Sargodha, Sargodha 40100, Pakistan
*
Authors to whom correspondence should be addressed.
Submission received: 15 December 2021 / Revised: 1 January 2022 / Accepted: 9 January 2022 / Published: 20 January 2022
(This article belongs to the Special Issue Food Wastes: Feedstock for Value-Added Products: 3rd Edition)

Abstract

:
Vanillin is a secondary metabolite of plants and the major organoleptic aroma component of natural vanilla. Nowadays, the chemical synthesis method used for vanillin production has been rejected by the United States and European legislation, while plant-derived vanillin is expensive. The current study demonstrates vanillin production via solid-state fermentation (SSF) by Enterobacter hormaechei using different ferulic acid-rich fruit peels as substrates. From different ferulic acid-rich fruit peels (pomegranate, banana, and orange) screened Punica granatum (pomegranate) peels yielded maximum biovanillin (0.09 mg/g) after 24 h. Different bioprocess parameters, including moisture content, inoculum size, pH, and temperature, were optimized using central composite design (CCD) of the response surface methodology (RSM). The maximum biovanillin yield (0.462 mg/g) from Punica granatum peels was achieved at 60% moisture content, 2 mL inoculum size, 6.5 pH, and 32 °C temperature. An F-value of 12.94 and a p-value of 0.00 were recorded by the variance analysis indicated the proposed model’s significance. The coefficient of determination (R2) confirmed the model’s goodness of fit, having a value of 91.89%, which indicated the model’s accuracy. The optimally produced biovanillin was extracted and confirmed using FTIR. Further purity analysis was done by HPLC and the biovanillin was reported to be 99.2% pure. The results demonstrated that microbial conversion of ferulic acid-rich fruit peels to biovanillin offers a cost-effective approach for the industrial production of biovanillin.

1. Introduction

Vanilla is a tropical orchid that belongs to the orchidaceae [1]. The fragrance and the flavor profile of vanilla extract consist of more than 200 components, and the critical component is vanillin, which constitutes 1.0–2.0% w/w of dry weight in cured vanilla pods [2]. Vanillin (4-hydroxy-3-methoxybenzaldehyde) is an essential organoleptic component of the vanilla flavor and is considered a secondary plant metabolite [3,4,5]. Physiochemically, it is a white crystalline powder with a sweet vanilla-like smell. It is an aromatic aldehyde that belongs to the group of simple phenolic compounds with the molecular formula of C8H8O3 [6,7]. Its functional groups are phenol, aldehyde, and ether. It is primarily used in the beverage, perfume, medical, pharmaceutical, and food industries. Food products are used as flavoring agents in soft drinks, creams, and cakes; as fragrances in food preparation, as apart of household products such as floor polish and air freshener, and as a food preservative because of its antioxidant and antimicrobial properties [8,9]. In the pharmaceutical industry, it is used to suppress the unpleasant taste of medicine and produce anti-mutagenic, anticonvulsant, antioxidant, and anticonvulsant drugs [10,11].
Naturally, vanillin is extracted from vanilla pods (Vanilla planifolia, Vanilla pompona and Vanilla tahitensis) but only less than 0.5% of vanillin is extracted from the pods that is insufficient to meet the industrial requirement. According to the literature, the annual consumption of vanilla worldwide is 12,000 tons, of which only 50 tons is natural vanillin extracted from vanilla pods because its cost is very high (1200–4000 $Kg−1) as compared to the chemically synthesized vanillin (<15 $Kg−1). The high price of natural vanillin is due to several reasons: limited availability of vanillin pods, climate changes, rigorous cultivation, harvesting, manual pollination, maturation of pods, and politico-economic decisions [7,11]. Nowadays, chemical synthesis for vanillin production via lignin and guaiacol is used to produce a cheaper product but of low quality. The process is environmentally unfriendly, and also the absence of substrate selectivity minimizes productivity. According to UK and EU legislation, chemically synthesized vanillin cannot be considered natural. Thus, the demand for natural flavor has increased, which cannot be fulfilled from botanical sources [12,13].
Biovanillin refers to as vanillin procured through the biotechnology process using natural precursors like eugenol, isoeugenol guaiacol, ferulic acid (FA), phenolic stilbenes, aromatic amino acids creosol, sugars, vanillic acid, vanillyl amine, and waste residues used to biotransform it by microorganisms or by isolated enzymes. Ferulic acid is an ideal precursor for biovanillin production due to its structural similarity to vanillin [10,14,15]. FA (4-hydroxy-3-methoxycinnamic acid) is an excellent natural aromatic product in plants, and it occurs as a constituent of cell walls in many agriculture crops, so the valorization of agricultural waste can be cost-effective as commercial FA is expensive [15,16,17]. Ferulic acid is present in large amounts in corn hulls (31.0 g/kg) followed by maize bran (30 g/kg), sugarbeet (5–10 g/kg), and wheat barley grains containing 6.6 and 1.4 g/kg, respectively. It is released when treated with alkali or by using enzymes such as ferulic acid esterases and cinnamoyl esterase used in conjunction with glycosyl hydrolases present in the plant cell wall [18]. Various fruit by-products such as pomegranate peels, banana peels, and orange peels were evaluated to obtain FA and the reported concentrations were 1.55 mg/g [19], 0.61 mg/g, and 0.339 mg/g FA, respectively [20].
Solid state fermentation has been recently used as a production technique because it has the advantage of the utilization of agro-industrial residues as the substrates for production processes. The interest in SSF is due to its low energy requirements, utilization of cheap substrates and achievement of a high yield of products. In this way, sterilization and agitation can be reduced so less energy is required, and therefore the production cost of certain products can be minimized compared to submerged fermentation (SmF). However, there are certain disadvantages, such as homogeneity of culture and heat transfer [11].
Many fruit wastes that include fruit residues, seeds, and peels are discarded by the fruit and juice processing industry [19]. The disposal of these wastes is a primary environmental concern. The present study was designed to utilize these fruit by-products to add value. Different ferulic acid-rich substrates, such as Punica granatum (pomegranate), Musa acuminata (banana), and Citrus reticulata (orange) peels were screened to produce biovanillin using Enterobacter hormaechei by SSF. Enterobacter hormaechei was reported by Mazhar et al. [21] and Saeed et al. [22] for the production of biovanillin using rice bran oil and banana peels. According the Mazhar et al. [21], the highest production of vanillin (5.2 g) was reported using Enterobacter hormaechei as compared to other bacterial strains ever reported in literature. The selection of the host is based on its ability to tolerate the substrate and products such as vanillin which are toxic compounds. A major drawback in vanillin production through ferulic acid via the microbial route is the high cost of ferulic acid, so ferulic acid-rich fruit peels were utilized in this research. In microbial strains, five pathways for the bioconversion of ferulic acid to vanillin are mention in the literature: (1) CoA-independent retro-aldol reaction, (2) CoA-dependent retro-aldol reaction, (3) CoA-dependent β-oxidation, (4) non-oxidative decarboxylation, and (5) a reductive metabolism route. Actinomycetes such as Streptomyces setonii (6.4 g/L) and Amycolatopsis species (11.5 g/L) can tolerate ferulic acid and accumulate high quantities of vanillin [23]. The optimization of biovanillin production was done using response surface methodology (RSM) design. The central composite design (CCD) of RSM provides an understanding of the interaction between different parameters. It has been used successfully for developing, improving, and optimizing various production processes [24]. The manifestation of the efficacy of the RSM tools is essential to move us towards the effective use of natural resources, including biomass [25]. To the best of our knowledge, the current work is the first report on the valorization of fruit peels into biovanillin through SSF using Enterobacter hormaechei.

2. Materials and Methods

2.1. Chemicals

Standard vanillin, ferulic acid, and 2-thiobarbituric acid were purchased from Sigma Aldrich. Different fruit peels were obtained from the local market of Lahore. Other chemicals were acquired from the postgraduate lab of the Institute of Biochemistry and Biotechnology, the University of Veterinary and Animal Sciences, Lahore, Pakistan.

2.2. Collection of Substrates

Different fruit peels, Punica granatum (pomegranate), Musa acuminata (banana), and Citrus reticulata (orange), were obtained from the local market of Lahore. The fruit peels were rinsed, cut into smaller pieces, and oven-dried at 60 °C for 48 h. Then, they were ground into a powder form by using an electrical grinder that acts as a source of ferulic acid. The proximate analysis of the fruit peels was performed according to the AOAC method.

2.3. Estimation of Theferulic Acid Content of Different Fruit Peels

A total of 5 g of powder was accurately weighed and placed in an Erlenmeyer flask of 250 mL, and saponification was carried out with 60 mL NaOH (prepared by adding 2 M NaOH, 30% ethanol, 15% ammonia) on a rotary shaker at room temperature, 180 rpm for 24 h. To avoid the degradation of FA, 0.001 g of NaHSO3 was added to the flask. The alkaline hydrolysate was centrifuged, then the supernatant was acidified (pH 1–2) using 2 M diluted HCl, and the ferulic acid-rich fraction was elicited using 60 mL ethyl acetate (thrice). The ethyl acetate was evaporated using the rotary vacuum evaporator, and the collected ferulic acid fractions were concentrated up to 2–3 mL [17].
The 3-fold dilution of the brownish extract was done with 95% ethanol. Centrifugation of the murky solution occurred for 20 min at 11,000 rpm. A rotary evaporator was used to vacuum-evaporate the supernatant to purify the ferulic acid. Further purification was done by adding 6 mL of anhydrous ethanol in a murky solution to reduce its intensity. It was centrifuged again for 20 min at 11,000 rpm, and the supernatant was evaporated [25]. The concentrated extract was dissolved in a 2 mL mixture of acetonitrile or water (1:1) before the quantitative analysis of the ferulic acid. Ferulic acid in the solution gave maximum absorbance at 310 nm. A standard curve of ferulic acid with known concentration was used to detect the concentration of ferulic acid in the sample [26].

2.4. Microorganism Maintenance and Inoculum Preparation

Enterobacter hormaechei (KT385666) was obtained from Government College University, Lahore. The culture was refreshed on sterilized nutrient agar petri plates and incubated at 30 °C for 24 h. It was then maintained on nutrient agar slants, preserved at 4 °C, and revived periodically. A loop full of culture was transferred to the sterilized nutrient broth and placed in an orbital shaker at 130 rpm at 30 °C for 24 h, until the OD of 0.6 (3.8 × 10⁶ cells/mL that indicates that microorganism is in growth phase) was obtained at 600 nm. This was used as an inoculum for the fermentation experiments [27].

2.5. Selection of Best Substrate for Biovanillin Production through Solid-State Fermentation

Different substrates (pomegranate, banana, and orange peels) were added to a 250 mL Erlenmeyer flask, and the substrate water ratio was set at 1:3 w/v using sterilized basal media. The composition of the basal medium was (g/L) 20 g glucose, 8 g yeast extract, 0.2 g K2HPO4, 0.5 g MgSO4, 1.3 mg CaCl2 [21] (with some modifications). Then 2 mL of inoculum was added to a sterilized fermentation medium. It was incubated at 30 °C and pH 7 for 24 h in an incubator for the bioconversion of the ferulic acid present in the fruit peels to biovanillin.

2.6. Optimization of the Fermentation Process for Maximum Production of Biovanillin

After selecting the best substrate, different cultural conditions were optimized for the maximum production of biovanillin by response surface methodology. Different parameters selected for optimizing the biovanillin output included: moisture content 40–80%, inoculum size 1–5 mL, pH 5–10, incubation temperature 25–50 °C. Minitab software version 17 generated 31 trials containing four factors with different combinations of parameters to investigate their individual and combined effects on biovanillin yield using the central composite design (CCD) of response surface methodology (RSM).

2.7. Extraction of Biovanillin and Quantitative Estimation

The fermented media was diluted with 25 mL distilled water. Then it was centrifuged at 10,000 rpm for 10 min. To evaluate biovanillin concentration in the supernatant, a thiobarbituric acid (TBA) assay was used. In a sample test tube, 50 µL of culture supernatant was taken, then 950 µL of 2-thiobarbituric acid solution prepared by adding 24% HCl (500 µL), 1% 2-thiobarbituric acid (200 µL), and 250 µL of distilled water was added, and the final volume was adjusted to 3 mL. Standard solutions of vanillin (1 mL) of known concentrations (100–1000 µg/50 µL) were prepared. The test tubes were incubated at 55 °C for 1 h in a water bath, then cooled down at room temperature for 20 min. A yellowish-orange color appeared in the test tubes, and the absorbance was recorded at 434 nm by spectrophotometer (Cecil Aquarius CE 7400S, England). A standard curve was plotted by determining the OD values of standard solutions of vanillin, and the concentration of biovanillin in the sample was estimated [10].

2.8. Crystallization of Biovanilin from Total Fermented Media

The fermented medium was centrifuged at 10,000 rpm for 10 min to remove the biomass from fermentation media. Acidification of the supernatant to pH 2 was done by using 6 N HCL. Then, phenolic compounds were extracted by adding 3 volumes of ethyl acetate to the supernatant. Evaporation of the solvent was carried out at 55 °C by using a rotary evaporator (Heidolph Hei-VAP Gold 1 Rotary Evaporator, Germany). The obtained powder was added to water, and to precipitate biovanillin, it was refrigerated at 4 °C [28]. Finally, the precipitates obtained were dried for further analysis.

2.9. Identification and Quantitative Assessment of Crystallized Vanillin

Identification of the biovanillin was performed after crystallization by an FTIR spectrophotometer (ALPHA II Compact FT-IR Spectrometer, Germany). For quantitative assessment, the HPLC method was used. In both procedures, the standard of pure vanillin from Sigma Aldrich was used. Water: methanol (40:60) was used as the mobile phase, and a C18, 5 µm bead pore size column (4.6 × 150 mm) was used as stationary phase. The standard and samples of vanillin (50 ppm) were injected at 10 µL volume, 1 mL/min flow rate, 35 °C oven temperature, and at 280 nm detection was performed [22].

3. Results and Discussion

3.1. Estimation of Nutritional Potential and Ferulic Acid Extracted from Fruit Peels

The proximate analysis of pomegranate peels indicated the presence of 5% moisture, 10% crude fat, 22% crude fiber, 1.8% nitrogen free extract and 9.2% crude protein. Banana peel proximate analysis indicated the presence of 9.4% moisture, 15% lipids, 14% crude fiber, 55% N.F.E and 4% crude protein. A total of 11% moisture, 3% crude fat, 13% crude fiber, 17% crude protein and 56% N.F.E were observed after the proximate analysis of the orange peels. By liquid-liquid and solid-liquid extraction, 160 ± 0.35 mg, 55 ± 0.08 mg, and 25 ± 0.04 mg of ferulic acid were extracted from 100 g of the pomegranate, banana, and orange peel powders, respectively. Zaki et al. [19] reported 1.44 mg/g from methanol peels to extract production rate from a manfalouty variety of pomegranate. Singh et al. [20] reported 0.61 ± 0.4 mg/g and 0.33 ± 0.2 mg/g production rates from banana and orange peels using 80% methanol, respectively.

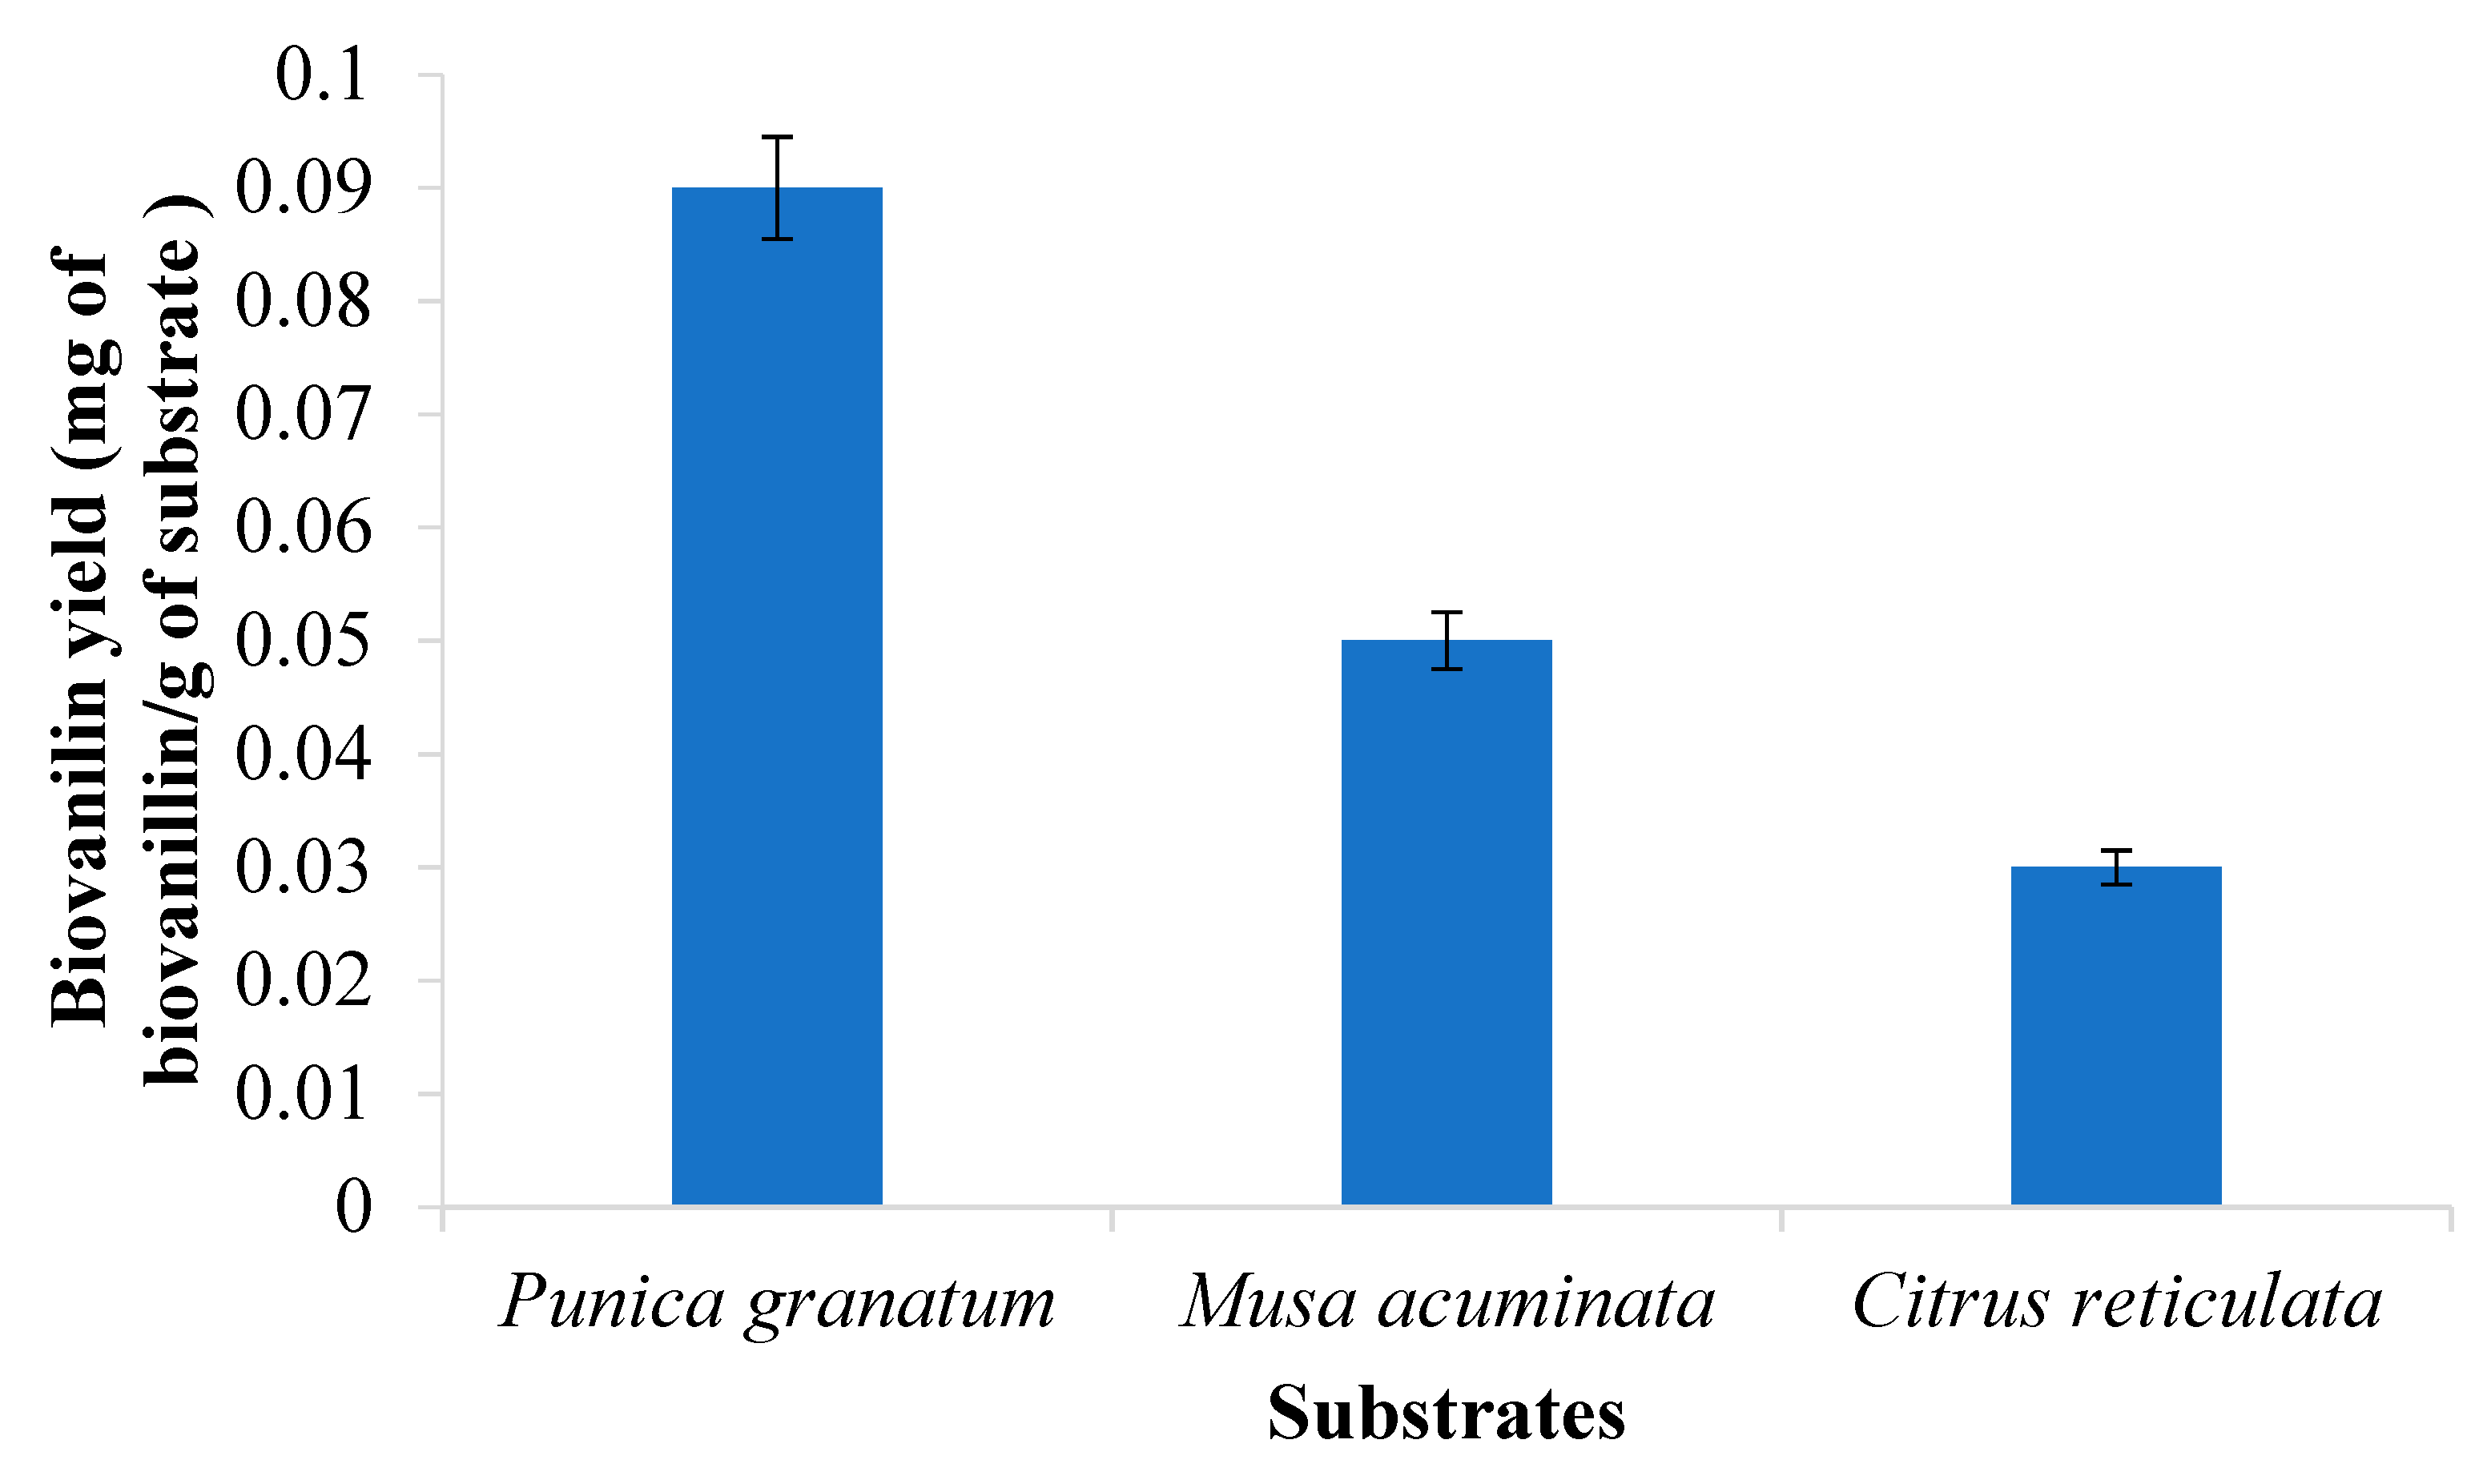
3.2. Screening of Best Substrate for Biovanillin Production

Enterobacter hormaechei was cultured for 24 h in a fermentation medium containing different substrates: Punica granatum (pomegranate), Musa acuminata (banana), and Citrus reticulata (orange) peels, at ratios of 1:3 w/v, adjusted by adding the basal media for the production of biovanillin. After the incubation period, all samples were analyzed individually to check the production of biovanillin. Ferulic acid content was present in the Pomegranate peels (1.55 mg/g), banana peels (0.61 mg/g) and orange peels (0.07 mg/g). Maximum biovanillin (0.09 mg/g) was observed in the Punica granatum peels, followed by Musa acuminata peels (0.05 mg/g) and Citrus reticulata peels (0.03 mg/g) by solid-state fermentation, as shown in Figure 1.

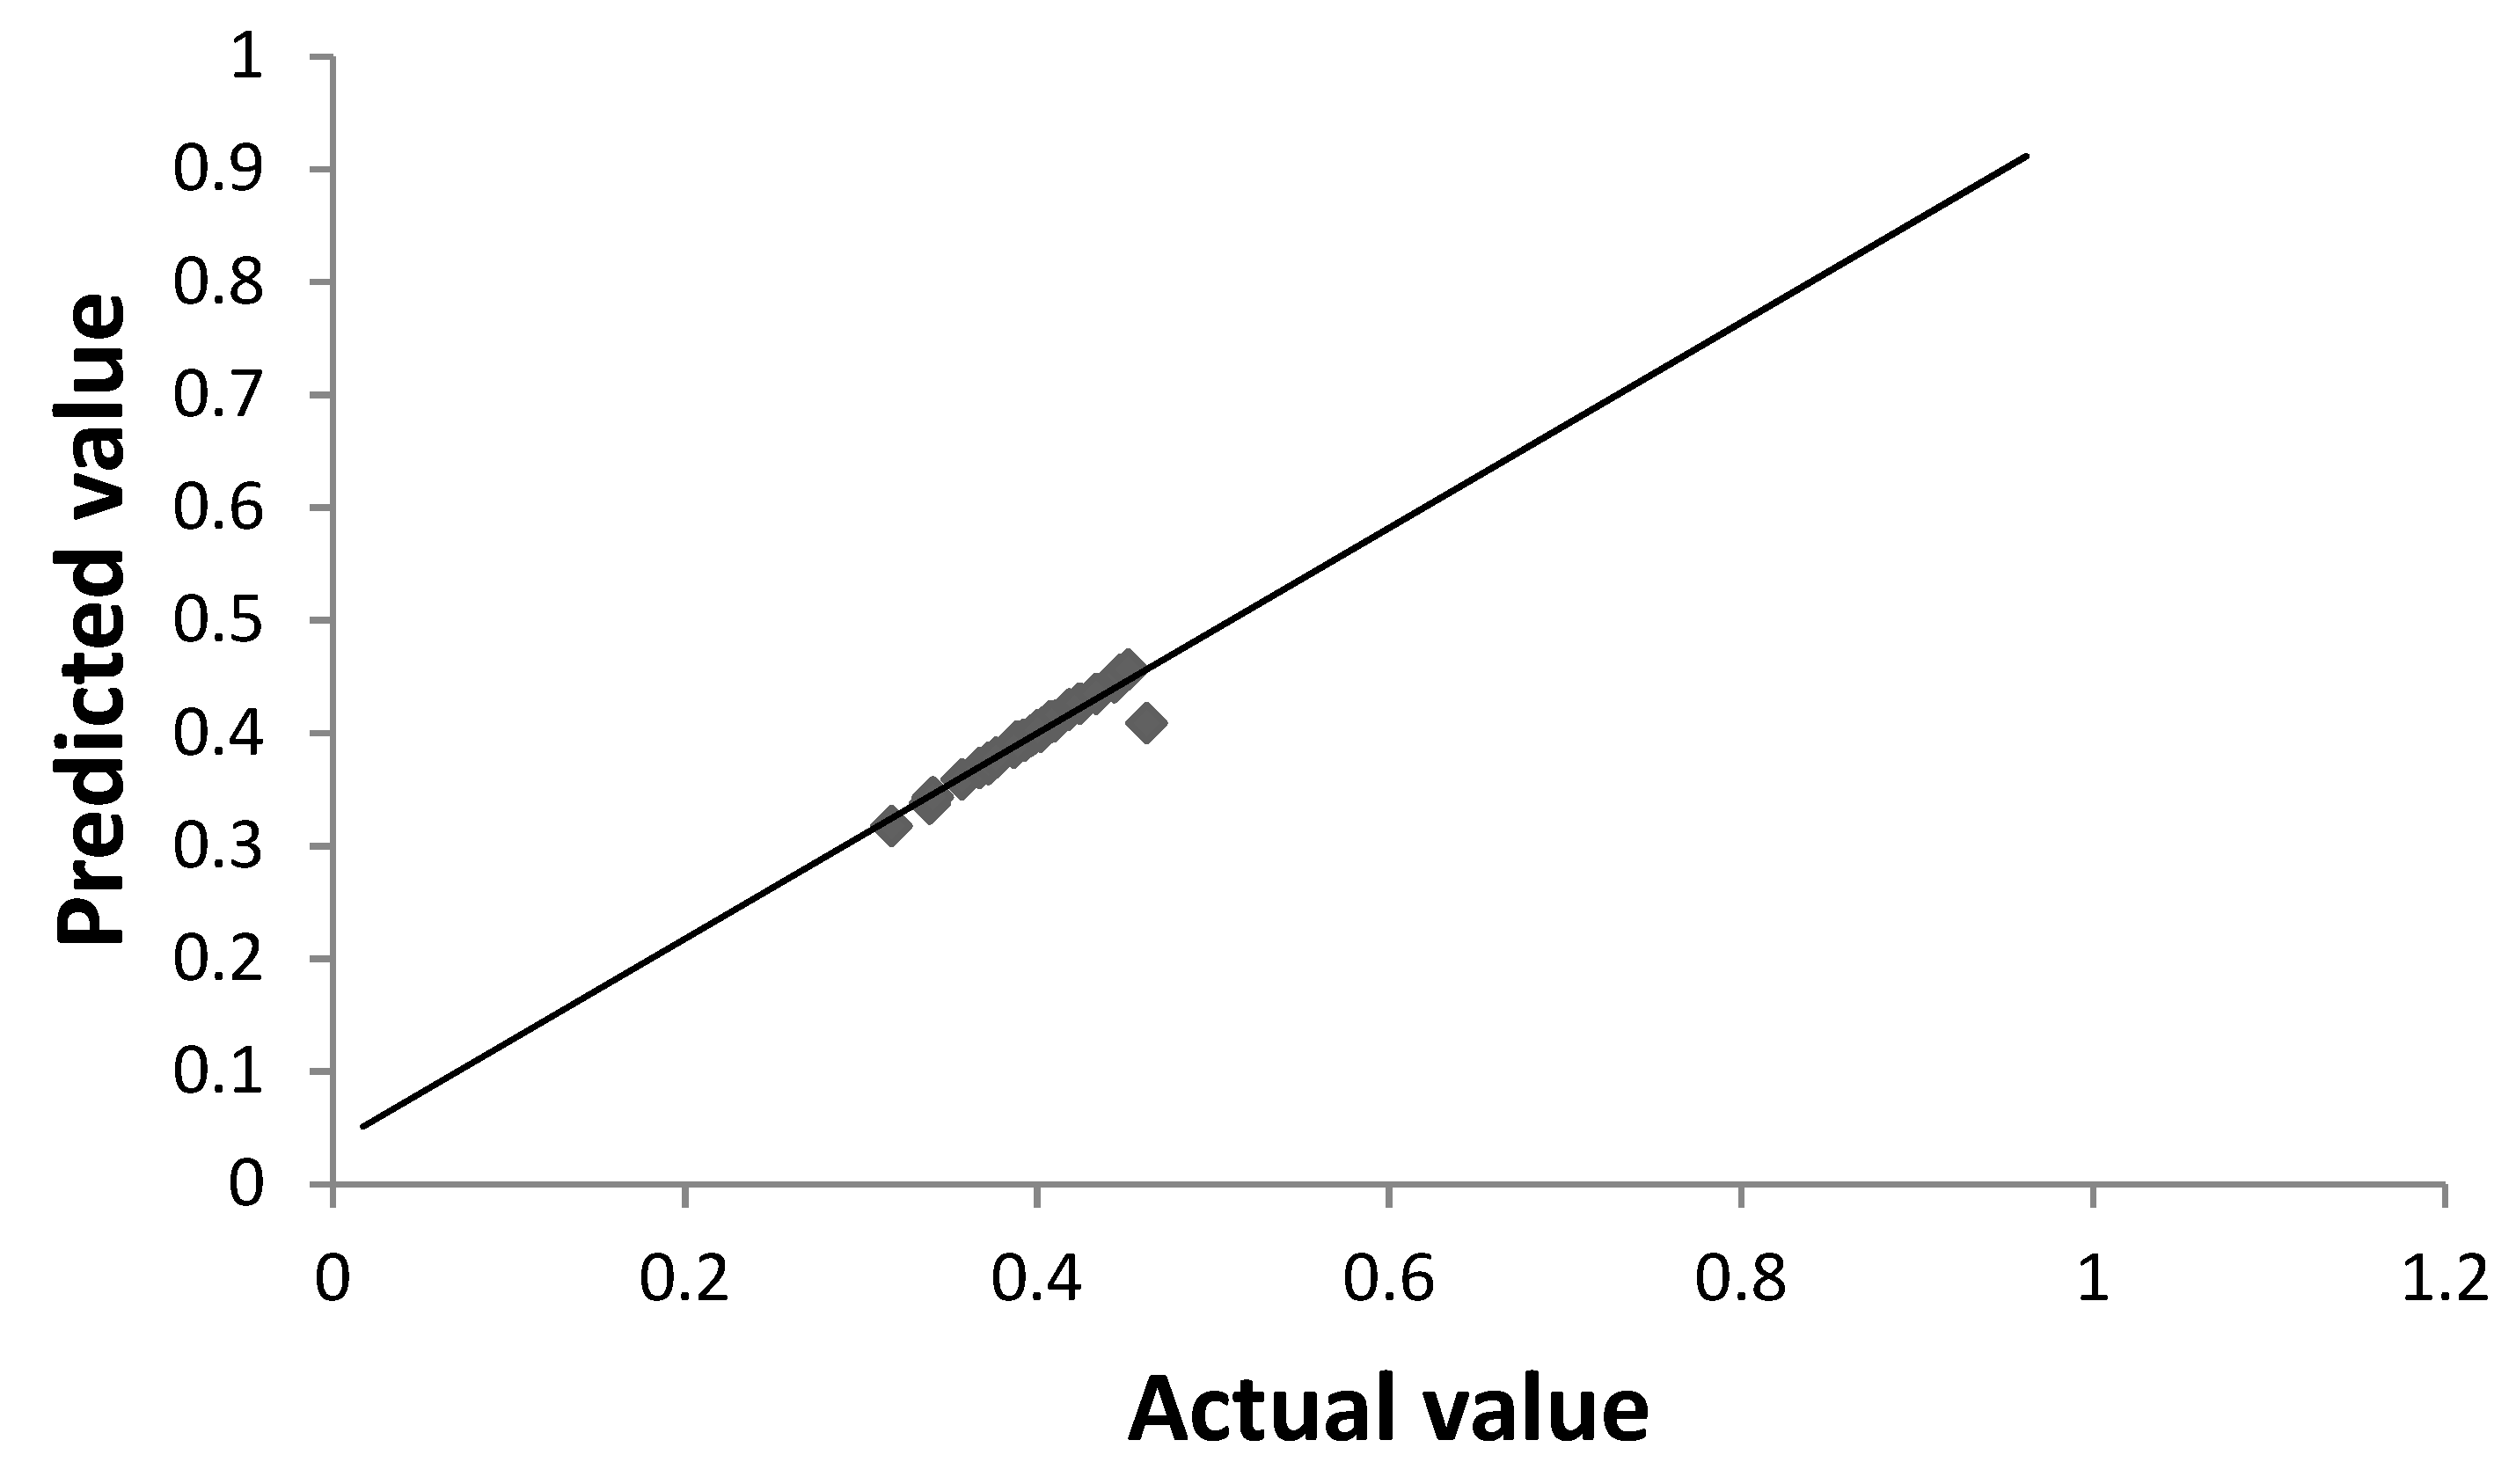
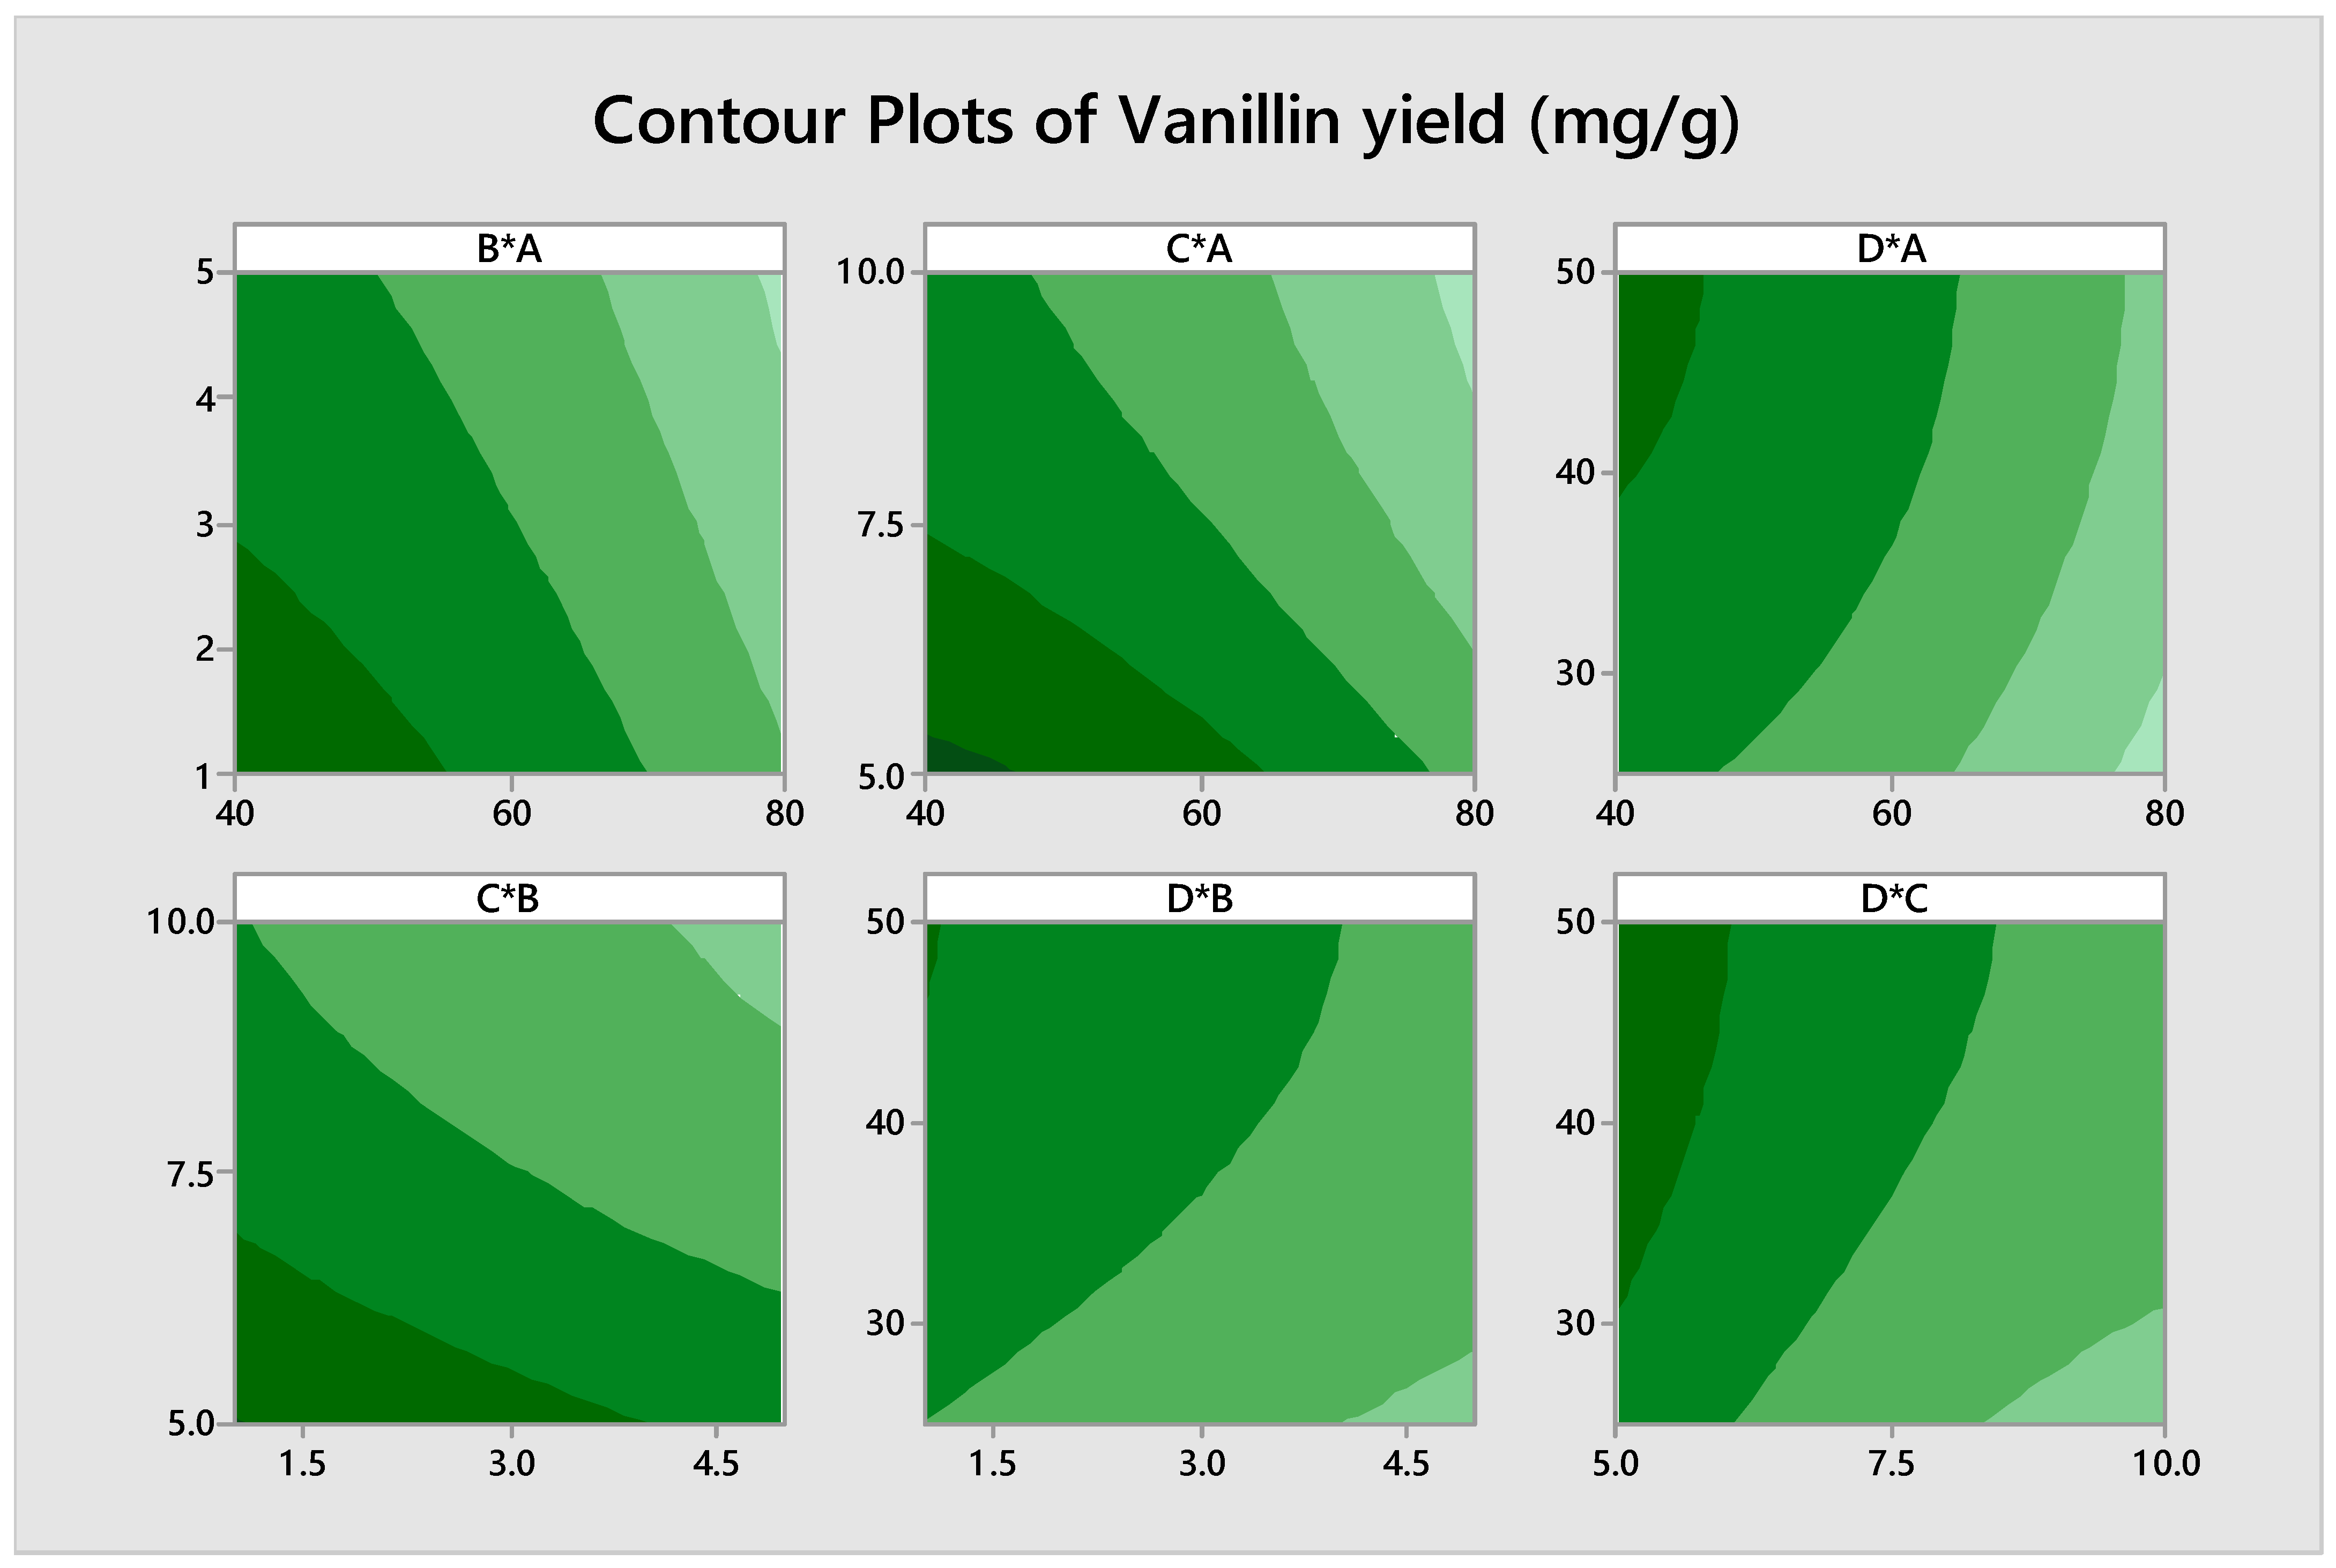
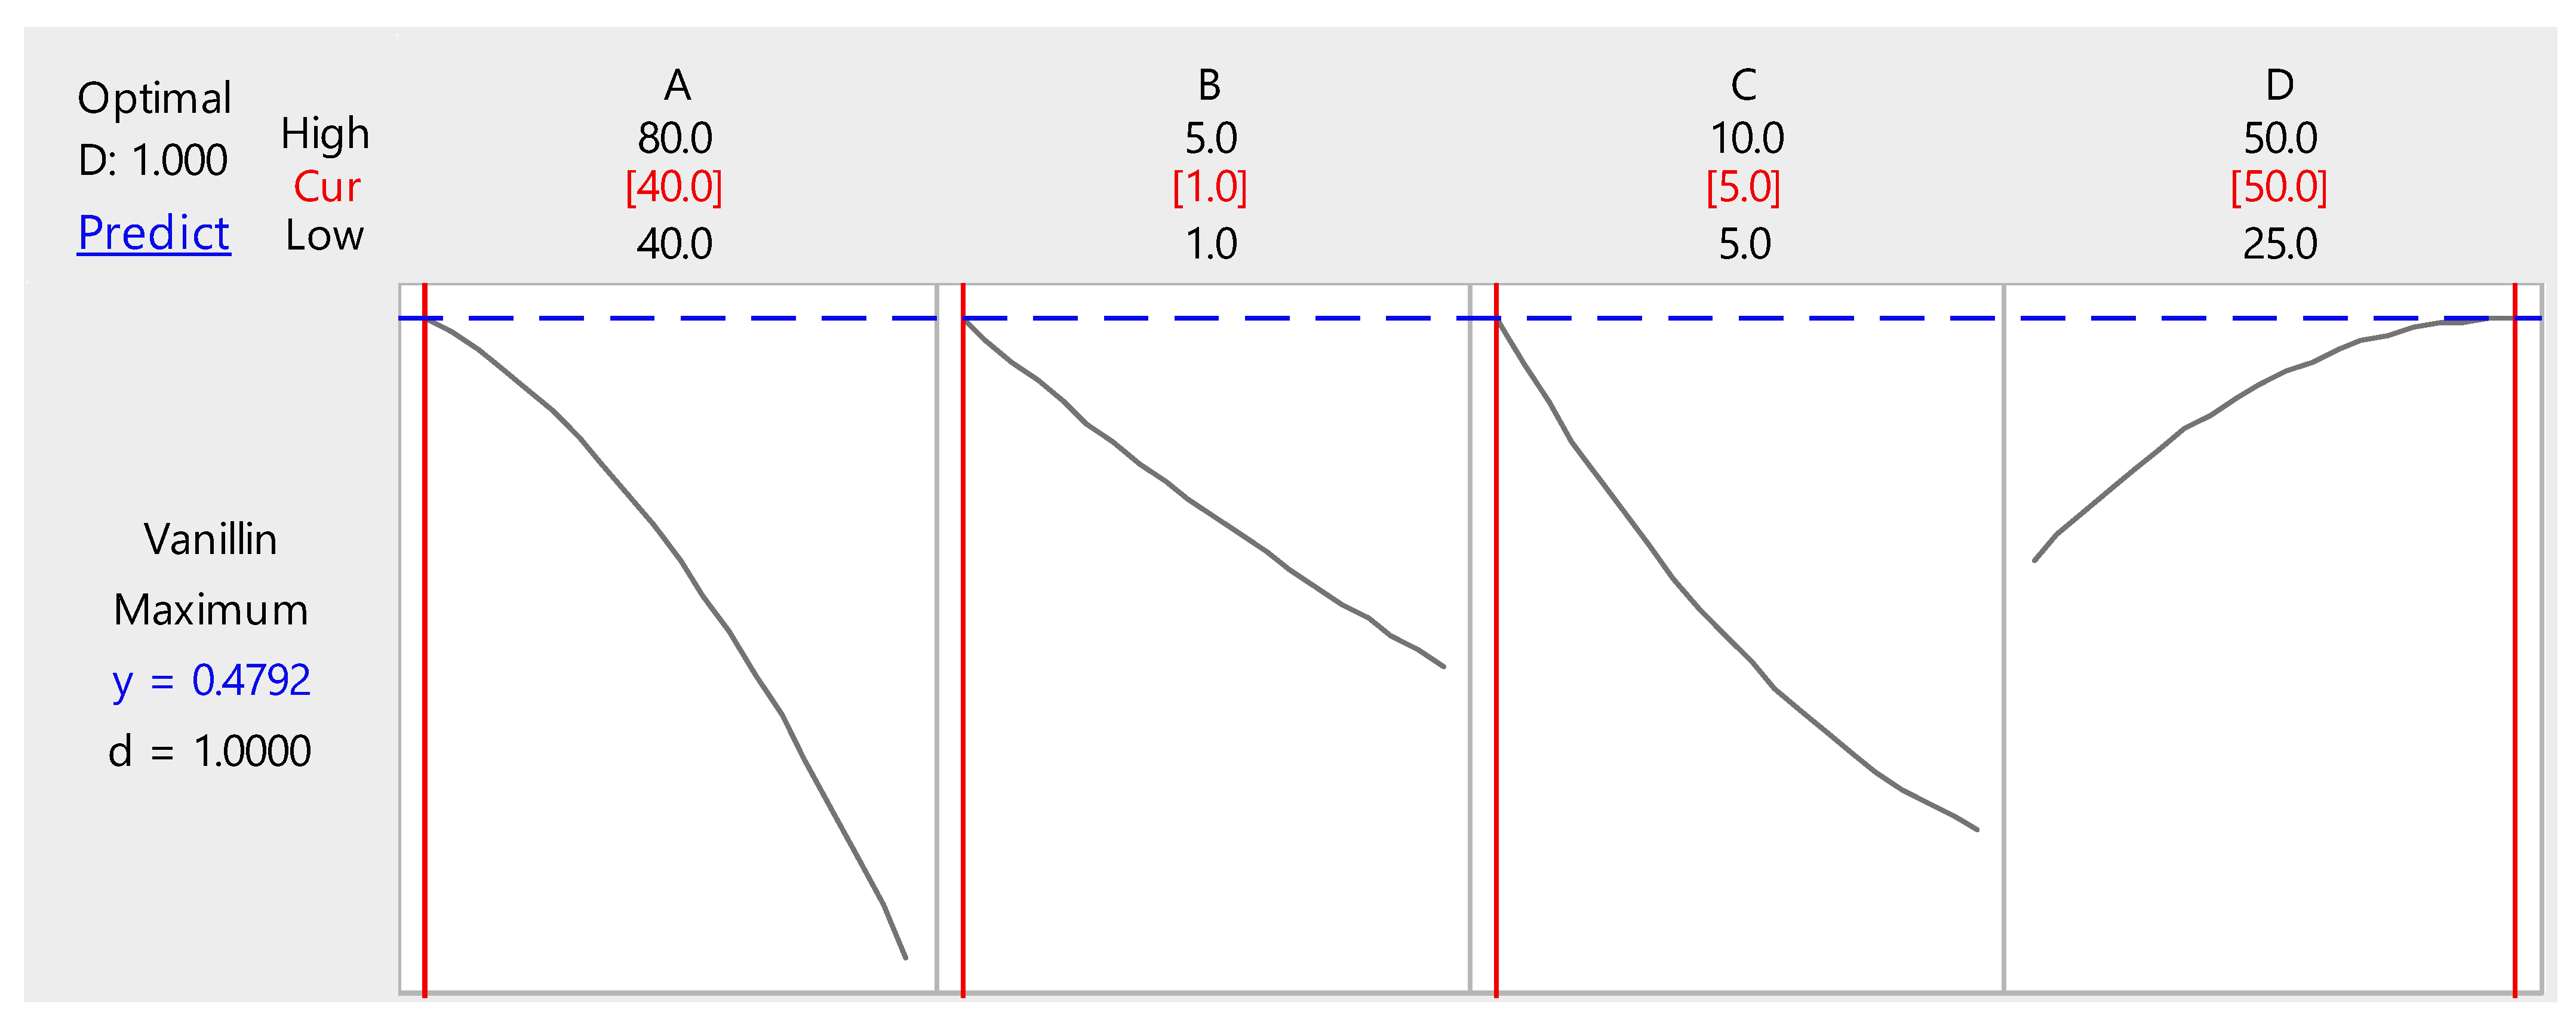
3.3. Optimization of Biovanillin Production Process by RSM

After screening of the substrates, Punica granatum was chosen as a substrate to produce biovanillin. Different physical parameters like moisture content, inoculum size, pH, and temperature were optimized by RSM through central composite design to achieve the high amounts of biovanillin by SSF. The experimental range and levels of independent variables for biovanillin production are shown in Table 1. Minitab software version 17 was used to generate 31 trials containing four factors. The maximum biovanillin production (0.462 mg/g from pomegranate peels) was observed at moisture content 60%, inoculum size 2 mL, pH 6.5, and temperature of 32 °C, incubated for 24 h. The minimum production (0.31 mg/g) was attained at moisture content 80%, inoculum size 4 mL, pH 10, and temperature of 25 °C for 24 h. It was observed that 0.75 mg of ferulic acid per gram of the pomegranate peels was left over in the fermentation media. Hence, 0.8 mg of ferulic acid, for a total of 1.55 mg, was utilized for the formation of the 0.462 mg of biovanillin. A product yield of 57.75% was obtained by the ferulic acid present in pomegranate peels. The experimental and predicted values of the response variables for biovanillin production are summarized in Table 2. An exceptional consensus was observed between the experimental and predicted values.
The ANOVA table depicts the suggested model as having an F-value of 12.94 and a p-value 0.00, showing its significance. The goodness and the precision of the model were determined by the R2 (coefficient of determination), showing a value of 91.89%, and the adjusted R2 (adj. R2 = 84.79%) was close to the predicted determination coefficient (pred. R2 = 82.85%). It was calculated that 8.11% of the divergence was not predicted by the design for biovanillin production. The effect of various factors on the production of biovanillin was considered significant if the p-value was <0.05. From the ANOVA table, it was established that factor A (moisture content), factor B (inoculum size), factor C (pH), and factor D (temperature) had a significant effect on biovanillin production by SSF. The interactive effects among several factors are shown in Table 3.
The response regression equation obtained from Minitab software 17 is given in the equation below. This equation summarized the relationship between the dependent variable (biovanillin yield) and the independent variables (moisture content, inoculum size, pH, and temperature).
Biovanillin yield (mg/g) = 0.507 + 0.00098 A − 0.0098 B − 0.0286 C + 0.00343 D − 0.000023 A∗A
+ 0.00039 B∗B + 0.00119 C∗C − 0.000037 D∗D − 0.000005 A∗B − 0.000000 A∗C
+ 0.000004 A∗D + 0.00006 B∗C − 0.000019 B∗D + 0.000022 C∗D
Figure 2 shows that the observed values are almost similar to the predicted values, and the biovanillin yield declined after the optimum conditions. The contour plots of the RSM depict the relationships among different parameters, like moisture content, inoculum size, pH, and temperature, as shown in Figure 3. These plots exist between any two independent variables, and the value of the third variable remained fixed to obtain the optimum conditions. In these plots, color variations show different levels of biovanillin production.
The desirability chart for biovanillin production by Enterobacter hormaechei through solid-state fermentation is shown in Figure 4. These charts demonstrate that if the value of parameters A, B, C and D are set to 40.0%, 1.0 mL, 5.0, and 50.0 °C, respectively, the maximum predicted yield would be 0.4792 mg/g. When the values of the several parameters were compared, this response was close to the expected values, confirming the reliability of the model prediction.

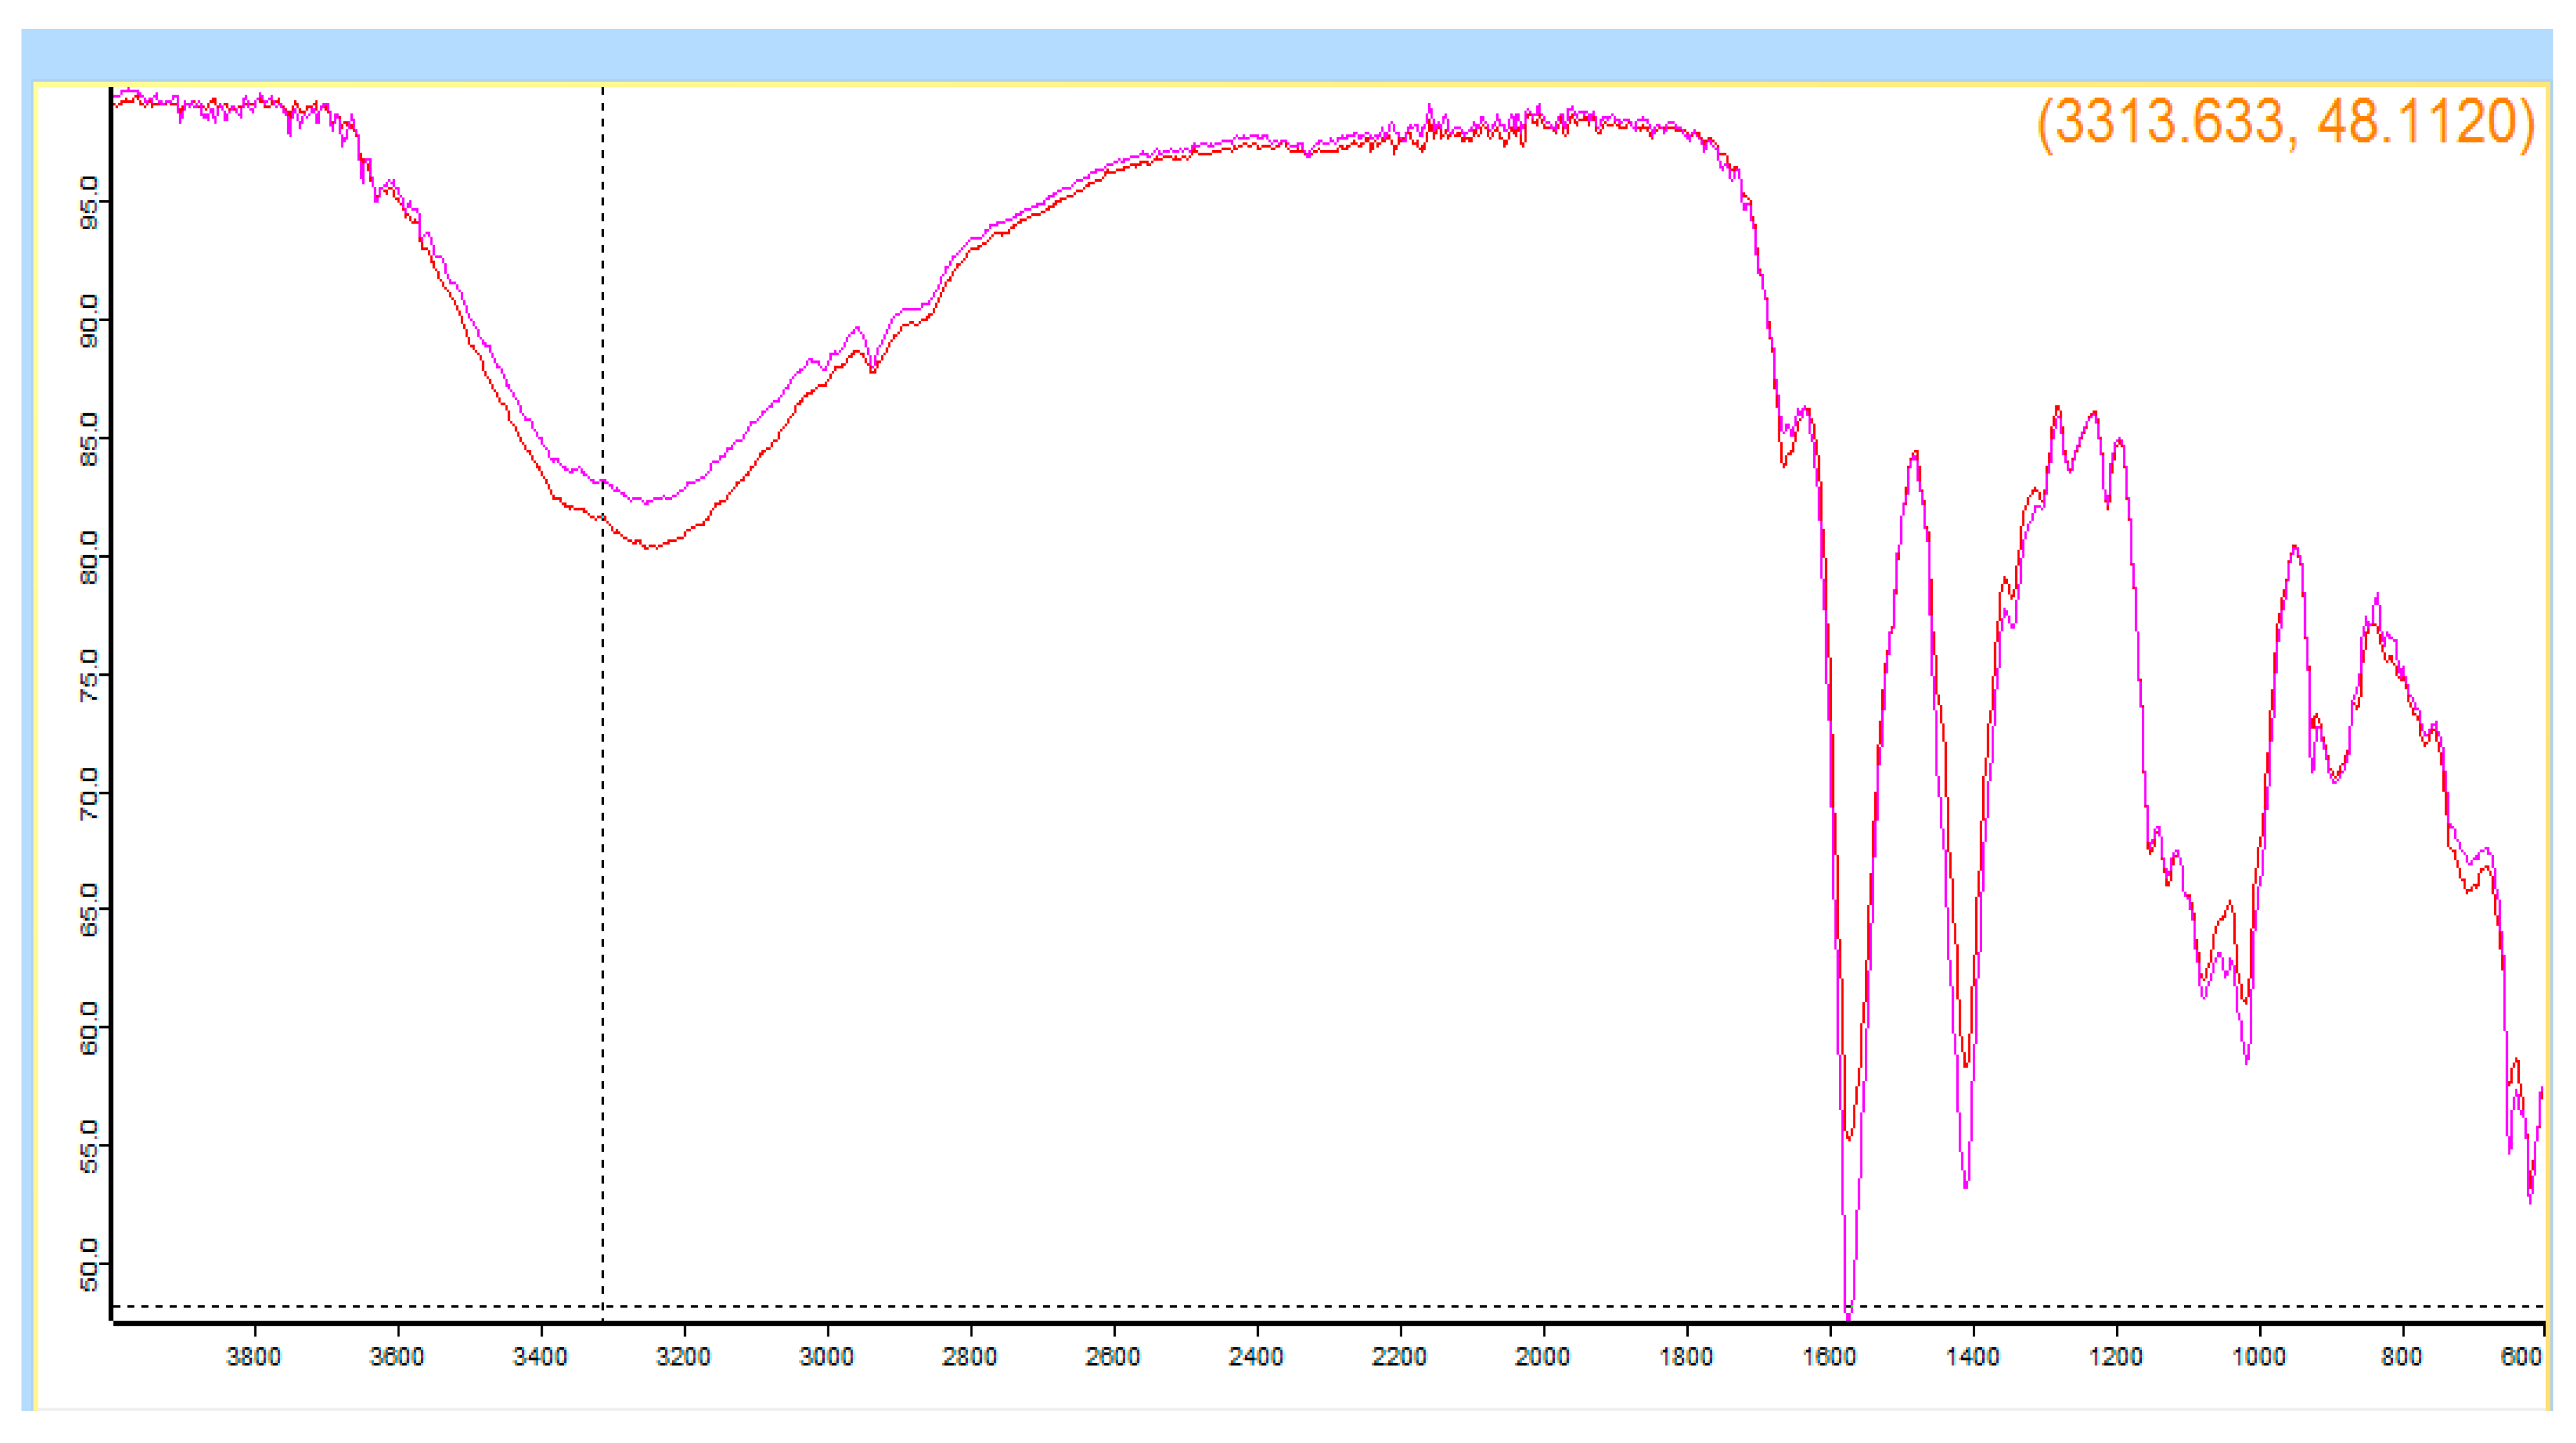
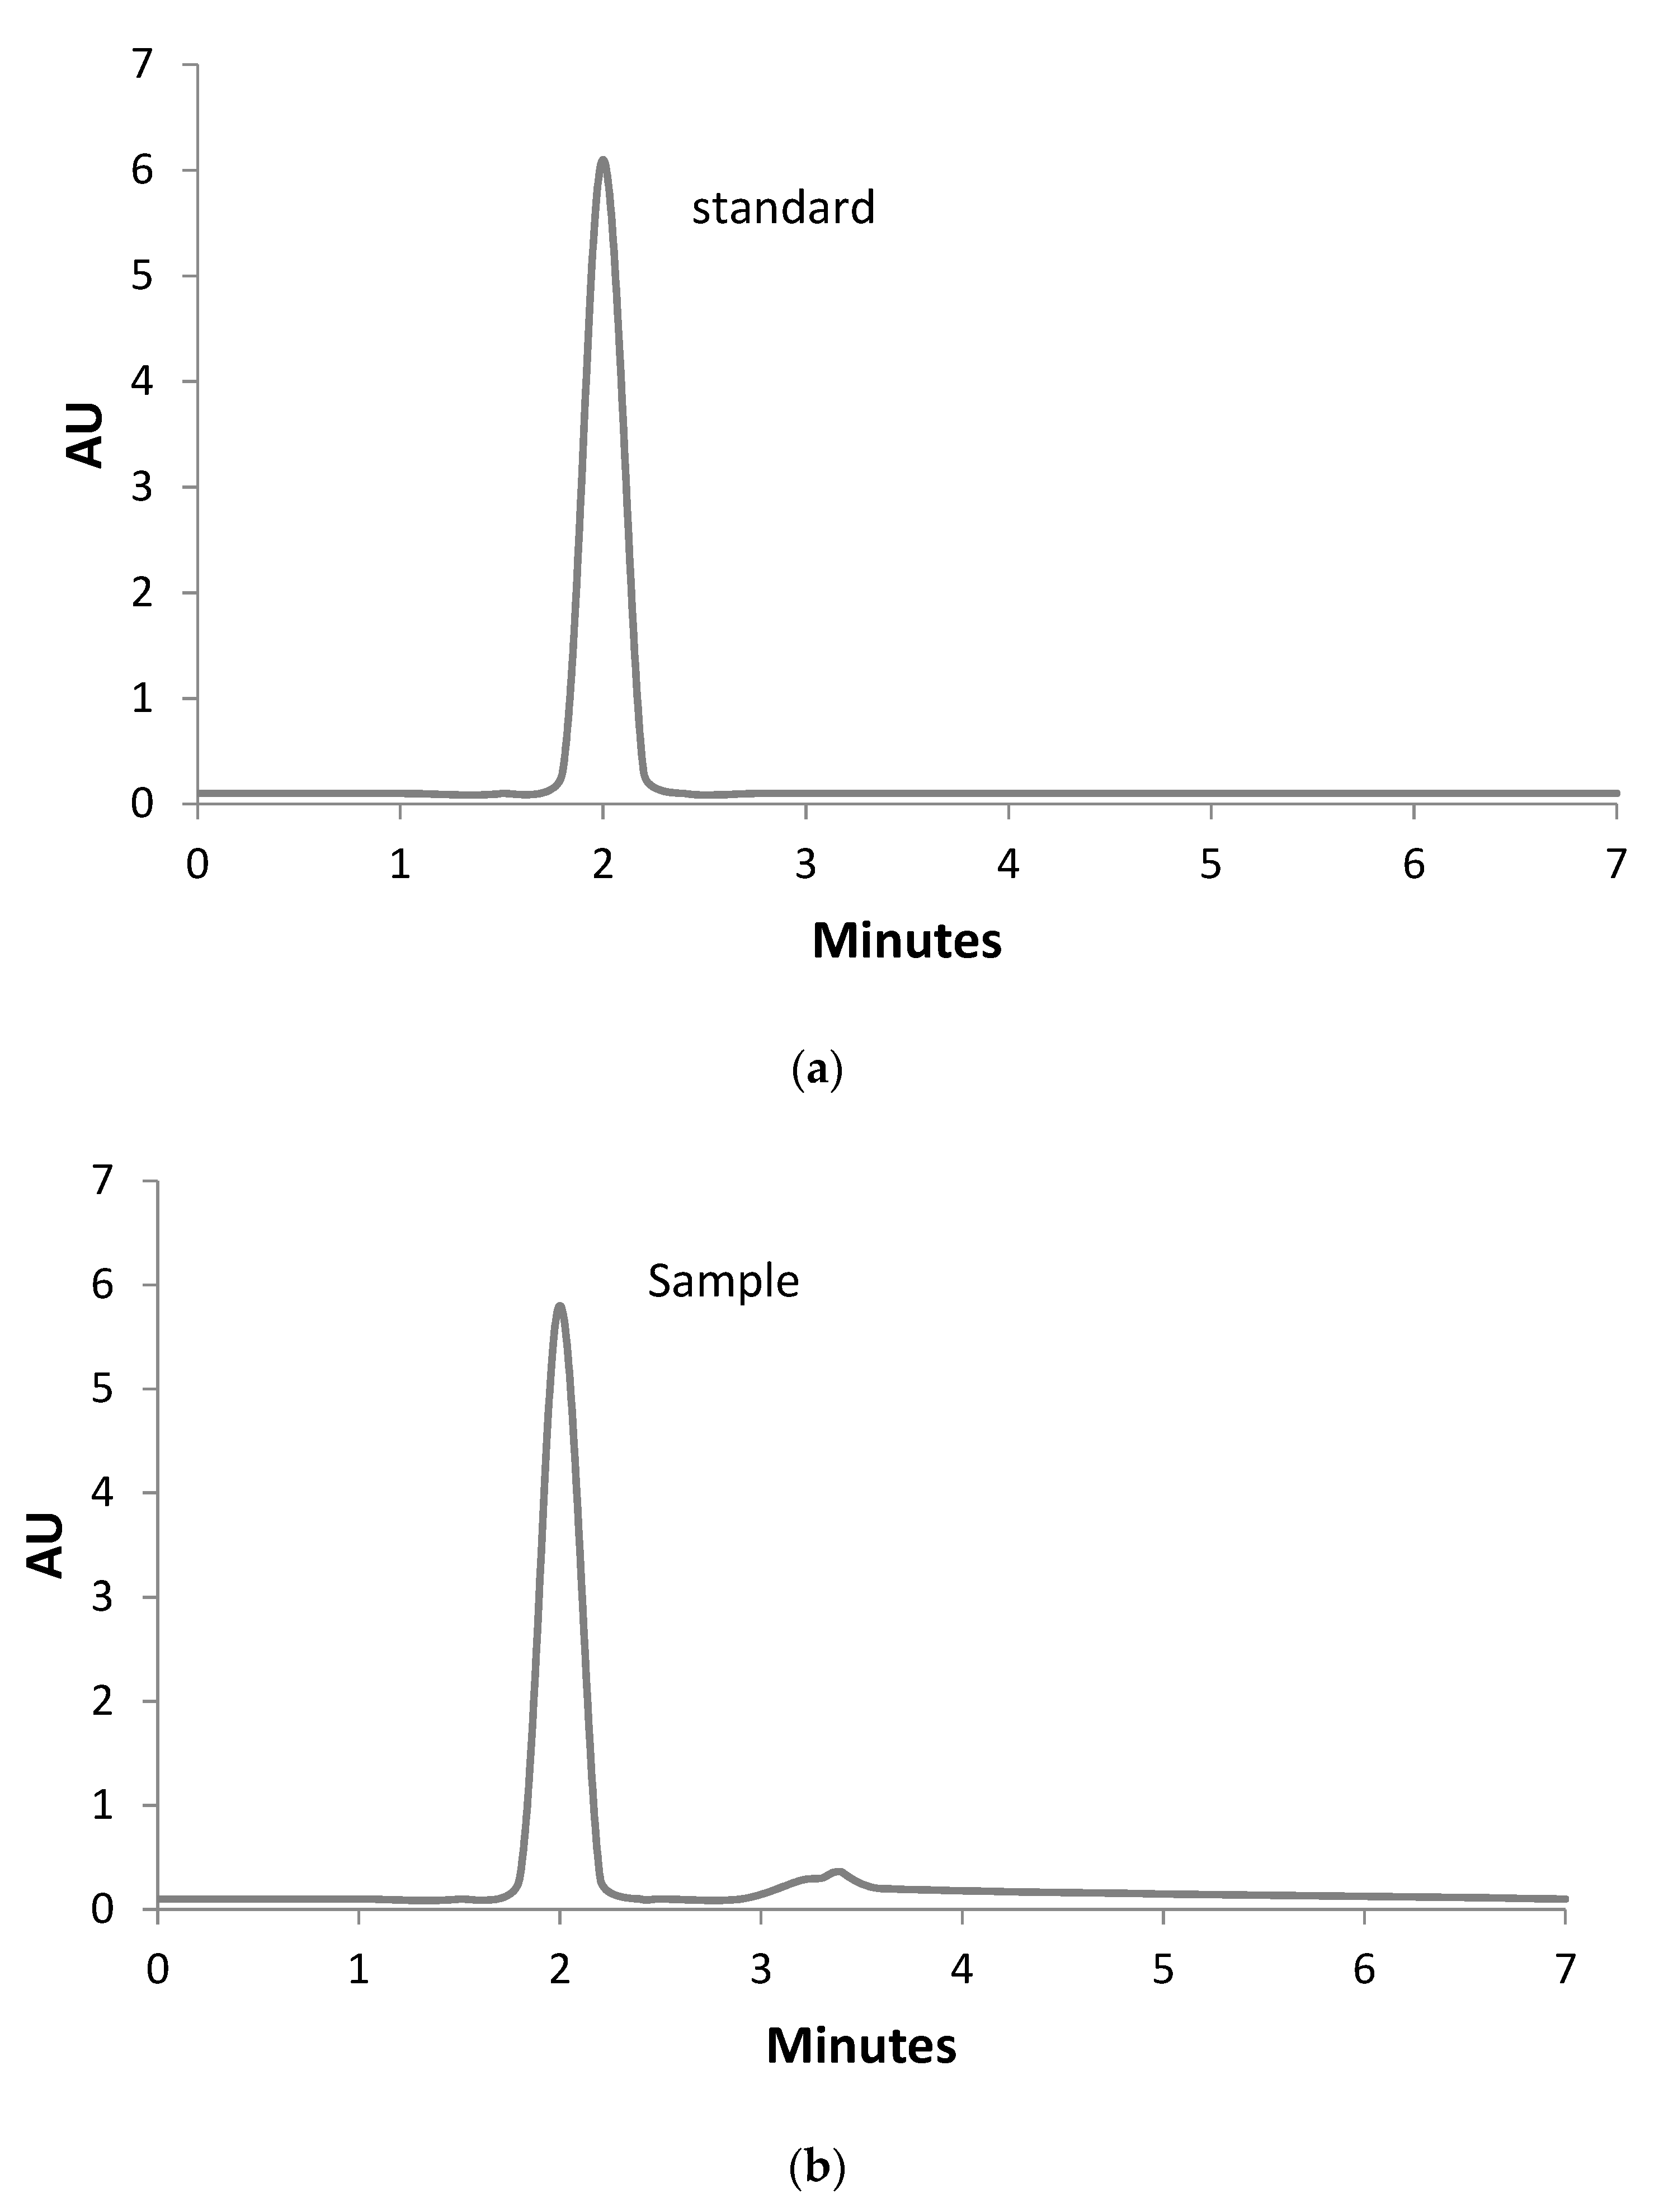
3.4. Identification and Quantitative Assessment of Biovanillin

Characterization of extracted biovanillin via solid-state fermentation using Punica granatum peels was done by Fourier transform infrared (FTIR) spectroscopy against standard vanillin. The FTIR spectrum of the precipitated product obtained from crystallization was recognized as biovanillin. The absorption bands at 2860.53 cm−1 and 1662.10 cm−1 were mainly due to CH stretching vibration of the aldehyde group and carbonyl group (C=O) stretching of the substituted benzaldehyde, respectively. At 2947.03 cm−1 a weak band was observed due to the asymmetric stretching vibration of the methoxy group (CH3). The band of medium intensity detected at 1025.74 cm−1 was the stretching vibration of C-O-CH3, while the bands at 351.75 and 1197.89 cm−1 was attributed to OH stretching and the plane bending vibration of the OH group. The strong bands at 630.55, 731.06, 1025.74 and 1121.28 cm−1 were due to the C-C-OH, C-C-CHO, O-CH3 and C-OH groups, respectively. The detection of other strong bands in FTIR spectrum indicates C-C bond presence. The sample exhibits identical peaks with reference to the standard, indicating that biovanilin was present in the fermented media as shown in Figure 5. In the current research, the HPLC method shows 99.2% purity of biovanillin based on the sample and standard peaks shown in Figure 6.
SSF allows the use of industrial processing residues as a substrate that helps to minimize pollution problems. It doesn’t require agitation, and therefore the production cost can be minimized compared to submerged fermentation. In the current research, maximum biovanillin yield (0.462 mg/g) from Punica granatum peels was achieved at 60% moisture content, 2 mL inoculum size, 6.5 pH, and 32 °C temperature using SSF. Ferulic acid is the ideal precursor for vanillin production due to its structure similarity. For ferulic acid transformation, five pathways have been reported, namely (1) coenzyme A dependent deacetylation, (2) coenzyme A independent deacetylation, (3) non oxidative decarboxylation, (4) oxidative coupling, and (5) side chain reduction. The non-oxidative decarboxylation pathway has been detected in many yeasts, fungi and in a few bacteria. This pathway was catalyzed by decarboxylase enzyme, which converted the ferulic acid into 4-vinyl guaiacol. CoA independent deacetylation pathways have been investigated in Fusarium solani, Pseudomonas mira and Streptomyces setonii, which yielded vanillin by the removal of acetate moiety from the ferulic acid side chain. Coenzyme A-dependent non-β-oxidative pathways for ferulic acid degradation have been reported in Pseudomonas fluorescens AN 103, Delftia acidovorans, Amycolatopsis sp. strain HR 167 and Pseudomonas sp. strain HR 199. Activation of ferulic acid by feruloyl-CoA synthetase to CoA thioester have been observed in Rhodotorula rubra which is then hydrated and non-oxidatively cleaved to produce acetyl CoA and vanillin [29]. Both reactions were catalyzed by enoyl-CoA hydratase. The gene encoding this enzyme was isolated from the Pseudomonas strain as it can utilize ferulic acid [30]. The fcs and ech gene encoding the ferulic acid degrading enzyme for vanillin production was identified in many bacterial species. In a reduction pathway, ferulic acid is reduced to dihydroferulic acid, which leads to vanillic acid formation, and eventually to vanillin [31]. Until now, there was no literature available describing the biovanillin production pathway of the bacteria used in the current research.
In the current research, maximum biovanillin yield (0.462 mg/g) from Punica granatum peels was achieved at 60% moisture content, 2 mL inoculum size, 6.5 pH, and 32 °C temperature using SSF. Vanillin concentration starts to decrease when it is allowed to remain in the medium for a long duration, due to its toxic nature. At higher concentration it shows toxic effect on cells, which is why microorganisms convert it into vanillic acid (a less toxic compound) by oxidizing the vanillin. Thus, if the incubation period prolonged from 24 h, biovanillin concentration starts to decrease, as reported by Saeed et al. [22]. In contrast to the present results, Mazhar et al. [21] reported the optimal production of vanillin by Enterobacter hormaechei at pH 7 and a temperature of 30 °C after 72 h, and 6 g/L of ferulic acid was potentially converted to 5.2 g/L of vanillin using the waste residue of rice bran oil. Saeed et al. [22] reported the production of vanillin using banana peel as a substrate and converted 7 g/L of ferulic acid to 3.8 ± 0.14 g/L vanillin by Enterobacter hormaechei with a 24 h incubation period at pH 7, an incubation temperature of 30 °C, and a 150 rpm agitation speed, by submerged fermentation (SmF). In comparison to submerged fermentation, product yield by SSF is lower. This is because nutrients and microorganisms are not continuously mixed in ssf but the technique has the advantage of being an inexpensive process, as the ferulic acid present in pomegranate peels is utilized as such for production instead of after extraction. Barbosa et al. [32] used green coconut husk as a substrate to produce vanillin by Phanerochaete chrysosporium through solid-state fermentation. The experiment stated that a 44.4 µg/g vanillin yield was observed at 24 h. Then basal media components were optimized using a Placket-Burman design in 24 h of fermentation. A total of nineteen variables were optimized to check their influence on vanillin yield, out of which fourteen variables had a value of p < 0.05. After optimization by this design, vanillin yield increased up to 20% (52.5 µg/g), and the 8 non-significant components were excluded from fermentation media. The reason for the good product yield in current research was the change to the microbial strain. Galadima et al. [14] reported the highest production of vanillin (131 mg/L) at pH 6.0 temperature of 35 °C, and a 72 h incubation period using lemongrass leaves, hydrolyzates, and Phanerochaete chrysosporium ATCC 24725 using various control strategies in a 2-L stirred tank bioreactor. There is not much literature reported on solid-state fermentation, so the results were compared with submerged fermentation for biovanillin production. A pH below 6.5 decreased the production of vanillin while a pH above 7.5 caused vanillin to convert into vanillic acid. Tilay et al. [17] show similar results, as a maximum production of vanillin with a molar yield of 42.16% was observed at pH 6.5 when the pH of the fermented media ranged from 4 to 7 in the one-step biotransformation of ferulic acid to vanillin using Pycnoporous cinnabarinus. Yan et al. [15] verified the influence of pH by changing the initial pH from 8 to 9.5 in fermentation experiments for ferulic acid transformation into vanillin using Bacillus subtilis. They observed increasing the pH to 8.5 led to maximal vanillin production (0.64 g/L) with a molar yield of 54.73%. Chen et al. [12] found pH 9 to be optimal for biovanillin production from ferulic acid by means of change in the conversion efficiency of Bacillus subtilis from pH 5 to 7, and above this range a rise in yield efficiency was observed, with maximal increase of 78.33% at pH 9.
The effect of incubation temperature was carried out by fermentation experiments at a temperature range from 25 °C to 50 °C. Lower production of biovanillin (0.31 mg/g) was observed at 25 °C. The capability of the selected strain to transform ferulic acid into biovanillin increased with rising incubation temperature, up to 35 °C. The highest production of biovanillin (0.462 mg/g) was observed at 32 °C, and then it decreased with rising temperature. Due to the mesophilic nature of the microorganism, at high temperatures the enzymes begin to denature, resulting in a lower production of biovanillin [30]. The research by Chen et al. [12] observed the hyperproduction of vanillin using ferulic acid as a substrate was achieved at 35 °C among the various temperatures (25 to 45 °C) analyzed for process optimization. Bacillus subtilis B7-S conversion efficiency peaked at 35 °C to as high as 72%. In a study conducted by Hussin et al. [33], chemical and physical factors were screened by a two-level factorial design (2LFD) for the production of biovanillin from lemongrass leaf hydrolysates using P. chrysosporium. To determine the effect of incubation temperature, it was varied from 25 to 45 °C. The results were in agreement with the current study, as vanillin synthesis peaked between the temperatures of 30 and 35 °C, at pH level 5 to 7. On increasing temperature above this limit, vanillin production decreased because of declining enzyme production yield. Based on the findings, temperature is one of the most influential parameters for maximal vanillin production at 0.192 g/L which was increased 92% in comparison to the non-optimized experiment. Barghini et al. [3] reported results dissimilar to our findings when they screened the effect of three different incubation temperatures (22, 30 and 37 °C) by employing the cells of E. coli JM109 expressing genes from Pseudomonas fluorescens BF13 (the ferulic acid-degrader). The maximal vanillin if 0.35 mM was quantified with 70.4% molar yield efficiency after incubation of 3 h using 0.5 mM ferulic acid. Mazhar et al. [21] found 30 °C was the optimum temperature required by E. hormaechei to produce biovanillin. When biotransformation was executed by incubating 6 g/L ferulic acid at pH 7 for 72 h, the maximum biovanillin produced under 30 °C was 5.2 g/L.
The maximum production of biovanillin was observed at 2 mL of inoculum size. Higher inoculum size results in faster consumption, resulting in earlier nutrition exhaustion as compared to lower inoculum size. The results were in disagreement with the research done by Saeed et al. [34], which reported that 8% inoculum size bacteria show maximum production, and another study which optimized the inoculum size conducted by Saeed et al. [35], that showed the highest production occurred at 1 mL. The research conducted by Saeed et al. [36] showed that highest yield occurred with 3 mL inoculum volume. The results were in agreement to the research conducted by Vermani et al. [37] which showed that 2% inoculum size gave the highest concentration of product using A. vinelandii MTCC 2460. Moisture content has an important role in solid state fermentation. If the moisture content is low the growth of microorganism will be restrained, and if the moisture content is high the space in the substrate is filled with water and oxygen is expelled. A study conducted by Rashid et al. [38], which optimized the moisture content in solid state fermentation showed the highest yield at 42.86% (w/v). An optimized total of 75% (v/w) of moisture content showed maximum production in a study conducted by Nema et al. [39] through solid state fermentation.

4. Conclusions

In this study, different ferulic acid-rich fruit peels were used. Among them, Punica granatum (pomegranate) peels produced the highest yield of biovanillin, which was further optimized using RSM by selecting four important parameters: moisture content, inoculum size, pH, and temperature. The maximum quantity of biovanillin, i.e., 0.462 mg/g of the substrate, was produced under the conditions of 24 h of incubation at 32 °C, pH 6.5, moisture content 60%, and inoculum volume 2 mL. FTIR and the HPLC analysis further confirmed the purity of the produced vanillin. It is therefore concluded that biovanillin can be synthesized at the industrial scale by using optimized process parameters and cheap substrates.

Author Contributions

Conceptualization, T.M. and S.S.; methodology, R.W. and W.A.; software, S.S. and W.A.; validation, T.M., S.S. and S.A.; formal analysis, R.W., S.S., A.U. and M.I.; investigation, T.M. and S.S.; resources, T.M. and S.S.; data curation, R.W.; writing—original draft preparation, R.W., S.S. and T.M.; writing—review and editing, T.M., S.S., M.I. and S.A.; visualization, A.U., S.S.; supervision, S.S.; project administration, T.M. and S.S.; funding acquisition, S.S. and T.M. All authors have read and agreed to the published version of the manuscript.

Funding

This research received no external funding.

Institutional Review Board Statement

Not applicable.

Informed Consent Statement

Not applicable.

Data Availability Statement

We confirm that we included all data in our main manuscript file. After publication, it will available to readers.

Conflicts of Interest

The authors declare no conflict of interest to publish the manuscript. All authors approved data is accurate and agreed to post in the Journal.

References

  1. Ramachandra Rao, S.; Ravishankar, G.A. Vanilla flavour: Production by conventional and biotechnological routes. J. Sci. Food Agric. 2000, 80, 289–304. [Google Scholar] [CrossRef]
  2. Sinha, A.K.; Sharma, U.K.; Sharma, N.A. Comprehensive review on vanilla flavor: Extraction, isolation and quantification of vanillin and others constituents. Int. J. Food Sci. Nutr. 2008, 59, 299–326. [Google Scholar] [CrossRef]
  3. Barghini, P.; Di Gioia, D.; Fava, F.; Ruzzi, M. Vanillin production using metabolically engineered Escherichia coli under non-growing conditions. Microb. Cell Factories. 2007, 6, 13. [Google Scholar] [CrossRef] [Green Version]
  4. Galadima, A.I.; Salleh, M.M.; Hussin, H.; Safri, N.M.; Noor, R.M.; Chong, C.S.; Yahya, A.; Mohamad, S.E.; Abd-Aziz, S.; Yusof, N.N.M. One-step conversion of lemongrass leaves hydrolysate to biovanillin by Phanerochaete chrysosporium ATCC 24725 in batch culture. Waste Biomass Valori. 2020, 11, 4067–4080. [Google Scholar] [CrossRef]
  5. Gallage, N.J.; Møller, B.L. Vanillin–bioconversion and bioengineering of the most popular plant flavor and its de novo biosynthesis in the vanilla orchid. Mol. Plant. 2015, 8, 40–57. [Google Scholar] [CrossRef] [Green Version]
  6. Zamzuri, N.A.; Abd-Aziz, S. Biovanillin from agro wastes as an alternative food flavour. J. Sci. Food Agric. 2013, 93, 429–438. [Google Scholar] [CrossRef] [Green Version]
  7. Converti, A.; Aliakbarian, B.; Domínguez, J.; Vázquez, G.B.; Perego, P. Microbial production of biovanillin. Braz. J. Microbiol. 2010, 41, 519–530. [Google Scholar] [CrossRef] [Green Version]
  8. Torres, B.R.; Aliakbarian, B.; Torre, P.; Perego, P.; Domínguez, J.M.; Zilli, M.; Converti, A. Vanillin bioproduction from alkaline hydrolyzate of corn cob by Escherichia coli JM109/pBB1. Enzyme Microb. Technol. 2009, 44, 154–158. [Google Scholar] [CrossRef]
  9. Banerjee, G.; Chattopadhyay, P. Vanillin biotechnology: The perspectives and future. J. Sci. Food Agric. 2019, 99, 499–506. [Google Scholar] [CrossRef]
  10. Chakraborty, D.; Kaur, B.; Obulisamy, K.; Selvam, A.; Wong, J.W. Agrowaste to vanillin conversion by a natural Pediococcus acidilactici strain BD16. Environ. Technol. 2017, 38, 1823–1834. [Google Scholar] [CrossRef]
  11. Baqueiro-Peña, I.; Guerrero-Beltrán, J.Á. Vanilla (Vanilla planifolia Andr.), its residues and other industrial by-products for recovering high value flavor molecules: A review. J. Appl. Res. Med. Aromat. Plants. 2017, 6, 1–9. [Google Scholar] [CrossRef]
  12. Chen, P.; Yan, L.; Wu, Z.; Li, S.; Bai, Z.; Yan, X.; Wang, N.; Liang, N.; Li, H. A microbial transformation using Bacillus subtilis B7-S to produce natural vanillin from ferulic acid. Sci. Rep. 2016, 6, 20400. [Google Scholar] [CrossRef]
  13. Yoon, S.H.; Lee, E.G.; Das, A.; Lee, S.H.; Li, C.; Ryu, H.K.; Choi, M.S.; Seo, W.T.; Kim, S.W. Enhanced vanillin production from recombinant E. coli using NTG mutagenesis and adsorbent resin. Biotechnol. Prog. 2007, 23, 1143–1148. [Google Scholar] [CrossRef]
  14. Galadima, A.I.; Salleh, M.M.; Hussin, H.; Shiong, C.C.; Yahaya, A.; Mohamad, S.E.; Aziz, S.A.; Yusof, N.N.M.; Al-Junid, A.F.M. Improvement of biovanillin production with two-stage pH control strategy from lemongrass leaves hydrolysates using Phanerochaete chrysosporium ATCC 24725 in batch culture. Biomass Convers. Biorefin. 2020, 1–10. [Google Scholar] [CrossRef]
  15. Yan, L.; Chen, P.; Zhang, S.; Li, S.; Yan, X.; Wang, N.; Liang, N.; Li, H. Biotransformation of ferulic acid to vanillin in the packed bed-stirred fermentors. Sci. Rep. 2016, 6, 34644. [Google Scholar] [CrossRef]
  16. Buranov, A.U.; Mazza, G. Extraction and purification of ferulic acid from flax shives, wheat and corn bran by alkaline hydrolysis and pressurised solvents. Food Chem. 2009, 115, 1542–1548. [Google Scholar] [CrossRef]
  17. Tilay, A.; Bule, M.; Kishenkumar, J.; Annapure, U. Preparation of ferulic acid from agricultural wastes: Its improved extraction and purification. J. Agric. Food Chem. 2008, 56, 7644–7648. [Google Scholar] [CrossRef]
  18. Kaur, B.; Chakraborty, D. Biotechnological and molecular approaches for vanillin production: A review. Appl. Biochem. Biotechnol. 2013, 169, 1353–1372. [Google Scholar] [CrossRef]
  19. Zaki, S.A.; Abdelatif, S.H.; Abdelmohsen, N.R.; Ismail, F.A. Phenolic compounds and antioxidant activities of pomegranate peels. Int. J. Food Eng. 2015, 1, 73–76. [Google Scholar] [CrossRef]
  20. Singh, J.P.; Kaur, A.; Shevkani, K.; Singh, N. Composition, bioactive compounds and antioxidant activity of common Indian fruits and vegetables. J. Food Sci. Technol. 2016, 53, 4056–4066. [Google Scholar] [CrossRef] [Green Version]
  21. Mazhar, B.; Jahan, N.; Ali, N.M.; Andleeb, S.; Ali, S. Production of vanillin by a novel bacterium from waste residues of rice bran oil. Punjab Univ. J. Zool. 2017, 32, 137–142. [Google Scholar]
  22. Saeed, S.; Baig, U.U.R.; Tayyab, M.; Altaf, I.; Irfan, M.; Raza, S.Q.; Nadeem, F.; Mehmood, T. Valorization of banana peels waste into biovanillin and optimization of process parameters using submerged fermentation. Biocatal. Agric. Biotechnol. 2021, 36, 102154. [Google Scholar] [CrossRef]
  23. Salleh, N.H.M.; Daud, M.Z.M.; Arbain, D.; Ahmad, M.S.; Ismail, K.S.K. Optimization of alkaline hydrolysis of paddy straw for ferulic acid extraction. Ind. Crops Prod. 2011, 34, 1635–1640. [Google Scholar] [CrossRef]
  24. Nurika, I.; Suhartini, S.; Azizah, N.; Barker, G.C. Extraction of Vanillin Following Bioconversion of Rice Straw and Its Optimization by Response Surface Methodology. Molecules 2020, 25, 6031. [Google Scholar] [CrossRef] [PubMed]
  25. Aarabi, A.; Mizani, M.; Honarvar, M.; Faghihian, H.; Gerami, A. Extraction of ferulic acid from sugar beet pulp by alkaline hydrolysis and organic solvent methods. J. Food Meas. Charact. 2016, 10, 42–47. [Google Scholar] [CrossRef]
  26. Barberousse, H.; Roiseux, O.; Robert, C.; Paquot, M.; Deroanne, C.; Blecker, C. Analytical methodologies for quantification of ferulic acid and its oligomers. J. Sci. Food Agric. 2008, 88, 1494–1511. [Google Scholar] [CrossRef]
  27. Ma, X.-K.; Daugulis, A.J. Effect of bioconversion conditions on vanillin production by Amycolatopsis sp. ATCC 39116 through an analysis of competing by-product formation. Bioprocess Biosyst Eng. 2014, 37, 891–899. [Google Scholar] [CrossRef]
  28. Chakraborty, D.; Selvam, A.; Kaur, B.; Wong, J.W.C.; Karthikeyan, O.P. Application of recombinant Pediococcus acidilactici BD16 (fcs+/ech+) for bioconversion of agrowaste to vanillin. Appl. Microbiol. Biotechnol. 2017, 101, 5615–5626. [Google Scholar] [CrossRef]
  29. Mathew, S.; Abraham, T.E. Bioconversions of ferulic acid, an hydroxycinnamic acid. Crit. Rev. Microbiol. 2006, 32, 115–125. [Google Scholar] [CrossRef]
  30. Gasson, M.J.; Kitamura, Y.; McLauchlan, W.R.; Narbad, A.; Parr, A.J.; Parsons, E.L.H.; Payne, J.; Rhodes, M.J.; Walton, N.J. Metabolism of ferulic acid to vanillin: A bacterial gene of the enoyl-SCoA hydratase/isomerase superfamily encodes an enzyme for the hydration and cleavage of a hydroxycinnamic acid SCoA thioester. J. Biol. Chem. 1998, 273, 4163–4170. [Google Scholar] [CrossRef] [Green Version]
  31. Bloem, A.; Bertrand, A.; Lonvaud-Funel, A.; De Revel, G. Vanillin production from simple phenols by wine-associated lactic acid bacteria. Lett. Appl. Microbiol. 2007, 44, 62–67. [Google Scholar] [CrossRef]
  32. Dos Santos Barbosa, E.; Perrone, D.; do Amaral Vendramini, A.L.; Leite, S.G.F. Vanillin production by Phanerochaete chrysosporium grown on green coconut agro-industrial husk in solid state fermentation. BioResources 2008, 3, 1042–1050. [Google Scholar] [CrossRef]
  33. Hussin, H.; Salleh, M.M.; Siong, C.C.; Naser, M.A.; Abd-Aziz, S.; Al-Junid, A.F.M. Optimization of biovanillin production of lemongrass leaves hydrolysates through Phanerochaete chrysosporium. J. Teknol. 2015, 77, 31. [Google Scholar] [CrossRef] [Green Version]
  34. Saeed, S.; Hashmi, A.S.; Tayyab, M.; Awan, A.R.; Anjum, A.A.; Firyal, S. Hyperproduction of alginate by mutated strain of Azotobacter vinelandii through submerged fermentation. Pak. J. Zool. 2016, 48, 1585–1589. [Google Scholar]
  35. Saeed, S.; Tayyab, M.; Mehmood, T.; Awan, A.R.; Firyal, S.; Nadeem, F.; Irfan, M. Valorization of potato peel for production of alginate and optimization of the process through response surface methodology (RSM) by using Azotobacter nigricans. Biomass Convers. Biorefin. 2021, 1–9. [Google Scholar] [CrossRef]
  36. Saeed, S.; Mehmood, T.; Irfan, M. Statistical optimization of cultural parameters for the optimized production of alginic acid using apple (Malus domestica) peels through solid-state fermentation. Biomass Convers. Biorefin. 2020, 1–9. [Google Scholar] [CrossRef]
  37. Vermani, M.; Kelkar, S.; Kamat, M. Studies in polysaccharide production and growth of Azotobactervinelandii MTCC 2459, a plant rhizosphere isolate. Lett. Appl. Microbiol. 1997, 24, 379–383. [Google Scholar] [CrossRef]
  38. Rashid, J.; Samat, N.; Mohtar, W.; Yusoff, W. Optimization of temperature, moisture content and inoculum size in solid state fermentation to enhance mannanase production by Aspergillus terreus SUK-1 using RSM. Pak. J. Biol. Sci. PJBS 2011, 14, 533–539. [Google Scholar] [CrossRef] [Green Version]
  39. Nema, A.; Patnala, S.H.; Mandari, V.; Kota, S.; Devarai, S.K. Production and optimization of lipase using Aspergillus niger MTCC 872 by solid-state fermentation. Bull. Natl. Res. Cent. 2019, 43, 82. [Google Scholar] [CrossRef] [Green Version]
Figure 1. Screening of substrates for biovanillin production.
Fermentation 08 00040 g001
Figure 2. Observed and predicted values of biovanillin production.
Fermentation 08 00040 g002
Figure 3. Contour plots for biovanillin production, specifying the interaction between different factors.
Fermentation 08 00040 g003
Figure 4. Desirability chart for biovanillin production using Punica granatum peels through solid-state fermentation.
Fermentation 08 00040 g004
Figure 5. FTIR spectrum of vanillin.
Fermentation 08 00040 g005
Figure 6. HPLC chromatogram of biovanillin (a) standard (b) sample.
Fermentation 08 00040 g006
Table 1. Independent factors and their levels in a designed experiment.
CodesIndependent ParametersUnitLow-LevelHigh Level
AMoisture content%4080
BInoculum sizemL15
CpH-510
DTemperature°C2550
Table 2. Central composite design for the optimization of biovanillin using Punica granatum peels.
Sr. No.ABCDBiovanillin Yield (mg/g)Predicted YResiduals
180510500.3380.33730.0015
280410250.3170.3175−0.0004
36037.5350.39230.3940−0.0017
44055450.4430.4451−0.0012
58055250.3570.3588−0.0016
66036500.4240.4259−0.0015
76017300.40680.41030−0.0034
84057.5250.39640.3977−0.0013
98015250.38850.3927−0.0041
106047.5420.39270.3935−0.0007
1180110250.34060.3429−0.0023
128015250.38850.3927−0.0041
138015500.41800.4209−0.0028
1450210500.40970.4105−0.0007
1540510250.37240.3728−0.0003
166037400.40300.4046−0.0016
176037.5500.41000.4109−0.0009
186037.5450.40410.4053−0.0012
197037.5270.36700.3691−0.0020
204037.5350.42380.4259−0.0020
214015.5250.44680.4514−0.0045
226037.5400.39820.3997−0.0014
2340510500.40200.40100.0009
245037.5350.40800.4099−0.0019
256038.5260.37200.3739−0.0018
266026.5320.4620.40900.0529
274015250.45160.4564−0.0047
288055500.38670.3871−0.0003
296027.5350.40010.4025−0.0023
3040110500.43330.4348−0.0015
317037.5350.37650.3781−0.0016
The bold values show the parameters (A, B, C, and D) that gave the maximum yield of biovanillin.
Table 3. Analysis of variance for biovanillin production produced by Punica granatum peels.
SourceDFAdj SSAdj MSF-Valuep-Value
Model140.0304420.00217412.940.000
 Linear40.0205790.00514530.630.000
  A10.0110840.01108465.980.000
  B10.0032110.00321119.110.000
  C10.0065200.00652038.810.000
  D10.0020390.00203912.140.003
 Square40.0002650.0000660.390.810
  A∗A10.0001330.0001330.790.387
  B∗B10.0000030.0000030.020.889
  C∗C10.0000610.0000610.360.555
  D∗D10.0000750.0000750.450.514
 2-Way Interaction60.0000170.0000030.021.000
  A∗B10.0000000.0000000.000.971
  A∗C10.0000000.0000000.000.997
  A∗D10.0000060.0000060.030.859
  B∗C10.0000000.0000000.000.961
  B∗D10.0000020.0000020.010.920
  C∗D10.0000020.0000020.010.905
Error160.0026880.000168
  Lack-of-Fit150.0026880.000179
  Pure Error10.0000000.000000
Total300.033130
This ∗ represent multiplication sign.
Publisher’s Note: MDPI stays neutral with regard to jurisdictional claims in published maps and institutional affiliations.

