Article

Potential of a Techno-Functional Sourdough and Its Application in Sugar-Reduced Soft Buns

by
Denise C. Müller
1,2,
Stefanie Schipali
1,
Patrick Näf
2,
Mathias Kinner
2,
Susanne Miescher Schwenninger
2 and
Regine Schönlechner
1,*
1
Department of Food Science and Technology, University of Natural Resources and Life Sciences (BOKU), 1190 Vienna, Austria
2
Institute of Food and Beverage Innovation, Zurich University of Applied Sciences (ZHAW), 8820 Wädenswil, Switzerland
*
Author to whom correspondence should be addressed.
Submission received: 14 December 2021 / Revised: 17 January 2022 / Accepted: 17 January 2022 / Published: 20 January 2022
(This article belongs to the Special Issue Innovations in Sourdough Bread Making)

Abstract

:
Functional lactic acid bacteria (LAB) as starter cultures used in sourdough fermentation have been researched for years. This study evaluated the LAB strains Leuconostoc citreum DCM65 (mannitol, exopolysaccharide producing, antifungal activity) and Lactiplantibacillus plantarum subsp. plantarum MA418 (amylolytic activity) and their potential as single or co-culture starters in sourdough fermented buns containing different levels of sugar (control 9% and reduced 0, 3, 6%). Cell counts, pH development, and organic acids were determined before and after sourdough fermentation (30 °C, 24 h) and physical properties (color, volume, pore structure, and texture) of buns produced thereof were determined after baking. Sourdoughs started with DCM65 and/or MA418 developed up to log 9.2 CFU/g presumptive LAB after 24 h, assertiveness of the added starter cultures species was confirmed by MALDI-TOF MS. Acetic acid and mannitol were only detected in sourdough fermented with DCM65 (single or co-culture) up to 2.5 mg/g and 9.8 mg/g, respectively. The starter cultures applied influenced physical properties of buns. Sourdough buns started with MA418 had higher volume and slice area, and softer crumb; in contrast, buns fermented with DCM65 had a finer pore structure. In summary, both starter cultures showed high potential in sourdough buns with reduced sugar content.

1. Introduction

Soft breads, such as burger buns, are produced in large quantities worldwide and are characterized by their sweet taste (ca. 9% sugar) and soft bread crumb. For years there has been a trend towards more naturally produced food (i.e., less food additives), defined as clean label products [1], and also for sugar-reduced food. However, reducing the sugar content or decreasing the amount of food additives is a big challenge for bakeries [1,2]. Sugar is an important ingredient in bakery products, not only for its sweet taste, but also due to its unique technological impacts on starch gelatinization temperature [3], color and flavor development [4], and shelf life [5]. Food additives that are used in the baking industry are emulsifiers, hydrocolloids, and preservatives [1]. Emulsifiers, such as mono- and diglycerides (E471) or lecithin (E322), are used for crumb softening [6] and to strengthen the gluten network [7]; hydrocolloids, such as xanthan gum (E415) or carboxymethylcellulose (E466), are used as stabilizers, thickeners, and gelling agents [1]; and preservatives, such as propionate (e.g., calcium propionate E282), sorbate (e.g., potassium sorbate E202), or benzoate (e.g., sodium benzoate E211) are used since mold growth can be a problem for packed bakery products [8,9]. Sometimes enzymes are added to replace such food additives, for example, amylases derived from bacteria and fungi that are known to soften the bread crumb. So far, enzymes do not need to be labeled in the end product if they are not active anymore [1]. However, consumers are increasingly shifting their demand towards clean labels as well as sugar-reduced products, which they consider to be more natural and healthier, consequently driving the baking industry to reformulate their products and adapt their processing conditions. Research on the implementation of natural substitutes in bread products is, thus, highly relevant [10,11].
One approach in this respect is the application of sourdough, which is inoculated with functional lactic acid bacteria (LAB) [12]. Sourdough is long known for its positive effects on final bread quality, such as bread flavor, texture, and shelf life [13]. A wide range of LAB species is available, some of which possess specific functional activities, which have been studied before [10,14,15,16,17]. Specific LAB functionalities might be interesting for sugar-reduced and clean label baked goods, such as soft buns. Mannitol, for example, is known as a sugar substitute [18,19] and is naturally produced by most heterofermentative LAB when metabolizing fructose [20]. The potential of 10% sourdough addition containing a mannitol producing Leuconostoc (Lc.) citreum in sugar-reduced buns has been shown by Sahin et al. [21]. Bacterial exopolysaccharides (EPS) are described for their positive impact on bread qualities, such as decreasing the crumb firmness [22]. Dextran, an EPS consisting of α -(1 6)-linked glucopyranosyl units, can be produced by LAB species of the genera Weissella [23] and Leuconostoc [24,25,26] when sucrose is metabolized. Amylases, used in bakery products to soften the bread crumb due to degradation of starch to smaller molecules, such as dextrin [27], may be replaced by amylolytic LAB, such as strains C5 or OB8 of Lactiplantibacillus (Lpb.) plantarum subsp. plantarum (former: Lactobacillus (Lb.) plantarum [28,29,30]). Furthermore, LAB were also described as producing antifungal metabolites including organic acids (acetic, lactic, and phenyllactic acid) [26,31], fatty acids [32], or cyclic dipeptides [33]. Yet, these LAB antifungal activities are not fully understood, however, synergistic effects were described for mold inhibition, for example, in bread application by Axel et al. [34] under acidic conditions.
The aim of this study was to evaluate the effect of two selected functional LAB strains on the physical properties of sugar-reduced soft buns. Lc. citreum DCM65 and Lpb. plantarum subsp. plantarum MA418 were either added as single or co-culture starters in sourdough fermentations. Buns with 20% sourdough addition at different sugar levels were produced, i.e., 9% (corresponding to the reference level) and reduced levels (0, 3, and 6%). Cell counts, pH, organic acids of sourdoughs before and after fermentation as well as the physical properties (color, volume, pore structure, and texture) of the buns were evaluated.

2. Materials and Methods

2.1. Bacterial Strains and Culture Conditions

Lc. citreum DCM65 and Lpb. plantarum subsp. plantarum MA418 were previously isolated from wheat sourdough and brewer’s spent grain, respectively, and are part of the culture collection of the Food Biotechnology Research Group of ZHAW (Zurich University of Applied Sciences, Wädenswil, Switzerland). The selection of those two LAB were based on their functional activities, which are as follows: Lc. citreum DCM65 was previously described by Müller et al. [26] as a multifunctional lactic acid bacterium due to its antifungal activities against molds belonging to the genera Cladosporium and Penicillium, mannitol production, and EPS forming functionalities during sourdough fermentation. Additionally, Lpb. plantarum subsp. plantarum MA418 has shown the highest amylolytic activities on starch agar (Becton Dickinson, Allschwil, Switzerland) when incubated at 30 °C for 10 days compared to other lactic acid bacteria strains, such as Pediococcus pentosaceus, Levilactobacillus brevis, and Lacticaseibacillus paracasei subsp. paracasei. Amylolytic activity was rated based on the halo formation after pouring the plates with a 1% iodine solution. Further, bacterial amylase produced by Lpb. plantarum subsp. plantarum MA418 was identified to be an α -amylase using the α-Amylase SD Assay Kit (Neogen, Lansing, MI, USA) (unpublished data). The bacterial functionalities mentioned above were selected in order to take over the functions of certain bakery relevant additives (e.g., preservatives and hydrocolloids) or as a sugar substitute (mannitol). All selected LAB strains were cultivated on de Man Rogosa Sharpe agar (MRS, Roth, Karlsruhe, Germany) and incubated anaerobically at 30 °C for 72 h.

2.2. Sourdough Fermentation

2.2.1. Preparation of Sourdough

Bacterial cultures were prepared as described by Müller et al. [26] with the following modifications: 10 mL of a food grade medium (30 g/L vegetable peptone broth (Oxoid), 20 g/L dehydrated wheat syrup (Meurens Natural S.A., Herve, Belgium), 10 g/L maltose, 0.05 g/L manganese sulfate (Roth, Karlsruhe, Germany), and 0.5 g/L magnesium sulfate (Roth, Karlsruhe, Germany) was inoculated with one colony of a fresh culture and incubated at 30 °C for 17 h. The strains of the co-culture were incubated as single cultures in a separate tube. The sourdough was prepared by mixing tap water and wheat flour (W550 obtained from Stadtmühle Schenk AG, Bern, Switzerland) 1:1, saccharose (1.5%) and fructose (1.5%), followed by inoculation with 1 × 10⁷ CFU/g of pure culture of Lc. citreum DCM65 or Lpb. plantarum subsp. plantarum MA418. Therefore, cells of LAB in liquid culture were counted using a counting chamber (Cell-Chip, depth: 0.1 mm, Bioswisstec AG, Schaffhausen, Switzerland), and cell count was adjusted as mentioned above. Inoculation with co-culture was done with a 1:1 ratio of both cultures and set to 1 × 10⁷ CFU/g sourdough as mentioned above. The sourdough was fermented at 30 °C for 24 h.

2.2.2. LAB Development and Acidification of the Sourdough

Sourdough samples before (t0) and after (t24) the fermentation were mixed with diluent (1 g/L peptone and 8.5 g/L natrium chloride) in a ratio of 1:10 and surface plated on MRS agar followed by incubation at 30 °C for 3 days. After incubation, the grown colonies on the MRS plates were visually assessed and 4–7 colonies were randomly selected, purified once, followed by further preparation for Matrix-Assisted Laser Desorption Ionization-Time of Flight Mass Spectrometry (MADLI-TOF MS, Bruker, Bremen, Germany). Detailed sample preparation was done as described by Miescher Schwenninger et al. [35]. Extraction for analyses was done by mixing 100 μ L of double distilled water with fresh cultures from the MRS plate. Afterwards, 300 μ L of absolute ethanol was added and mixed prior to centrifugation (Sigma Laborzentrifugen GmbH, Osterode am Harz, Germany; 13,000× g, 20 °C, 2 min). After discarding the supernatant, 20 μ L of 70% acetic acid was added and mixed. Then, 20 μ L acetonitrile was added to the suspension and centrifuged as previously described. Finally, all samples identified by MALDI-TOF MS were evaluated after the following system: 0–1.69 (not reliable genus identification), 1.70–1.99 (probable genus identification), 2.00–2.29 (secure genus identification, probable species identification), and 2.3–3.0 (highly probable species identification).
The acidification of the sourdough was evaluated by measuring the pH of the diluted sourdough (1:10 with diluent as described above) before (t0) and after (t24) the fermentation using a pH measuring device (Testo 205, Mönchaltdorf, Switzerland).

2.2.3. Quantification of Fructose, Mannitol, and Organic Acids in Sourdoughs

Fructose, mannitol, acetic acid, and lactic acid were analyzed in sourdough before (t0) and after (t24) fermentation by high performance liquid chromatography (HPLC) as described by Quattrini et al. [36] and Müller et al. [26]. Samples were diluted 1:5 with double distilled water and incubated for 3 h at 80 °C. Then, the samples were centrifuged (5000× g, 4 °C, 5 min, Sigma Laborzentrifugen GmbH, Osterode am Harz, Germany) and the supernatants were diluted 1:1 with 7% perchloric acid followed by storage overnight at 4 °C. Again, the samples were centrifuged as mentioned above and sterile filtered (0.2 μ m) prior to HPLC analysis on an Agilent 1260 system (Agilent, Santa Clara, CA, USA) using a Rezex RPM monosaccharide PB + 2 column (300 × 7.8 mm, Phenomenex, Torrance, CA, USA) and a guard column (Carbo-Pb; Phenomenex, Torrance, CA, USA) coupled to an RI detector (1260 RID G1362A, Agilent, Santa Clara, CA, USA, temperature set to 50 °C) to quantify mannitol and fructose using double distilled water as an eluent with a flow rate of 0.6 mL/min at a temperature of 85 °C. Lactic and acetic acids were quantified using a ROA-Organic Acid H+ column (150 × 4.6 mm, Phenomenex, Torrance, CA, USA) and a guard column (Carbo-H, Phenomenex, Torrance, CA, USA) using 0.005 M sulphuric acid as eluent with a flow rate of 0.2 mL/min at 25 °C. Of each sample 5 μ L was injected.

2.3. Dough and Bun Production

Preparation of the Bun Dough
Reference buns were prepared without sourdough, whereas sourdough buns were prepared with 20% sourdough addition using either single cultures of Lc. citreum DCM65 or Lpb. plantarum subsp. plantarum MA418 or the co-culture Lc. citreum DCM65/Lpb. plantarum subsp. plantarum MA418 as shown in Table 1.
Bun recipes were prepared as described by Müller et al. [37] with modifications and are presented in Table 2. Sourdough buns were prepared by mixing wheat flour (80%; the same flour as for sourdough preparation), tap water (amount adjusted for each recipe as mentioned below), 0, 3, 6, or 9% sugar (depending on the recipe), 5% canola oil, 1.6% salt, 2% dried instant yeast (Bio Naturaplan, Coop, Basel, Switzerland), 0.6% wheat gluten (Crespel & Deiters GmbH & Co. KG, Ibbenbüren, Germany), and 20% sourdough (always % of flour). If not otherwise mentioned, all ingredients were bought in a local supermarket. The water level was adjusted for each reference recipe in order to have a consistent dough viscosity using a Farinograph-AT (Brabender, Duisburg, Germany). Bun recipes with 9% and 6% sugar were produced at dough yield (DY) 160, with 3% sugar at DY 162, and with 0% sugar at DY 164. All ingredients were mixed and kneaded at level 1 for 5 min and for a further 3.5 min at level 2 using a Beeketal (Beeketal Lebensmitteltechnik GmbH & Co. KG, Rastdorf, Germany) kneading machine. Then, dough pieces of 58–62 g were prepared by hand and further placed in a bun tray (obtained from Fortisa AG, Zuchwil, Switzerland). The buns were proofed at 38 °C for 70 min and baked for 10 min at a falling temperature regime from 220 °C to 160 °C in a Miwe Backcombi (MIWE Michael Wenz GmbH, Arnstein, Germany). Buns were cooled for 2 h, single sealed in plastic bags, and stored at room temperature for the shelf-life test. Each recipe was replicated three times on different days.

2.4. Bun Characteristics

Determination of physical bun quality parameters was done exactly 2 h after cooling at room temperature.

2.5. Determination of Bun Volume, Bun Height, and Slice Area

The specific volume of the buns was measured by rapeseed displacement according to AACC Method 10–05.01. Bun height was measured by using a digital caliber (Tooland Inc, San Carlos, CA, USA). Then the bun was sliced lengthwise (1 cm from bottom) and crumb structure (slice area, cell diameter, and number of cells per mm2) was analyzed by using the C-Cell Imaging system (Calibre Control International Ltd., Warrington, United Kingdom). All analyses were carried out for seven buns per recipe.

2.5.1. Crust Texture, Crumb Firmness, and Resilience of Buns

Bun crust was analyzed by performing a compression test using a texture analyzer model TA-XT (Stable Micro Systems, Godalming, UK). For crust measurement the buns were perforated using a needle of 2 mm in diameter (P/2, Stable Micro Systems, Godalming, UK), with the following test parameters: Test speed of 1.7 mm/s, distance 7.0 mm, and trigger force 0.0049 N. Pre- and post-test speeds were 2.0 mm/s and 10 mm/s, respectively. The maximum force required to perforate the sample was noted as crust hardness.
Crumb firmness and resilience were measured after the buns were cut lengthwise with 1 cm thickness by using a bread slicer. The middle of the top bun slice was analyzed exactly 2 h after cooling. Analyses of the bun crumb texture were performed by using a 50 kg load cell (Stable Micro Systems, Godalming, UK) and a 35 mm cylinder probe (SMS P/35, Stable Micro Systems, Godalming, UK). Test speed was 5.0 mm/s using a distance of 7.0 mm, and a trigger force of 0.049 N. Pre- and post-test speeds were 1 mm/s and 5.0 mm/s, respectively. Crumb firmness was defined as the maximum force (N) required to compress the sample. Resilience (%), which gives information on crumb elasticity, was calculated by dividing the area under the curve of the maximum till the end by the area under the curve from the beginning of the measurement till the maximum multiplied by 100. Crust and crumb properties were always measured with seven buns at the day of production.

2.5.2. Crust and Crumb Color

The color of the bun crust and crumb was measured with a Chroma-Meter CR400 (Konica Minolta, Tokyo, Japan). Crust L*-values (0 = black, 100 = white), a*-values (+a* = red, −a* = green), and b*-values (+b* = yellow, −b* = blue) of 7 buns were analyzed at the center of the bun surface, and crumb L*-, a*-, and b*-values after the buns were sliced at the middle of the bun crumb, as mentioned above.

2.5.3. Water Activity and Shelf Life of Buns

The water activity of the bun crumb (n = 4) was measured after production using a crumb piece of 2.8 × 1.0 × 3.0 cm in a Rotronic hygropalm device (Rotronic AG, Bassersdorf, Switzerland). Analysis time was 5 min at room temperature.
For the shelf-life test, buns (n = 5) were single sealed in plastic bags after cooling and stored at room temperature until first mold growth was visible. Buns were checked daily for mold growth. The shelf-life test of each variant was stopped as soon as the first bun showed mold growth or for a maximum of 16 days.

2.6. Statistical Analysis

All sourdough and bun trials were performed in triplicates. Data were analyzed for normal distribution using Shapiro–Wilk test and/or by Q–Q plot. For normal distributed data, a one-way ANOVA followed by a Tukey HSD Test as post hoc test was performed at a significance level of p ≤ 0.05. For non-normal distributed data, a Kruskal–Wallis test was used followed by a Wilcoxon post hoc test. Additionally, the data was analyzed using a Pearson correlation analysis (see Table S1). Statistical analysis was performed using RStudio (version 1.3.959).

3. Results and Discussion

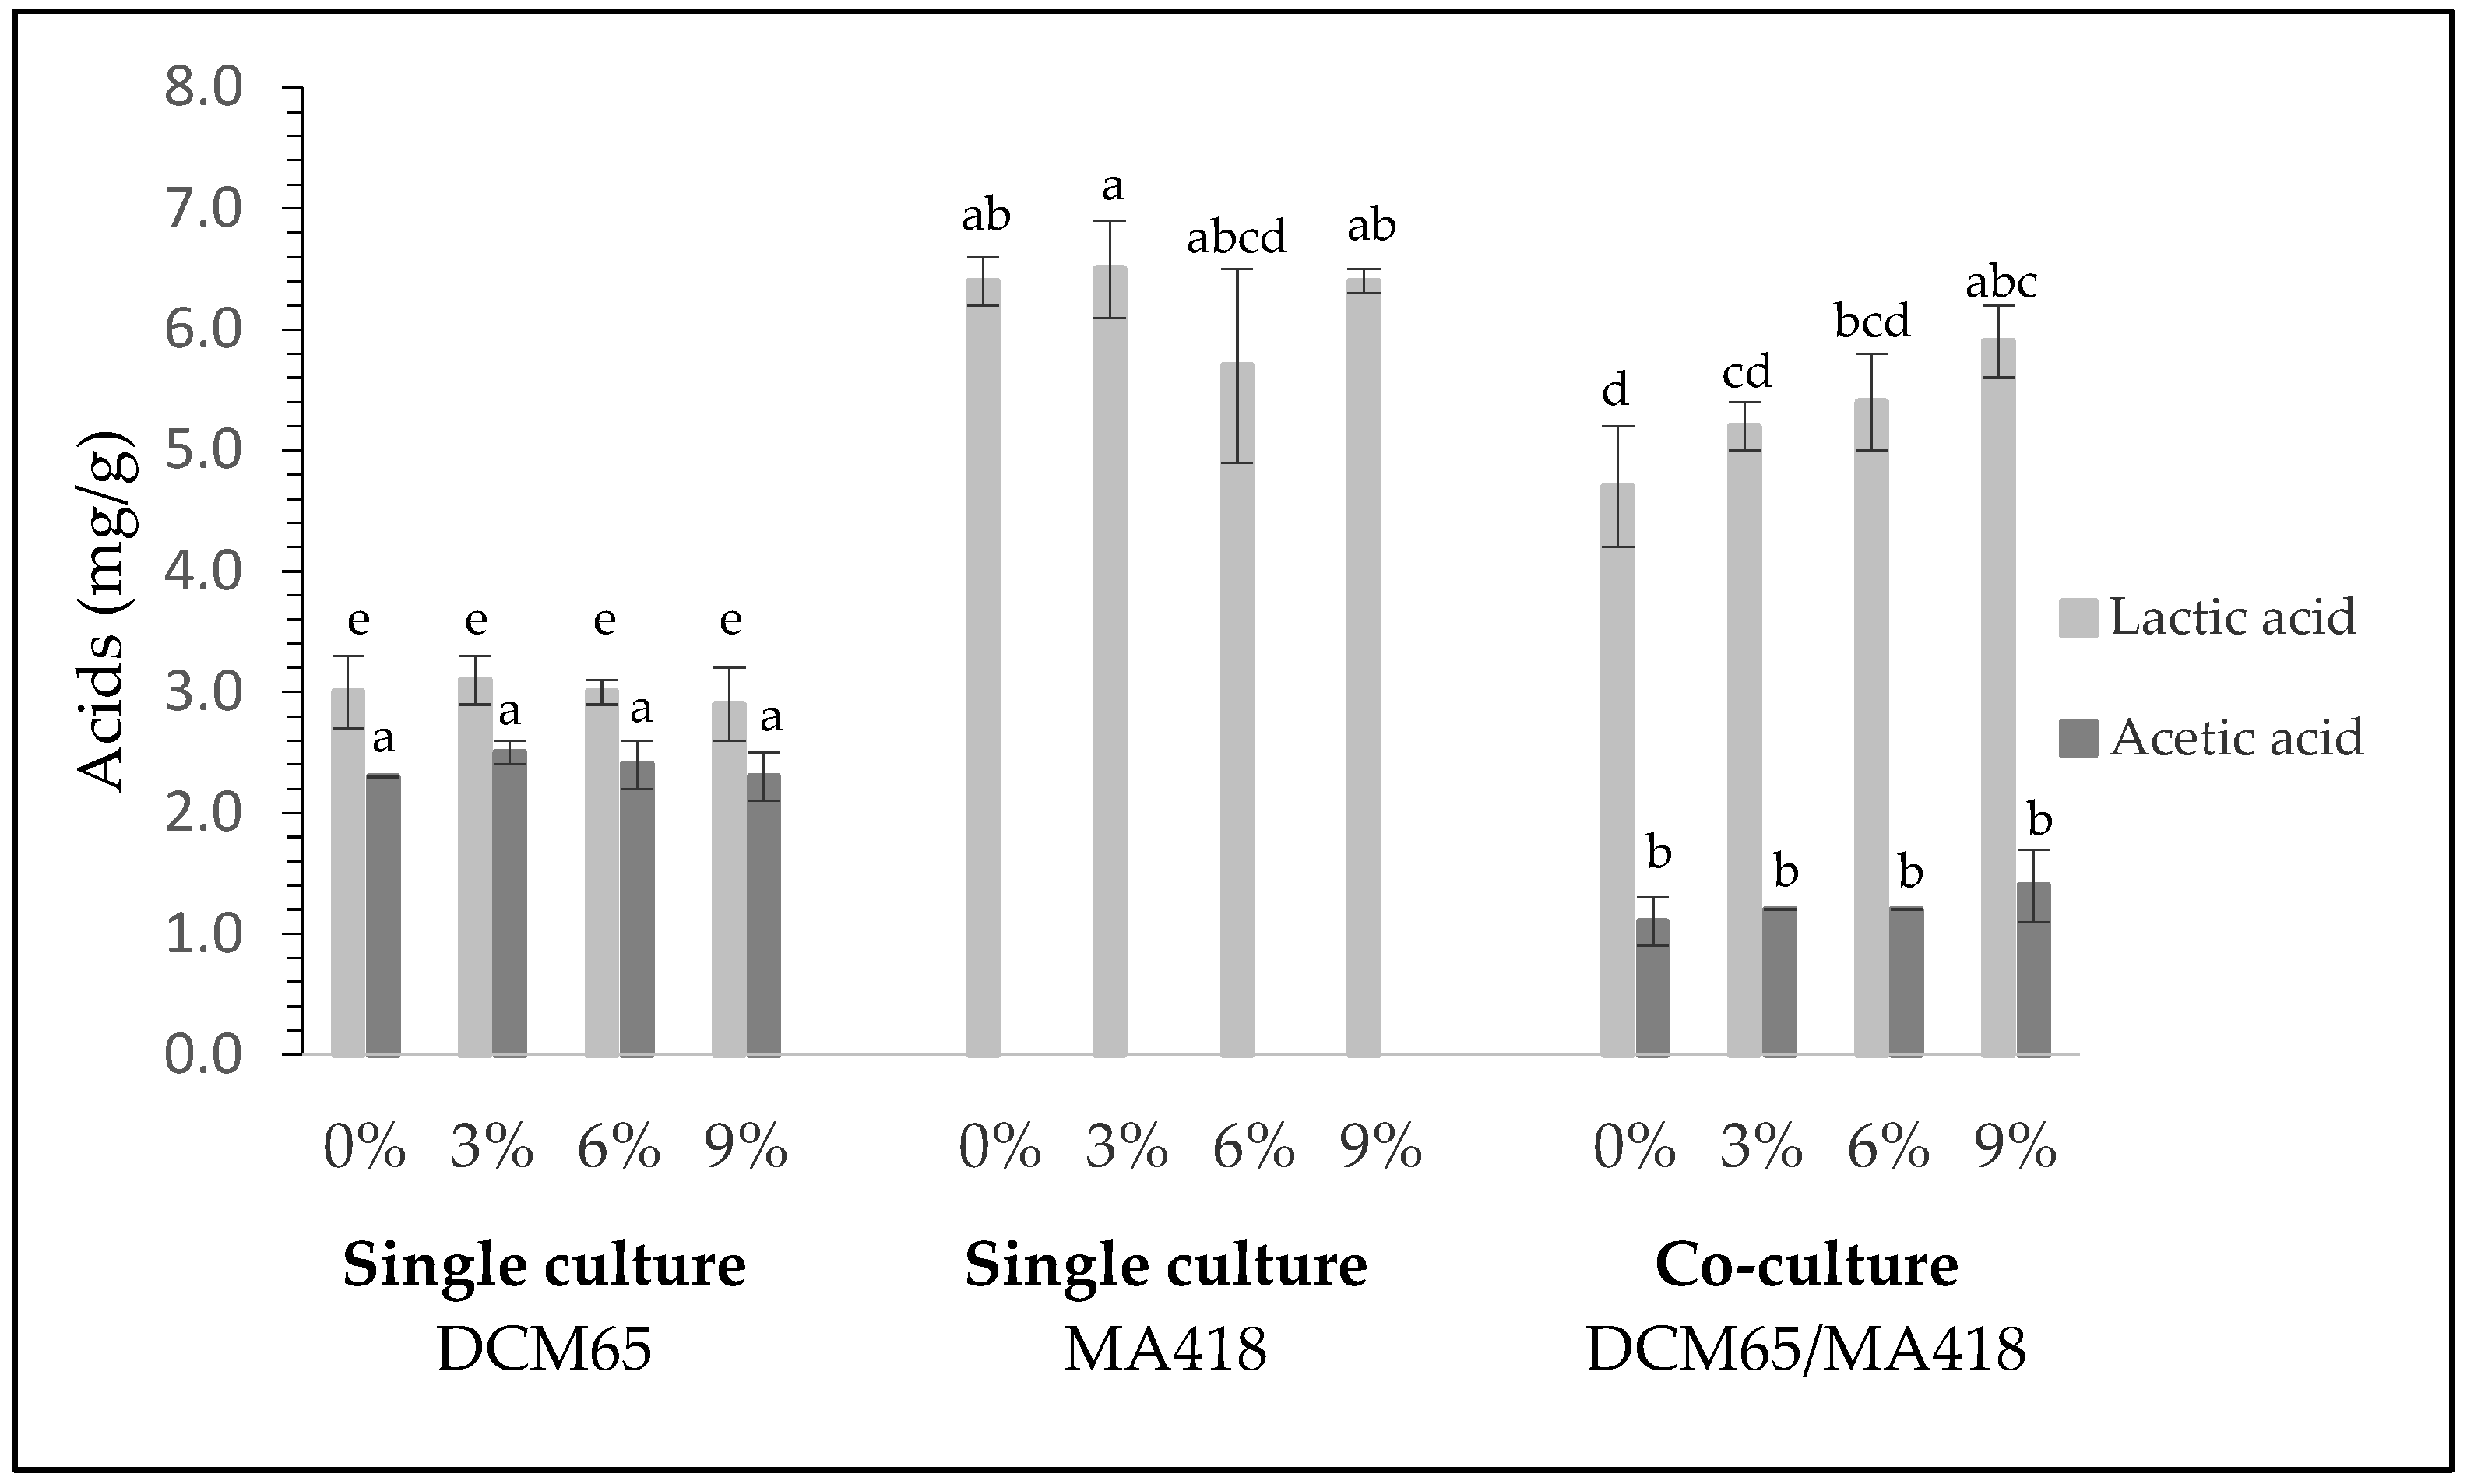
3.1. Characterization of Sourdoughs Inoculated with Single- or Co-Culture

Results such as counts of presumptive LAB, pH, fructose, mannitol, lactic acid, and acetic acid determined in the sourdoughs started either with Lc. citreum DCM65 or Lpb. plantarum subsp. plantarum MA418 or their co-culture, before (t0) and after fermentation (t24) are summarized in Table 3 and Figure 1, respectively. All sourdoughs developed LAB counts from log 7.5 to 9.2 CFU/g sourdough within 24 h fermentation at 30 °C. The presence of the inoculated species was visually determined by colony morphology on MRS plates, incubated at 30 °C for 72 h. Analysis of the colony morphology of sourdoughs started with co-culture after the fermentation (30 °C, 24 h) showed a slight increased growth of Lpb. plantarum subsp. plantarum MA418 (53–61%) compared to Lc. citreum DCM65 (39–47%). Further, MALDI-TOF MS analysis confirmed the presence of Lc. citreum and Lpb. plantarum subsp. plantarum and with it the assertiveness of both strains was assumed against the naturally occurring sourdough microbiota, either used as single cultures or as co-culture. For all sourdough fermentations, 4–7 colonies selected up to a dilution of log 9 were identified with MALDI-TOF MS score values between 1.7 (=probable genus identification) and 3.0 (=highly probable species identification) (data not shown).
Before the fermentations (t0) a pH between 6.4–6.5 was measured in all sourdoughs (independent of culture addition), which dropped to 4.0 after 24 h, when Lc. citreum DCM65 was used, and to 3.7–3.8, when Lpb. plantarum subsp. plantarum MA418 was used, either as single culture or in co-culture with Lc. citreum DCM65. The acidification of sourdough after fermentation (30 °C, 24 h) started with Lpb. plantarum subsp. plantarum MA418 as single or in co-culture with Lc. citreum DCM65 was significantly lower (pH 3.7 and 3.8, respectively) compared to the sourdough started with Lc. citreum DCM65 as single culture (pH 4.0), probably due to the higher amounts of lactic acid produced during the fermentation (see Table 3 and Figure 1).
Fructose contents of up to 17.2 mg/g were measured at the beginning of the fermentation (t0), which was reduced to 5.4–6.2 mg/g with Lc. citreum DCM65 as starter and significantly less to 10.9 mg/g sourdough with Lpb. plantarum subsp. plantarum MA418 as starter. In sourdough fermented by Lc. citreum DCM65 and Lpb. plantarum subsp. plantarum MA418 in co-culture, fructose was reduced to 6.9–9.1 mg/g sourdough. Mannitol was below the detection limit in sourdoughs before fermentation and increased up to 9.8 mg/g after 24 h in sourdoughs started with Lc. citreum DCM65. Significant lower mannitol contents (3.0–4.1 mg/g sourdough) were measured in sourdough started with co-culture Lc. citreum DCM65 and Lpb. plantarum subsp. plantarum MA418. A positive correlation between mannitol and acetic acid was described by Sahin et al. [21], which was also found within this study (r = 0.985, p ≤ 0.0001). No mannitol was produced by Lpb. plantarum subsp. plantarum MA418, when used as single culture, which was expected. The metabolisms of heterofermentative LAB, such as Leuconostoc, has been described by Gänzle [16] showing that the reduction of fructose leads to the formation of mannitol by mannitol-dehydrogenase that is connected to the formation of acetate [16].
As evident, but still measured in order to affirm, neither lactic nor acetic acids were detected in the sourdough before fermentation (t0) (data not shown). The two LAB produced significant different levels of lactic acid after 24 h of fermentation (t24) (see Figure 1), with lactic acid of up to 3.1 mg/g in sourdoughs started with Lc. citreum DCM65 as single culture, and almost twice as much with 5.7–6.5 mg/g in sourdoughs started with Lpb. plantarum subsp. plantarum MA418, and 4.7–5.9 mg/g in sourdoughs started with Lpb. plantarum subsp. plantarum MA418 in co-culture with Lc. citreum DCM65. Acetic acid was only found in sourdoughs started with Lc. citreum DCM65, either as single culture or in co-culture with Lpb. plantarum subsp. plantarum MA418. However, the acetic acid content was at least twice as much in sourdoughs with only Lc. citreum DCM65 (2.3–2.5 mg/g sourdough) compared to Lc. citreum DCM65 with Lpb. plantarum subsp. plantarum MA418 in co-culture (1.1–1.4 mg/g sourdough). The formation of acetic acid during sourdough fermentation is desirable since it was described as the most efficient LAB metabolite against fungal growth [36]. Axel et al. [34] described a minimum inhibitory concentration (MIC) of 1.2–7.2 mg/mL for acetic acid at pH 5. Acetic acid concentrations observed in sourdough started with Lc. citreum DCM65 as single cultures were within this range. However, besides the positive effects of acetic acid on shelf life, it is also known for its negative impact on the sensory properties of bread as described by Müller et al. [37].

3.2. Physical Properties of the Buns

3.2.1. Crust and Crumb Color of Buns

The bun crust and crumb color was measured using L*-, a*-, and b*-values (see Table 4). Analysis of the crust color showed that the L*-values were significantly higher in sugar-reduced reference buns (0% sugar) compared to reference buns with 3%, 6%, and 9% sugar. No clear tendency regarding crust color was detected in sourdough buns started with Lc. citreum DCM65 with different sugar levels. Reference buns and sourdough buns, all with 0% sugar in dough, started with Lpb. plantarum subsp. plantarum MA418 either as single culture or in co-culture with Lc. citreum DCM65, showed highest L*-values, indicating a paler color of the crust compared to the same buns but with 3, 6, and 9% sugar. Further, the crust of buns with 0% sugar (independent of sourdough addition) showed the lowest a*- and b*- values with 1.7 and 19.4, respectively. Both values increased with the addition of sugar to 14.0 (a*-value) and 36.8 (b*-value), respectively.
Maillard reaction is a chemical reaction between the amino groups (of amino acids, peptides, and proteins) and the carbonyl groups (of reducing sugars, such as fructose, glucose, and maltose) at high temperatures, such as the baking process [38,39]. This non-enzymatic reaction is known for its impact on color and flavor [40,41]. The impact of sugar on the crust color was also shown in this study and correlation analysis showed that L*-values of the crust was negatively correlated with sugar content (r = −0.732, p  0.005), whereas a*-values (r = 0.892, p  0.0001) and b*-values (r = 0.726, p  0.005) showed a positive correlation with the sugar level.
Less variation of the L*-value was found when analyzing bun crumbs, which was less affected by sugar levels and was independent of sourdough addition. Generally, L*-values of the crumb in all buns remained within a small range of 68.8–72.4. However, buns with a lower sugar amount tended to have lower L*-values compared to the buns with higher sugar contents. The analysis of a*- and b*-values of the bun crumb also showed less variation compared to the crust, and values were in a range between −0,5 to −1.3 for a*-values and 14.8 to 18.1 for b*-values.

3.2.2. Water Activity and Shelf Life of Buns

Water activity in bread is an important parameter as it provides information about the shelf life of a product. The higher the water activity, the more susceptible the food product is to microbial spoilage. The water activity of buns with and without sourdough was measured on the day of production (t0). In general, all buns (independent of sourdough and sugar addition) showed aw-values above 0.900 (see Table 4). Buns with higher sugar content (9%; independent of sourdough addition) had significantly lowesr aw-values (0.910–0.917), whereas buns with 0% sugar addition (0.933–0.936) had the highest water activities. This demonstrates that free water was bound by sugar [42]. In accordance with these findings, water activity was negatively correlated with sugar content (r = −0.869, p ≤ 0.0001).
The shelf-life test of the buns stored at room temperature revealed visible mold growth in reference buns after 3–4 days. Buns with sourdough, started with Lc. citreum DCM65 showed an increased shelf life with visible mold growth only after 12–16 days and, therefore, confirmed antifungal activity of this particular strain as previously described by Müller et al. [26]. Positive correlations were found between shelf life and contents of acetic acid (r = 0.852, p ≤ 0.0005) and mannitol (r = 0.918, p ≤ 0.0001), both produced during the sourdough fermentation started with Lc. citreum DCM65, and both have previously been described to increase the shelf life in bakery products [19,36]. In contrast, buns produced with sourdough started with Lpb. plantarum subsp. plantarum MA418 revealed visible mold growth after 3–6 days and buns produced with sourdough started with the Lc. citreum DCM65/ Lpb. plantarum subsp. plantarum MA418 co-culture developed first mold growth after 4–5 days.

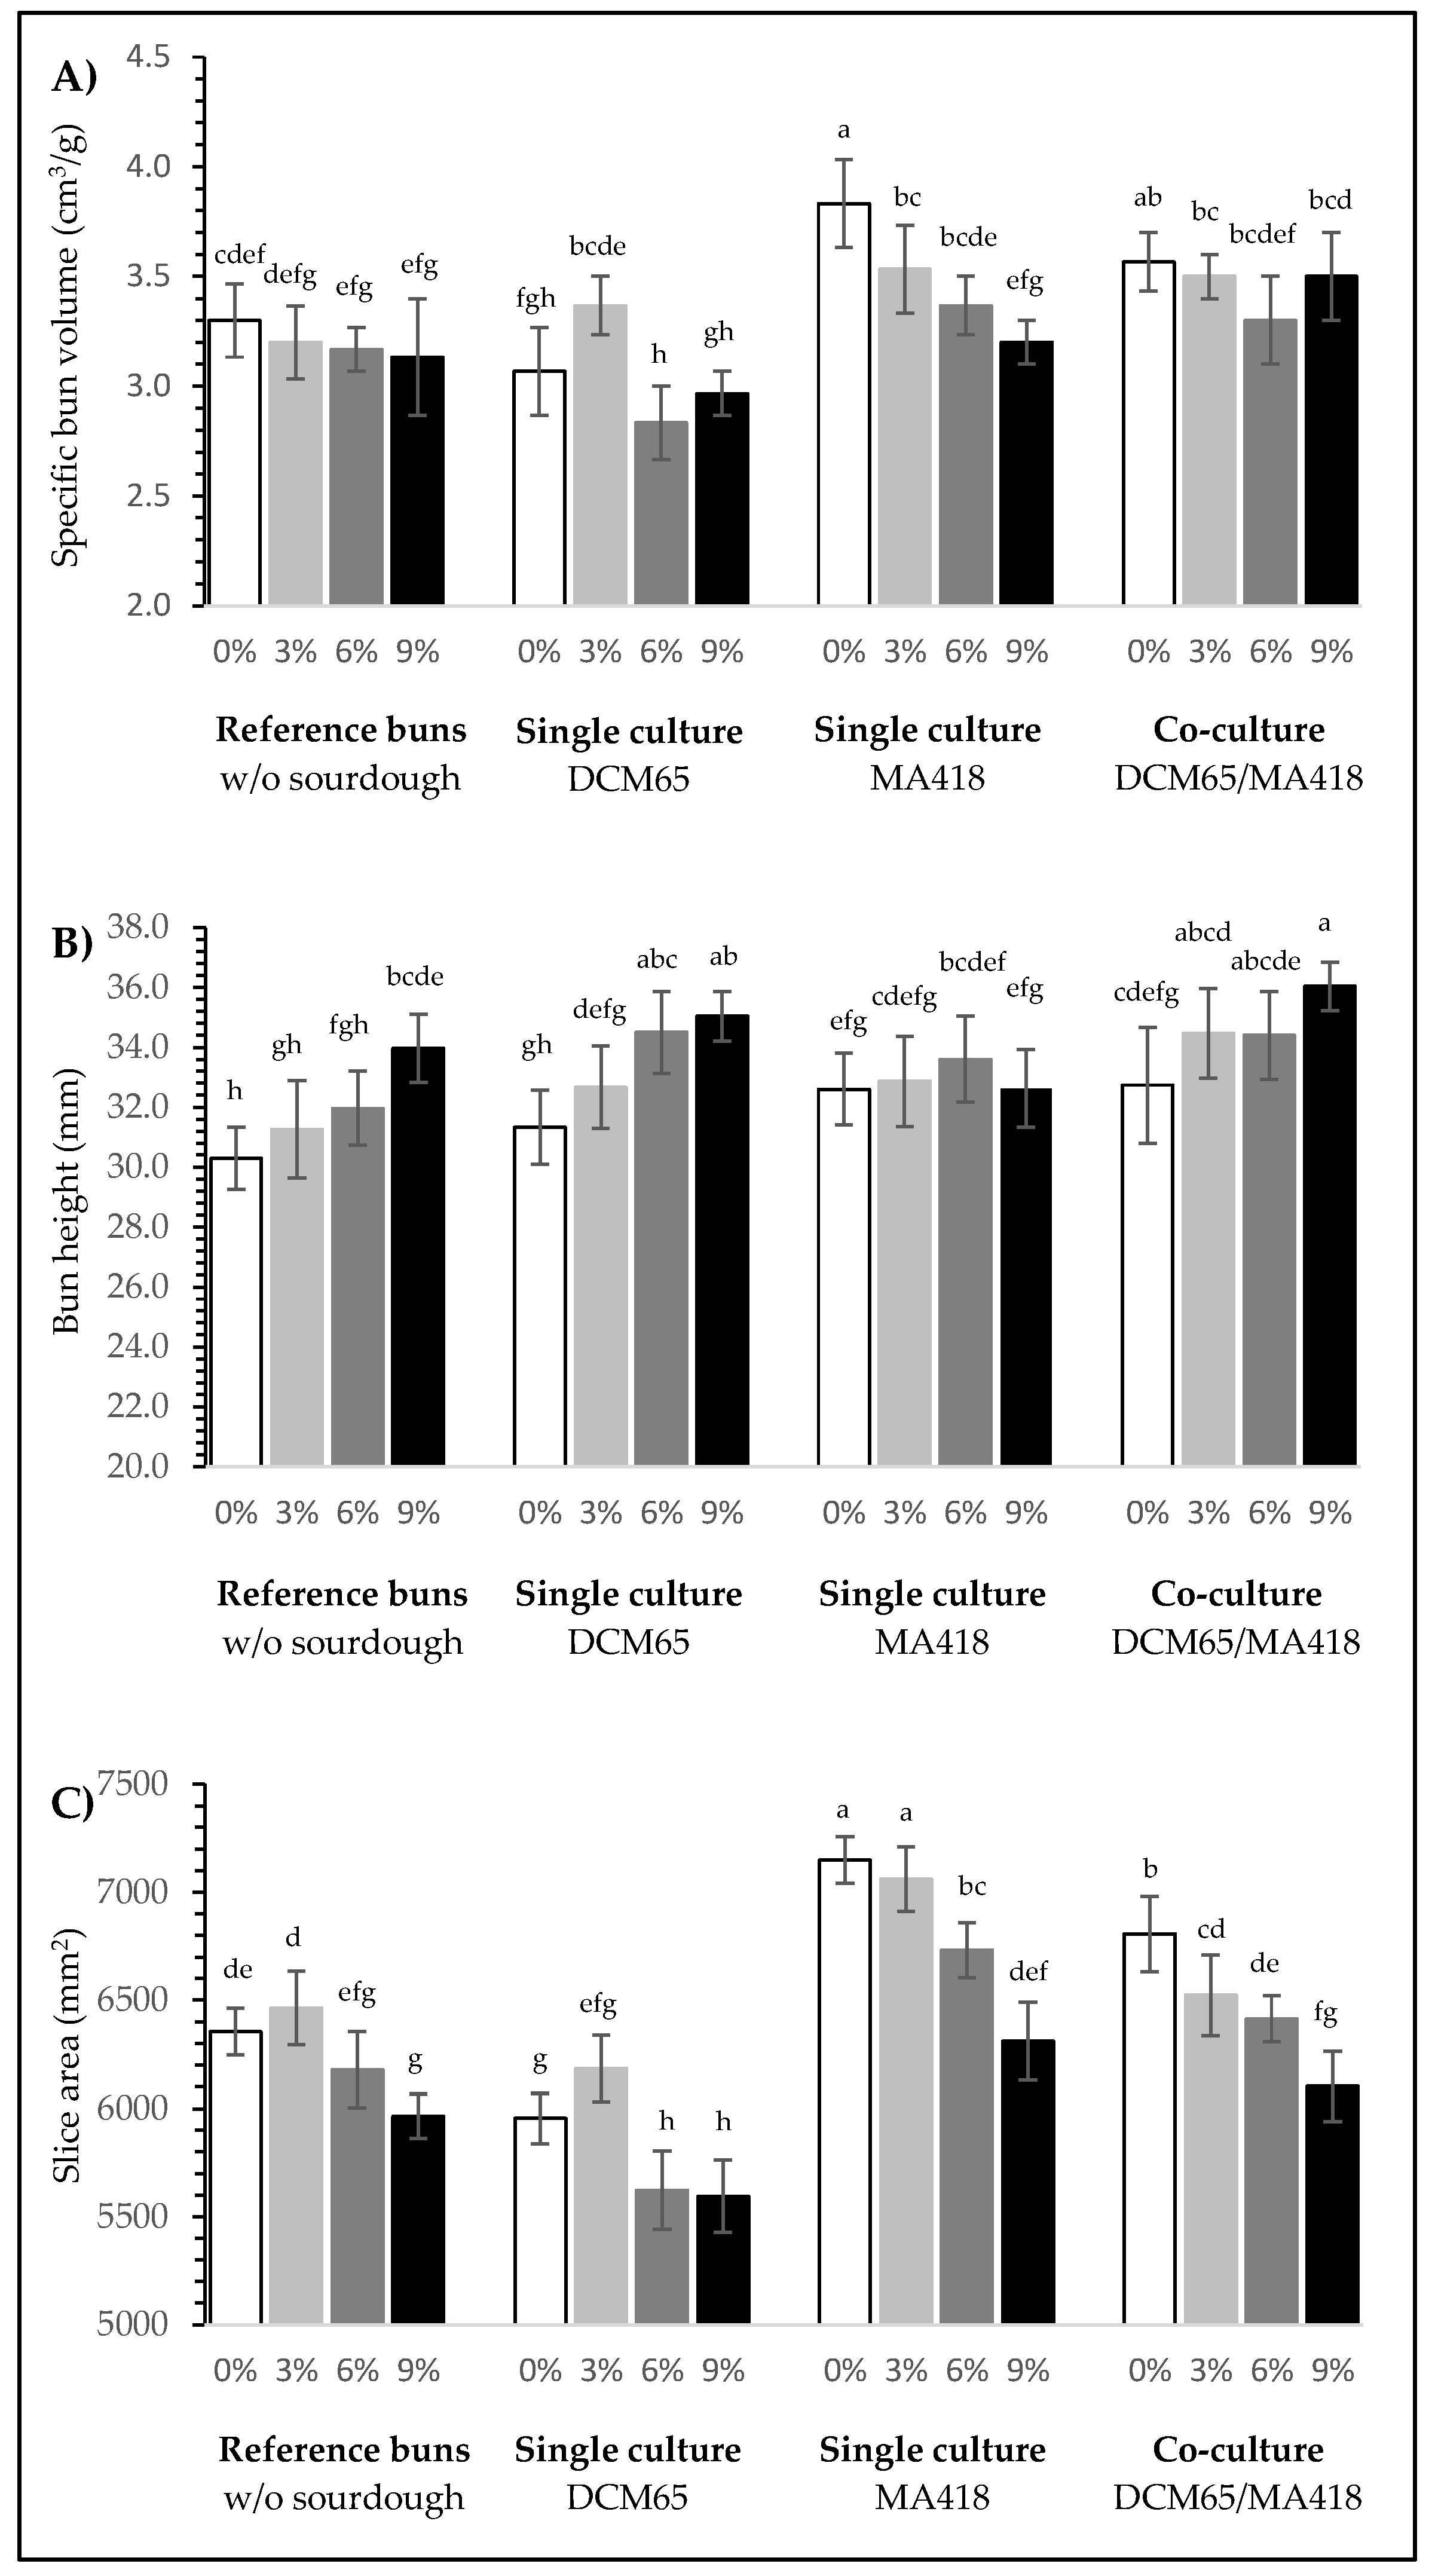
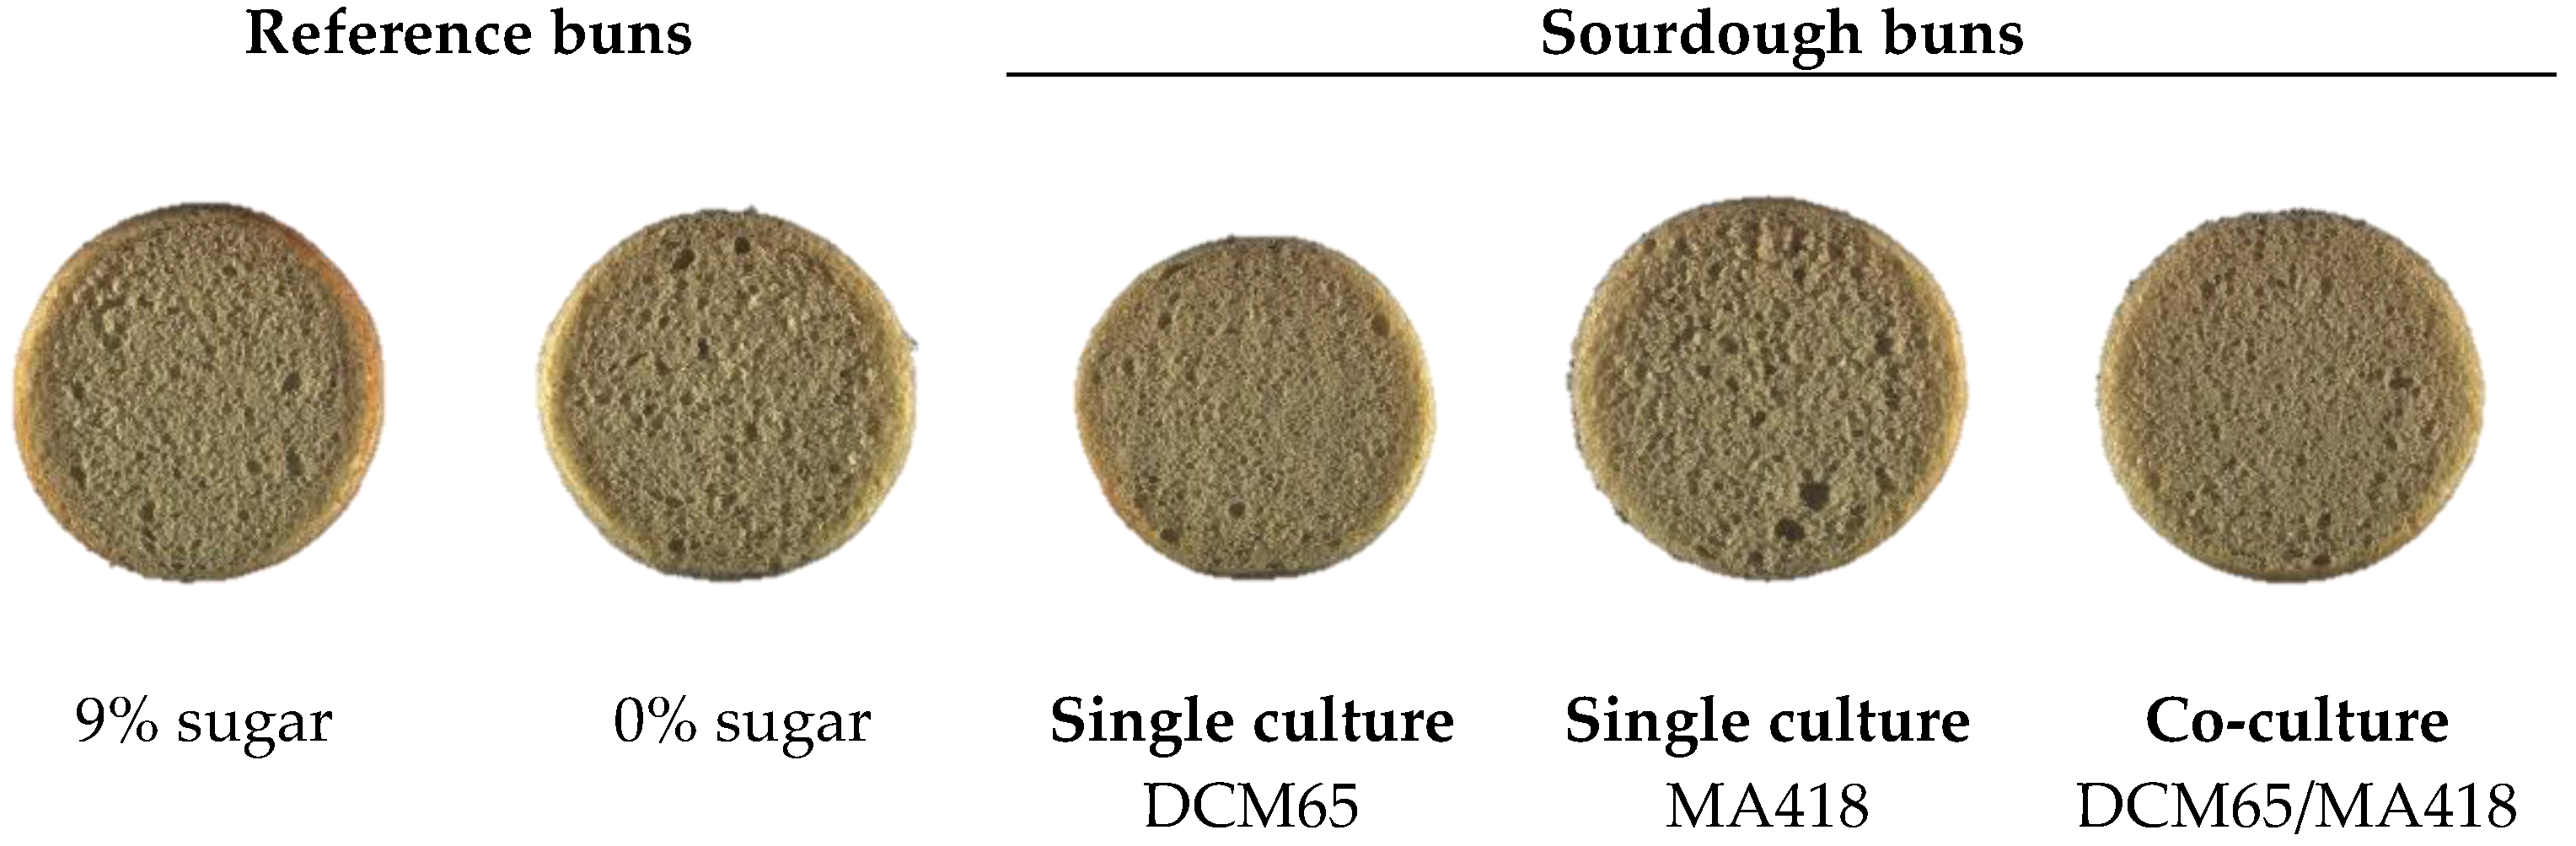
3.2.3. Bun Volume and Shape

Specific bun volume, bun height, and slice area of reference buns and the sourdough buns are shown in Figure 2. Sugar reduction did not significantly influence bun volume of the reference buns (Figure 2A). However, bun volume was significantly influenced by the starter culture applied in sourdough fermentations. Sourdough buns started with Lc. citreum DCM65 (with 6 and 9% sugar) generally had a smaller volume compared to the reference buns, while sourdough buns started with Lpb. plantarum subsp. plantarum MA418 had a higher volume (especially at 0 and 3% sugar addition). The volume of sourdough buns started with Lc. citreum DCM65/Lpb. plantarum subsp. plantarum MA418 co-culture (at 0, 3, and 9% sugar) was higher compared to the reference buns. This might have been due to the known fact that higher sugar addition can weaken the gluten network and, therefore, decrease the bun volume [2]. Smaller volumes of buns with sourdough started with Lc. citreum DCM65 might also have been the result of acetic acid (r = −0.596, p ≤ 0.05) and mannitol contents (r = −0.650, p ≤ 0.05); both were produced during the sourdough fermentation by Lc. citreum DCM65 and showed an inverse relationship with bun volume. Acetic acid is known for its yeast inhibiting effects [43], and addition of polyols (e.g., mannitol) has also been described to lower bread volume [19]. Further, volume was found to be negatively correlated (r = −0.753, p ≤ 0.001) with crumb firmness.
Sugar content was shown to influence bun height (Figure 2B). The higher the sugar content, the higher the bun height as observed for the reference buns and the sourdough buns started with Lc. citreum DCM65 (6 and 9% sugar) or the Lc. citreum DCM65/Lpb. plantarum subsp. plantarum MA418 co-culture, but not for the sourdough buns started with Lpb. plantarum subsp. plantarum MA418. Bun height might have been influenced by the bacterial exopolysaccharide production of Lc. citreum DCM65 that was previously described as an EPS positive LAB by Müller et al. [26]. Overall, addition of sourdough started with co-culture Lc. citreum DCM65 and Lpb. plantarum subsp. plantarum MA418 (0% sugar) was able to fully compensate a total sugar reduction resulting in same height as the reference buns (9% sugar).
Sugar content also influenced the slice area of the buns (Figure 2C). In the reference buns, bigger slice areas were determined with low sugar levels (0 and 3%) compared to the higher sugar levels (6 and 9%). Correlation analysis revealed an inverse relationship between sugar content and slice area (r = −0.521, p ≤ 0.05). Furthermore, the starter cultures applied in sourdough fermentations showed effects on the size of the slice area. Whereas sourdough buns started with Lc. citreum DCM65 had a significant smaller slice area, sourdough buns started with Lpb. plantarum subsp. plantarum MA418 as single culture or in co-culture with Lc. citreum DCM65 had a significant bigger slice area that reached values of more than 7000 mm2 for Lpb. plantarum subsp. plantarum MA418 single culture sourdough buns with 0% sugar, which is also visualized in Figure 3. The metabolites, acetic acid (r = −0.818, p ≤ 0.005), and mannitol (r = −0.832, p ≤ 0.001), produced during the sourdough fermentation started with Lc. citreum DCM65 in buns were negatively correlated with slice area. As described above, the activity of the yeast can be decreased by acetic acids and, thus, also affect the slice area [43]. Further, slice area of sourdough buns (0% sugar) with Lc. citreum DCM65/Lpb. plantarum subsp. plantarum MA418 co-culture was significantly bigger with 6806 mm2 compared to the reference bun (0% sugar; without sourdough) with 6354 mm2. Additionally, and as expected, slice area was positively correlated with bun volume (r = 0.855, p ≤ 0.0001).

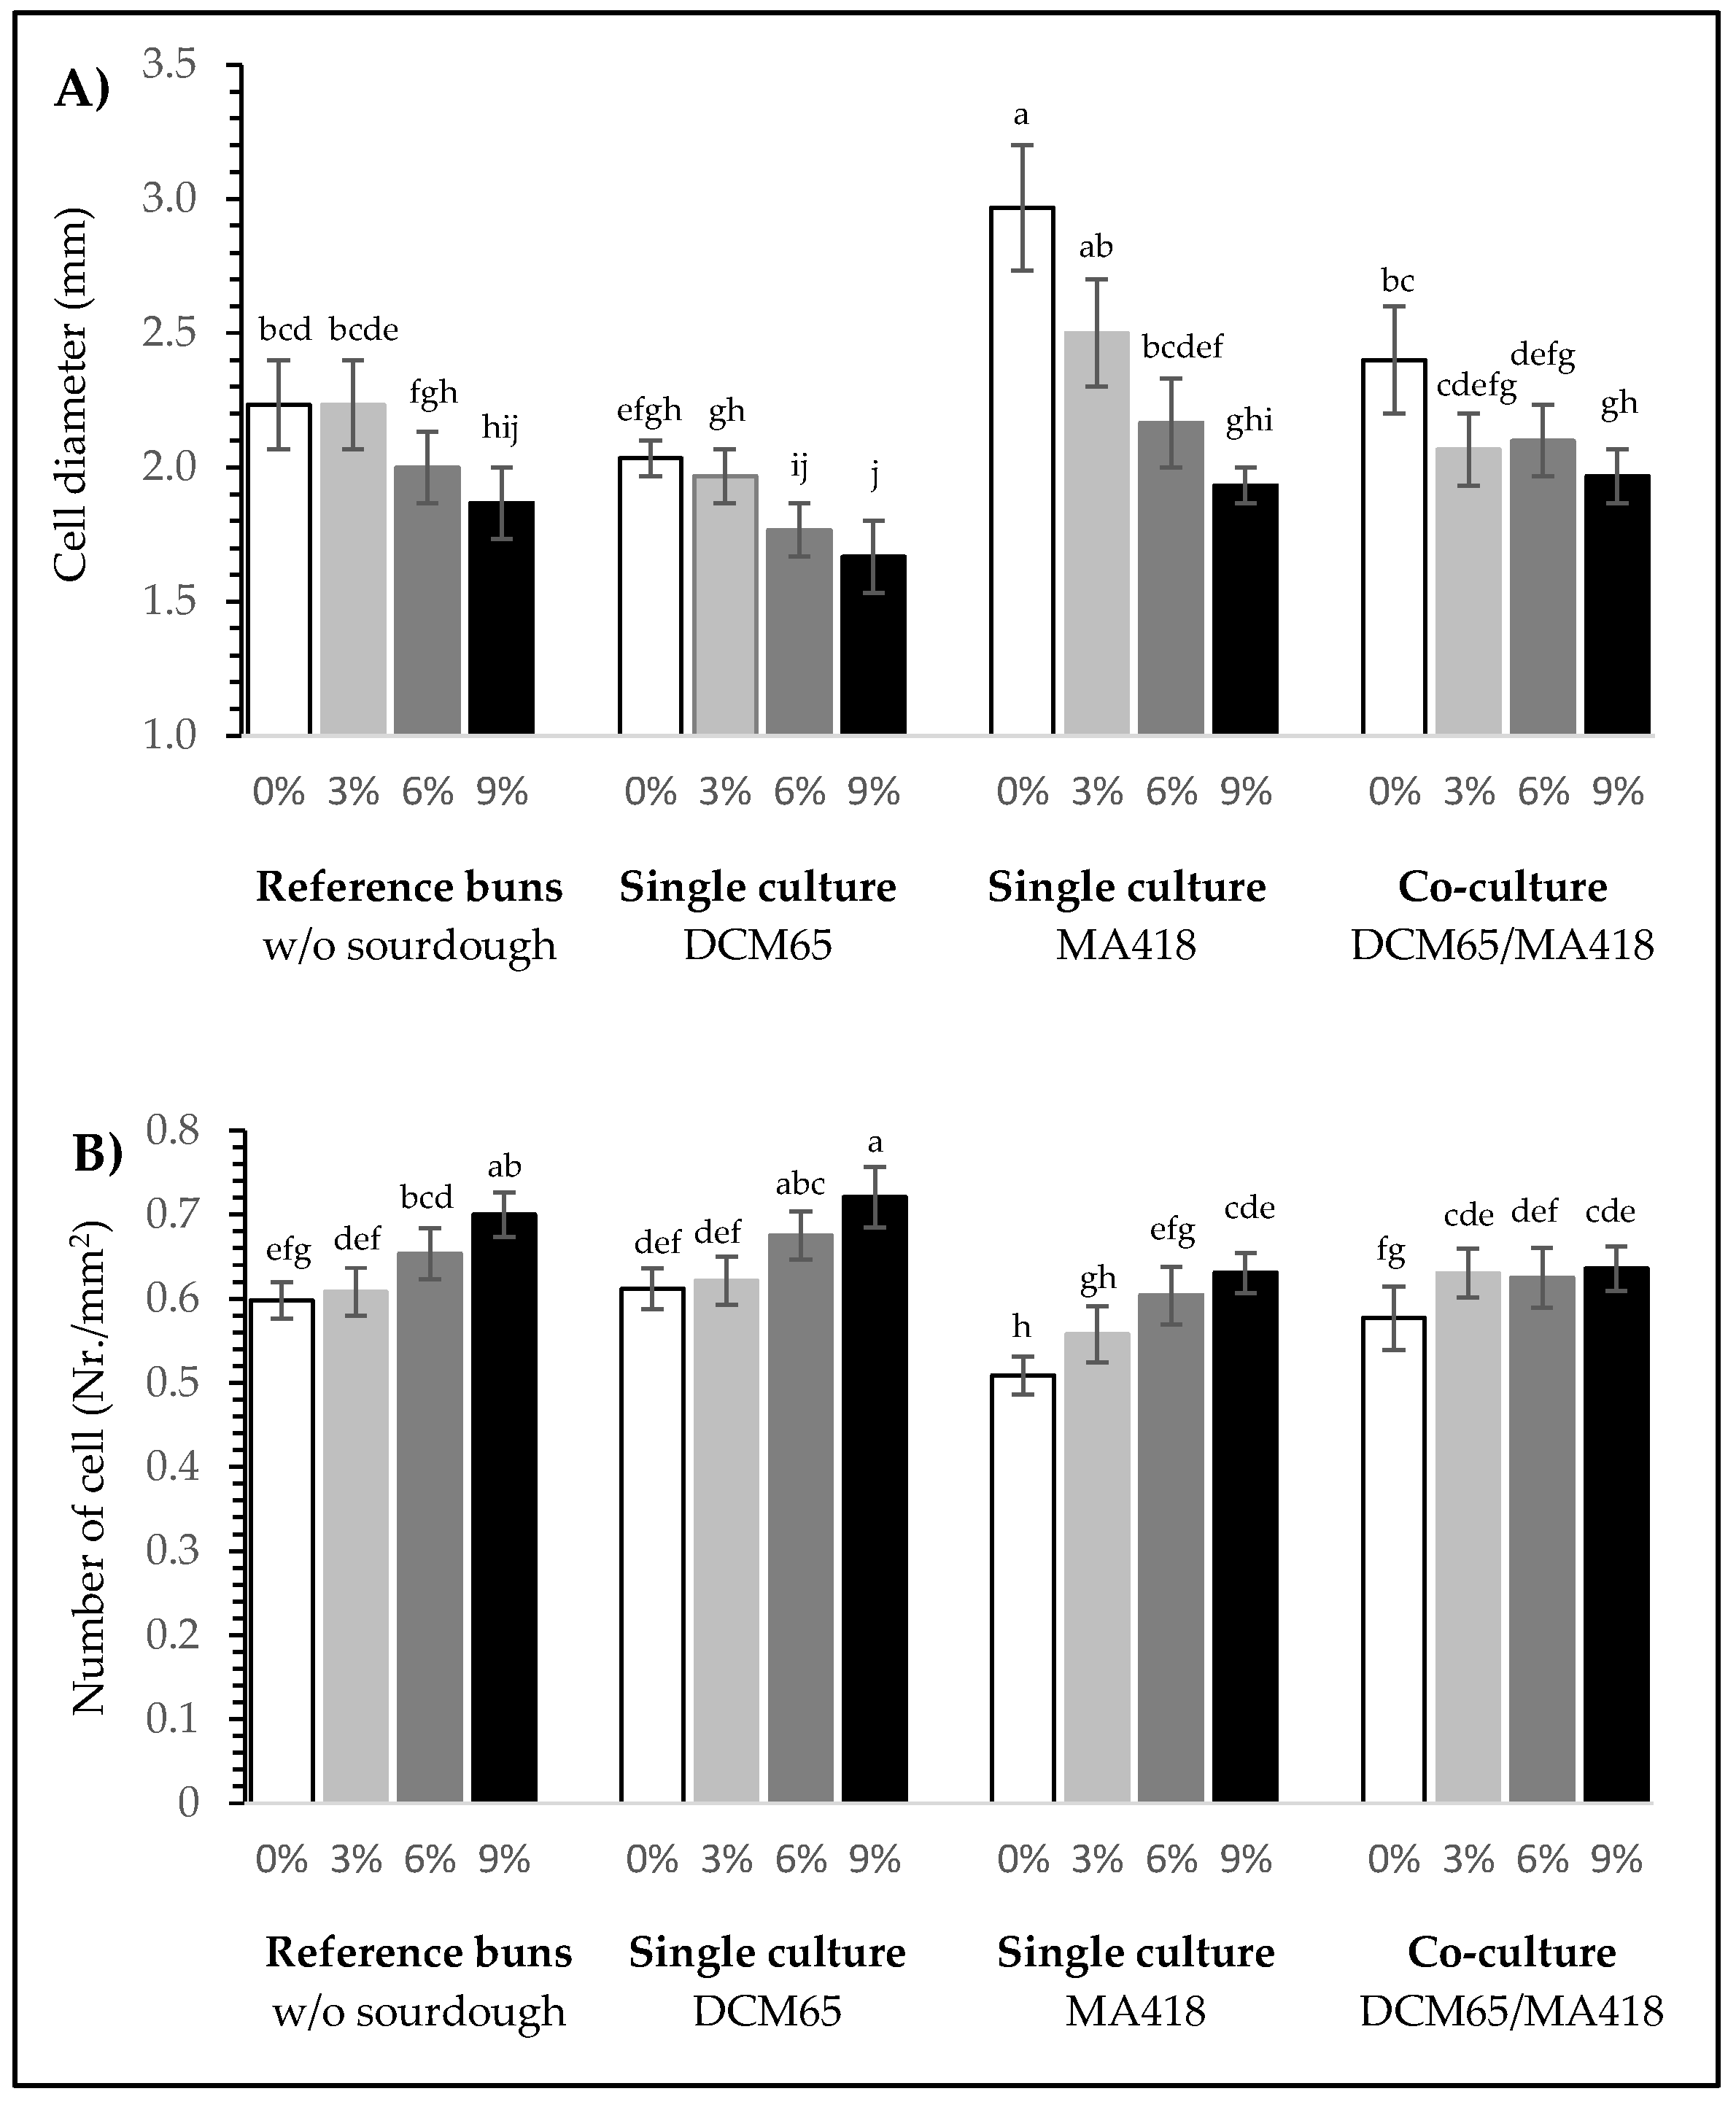
3.2.4. Pore Structure
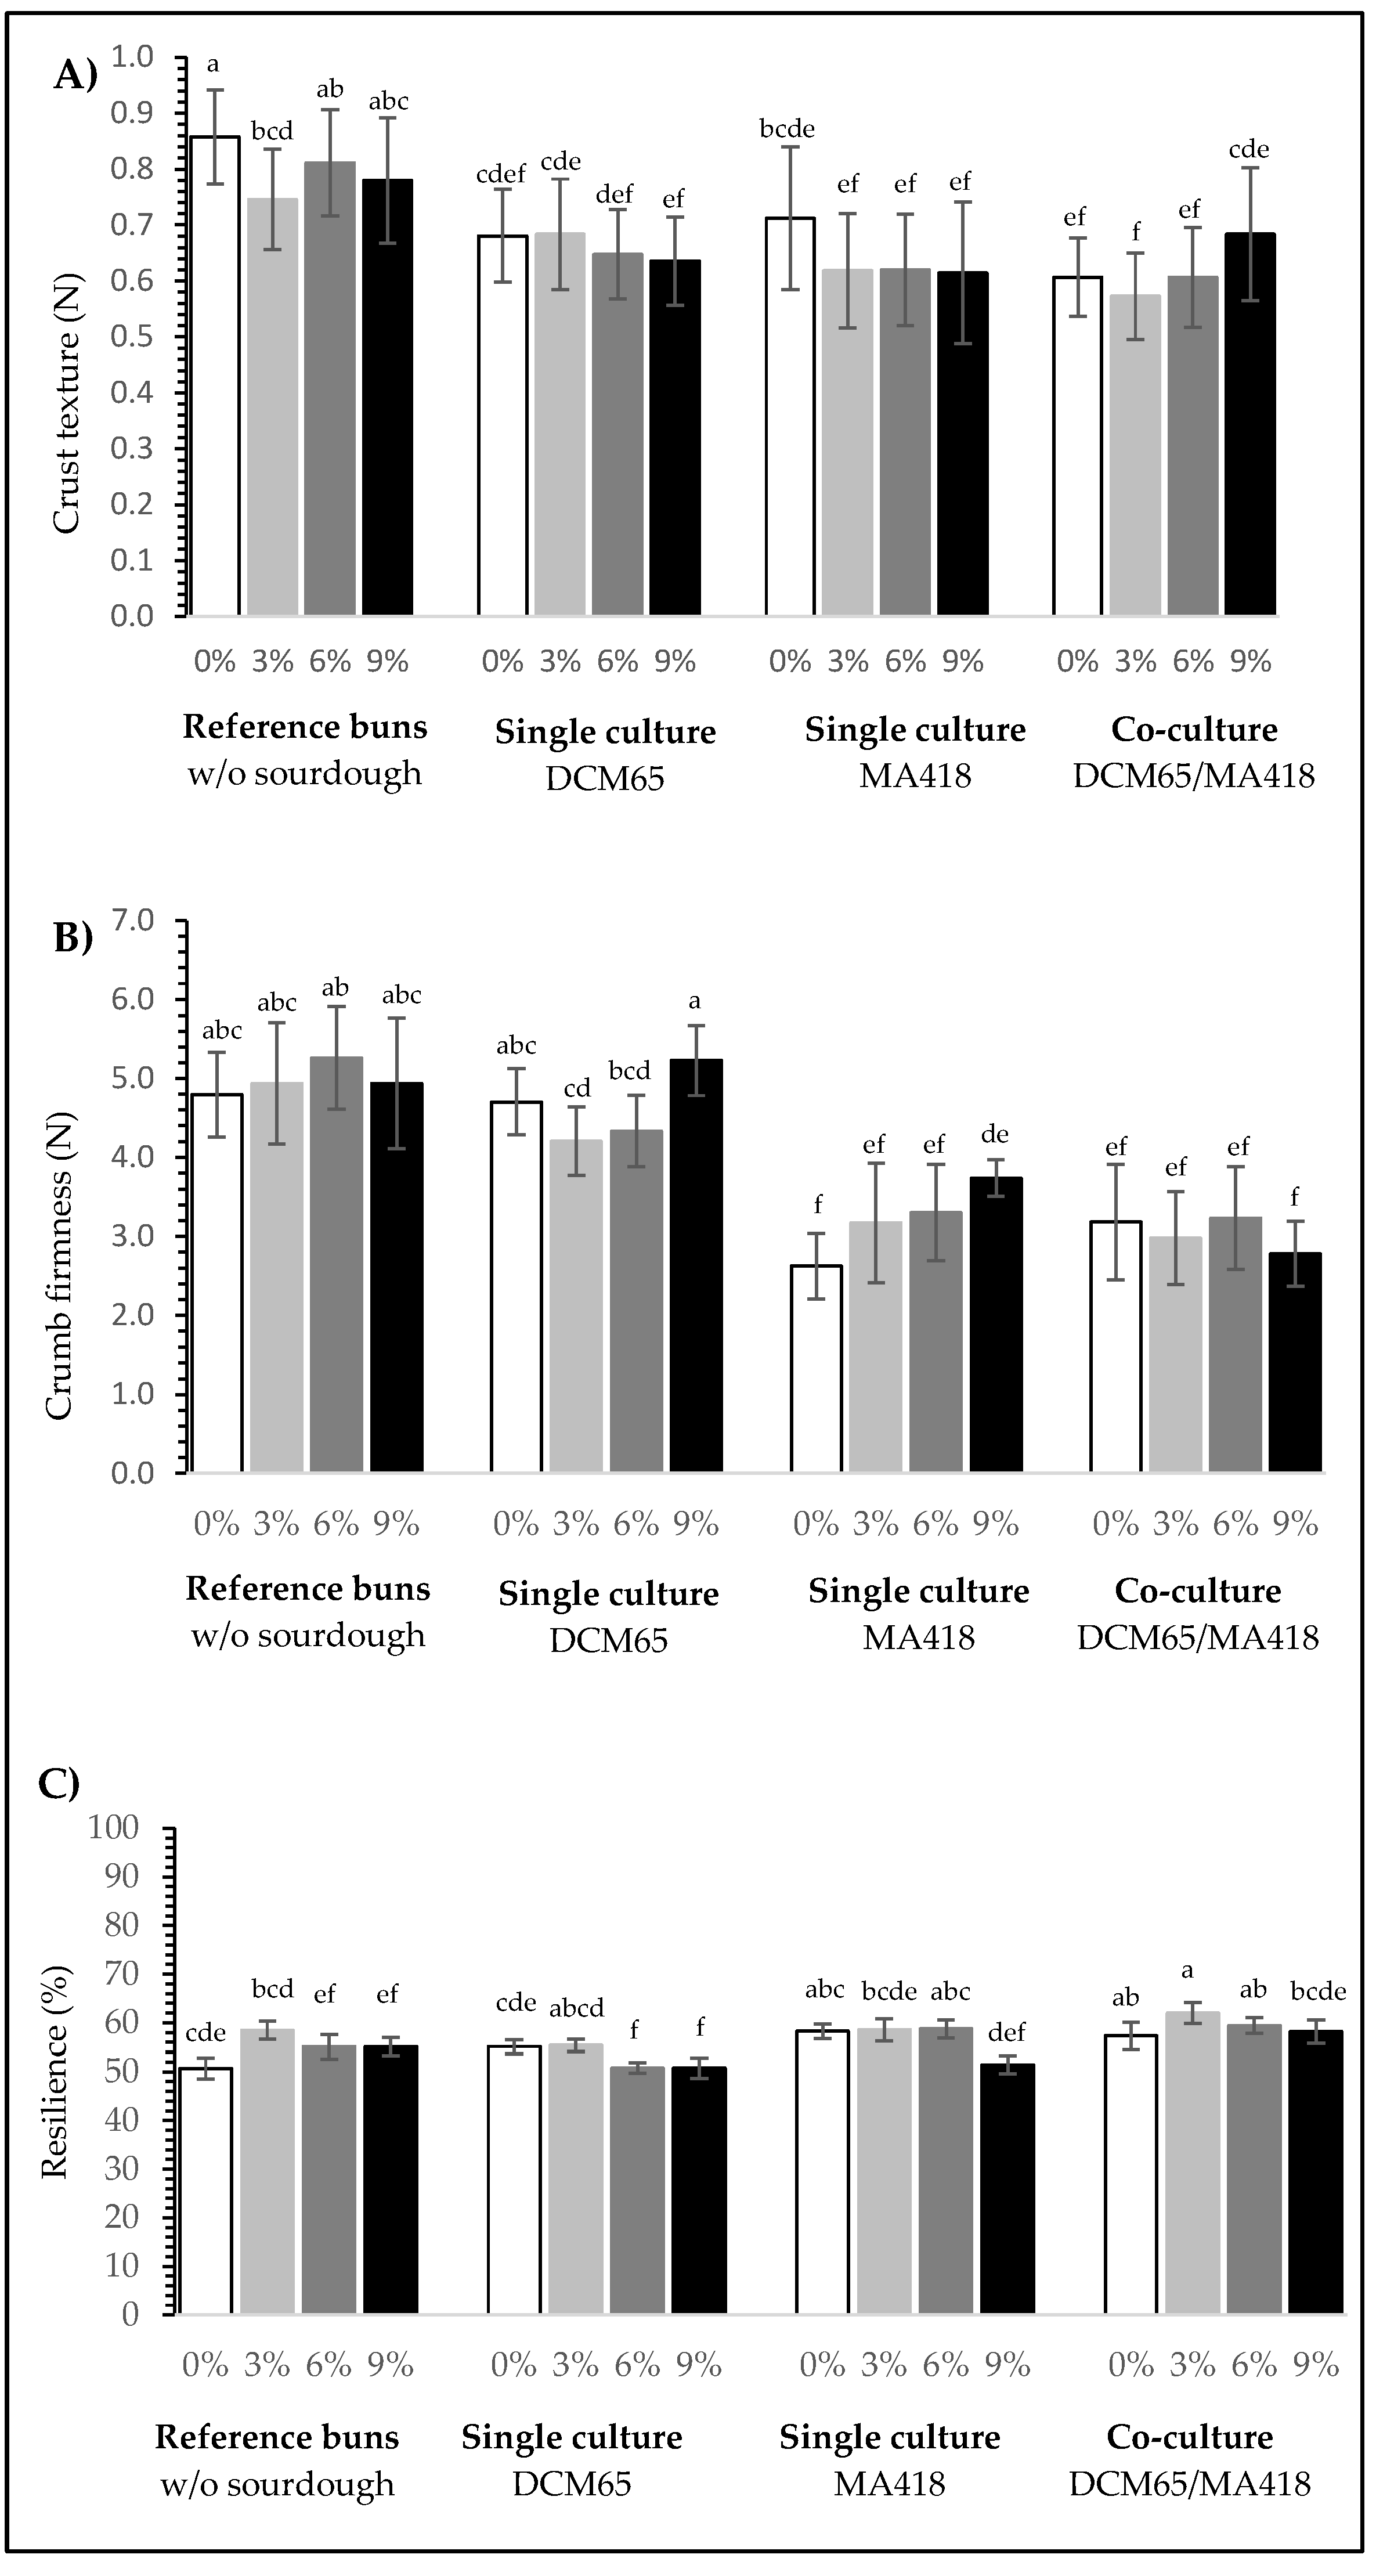
Pore structure gives important indications about bread quality. Figure 4A shows that the sugar content had a significant impact on pore cell diameter with the general observation of the higher the sugar content, the smaller the cell diameters. This tendency was also evident in sourdough buns (independent of starter culture). Those findings were confirmed by correlation analysis where an inverse relationship between cell diameter and sugar content (r = −0.650, p ≤ 0.01) was found. However, significantly larger cell diameters were measured in buns with sourdough started with Lpb. plantarum subsp. plantarum MA418 compared to the buns produced with sourdough started with Lc. citreum DCM65. In comparison, the cell pore values of the buns where both LAB were added in co-culture lay in-between those of each single culture and were comparable with the reference buns. To conclude, cell diameter was smallest in buns from sourdough started with Lc. citreum DCM65. A denser crumb can be a consequence of a weakened gluten network [21]. Further, cell diameter was positively correlated with slice area (r = 0.900, p ≤ 0.0001) but negatively correlated with number of cells (r = −0.921, p ≤ 0.0001). The impact of the cultures (single or in co-culture) on the cell diameter is also shown in Figure 3.
The number of cells in bun crumb is shown in panel B of Figure 4 and revealed a significant impact of sugar; the higher the sugar content, the more cells were found (r = 0.730, p ≤ 0.005), which was particularly evident in the reference buns, but less in the sourdough buns (independent of starter culture). The statement postulated before can be confirmed with these data for volume and slice area, as well as pore structure. Application of sourdough using Lc. citreum DCM65 and Lpb. plantarum subsp. plantarum MA418 in co-culture seems to allow compensating sugar reduction in buns since the number of cells was generally not influenced by the sugar content. The number of cells showed a positive correlation with acetic acid and mannitol, which were produced during the sourdough fermentation by Lc. citreum DCM65 (r = 0.657, p ≤ 0.05 and r = 0.655, p ≤ 0.05, respectively). Slice area had an inverse relationship with number of cells (r = −0.894, p ≤ 0.0001).

3.2.5. Bun Texture

Bun texture, including crust hardness, crumb firmness, and resilience, is essential for bun quality. Different sugar levels did not seem to influence the crust and crumb texture significantly (see Figure 5). However, crust was softer in sourdough buns (independent of starter culture) compared to the reference buns. Crumb firmness of sourdough buns started with Lc. citreum DCM65 was similar to the reference buns, whereas in the sourdough buns started with Lpb. plantarum subsp. plantarum MA418 (either single or in co-culture with Lc. citreum DCM65) the crumb was significantly softer. The resilience of the reference buns lay between 50.6 and 58.5% and was not influenced by sugar contents. Sourdough fermentation resulted in slightly higher (50.7–62.0%) resilience of the buns, but differences were rather low.
It is known that α-amylases in the dough influence bread crumb firmness by degrading starch into smaller molecules, such as dextrin [27,44,45]. As described before, Lpb. plantarum subsp. plantarum MA418 possesses amylolytic activity, therefore the buns produced from Lpb. plantarum subsp. plantarum MA418-sourdough (single or co-culture with Lc. citreum DCM65) resulted in softer crumbs compared to the reference buns and those produced from sourdough started with Lc. citreum DCM65. Bun firmness might have been influenced by other metabolites produced during sourdough fermentation by the two starter cultures Lc. citreum DCM65 or Lpb. plantarum subsp. plantarum MA418. Lactic acid content (r = −0.847, p ≤ 0.0005) was found to have an inverse relationship with crumb firmness and highest contents were detected in sourdough started with Lpb. plantarum subsp. plantarum MA418. Compared to the buns started with Lpb. plantarum subsp. plantarum MA418 as single or in co-culture with Lc. citreum DCM65, buns started with Lc. citreum DCM65 as single culture had a significantly harder crumb, which might have been influenced by higher acetic acid (r = 0.707, p ≤ 0.05) and mannitol contents (r = 0.782, p ≤ 0.005). A harder crumb structure was previously described as a result of a weakened gluten network [21].
To summarize the previously described results, buns produced with sourdough started by the co-culture Lc. citreum DCM65 and Lpb. plantarum subsp. plantarum MA418 showed most similar physical properties to the reference buns with 9% sugar addition and are, therefore, the most promising variant for sugar reduction in buns.

4. Conclusions

In this study, two functional LAB, Lc. citreum DCM65 and Lpb. plantarum subsp. plantarum MA418, were used as sourdough starters either as single culture or in co-culture for application in sugar-reduced soft buns. Lc. citreum DCM65 was selected due to its antifungal, mannitol, and EPS producing functionalities, whereas Lpb. plantarum subsp. plantarum MA418 is characterized by its amylolytic activities. It is known that the physical properties of soft buns are significantly influenced by sugar levels, which was also seen in this study. Sugar reduction influenced bun height, slice area, cell diameter, and number of cells. Both sourdough cultures were able to influence the bun properties and counteract these adverse sugar reduction effects. In this respect, the specific functional characteristics of the two selected LAB strains were very promising. Sourdough buns started with Lc. citreum DCM65 had generally a smaller slice area and a finer pore structure than the reference bun. In contrast, sourdough buns started with Lpb. plantarum subsp. plantarum had the highest bun volume, the largest slice area, and a softer bun crumb, but, also, the biggest pores and bun height was lower compared to sourdough buns started with Lc. citreum DCM65. When applying Lc. citreum DCM65 and Lpb. plantarum subsp. plantarum MA418 in co-culture, the properties of the sourdough buns were most positively affected: bun volume, bun height, slice area, and cell diameter were increased, and crumb firmness decreased. This could be observed in the buns with a sugar level of 9%, but also in sugar-reduced variants, even in buns with 0% sugar content. Further, a preliminary storage test showed that Lc. citreum DCM65 seemed to increase the shelf life of sourdough buns compared to the reference bun, confirming the antifungal potential of this particular strain.
Overall, the obtained results provide evidence that sourdough addition started with Lc. citreum DCM65 and Lpb. plantarum subsp. plantarum MA418 in co-culture is promising for future clean label and sugar-reduced baking strategies.

Supplementary Materials

The following supporting information can be downloaded at: https://0-www-mdpi-com.brum.beds.ac.uk/article/10.3390/fermentation8020042/s1, Table S1: Pearson correlation analysis.

Author Contributions

Conceptualization, D.C.M., M.K., S.M.S. and R.S.; methodology, D.C.M. and P.N.; investigation, D.C.M., S.S. and P.N.; writing—original draft preparation, D.C.M., M.K. and R.S.; writing—review and editing, D.C.M., S.S., P.N., R.S. and S.M.S.; visualization, D.C.M., M.K. and R.S.; supervision, S.M.S. and R.S.; project administration, S.M.S.; funding acquisition, S.M.S. All authors have read and agreed to the published version of the manuscript.

Funding

This research was funded by Innosuisse (project No. 27772.1 PFLS-LS).

Institutional Review Board Statement

Not applicable.

Informed Consent Statement

Not applicable.

Data Availability Statement

Data presented within this paper.

Acknowledgments

The authors thank the industry partners (Fortisa AG and Diosna Dierks & Söhne GmbH), Carlo Pica (Fortisa AG) for technical support in baking experiments, Susette Freimüller Leischtfeld (ZHAW) for support in statistical analysis, and Sandra Mischler (ZHAW) for support in HPLC analysis.

Conflicts of Interest

The authors declare no conflict of interest.

References

  1. Gioia, L.C.; Ganancio, J.R.; Steel, C.J. Food additives and processing aids used in breadmaking. In Food Additives; Karunaratne, D.N., Pamunuwa, G., Eds.; InTech: London, UK, 2017; pp. 147–166. [Google Scholar]
  2. Sahin, A.W.; Axel, C.; Arendt, E.K. Understanding the function of sugar in burger buns: A fundamental Study. Eur. Food Res. Technol. 2017, 243, 1905–1915. [Google Scholar] [CrossRef]
  3. Bean, M.M.; Yamazaki, W.T. Wheat starch gelatinization in sugar solutions. Sucrose: Microscopy and viscosity effects. Cereal Chem. 1977, 55, 936–944. [Google Scholar]
  4. Davis, E.A. Functionality of sugars: Physicochemical interactions in food. Am. J. Clin. Nutr. 1995, 62, 170–177. [Google Scholar] [CrossRef]
  5. Cauvain, S.P. Breadmaking: An Overview. In Breadmaking, 2nd ed.; Cauvain, S.P., Ed.; Woodhead Publishing: Sawston, UK, 2012; pp. 9–31. [Google Scholar]
  6. Azizi, M.H.; Rajabzadeh, N.; Riahi, E. Effect of mono-diglyceride and lecithin on dough rheological characteristics and quality of flat bread. LWT-Food Sci. Technol. 2003, 36, 189–193. [Google Scholar] [CrossRef]
  7. Gómez, M.; del Real, S.; Rosell, C.M.; Ronda, F.; Blanco, C.A.; Caballero., P.A. Functionality of different emulsifiers on the performance of breadmaking and wheat bread quality. Eur. Food Res. Technol. 2004, 219, 145–150. [Google Scholar] [CrossRef]
  8. Legan, J.D. Mould spoilage of bread: The problem and some solutions. Int. Biodeter. Biodegr. 1993, 32, 33–53. [Google Scholar] [CrossRef]
  9. Marín, S.; Guynot, M.E.; Neira, P.; Bernadó, M.; Sanchis, V.; Ramos, A.J. Risk assessment of the use of sub-optimal levels of weak-acid preservatives in the control of mould growth on bakery products. Int. J. Food Microbiol. 2002, 79, 203–211. [Google Scholar] [CrossRef]
  10. Samapundo, S.; Devlieghere, F.; Vroman, A.; Eeckhout, M. Antifungal activity of fermentates and their potential to replace propionate in bread. LWT-Food Sci. Technol. 2017, 76, 101–107. [Google Scholar] [CrossRef]
  11. Passarinho, A.T.P.; Dias, N.F.; Camilloto, G.P.; Cruz, R.S.; Otoni, C.G.; Moraes, A.R.F.; de Soares, N.F.F. Sliced bread preservation through oregano essential oil-containing sachet: Bread preservation through antimicrobial sachet. J. Food Process. Eng. 2014, 37, 53–62. [Google Scholar] [CrossRef]
  12. Dong, Y.; Karboune, S. A Review of bread qualities and current strategies for bread bioprotection: Flavor, sensory, rheological, and textural attributes. Compr. Rev. Food Sci. Food Saf. 2021, 20, 1937–1981. [Google Scholar] [CrossRef]
  13. Gänzle, M.G. Enzymatic and bacterial conversions during sourdough fermentation. Food Microbiol. 2014, 37, 2–10. [Google Scholar] [CrossRef]
  14. Abid, Y.; Azabou, S.; Blecker, C.; Gharsallaoui, A.; Corsaro, M.M.; Besbes, S.; Attia, H. Rheological and emulsifying properties of an exopolysaccharide produced by potential probiotic Leuconostoc citreum-BMS sstrain. Carbohydr. Polym. 2021, 256, 117523. [Google Scholar] [CrossRef] [PubMed]
  15. Saha, B.C.; Nakamura, L.K. Production of mannitol and lactic acid by fermentation with Lactobacillus intermedius NRRL B-3693. Biotechnol. Bioeng. 2003, 82, 864–871. [Google Scholar] [CrossRef] [PubMed]
  16. Wisselink, H.W.; Weusthuis, R.A.; Eggink, G.; Hugenholtz, J.; Grobben, G.J. Mannitol production by lactic acid bacteria: A review. Int. Dairy J. 2002, 12, 151–161. [Google Scholar] [CrossRef]
  17. Petrova, P.; Emanuilova, M.; Petrov, K. Amylolytic Lactobacillus strains from Bulgarian fermented beverage boza. J. Nat. Res. 2010, 65, 218–224. [Google Scholar] [CrossRef]
  18. Ding, S.; Yang, J. The effects of sugar alcohols on rheological properties, functionalities, and texture in baked products—A review. Trends Food Sci. Technol. 2021, 111, 670–679. [Google Scholar] [CrossRef]
  19. Sahin, A.W.; Axel, C.; Zannini, E.; Arendt, E.K. Xylitol, mannitol and maltitol as potential sucrose replacers in burger buns. Food Funct. 2018, 9, 2201–2212. [Google Scholar] [CrossRef] [PubMed]
  20. Gänzle, M.G. Lactic metabolism revisited: Metabolism of lactic acid bacteria in food fermentations and food spoilage. Curr. Opin. Food Sci. 2015, 2, 106–117. [Google Scholar] [CrossRef]
  21. Sahin, A.W.; Rice, T.; Zannini, E.; Axel, C.; Coffey, A.; Lynch, K.M.; Arendt, E.K. Leuconostoc citreum TR116: In-situ production of mannitol in sourdough and its application to reduce sugar in burger buns. Int. J. Food Microbiol. 2019, 302, 80–89. [Google Scholar] [CrossRef]
  22. Galle, S.; Arendt, E.K. Exopolysaccharides from sourdough lactic acid bacteria. Crit. Rev. Food Sci. Nutr. 2014, 54, 891–901. [Google Scholar] [CrossRef]
  23. Schwab, C.; Mastrangelo, M.; Corsetti, A.; Gänzle, M. Formation of oligosaccharides and polysaccharides by Lactobacillus reuteri LTH5448 and Weissella cibaria 10M in sorghum sourdoughs. Cereal Chem. 2008, 85, 679–684. [Google Scholar] [CrossRef]
  24. Coda, R.; Xu, Y.; Moreno, D.S.; Mojzita, D.; Nionelli, L.; Rizzello, C.G.; Katina, K. Performance of Leuconostoc citreum FDR241 during wheat flour sourdough Type I propagation and transcriptional analysis of exopolysaccharides biosynthesis genes. Food Microbiol. 2018, 76, 164–172. [Google Scholar] [CrossRef] [PubMed]
  25. Dlusskaya, E.; Jänsch, A.; Schwab, C.; Gänzle, M.G. Microbial and chemical analysis of a kvass fermentation. Eur. Food Res. Technol. 2008, 227, 261–266. [Google Scholar] [CrossRef]
  26. Müller, D.C.; Mischler, S.; Schönlechner, R.; Miescher Schwenninger, S. Multiple techno-functional characteristics of Leuconostoc and their potential in sourdough fermentations. Microorganisms 2021, 9, 1633. [Google Scholar] [CrossRef]
  27. Goesaert, H.; Slade, L.; Levine, H.; Delcour, J.A. Amylases and bread firming—An integrated view. J. Cereal Sci. 2009, 50, 345–352. [Google Scholar] [CrossRef]
  28. Zheng, J.; Wittouck, S.; Salvetti, E.; Franz, C.M.A.P.; Harris, H.M.B.; Mattarelli, P.; O’Toole, P.W.; Pot, B.; Vandamme, P.; Walter, J.; et al. A taxonomic note on the genus Lactobacillus: Description of 23 novel genera, emended description of the genus Lactobacillus Beijerinck 1901, and union of Lactobacillaceae and Leuconostocaceae. Int. J. Syst. Evol. Microbiol. 2020, 70, 2782–2858. [Google Scholar] [CrossRef]
  29. Reddy, G.; Altaf, M.d.; Naveena, B.J.; Venkateshwar, M.; Kumar, E.V. Amylolytic bacterial lactic acid fermentation—A review. Biotechnol. Adv. 2008, 26, 22–34. [Google Scholar] [CrossRef] [PubMed]
  30. Sanni, A.I.; Morlon-Guyot, J.; Guyot, J.P. New efficient amylase-producing strains of Lactobacillus plantarum and L. fermentum isolated from different Nigerian traditional fermented foods. Int. J. Food Microbiol. 2002, 72, 53–62. [Google Scholar] [CrossRef]
  31. Sadiq, F.A.; Yan, B.; Tian, F.; Zhao, J.; Zhang, H.; Chen, W. Lactic acid bacteria as antifungal and anti-mycotoxigenic agents: A comprehensive review. Compr. Rev. Food Sci. Food Saf. 2019, 18, 1403–1436. [Google Scholar] [CrossRef] [Green Version]
  32. Black, B.A.; Zannini, E.; Curtis, J.M.; Gänzle, M.G. Antifungal hydroxy fatty acids produced during sourdough fermentation: Microbial and enzymatic pathways, and antifungal activity in bread. Appl. Environ. Microbiol. 2013, 79, 1866–1873. [Google Scholar] [CrossRef] [Green Version]
  33. Dal Bello, F.; Clarke, C.I.; Ryan, L.A.M.; Ulmer, H.; Schober, T.J.; Ström, K.; Sjögren, J.; van Sinderen, D.; Schnürer, J.; Arendt, E.K. Improvement of the quality and shelf life of wheat bread by fermentation with the antifungal strain Lactobacillus plantarum FST 1.7. J. Cereal Sci. 2007, 45, 309–318. [Google Scholar] [CrossRef]
  34. Axel, C.; Brosnan, B.; Zannini, E.; Peyer, L.C.; Furey, A.; Coffey, A.; Arendt, E.K. Antifungal activities of three different Lactobacillus species and their production of antifungal carboxylic acids in wheat sourdough. Appl. Microbiol. Biotechnol. 2016, 100, 1701–1711. [Google Scholar] [CrossRef] [PubMed]
  35. Miescher Schwenninger, S.; Freimüller Leischtfeld, S.; Gantenbein-Demarchi, C. High-throughput identification of the microbial biodiversity of cocoa bean fermentation by MALDI-TOF MS. Lett. Appl. Microbiol. 2016, 63, 347–355. [Google Scholar] [CrossRef] [PubMed]
  36. Quattrini, M.; Liang, N.; Fortina, M.G.; Xiang, S.; Curtis, J.M.; Gänzle, M. Exploiting synergies of sourdough and antifungal organic acids to delay fungal spoilage of bread. Int. J. Food Microbiol. 2019, 302, 8–14. [Google Scholar] [CrossRef] [PubMed]
  37. Müller, D.C.; Nguyen, H.; Li, Q.; Schönlechner, R.; Miescher Schwenninger, S.; Wismer, W.; Gänzle, M. Enzymatic and microbial conversions to achieve sugar reduction in bread. Food Res. Int. 2021, 9, 110296. [Google Scholar] [CrossRef]
  38. Markowicz, D.; Monaro, E.; Siguemoto, E.; Sefor, M. Maillard reaction products in processed food: Pros and cons. In Food Industrial Processes—Methods and Equipment; Valdez, B., Ed.; InTech: London, UK, 2012; ISBN 978-953-307-905-9. [Google Scholar]
  39. Shen, Y.; Chen, G.; Li, Y. Bread characteristics and antioxidant activities of maillard reaction products of white pan bread containing various sugars. LWT 2018, 95, 308–315. [Google Scholar] [CrossRef]
  40. Martins, S.I.F.S.; Jongen, W.M.F.; van Boekel, M.A.J.S. A review of maillard reaction in food and implications to kinetic modelling. Trends Food Sci. Technol. 2000, 11, 364–373. [Google Scholar] [CrossRef]
  41. Jouquand, C.; Niquet-Léridon, C.; Jacolot, P.; Petit, N.; Marier, D.; Gadonna-Widehem, P. Effects of maillard reaction products on sensory and nutritional qualities of the traditional French baguette: Food Quality of the French Baguette. J. Food Sci. 2018, 83, 2424–2431. [Google Scholar] [CrossRef]
  42. Goldfein, K.R.; Slavin, J.L. Why sugar is added to food: Food Science 101: Challenges of labeling added sugars. Compr. Rev. Food Sci. Food Saf. 2015, 14, 644–656. [Google Scholar] [CrossRef] [Green Version]
  43. Kaditzky, S.; Seitter, M.; Hertel, C.; Vogel, R.F. Performance of Lactobacillus sanfranciscensis TMW 1.392 and its levansucrase deletion mutant in wheat dough and comparison of their impact on bread quality. Eur. Food Res. Technol. 2008, 227, 433–442. [Google Scholar] [CrossRef]
  44. Purhagen, J.K.; Sjöö, M.E.; Eliasson, A.-C. Starch affecting anti-staling agents and their function in freestanding and pan-baked bread. Food Hydrocoll. 2011, 25, 1656–1666. [Google Scholar] [CrossRef]
  45. Chen, Y.; Eder, S.; Schubert, S.; Gorgerat, S.; Boschet, E.; Baltensperger, L.; Boschet, E.; Städeli, C.; Kuster, S.; Fischer, P.; et al. Influence of amylase addition on bread quality and bread staling. ACS Food Sci. Technol. 2021, 1, 1143–1150. [Google Scholar] [CrossRef]
Figure 1. Organic acids after sourdough fermentation (30 °C, 24 h) started with Lc. citreum DCM65 or Lpb. plantarum subsp. plantarum MA418 as single or co-culture. Bars in the figure for each compound (lactic acid or acetic acid) differ significantly (p ≤ 0.05) if they do not share the same letter.
Fermentation 08 00042 g001
Figure 2. Volume, height, and slice area of reference buns and sourdough buns (20% sourdough addition) either started with single cultures Lc. citreum DCM65 or Lpb. plantarum subsp. plantarum MA418 or with a co-culture of Lc. citreum DCM65 and Lpb. plantarum subsp. plantarum MA418 and at different sugar levels in dough (0, 3, 6, and 9%). Panel (A) Volume; Panel (B) Height; Panel (C) Slice area. Bars differ significantly (p  0.05) if they do not share the same letter.
Fermentation 08 00042 g002
Figure 3. Photos of buns (sliced horizontally, top view of the lower part) depicting slice area and pore structure of reference buns (9% and 0% sugar) and sourdough buns produced with 0% sugar in dough. From left to right: Reference buns (without sourdough addition) 9% sugar and 0% sugar, bun with 20% sourdough inoculated with Lc. citreum DCM65, with Lpb. plantarum subsp. plantarum MA418 as single cultures, and inoculated with both, Lc. citreum DCM65 and Lpb. plantarum subsp. plantarum MA418 in co-culture.
Fermentation 08 00042 g003
Figure 4. Pore structure of reference buns and sourdough buns (20% sourdough addition) either started with single cultures Lc. citreum DCM65 or Lpb. plantarum subsp. plantarum MA418 or with a co-culture of Lc. citreum DCM65 and Lpb. plantarum subsp. plantarum MA418 and at different sugar levels in dough (0, 3, 6, and 9%). Panel (A) Cell diameter of pores; Panel (B) Number of cells. Bars differ significantly (p  0.05) if they do not share the same letter.
Fermentation 08 00042 g004
Figure 5. Crust and crumb firmness and resilience of reference buns and sourdough buns (20% sourdough addition) either started with single cultures of Lc. citreum DCM65 or Lpb. plantarum subsp. plantarum MA418 or with a co-culture of Lc. citreum DCM65 and Lpb. plantarum subsp. plantarum MA418 and at different sugar levels in dough (0, 3, 6, and 9%). Panel (A) Crust firmness; Panel (B) Crumb firmness; Panel (C) Resilience. Bars differ significantly (p  0.05) if they do not share the same letter.
Fermentation 08 00042 g005
Table 1. Set-up of the experiments.
Sugar Addition
(% of Flour)
Sourdough Addition
(% of Flour)
Culture Addition
Reference buns9-
6-
3--
0-
Sourdough buns920Single culture:
Lc. citreum DCM65
620
320
020
920Single culture:
Lpb. plantarum subsp.
plantarum MA418
620
320
020
920Co-culture:
Lc. citreum DCM65 &
Lpb. plantarum subsp.
plantarum MA418
620
320
020
Table 2. Bun recipe for reference and sourdough buns given in percent of flour.
Ingredients (% of Flour)Reference Bun
(w/o Sourdough)
Sourdough Bun
(20% Addition)
Dough ingredients
Flour10080
Tap water60–64 (1)40–44
Sugar (2)0/3/6/90/3/6/9
Canola oil55
Salt1.61.6
Yeast22
Wheat gluten
Sourdough (3)
0.60.6
43
Sourdough ingredients
Flour 20
Tap water (including liquid culture) 20
Sucrose 1.5
Fructose 1.5
(1) Adjusted to consistent viscosity. (2) Sugar addition depending on recipe either 0, 3, 6, or 9%. (3) Recipes see Section 2.2.1.
Table 3. Cell counts, pH, and contents of fructose and mannitol in sourdough fermentations (30 °C, 24 h) inoculated with single cultures of Lc. citreum DCM65 or Lpb. plantarum subsp. plantarum MA418 or with co-culture of Lc. citreum DCM65 and Lpb. plantarum subsp. plantarum MA418. Values depicted are average values ± standard deviation. Values followed by the same superscript letter within row of each parameter and point in time (t0 and t24) are not significantly different (p ≤ 0.05).
Sourdough Fermentation with Single and Co-Culture:
DCM65MA418DCM65 and MA418
Sugar content in dough (% flour)
036903690369
LAB counts (log CFU/g)
t08.0 ± 0.2 a7.8 ± 0.1 a8.0 ± 0.2 a7.9 ± 0.4 a7.8 ± 0.2 a7.8 ± 0.2 a7.7 ± 0.1 a7.8 ± 0.5 a7.6 ± 0.2 a7.9 ± 0.1 a7.8 ± 0.0 a7.5 ± 0.1 a
t24 9.1 ± 0.3 ab 9.2 ± 0.1 a 9.1 ± 0.2 ab 9.2 ± 0.1 a 9.1 ± 0.3 ab 8.9 ± 0.1 ab9.1 ± 0.2 ab8.8 ± 0.5 ab8.8 ± 0.4 ab 8.4 ± 0.3 b8.7 ± 0.4 ab8.9 ± 0.3 ab
pH
t0 6.5 ± 0.0 a 6.5 ± 0.0 a 6.5 ± 0.0 a 6.5 ± 0.0 a 6.5 ± 0.0 a 6.5 ± 0.0 a 6.5 ± 0.0 a 6.5 ± 0.0 a 6.4   ±   0.1   a 6.4   ±   0.0   a 6.4   ±   0.1   a 6.5 ± 0.1 a
t24 4.0 ± 0.0 a 4.0 ± 0.0 a 4.0 ± 0.0 a 4.0 ± 0.1 a 3.8 ± 0.1 b 3.8 ± 0.0 b 3.8 ± 0.0 b 3.8 ± 0.0 b 3.8 ± 0.1 b 3.8 ± 0.1 b 3.7 ± 0.0 b 3.8 ± 0.1 b
Fructose (mg/g sourdough)
t015.7 ± 2.4 ab 17.2   ±   2.7   a 17.1   ±   1.9   a 16.1   ±   3.4   ab 15.0 ± 0.6 ab 14.4 ± 0.3 ab 11.8 ± 3.8 ab 14.2 ± 1.3 ab 12.9   ±   1.2   ab10.4 ± 2.2 b12.1 ± 0.9 ab10.4 ± 2.7 b
t245.5 ± 0.9 e6.2 ± 0.3 de5.4 ± 1.4 e5.5 ± 0.8 e11.2 ± 0.3 ab12.2 ± 0.1 a10.9 ± 2.2 abc11.0 ± 0.7 ab6.9 ± 1.1 de7.7 ± 0.7 de9.1 ± 1.2 bcd7.9 ± 0.7 cde
Mannitol (mg/g sourdough)
t0n.d.n.d.n.d.n.d.n.d.n.d.n.d.n.d.n.d.n.d.n.d.n.d.
t24 8.6   ±   1.0   a 9.8 ± 0.4 a 9.6   ±   0.5   a 9.0 ± 0.5 an.d.n.d.n.d.n.d. 3.0   ±   0.5   b3.3 ± 0.3 b 3.2 ± 0.3 b 4.1 ± 1.3 b
n.d. = not detectable.
Table 4. Crumb and crust color, and aw-values of buns produced without (reference buns) and with sourdough containing different levels of sugar (0, 3, 6, 9%). Lc. citreum DCM65 and Lpb. plantarum subsp. plantarum MA418 were either used as single cultures or as co-culture. Values followed by the same superscript letter within row of each parameter are not significantly different (p 0.05).
Reference BunsSourdough Buns with Starter Cultures:
w/o SourdoughDCM65MA418DCM65/MA418
Sugar addition (% flour)
0369036903690369
L*-value crust
69.9 ± 4.1 a61.1 ± 3.9 bcde59.2 ± 4.5 cdef58.4 ± 4.5 def60.7 ± 2.9 cde63.0 ± 4.8 abcde64.0 ± 5.4 abcd59.7 ± 4.7 cdef65.1 ± 3.4 abc60.7 ± 3.8 cdef58.2 ± 5.6 def58.9 ± 6.1 cdef67.5 ± 2.4 ab58.9 ± 5.3 cdef57.5 ± 5.9 ef54.1 ± 5.8 f
a*-value crust
2.0 ± 1.9 d8.1 ± 2.7 c10.7 ± 2.1 bc11.1 ± 2.8 abc1.7 ± 1.7 d8.9 ± 3.5 c8.8 ± 3.7 ± c12.2 ± 2.8 ab4.0 ± 2.2 d8.2 ± 2.5 c10.9 ± 3.6 abc10.9 ± 3.7 abc3.4 ± 1.8 d10.2 ± 3.4 bc12.7 ± 3.3 ab14.0 ± 2.8 a
b*-value crust
27.3 ± 3.3 d32.9 ± 1.4 abc34.9 ± 0.8 a34.5 ± 1.4 ab19.4 ± 2.8 e35.0 ± 2.3 a34.8 ± 2.7 a36.8 ± 1.2 a29.0 ± 2.8 cd33.5 ± 1.5 ab34.7 ± 1.6 ab34.9 ± 1.8 a30.2 ± 2.6 bcd34.2 ± 1.3 ab35.6 ± 1.3 a34.8 ± 2.0 a
L*-value crumb
69.1 ± 2.4 cd69.8 ± 1.8 bcd71.0 ± 1.2 ab71.2 ± 1.1 ab70.1 ± 1.3 bcd72.3 ± 1.4 a71.8 ± 2.8 a72.4 ± 1.3 a68.8 ± 1.4 d68.8 ± 1.3 d70.6 ± 1.5 bc70.8 ± 1.2 bc70.4 ± 1.0 bcd70.1 ± 1.3 bcd71.3 ± 1.3 ab71.3 ± 1.2 ab
a*-value crumb
−1.2 ± 0.1 a−1.2 ± 0.1 a−1.2 ± 0.1 a−1.3 ± 0.1 a−1.1 ± 0.1 a−1.3 ± 0.1 a−0.5 ± 2.0 a−1.3 ± 0.1 a−1.2 ± 0.1 a−1.3 ± 0.1 a−1.2 ± 0.1 a−1.2 ± 0.1 a−1.2 ± 0.1 a−1.2 ± 0.0 a−1.2 ± 0.1 a−1.2 ± 0.0 a
b*-value crumb
16.2 ± 0.5 bcd16.5 ± 0.5 bcd16.7 ± 0.7 abc16.5 ± 0.3 bc16.7 ± 0.5 bc16.4 ± 0.5 bcd18.1 ± 2.6 a17.4 ± 0.5 ab14.8 ± 0.7 e15.1 ± 0.8 de15.6 ± 0.7 cde16.0 ± 0.4 cde15.6 ± 0.7 cde15.7 ± 0.7 cde15.8 ± 0.8 cde14.8 ± 0.5 e
aw-value
0.933 ± 0.006 ab0.931 ± 0.002 abc0.927 ± 0.002 bcd0.916 ± 0.006 e0.934 ± 0.004 ab0.919 ± 0.007 de0.913 ± 0.010 e0.910 ± 0.007 e0.936 ± 0.003 a0.926 ± 0.005 cd0.926 ± 0.005 cd0.916 ± 0.006 e0.935 ± 0.002 a0.929 ± 0.003 abc0.916 ± 0.004 e0.917 ± 0.003 e
Publisher’s Note: MDPI stays neutral with regard to jurisdictional claims in published maps and institutional affiliations.

