Article

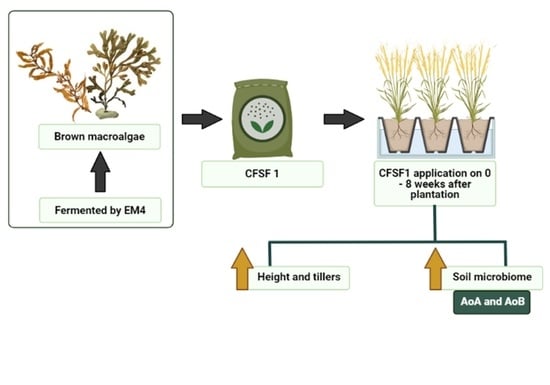
Seaweed Fertilizer Prepared by EM-Fermentation Increases Abundance of Beneficial Soil Microbiome in Paddy (Oryzasativa L.) during Vegetative Stage

by
Eka Sunarwidhi Prasedya
1,2,*,
Nanda Sofian Hadi Kurniawan
2,
Indah Alibiah Putri Kirana
2,
Nur Ardiana
2,
Angga Susmana Abidin
2,
Bq Tri Khairina Ilhami
1,
Ahmad Jupri
3,
Sri Widyastuti
4,
Haji Sunarpi
1,2 and
Aluh Nikmatullah
5
1
Bioscience and Biotechnology Research Centre, Faculty of Mathematics and Natural Sciences, University of Mataram, Mataram 83126, Indonesia
2
Department of Biology, Faculty of Mathematics and Natural Sciences, University of Mataram, Mataram 83126, Indonesia
3
Department of Environmental Science, Faculty of Mathematics and Natural Sciences, University of Mataram, Mataram 83126, Indonesia
4
Faculty of Food Technology and Agroindustry, University of Mataram, Mataram 83126, Indonesia
5
Faculty of Agriculture, University of Mataram, Mataram 83125, Indonesia
*
Author to whom correspondence should be addressed.
Submission received: 26 November 2021 / Revised: 19 January 2022 / Accepted: 19 January 2022 / Published: 21 January 2022
(This article belongs to the Section Industrial Fermentation)

Abstract

:
Excessive use of chemical fertilizer could potentially decrease soil productivity by decreasing soil microbiome diversity. In this study, we evaluated the effects of fermented seaweed fertilizer in the soil microbial community of paddy plants (Oryza sativa L.). The paddy seedlings were divided into five groups, control (C0), chemical fertilizer (CF), seaweed fertilizer (SF), chemical and seaweed fertilizer combination 50:50 (CFSF1), and chemical and fertilizer combination 75:25 (CFSF2). The CFSF1 combination showed to be the most effective in inducing plant height (83.99 ± 3.70 cm) and number of tillers (24.20 ± 4.08). After 8 weeks after transplantation, the isolated DNA from each soil treatment were subjected to 16S rRNA (v3–v4 region) next-generation sequencing. The beneficial Acidobacteriota was most abundant in CFSF1. At genus level, the nitrifying bacteria MND1 was seen to be abundant in CFSF1 and also present in other SF treatments. The genus Chujaibacter is highly abundant in CF, which potentially plays a role in denitrification resulting in soil degradation. In addition, the CFSF1-treated soils show significantly higher diversity of ammonia-oxidizing bacteria (AOB) and ammonia-oxidizing archaea (AOA). The current results could potentially contribute to the utilization of SF as a bioremediator and promoting green agriculture practice by reducing the amount of CF usage.

Graphical Abstract

1. Introduction

Paddy (Oryza sativa L.) is one of the staple crops in most Asian countries, especially Indonesia [1]. Due to the high demand of this food source, the agriculture sector struggles to meet the market demands for this crop. Hence, various strategies are conducted to increase the production of paddy rice. Until now, the application of chemical fertilizer is the most common solution for local Indonesian farmers to increase grain production. However, the long-term excessive use of chemical fertilizers could lead to various negative effects in the environment [2]. In addition, some reports have also shown the possible negative effects of excessive chemical fertilizer usage toward human health [3]. Hence, there is a need to find alternatives to decrease the use of chemical fertilizers.
Seaweed is one of the marine natural resources which are abundant in coastal areas of Indonesia [4]. Many kinds of seaweeds have been utilized as fertilizer, such Gracilaria chilensis, Ascophylum nodosum, Ecklonia maxima, Laminaria shinzii, and Durvillaea potatorum [5,6]. However, brown seaweeds such as Sargassum species have drawn much attention due to their fast-growing nature [7]. This is possibly due to the presence of plant growth hormones in Sargassum species, which potentially contributes to its rapid growth [8,9]. Seaweed has been reported to be extremely rich in nutrients, including macro- and micronutrients, which could balance the plant’s endogenous hormones and greatly promote growth [10]. Due to its high bioavailability, seaweed offers an inexpensive solution for large production of crops by decreasing the use of anorganic fertilizers. In addition, seaweed is an environmentally friendly natural resource that could improve soil fertility and productivity [11].
Some studies have shown the advantage of fermentation technology to improve the macro- and micronutrient components in fertilizers [12]. However, there still remains limited information regarding the effects of fermentation process in seaweed fertilizers [13]. Furthermore, the mechanism of seaweed fertilizers in promoting plant growth is still unclear, especially the effect of seaweed fertilizer on the community structure and diversity of soil microbiota. The soil microbial communities carry out a critical role in the ecosystem that are vital for providing carbon and other nutrients for sustaining plant growth [14]. Hence, investigation of the abundance and diversity of soil microbiota is pivotal for potentially understanding the mechanism of seaweed fertilizer that affects plant growth. In addition, most studies evaluate the effect of seaweed fertilizer during the reproductive stage [15]. Thus, little has been reported regarding the effects during the vegetative stage, which is also important since it plays an important role in the plant’s fruit development. In this study, we conducted 16S rRNA sequencing to evaluate effects of basal fermented seaweed fertilizer on the soil microbiota community of paddy plants during the vegetative stage.

2. Materials and Methods

2.1. Seaweed Fertilizer Raw Material Preparation

The fermented seaweed fertilizer was prepared based on materials which included brown seaweed biomass, molasses (Spoon Sugar Co. Ltd., Hyogo, Japan), rice husk, and commercial Effective Microorganism 4 (EM4, PT; Songgolangit Persada, Jakarta, Indonesia) as the fermentation bioactivator [16]. The brown seaweed biomass consists of three brown seaweeds (1:1:1), namely Sargassum cristaefolium, Sargassum crassifolium, and Sargassum polycystum. The seaweeds were collected from Batu Layar coastal area, West Lombok, Lombok, Indonesia (8°31′05.3″ S 116°03′41.0″ E), in early 2021. The seaweeds were washed with tap water and air-dried for approximately 5 to 7 days. During the drying process, the seaweeds were repeatedly cleaned with tap water to remove the remaining salt and impurities [17].

2.2. Seaweed Fertilizer Fermentation Process

The fermentation process was carried out in low-cost plastic drums with a capacity of 50 L each. These drums were connected to a hose to facilitate gas emission. The hoses were connected to another plastic container filled with 50% water to accommodate the safe release of exhausted gas. The design of this low-cost digester was adopted from a study by Chontal et al. with minor modifications [12]. The pretreated dried seaweed biomass was mixed with molasses (1 L/ton) and subjected to anaerobe fermentation with EM4 (1 L/ton) for 40 days. The biomass was homogenized every 3 days, followed with pH measurement, to make sure no significant differences were found in the top and bottom layers of the drum. The resulting biomass was then considered 100% fermented seaweed fertilizer.

2.3. Pot Experimental Design

The pot experiment was conducted in a greenhouse with daily sunlight exposure located at West Lombok (8°33′01.2″ S 116°06′40.7″ E). The paddy (Oryza sativa L.) plants were grown in experimental pots with a maximum volume of 10 L. The transplanted paddy seedlings were approximately 21 days old and 20–23 cm tall. A total of 50 paddy seedlings were divided into 5 groups: control group (C0), treatment with 100% chemical fertilizer (CF), treatment with 100% seaweed fertilizer (SF), and decreased concentration of CF: combination of 50% CF and 50% seaweed fertilizer (CFSF1) and combination of 25% CF and 75% seaweed fertilizer (CFSF2). The control group (C0) only contained 8 kg of soil. The 100% chemical fertilizer consisted of 300 kg/ha urea (CON2H4), 100 kg/ha trinatrium phosphate (Na3PO4), and 100 kg/ha potassium chloride (KCl), which was consistent with the local farmers fertilization practice [18]. In addition, the application of CF was done twice during the 10 and 30 days after paddy plant transplantation to experimental pots. The 100% seaweed fertilizer was used as a basal medium (1 kg) mixed with 7 kg soil. The combinations of CF and SF were applied as follows: CFSF1 = 50% of CF usual dose combined with 50% of SF basal medium (0.5 kg SF + 7.5 kg soil), and CFSF2 = 25% of CF usual dose combined with 75% of SF basal medium (0.75 kg SF + 7.25 kg soil). The growth parameters including plant height and number of tillers were evaluated every two weeks after transplantation (AT) until the end of vegetative stage (week 0 AT—week 8 AT).

2.4. Determination of Soil and Paddy Leaves Chemical Properties

Soil samples were taken from the top layer (0–15 cm) from random pots and bulked together, followed by air-drying and sieving (2 mm) for determination of physical and chemical properties. Organic matter was measured by the procedure of Walkley and Black using the dichromate wet oxidation method [19]. For paddy leaf samples, leaves were split and dried (120 °C) for half an hour, then dried at 65 °C until they reached constant weight. The leaves were then digested with sulfuric acid and hydrogen peroxide. Total N was determined with the micro-Kjehdal method [20]. Other nutrients were determined with ICP-OES [21]. The basic properties of the experimental soil are summarized in Table 1.

2.5. Soil Sampling, DNA Isolation and 16S rRNA Gene Amplification

Soil sampling was conducted on the 8th week after paddy transplantation to experimental pots, therefore representing the soil microbial communities in the vegetative stage of paddy plants. A teaspoon of three soil cores (approximately 0–15 cm from the top layer) from each treatment were sampled and pooled in 50 mL falcon tubes [22]. The soil samples were stored in −80 °C until the DNA isolation process. From each sample, an amount of 1 g of soil was used for total DNA isolation according to the instructions provided by the HighPurityTM Soil DNA Isolation Kit (Canvax Biotech, Spain). The yield and quality of the isolated DNA samples were determined using NanoDrop 1000 spectrophotometer (Thermoscientific, DE, USA). The microbial communities were determined based on the hypervariable region V3–V4 of 16S rRNA gene using the barcoded primers 314F/806R. All PCR reactions were carried out with Phusion High-Fidelity PCR Master Mix (New England Biolabs, MA, USA). We used a volume of 1 × loading buffer (containing SYBR green) with PCR products and subjected to electrophoresis on 2% agarose gel for detection. Samples with a bright main strip between 400–450 bp were chosen for further analyses. The selected PCR products were mixed at equal density ratios. The mixed PCR products were purified with Qiagen Gel Extraction Kit (Qiagen, Germany). The libraries were generated with NEBNext UltraTM DNA Library Prep Kit for Illumina and quantified via Qubit and Q-PCR for analyses by illumine platform.

2.6. Sequencing and Data Processing

The samples were assigned to paired-end reads based on their unique barcodes and truncated by cutting off the barcode and primer sequences. The paired ends were merged using FLASH v1.2.7., which allows paired ends to merge when at least some of the reads overlap the read generated from the opposite end of the same DNA fragment, and the splicing sequences were labeled as raw tags [23]. Quality filtering on the raw tags were performed under specific filtering conditions to obtain the high-quality clean tags according to the quality-controlled results obtained from QIIME v1.7.0 [24]. The tags were compared with the reference database (SILVA database) using UCHIME algorithm to detect chimera sequences, and then the chimera sequences were removed. The effective tags were then obtained. Sequences analyses were performed by Uparse software (Uparse v7.0.1090) using all the effective tags. Sequences with ≥97% similarity were assigned to the same OTUs. Represented sequence for each OTU was screened for further annotation. For each representative sequence, QIIME (Version 1.7.0) in the Mothur method was performed against the SSU rRNA database of SILVA database (see details http://www.arb-silva.de/ accessed on 13 June 2021) for species annotation at each taxonomic rank (Threshold:0.8~1): kingdom, phylum, class, order, family, genus, species. To obtain the phylogenetic relationship of all OTU representative sequences, the MUSCLE (version 3.8.31) was used [25].

2.7. Statistical Analyses

The abundance of OTUs was normalized using a standard of sequence number corresponding to the sample with the least sequences. Subsequent analyses of alpha diversity and beta diversity were all performed based on the output of these normalized data. Alpha diversity was applied in analyzing complexity of biodiversity for a sample through 6 indices, including Observed-species, Chao1, Shannon, Simpson, ACE, and good-coverage. All these indices in our samples were calculated with QIIME (version 1.7.0) and displayed with R software (version 2.15.3). Beta diversity analyses was used to evaluate differences of samples in species complexity. Beta diversity on both weighted and unweighted UniFrac were calculated by QIIME software (version 1.7.0). Cluster analyses were preceded by principal component analyses (PCA), which were applied to reduce the dimension of the original variables using the FactoMineR package and ggplot2 package in R software (version 2.15.3) [26].

3. Results and Discussion

The vegetative stage is an important stage of plant growth that contributes equally to crop production as the reproductive stage [27]. During this stage, common agricultural practices would apply high doses of nitrogen-based chemical fertilizers (CF). Long-term CF application has been reported to decrease microbial biomass and damage soil microbial structure [28,29]. Hence, application of organic fertilizer, which could provide similar or better results compared to CF, would be a promising solution to improve soil fertility. In this study, we evaluated the potential of seaweed-based fertilizer in improving vegetative growth in paddy plants.

3.1. Fermented Fertilizer Production

The organic matter and nutrient concentrations show some differences between the nonfermented and fermented seaweed fertilizer (Table 2). The fermentation process was carried out for 40 days, which is an optimal period according to previous studies [30]. Fermentation has been reported to potentially increase nutrient availabilities in certain fertilizers [31]. However, there remains limited information regarding the beneficial effects of fermentation on chemical components of seaweed biomass-based fertilizers. The fermentation process includes the decomposition process of the organic biomass, which would increase release of nutrients. Based on current results, the nutrients N, K, Ca, Mg, and B are significantly higher in the fermented seaweed fertilizer. Another report showed that Carica papaya organic fertilizer showed a richer nutrient component after anaerobic digestion [32]. Seaweed contains high levels of polysaccharides, which are potentially beneficial for microorganisms; thus, the levels of certain nutrients are also increased in the process [13].

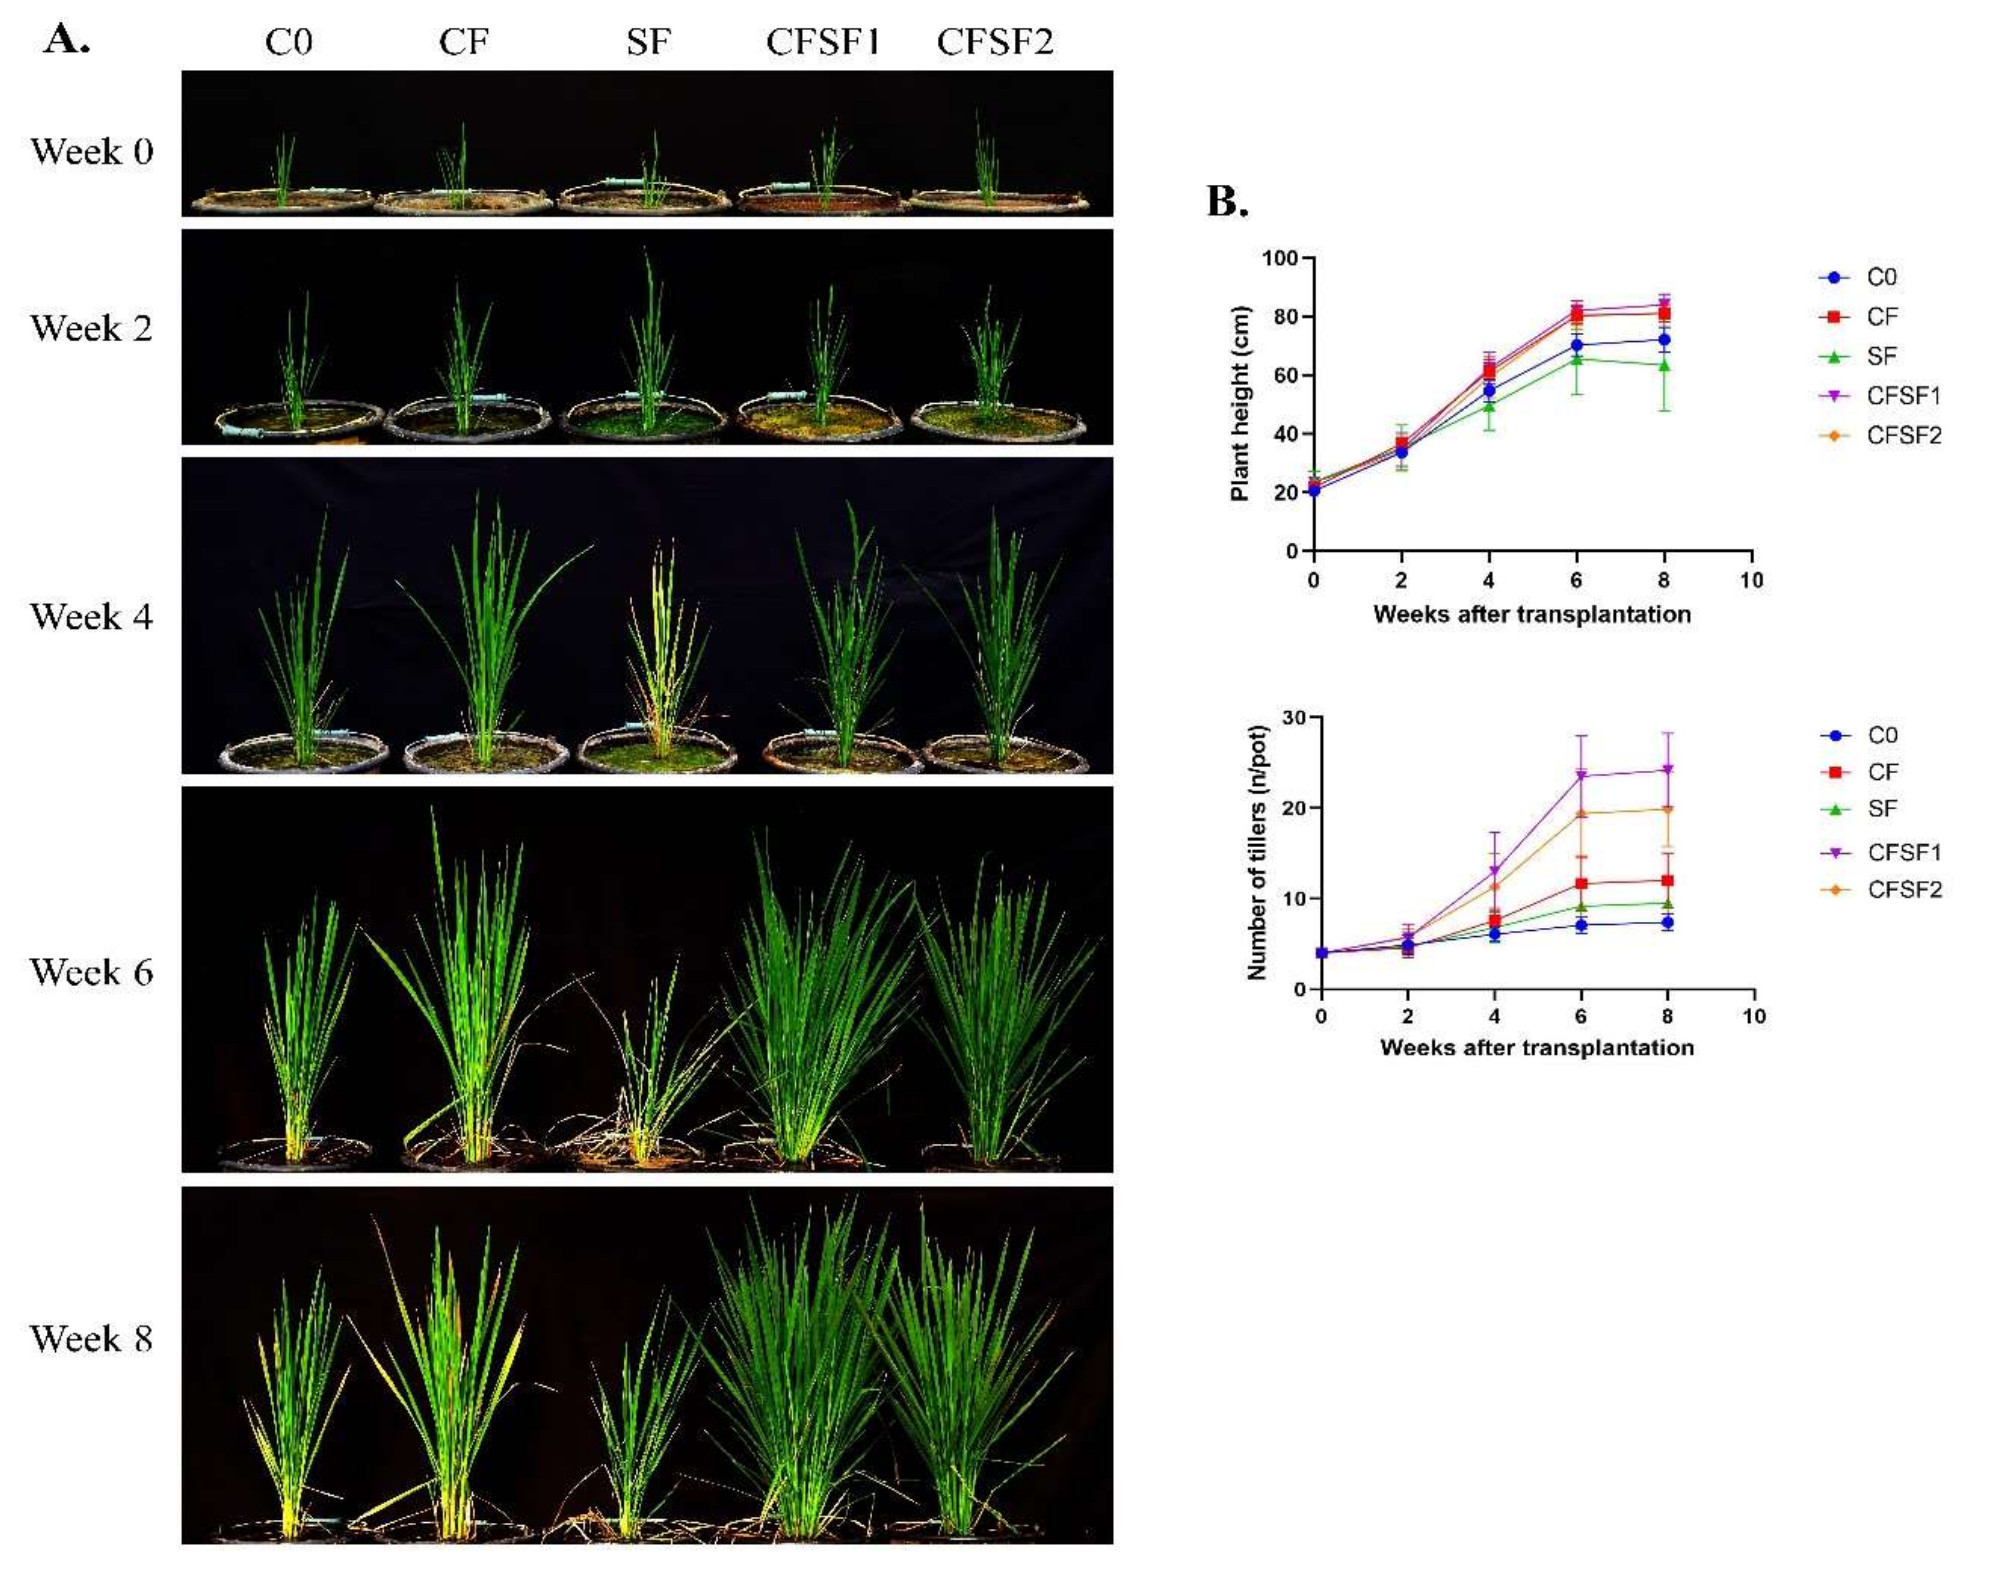
3.2. Effects of SF on Vegetative Growth of Paddy Plants

The effects of SF on vegetative growth of paddy plants were observed from week 0 until week 8 after transplantation into experimental pots. Every 2 weeks, the growth dynamics were documented and recorded (Figure 1A). The application of SF combined with CF obtained the best results compared to conventional CF application (Figure 2B). The number of tillers were significantly higher in CFSF1 (24.20 ± 4.08) and CFSF2 (19.90 ± 4.15) compared to CF treatment (12.00 ± 3.06). However, there were no significant difference in plant height between the CFSF1 (83.99 ± 3.70 cm), CFSF2 (81.01 ± 4.67 cm), and CF (81.16 ± 3.01 cm). The brown seaweed Sargassum has well been documented for its biostimulatory activity in plants [11]. Furthermore, these brown seaweeds also exhibit Plant Growth Regulators (PGRs), which are beneficial for plant growth [33]. However, based on our results, the application of SF alone with additional CF showed poor plant growth, with only 63.47 ± 15.64 cm plant height and 9.50 ± 2.32 number of tillers after 8 weeks of transplantation.

3.3. Effects of SF on N Uptake of Paddy in Vegetative Stage

The nitrogen (N) content in the soil and leaves of a paddy plant during vegetative stage were investigated (Figure 2). The results indicated that paddy plants treated with SF contained the lowest N content (1.19%) (Figure 2A). The highest N content was seen in CFSF1 treatment (2.98%), which was significantly higher compared to CF treatment (1.15%). Interestingly, the N content was highest in the soil of CF (0.36%) and CFSF1 (0.37%) treatment (Figure 2B). This is possibly due to the high amount of N input these groups received from chemical fertilizer treatment, whereas the other groups relied on the N from the initial soil condition and seaweed fertilizer. Nitrogen plays a pivotal role in controlling plant vegetative growth [34]. Hence, the low N content in paddy leaves potentially contributes to the poor growth observed in the treatment groups.

3.4. Sequencing Quality Check

The Illumina Miseq sequencing generated a total of 710,178 raw tags representing five samples, with individual reads ranging from 129,983 to 151,979 bp (Table 3). After quality check, the remaining high-quality reads in the dataset, with an average of 416 bp, were further analyzed. After qualification and removal of chimeras from the raw tags, a total of 437,378 effective tags were obtained. The Q20 values ranged from 97.51 to 98.26. The higher Q scores indicated a smaller probability of error in readings [35].

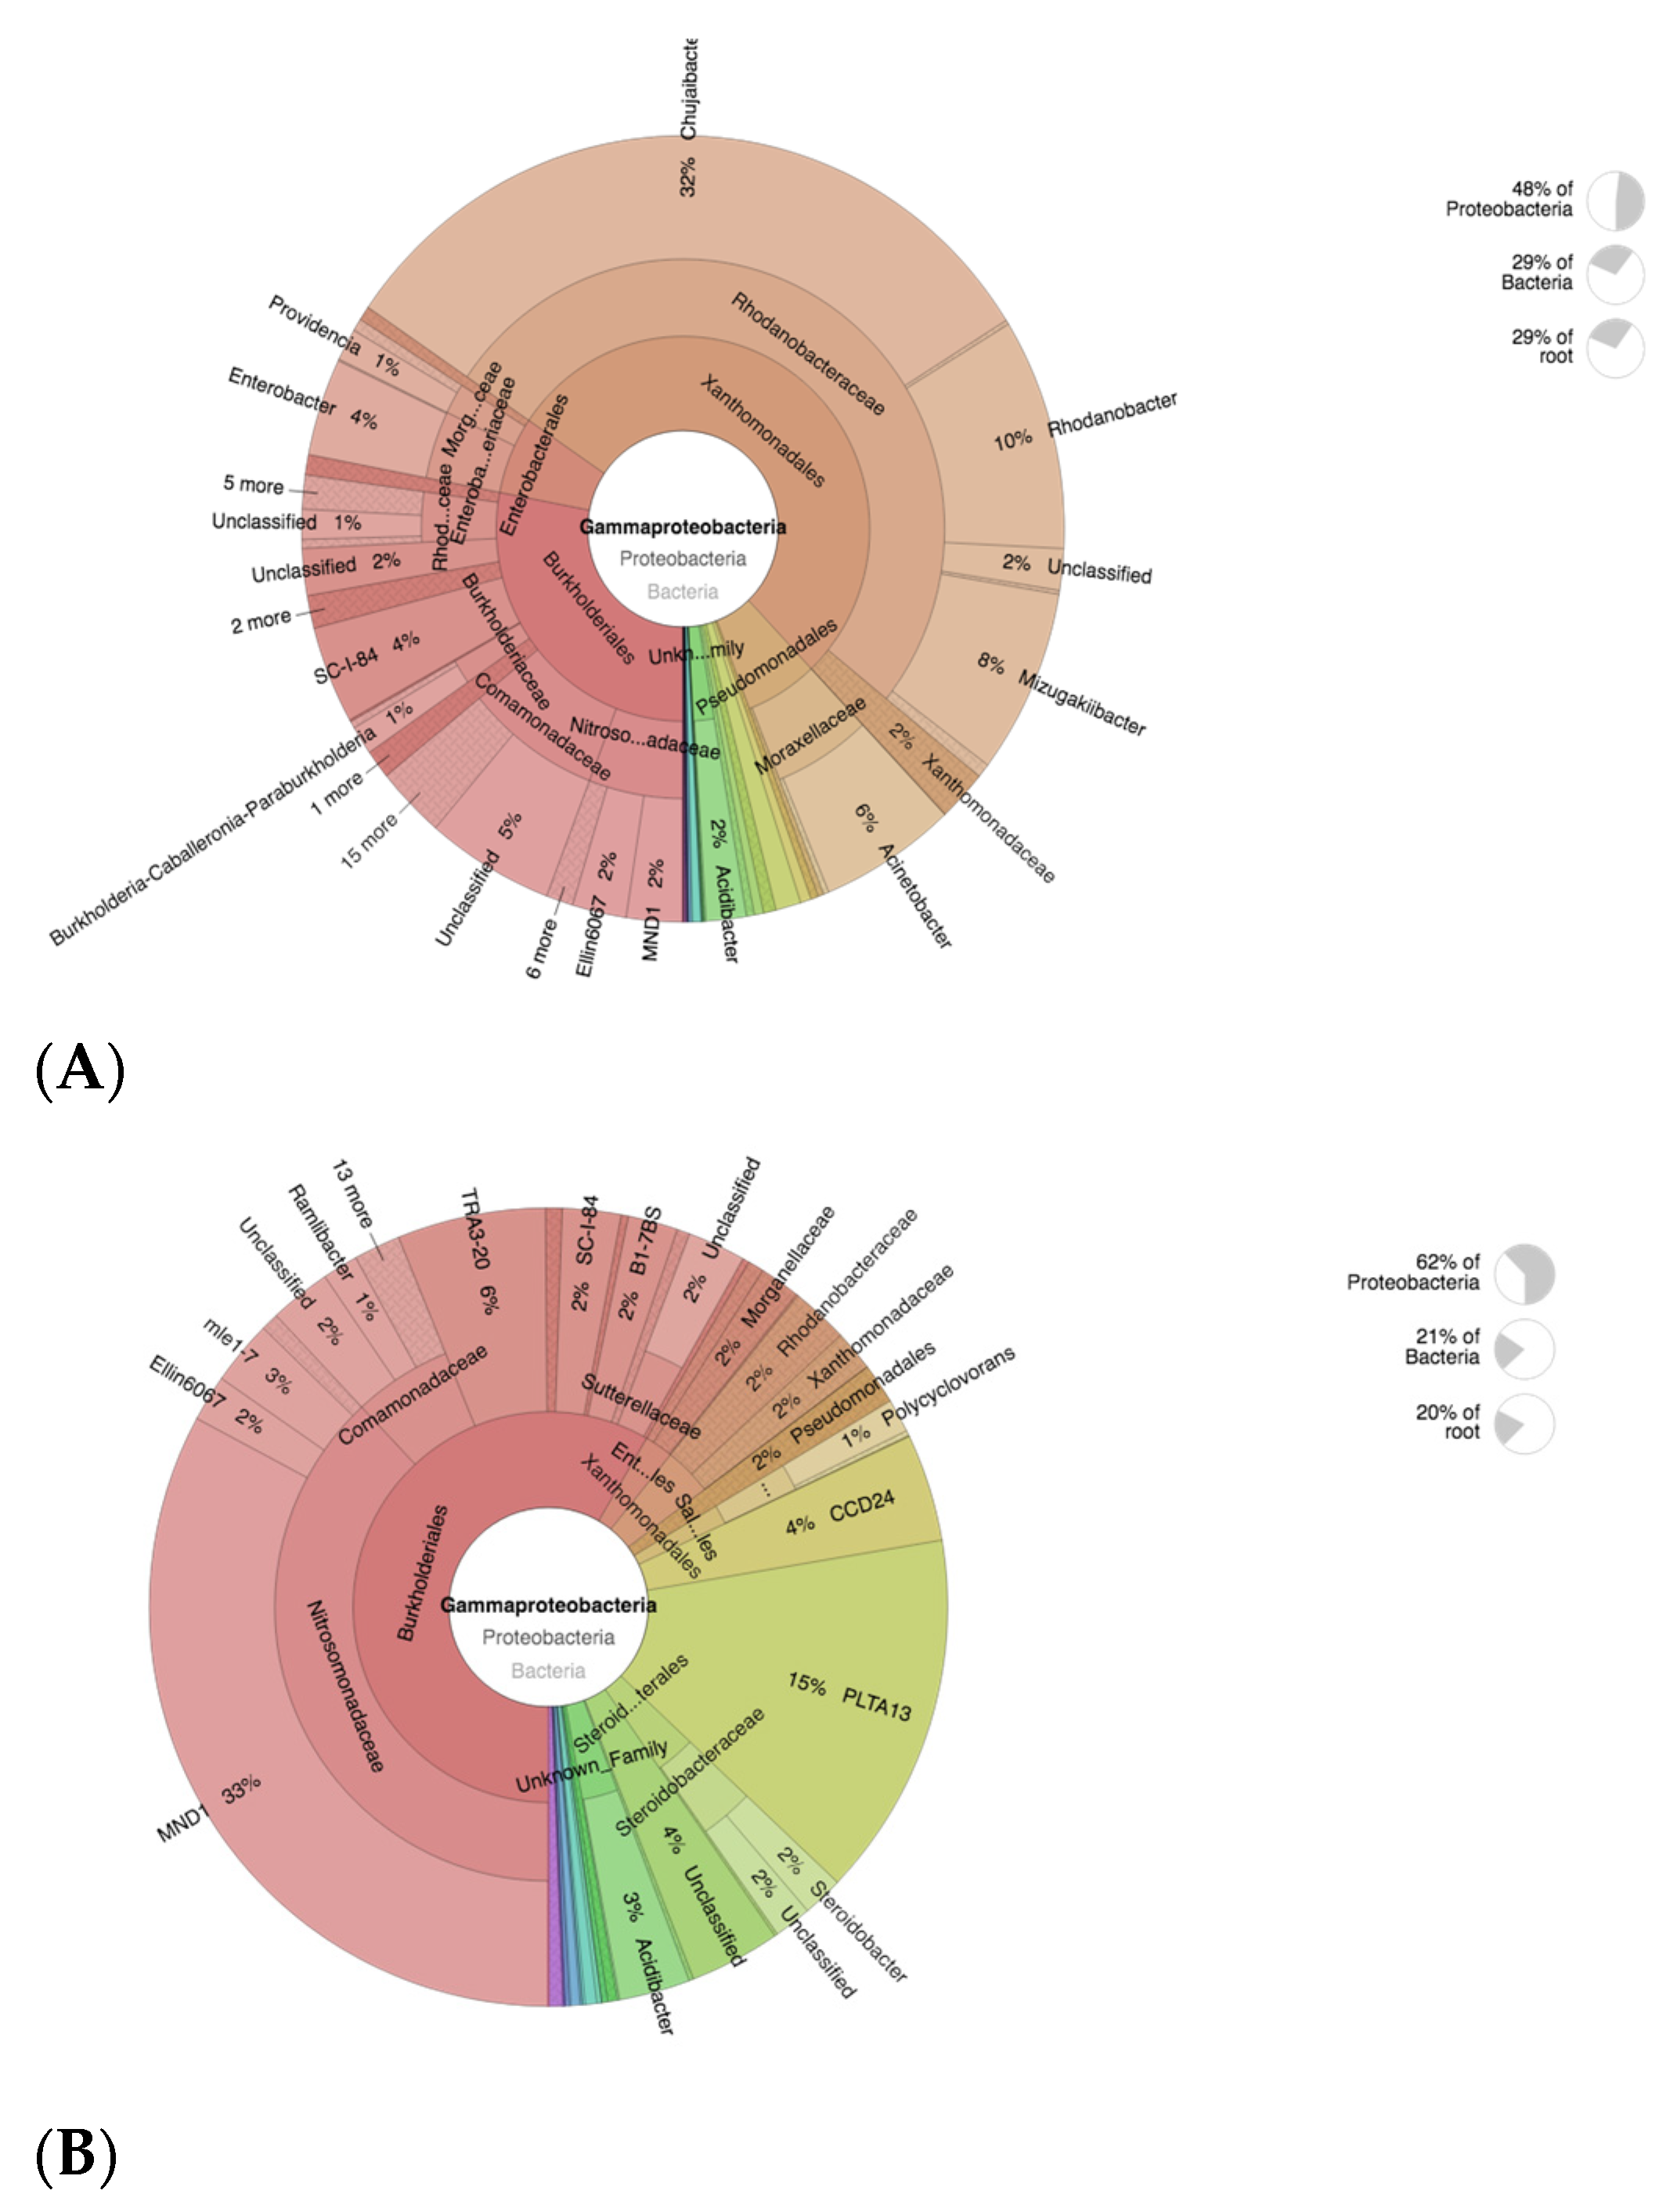
3.5. OTU Identification and Taxonomic Annotation

The samples were grouped into OTUs based on 97% identity. The top 10 microorganism populations from five samples are shown in Figure 3. Based on the 10 largest phyla shown in Figure 3A, Acidobacteria was highly present in CFSF1. Acidobacteria was proven to actively interact with plants as plant growth-promoting bacteria. A suggested mechanism is that Acidobacteria plays a role in soil matrix formation and water and nutrition trapping, which lead to soil aggregate formation [36].
Although seaweed has been well reported for its potential as biofertilizer [37], little is known regarding its mechanism in promoting plant growth [38]. Some studies suggest that seaweed fertilizer treatment in plants causes significant changes in the microbiome components of the soil and plant, which contributes to plant growth [39]. Our current results show that seaweed fertilizer (SF) application in soil of paddy plants results in a significantly different bacterial community and structure. However, the application of SF alone results in poor growth in paddy plants. This is possibly due to the high abundance of Cyanobacteria, which are present in SF treated soils. The SF fertilizer may contain certain nutrients that are beneficial for Cyanobacteria blooming [40]. Cyanobacteria blooms often damage aquatic ecosystems; they compromise the water quality by releasing cyanotoxins, which are harmful for the plants. Cyanobacteria produce beneficial bioactive compounds that could promote plant growth [41]. However, too much may induce competition with the plant for nutrient and light. In semiaquatic planting systems, such as the case of paddies, the cyanobacterial dominance has been associated with low nitrogen-to-phosphorus ratios [42]. Paddy plants are semiaquatic plants; thus, Cyanobacteria blooming would be a problem for their growth [43].
In the terms of genus, it could be seen that the soil samples treated with SF showed higher microbial diversity (Figure 3B). Sphingomonas was seen to be abundant in CF and C0 treatment but not in SF treatments. Furthermore, another dominant taxon in SF is marine group II (MGII) archaea. Despite their discovery over 25 years ago, the archaea group MGII remain a difficult group of microbes to study, lacking cultured isolates and genome references. However, research has shown that MGII are often abundant in response to Cyanobacteria and phytoplankton blooms [44]. Hence, MGII together with Cyanobacteria group in SF samples are possibly responsible for the poor growth in the treated paddy plants.

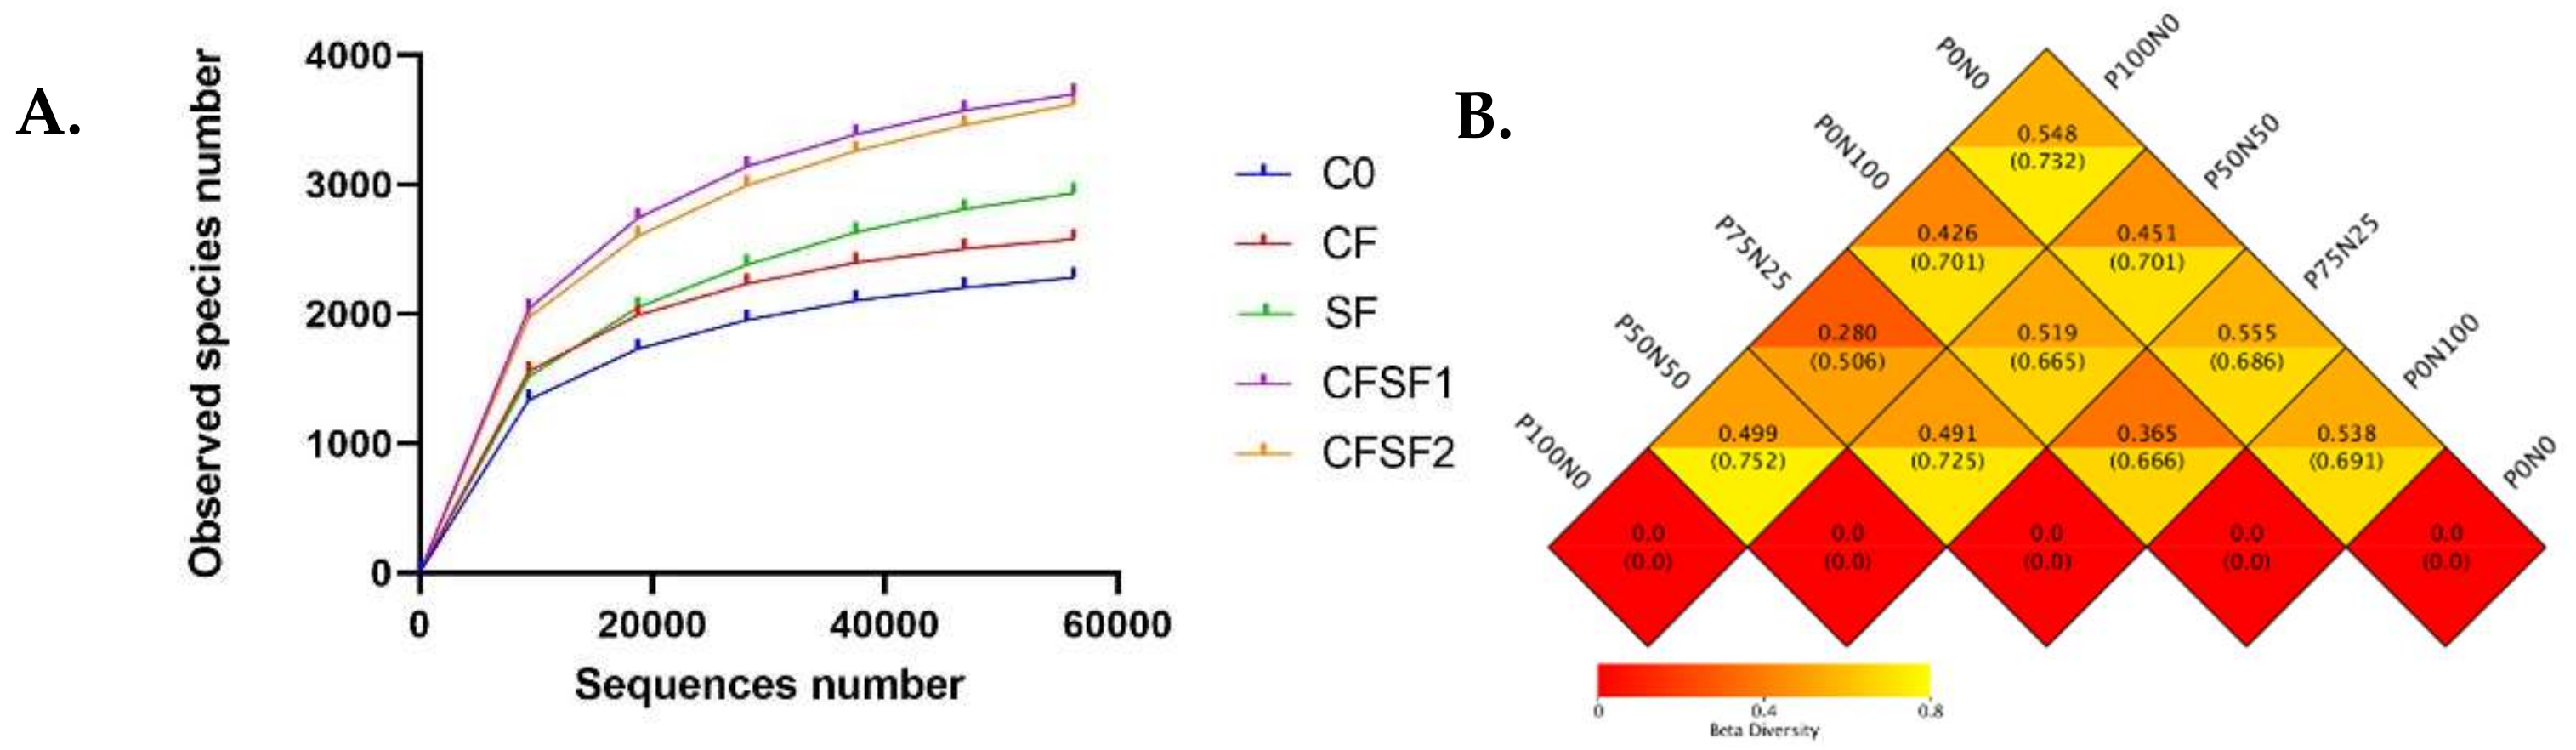
3.6. Alpha Diversity Analyses

The rarefaction curves of alpha diversity analyses indicated that the microbial communities were different in each sample (Figure 4A). The statistical indices of alpha diversity when the clustering threshold is 97% are summarized in Table 4. Good’s coverage estimator values ranged from 99.9% to 100%, indicating that the sequence numbers were sufficient to target the majority of the 16S rRNA gene sequences to describe the bacterial diversity in the soil samples. The observed species were highest in the CFSF1 treatment (3697), followed by CFSF2 (3621) and SF (2937). In contrast, the C0 group showed the lowest observed species (2283). The CFSF1 and CFSF2 groups also showed the highest Shannon index, 9838 and 9.776, respectively. Similar results were seen in Chao, ACE, and PD whole tree indices. However, this was not the case for other groups. Based on the Shannon index, the CF group (8.991) was higher compared to C0 (8.823) and SF (8.412). Both C0 (0.992) and CF (0.992) group were also higher in the Simpson indices despite the lower observed species compared to SF group (0.980). However, SF was higher compared to C0 and CF in Chao 1 (3215.766), ACE (3414.616), and PD whole tree indices (257.892).

3.7. Beta Diversity Analyses

Beta diversity represents the explicit comparison of microbial communities based on their composition. Beta diversity metrics thus assess the differences in microbial communities between the treatments. To compare microbial communities between each paddy plant’s treated soil, a square matrix of “distance” or “dissimilarity” was calculated to reflect the dissimilarity between the treatments (Figure 4B). The results revealed that the soil samples from CFSF1 treatment showed the lowest beta diversity index with CFSF2 treatment (0.280). A low level of beta diversity index indicates a high level of similarity, while a high beta diversity index indicates a low level of similarity. This possibly explains the similar growth features in CFSF1 and CFSF2 treatments. SF and CFSF2 also showed low beta diversity index (0.365). High beta diversity values were observed between SF with C0 (0.519) and CF (0.538).

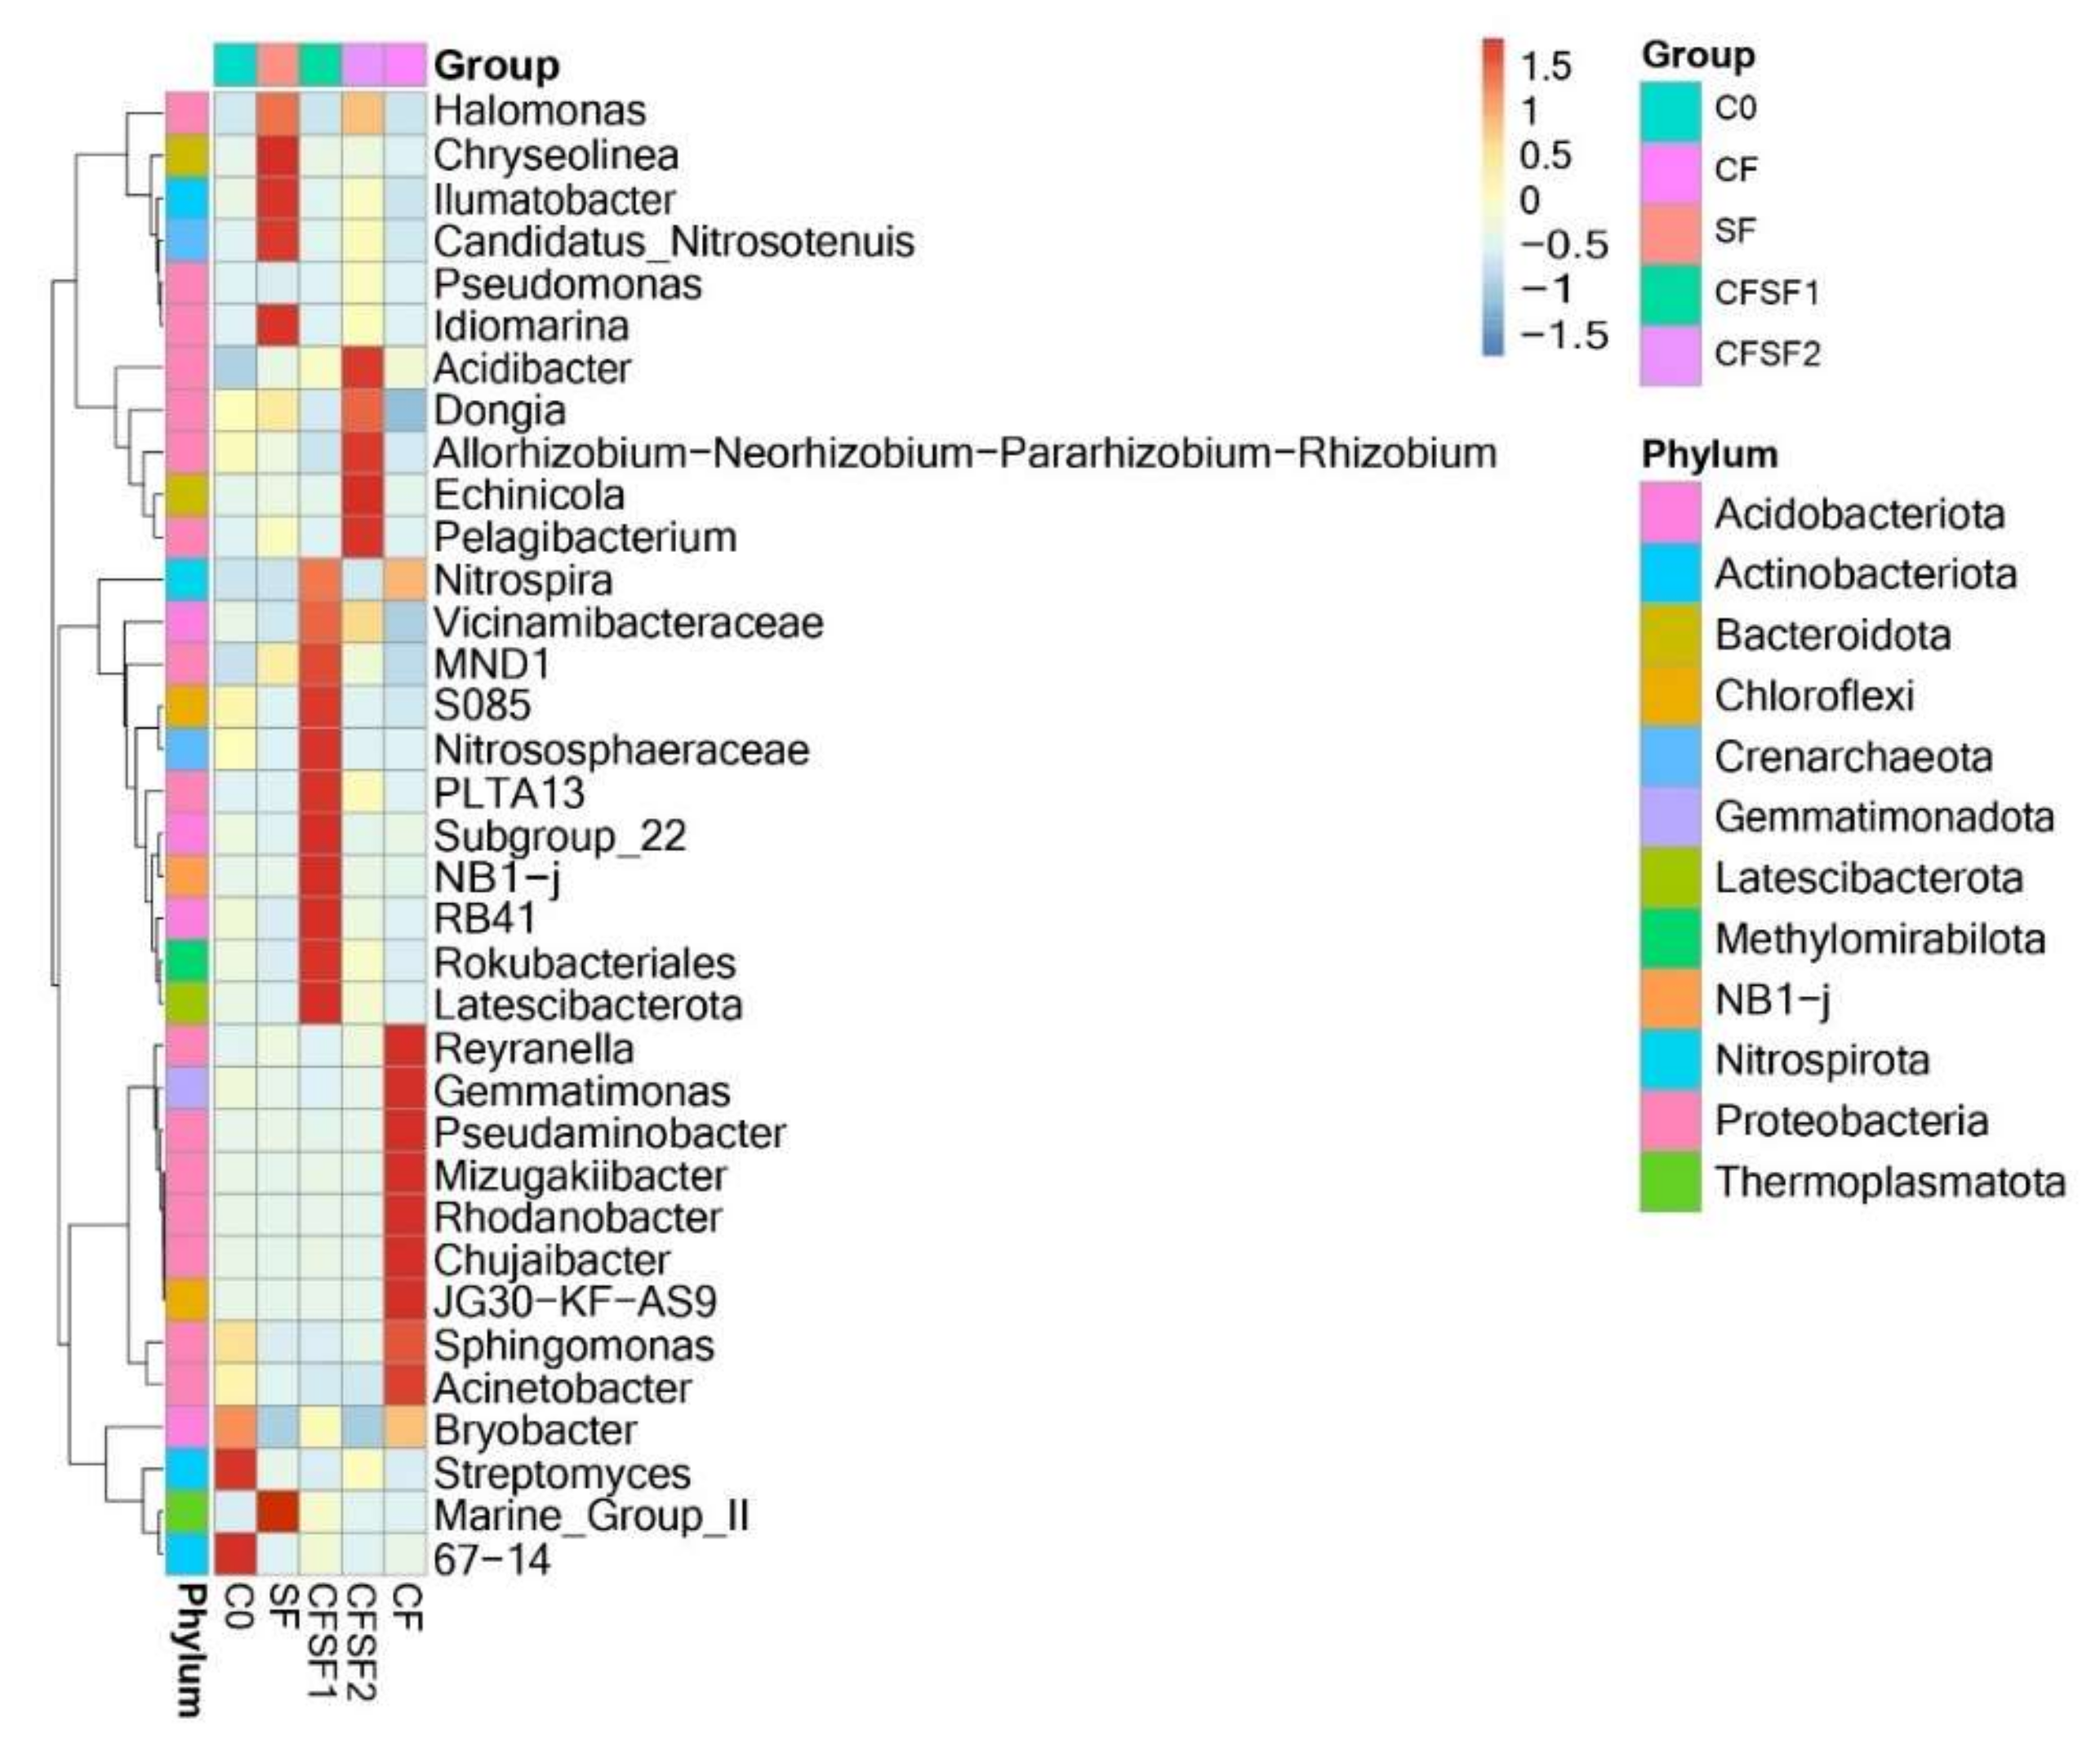
3.8. Taxonomic Abundance Cluster Heatmap

According to the abundance information of the top 35 genus of all samples, the heatmap was drawn to show whether the samples were clustered or not based on the similarity and difference between treatments (Figure 5). The presence of nitrifying bacteria such as Nitrospira, MND1, and Nitrososphaeraceae were observed in CFSF1 treatment. A member of Gammaproteobacteria, PLTA 13, was also present [45]. Although PLTA13 function in plant interactions is still unclear, the members of the Gammaprotebacteria class have been described to play a crucial part within plant microbiome interactions [46]. Another member of Gammaproteobacteria was also present in CFSF2, Acidibacter. Acidibacter has been reported for its iron (Fe)-reducing capacity [47]. The Fe-reducing activity of potential bacterial species is crucial for Fe uptake by plants, which is an essential element for plant growth and development. Dongia dominated in P-rich soil, indicating its role in phosphorus solubilization [48]. Phosphorus-solubilizing bacteria may aid the growth in plants by stimulating the plant efficiency in nitrogen fixation [49]. In addition, a member of Rhizobium bacteria was also abundant in CFSF2. Interestingly, the CF treatment was abundant in Reyranella. Reyranella has been suggested to promote the outbreak of bacterial wilt disease (Ralstonia solanacearum) [50]. Gematimonas, which is a member of the phylum Gemmatimonadates, is an understudied group in natural microbial communities. However, it is ranked as one of the most abundant phyla found in soil [51].
Based on vegetative growth observations, the best growth results were obtained by the combination of SF and CF. Rice yield is mostly determined by indirect traits, such as plant height and number of tillers. The combination of 50% CF and 50% SF showed the best growth features in plant height and number of tillers. The reduction of CF to 50% would contribute to the decrease of CF usage in conventional agricultural practices. Not only would it potentially improve the quality of the environment but it would also increase the economy of local farmers. The soils of paddy plants treated with CF were abundant in Sphingomonas. Recently, certain Sphingomonas strains have been reported to promote plant growth [52]. However, a study also reported that Sphingomonas sp. could cause leaf blight disease in rice [53]. Leaf blight disease (BLB) is also a major disease in crop plants, causing considerable economic losses [54]. As Sphingomonas was seen to be abundant in CF-treated soils, this could be the reason for frequent BLB cases faced by Indonesian local farmers. The SF-treated soils were seen to be abundant in MND1, an ammonia-oxidizing bacteria (AOB) [55,56], particularly CFSF1, which shows significant abundance compared to CFSF2 and SF.

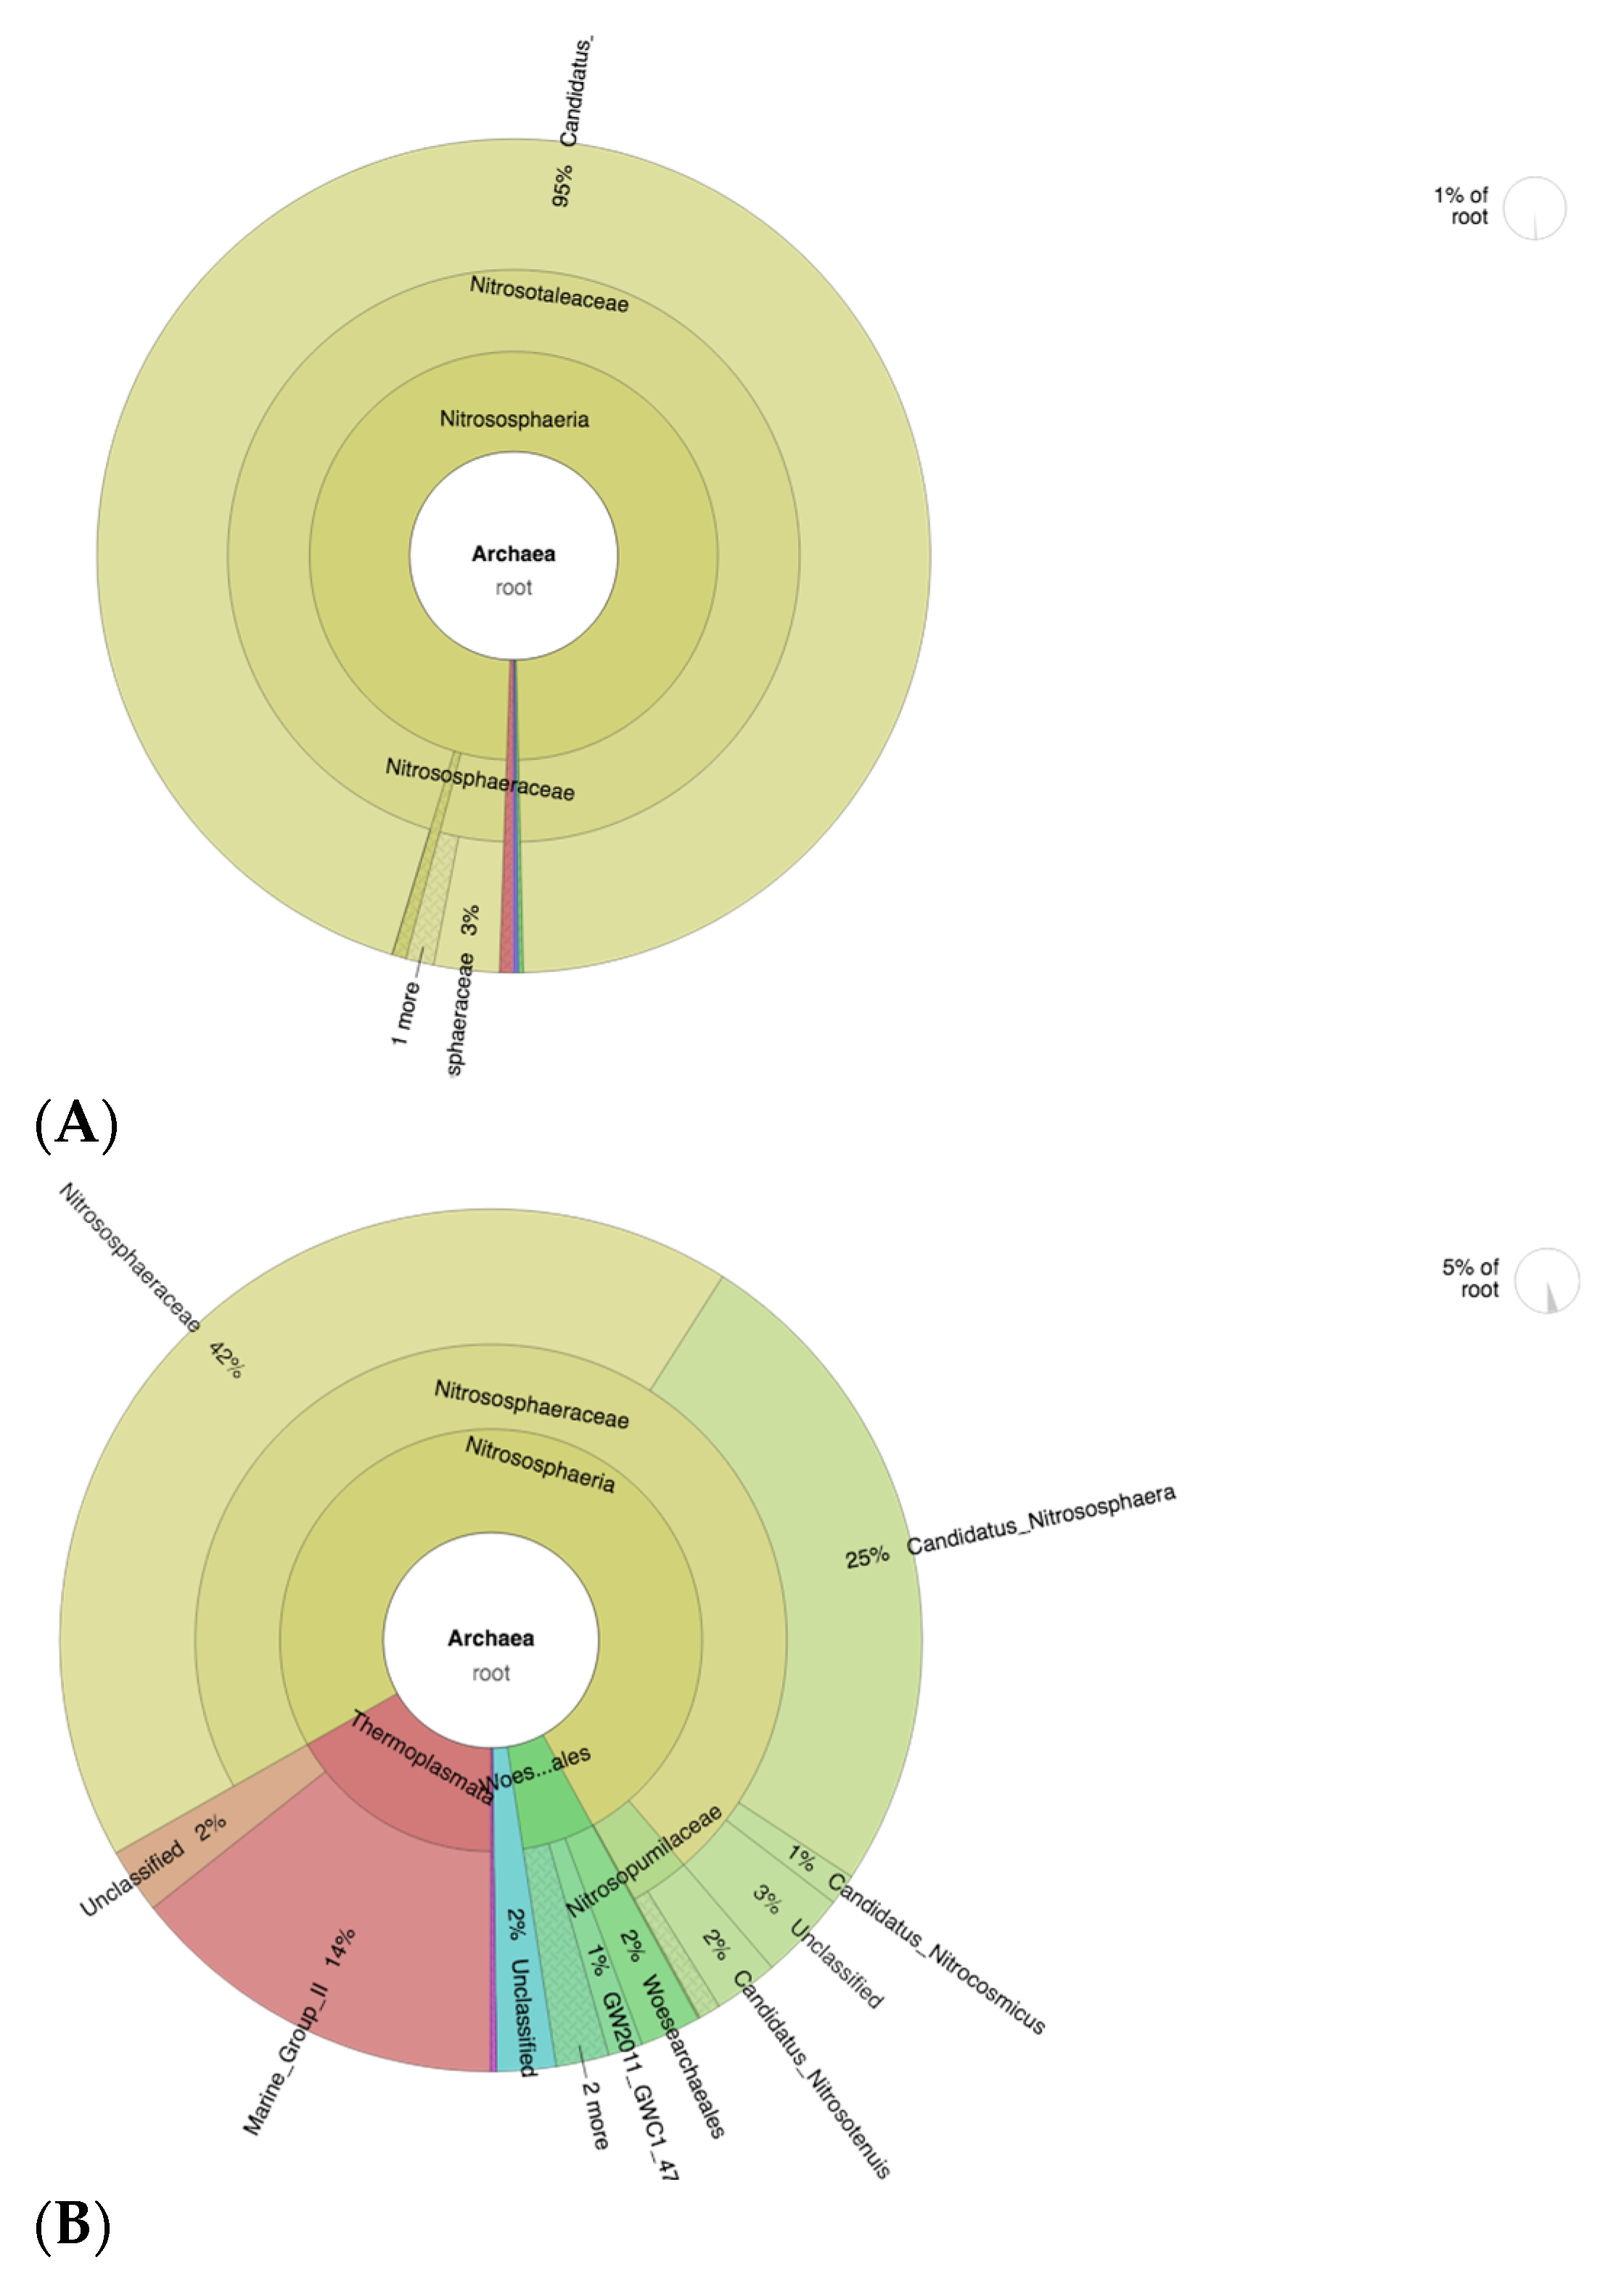
3.9. Abundance of Nitrifying Bacteria and Archaea in SF-Treated Soil of Paddy Plants

Analyses of taxonomic annotation was further conducted with krona visual display. The krona plot analysis targets AOB member Gammaprotebacteria, which plays a crucial part in plant–microbiome interactions [46]. The Rhodanobacteraceae family was proven to be dominant in CF-treated soils, which correlates to taxa analyses (Figure 6A). The Rhodanobacteraceae members are mostly known as a denitrifying group of bacteria that potentially could cause a decrease in soil fertility [57]. This strongly supports the fact that excessive use of CF in agricultural systems would lead to soil degradation. On the other hand, members of the ammonia-oxidizing bacteria (AOB) Nitrosomonadaceae family were dominant in CFSF1 treatments (Figure 6B), in particular, MND1, which has been reported to nitrify types of bacteria that metabolize ammonia (NH3) to nitrate (NO3−), thereby simultaneously obtaining energy for themselves and providing usable nitrogen for plants [58].
Based on archaea level analyses, the ammonia-oxidizing archaea (AOA) members were more abundant in CF-treated soils (Figure 7A), in particular, Candidatus Nitrosotalea, which contributes to 95% of the whole archaea population in the sample. This shows the low diversity of archaea population in CF-treated soils. High species richness diversity is important in various environments including soils. This contributes to interspecies relationships and interpopulation relationships, which promotes a healthy and optimum environment for plant growth [59]. In addition, the composition and diversity of these soil microbial communities are important indicators of the soil fertility level [60]. The CFSF1-treated soils show a more diverse profile of AOA, namely Nitrososphaeraceae (42%), Candidatus Nitrososphaera (25%), and other small percentage of the members of Nitrosospumilaceae (Figure 7B). Interestingly, the Nitrosospumilaceae cluster is mainly represented by marine archaea [61].
The reason that SF is best used with the combination of CF is possibly due to the low amount of available essential macronutrients for plant growth. Based on our results, the SF-treated soils show high abundance of nitrifying bacteria (AOB) and archaea (AOA). Hence, by providing the macronutrients from chemical fertilizers, the abundant AOA and AOB communities in SF-treated soils would efficiently convert ammonia to usable nitrogen for promoting plant growth. The AOB member Nitrosomonadaceae is significantly abundant in CFSF1-treated soils. The Nitrosomonadaceae play major roles in control of the nitrogen cycle by leading to loss of excessive ammonium from ammonium-based fertilizers [62]. Hence, the presence of this microbial population supports the use of SF for improving excessive CF-contaminated agricultural systems. In addition, the denitrifying bacteria Rhodanobacter was abundant in CF-treated soil. Denitrifying bacteria converts nitrates in the soil to free atmospheric nitrogen, thus depleting soil fertility and reducing agricultural productivity [63]. Another member of Rhodanobacteraceae, Chujaibacter, was highly abundant in CF group. Although its role is still unclear, it is assumed that Chujaibacter also plays a role in denitrification [64]. Hence, abundance of this microbial population possibly contributes to the decrease soil fertility in agricultural systems that heavily rely on CF. In the case of AOA, a previous study by Zhalnina et al. shows that soils with higher organic matter should be expected to have higher AOA abundance [37,65]. These members of AOA convert ammonia to nitrites or nitrates. This process would increase the amount of usable nitrogen for plants.

4. Conclusions

This is the first report to show the effects of fermented seaweed fertilizer on soil microbiota structure and community. Our results show that seaweed fertilizer (SF) provides promising advantages for improving crop production based on green agricultural practice. The implementation of SF in agricultural systems could improve soil fertility, which could contribute to agriculture sustainability. The CFSF1 combination showed the best results in plant growth features and soil microbiome profile. CFSF1-treated soils show significant changes in microbial community and structure compared to CF, especially in ammonia-oxidizing bacteria (AOB) and ammonia-oxidizing archaea (AOA) populations. The abundant AOB in CFSF1 could be used as bioremediation agent to improve contaminated agricultural systems. The presence of various AOA potentially contributes to the optimum growth in CFSF1-treated paddy plants. Further evaluation on SF doses in pot experiments is needed for future field applications. Nevertheless, current study shows that increased use of organic fertilizer with decreased chemical fertilizer could increase abundance of beneficial soil microbiota.

Author Contributions

Conceptualization, E.S.P.; methodology, A.J., S.W., H.S. and A.N.; validation, A.N.; formal analysis, E.S.P.; investigation, E.S.P., A.J., S.W., H.S. and A.N.; resources, N.S.H.K., I.A.P.K., N.A., A.S.A., B.T.K.I., A.J., S.W., H.S. and A.N.; data curation, E.S.P. and A.N.; writing—original draft preparation, E.S.P.; writing—review and editing, E.S.P.; visualization, E.S.P.; supervision, S.W.; project administration, B.T.K.I. All authors have read and agreed to the published version of the manuscript.

Funding

This research was funded by Indonesian Badan Riset Inovasi Nasional (BRIN) through Prioritas Riset Nasional (PRN) 2021 scheme.

Institutional Review Board Statement

Not applicable.

Informed Consent Statement

Not applicable.

Data Availability Statement

The data presented in this study are available on request from the corresponding and first author.

Acknowledgments

All authors pay their condolences to one of the author H. Sunarpi, who passed away on 24 December 2020. He was our teacher, family, colleague, and a great scientist.

Conflicts of Interest

The authors have no conflict of interest.

References

  1. Hakim, R.; Haryanto, T.; Sari, D.W. Technical Efficiency among Agricultural Households and Determinants of Food Security in East Java, Indonesia. Sci. Rep. 2021, 11, 4141. [Google Scholar] [CrossRef]
  2. Rahman, M.M.; Nahar, K.; Ali, M.M.; Sultana, N.; Karim, M.M.; Adhikari, U.K.; Rauf, M.; Azad, M.A.K. Effect of Long-Term Pesticides and Chemical Fertilizers Application on the Microbial Community Specifically Anammox and Denitrifying Bacteria in Rice Field Soil of Jhenaidah and Kushtia District, Bangladesh. Bull. Environ. Contam. Toxicol. 2020, 104, 828–833. [Google Scholar] [CrossRef] [PubMed]
  3. Ugulu, I.; Ahmad, K.; Khan, Z.I.; Munir, M.; Wajid, K.; Bashir, H. Effects of Organic and Chemical Fertilizers on the Growth, Heavy Metal/Metalloid Accumulation, and Human Health Risk of Wheat (Triticum aestivum L.). Environ. Sci. Pollut. Res. Int. 2021, 28, 12533–12545. [Google Scholar] [CrossRef] [PubMed]
  4. Rimmer, M.A.; Larson, S.; Lapong, I.; Purnomo, A.H.; Pong-Masak, P.R.; Swanepoel, L.; Paul, N.A. Seaweed Aquaculture in Indonesia Contributes to Social and Economic Aspects of Livelihoods and Community Wellbeing. Sustainability 2021, 13, 10946. [Google Scholar] [CrossRef]
  5. Craigie, J.S. Seaweed Extract Stimuli in Plant Science and Agriculture. J. Appl. Phycol. 2011, 23, 371–393. [Google Scholar] [CrossRef]
  6. Crouch, I.J.; Smith, M.T.; van Staden, J.; Lewis, M.J.; Hoad, G.V. Identification of Auxins in a Commercial Seaweed Concentrate. J. Plant Physiol. 1992, 139, 590–594. [Google Scholar] [CrossRef]
  7. Ateweberhan, M.; Bruggemann, J.H.; Breeman, A.A.M. Seasonal Module Dynamics in Sargassum subrepandum (Fucales, Phaeophyta). J. Phycol. 2008, 44, 269–283. [Google Scholar] [CrossRef]
  8. Sunarpi, H.; Kurnianingsih, R.; Ghazali, M.; Fanani, R.A.; Sunarwidhi, A.L.; Widyastuti, S.; Nikmatullah, A.; Prasedya, E.S. Evidence for the Presence of Growth-Promoting Factors in Lombok Turbinaria murayana Extract Stimulating Growth and Yield of Tomato Plants (Lycopersicum esculentum Mill.). J. Plant Nutr. 2020, 43, 1813–1823. [Google Scholar] [CrossRef]
  9. Sunarpi, H.; Pebriani, S.A.; Ambana, Y.; Putri, F.E.; Nikmatullah, A.; Ghazali, M.; Kurnianingsih, R.; Prasedya, E.S. Effect of Inorganic Fertilizer and Brown Alga Solid Ectract on Growth and Yield of Rice Plants. AIP Conf. Proc. 2019, 2199, 070006. [Google Scholar] [CrossRef]
  10. Rebours, C.; Marinho-Soriano, E.; Zertuche-González, J.A.; Hayashi, L.; Vásquez, J.A.; Kradolfer, P.; Soriano, G.; Ugarte, R.; Abreu, M.H.; Bay-Larsen, I.; et al. Seaweeds: An Opportunity for Wealth and Sustainable Livelihood for Coastal Communities. J. Appl. Phycol. 2014, 26, 1939–1951. [Google Scholar] [CrossRef] [Green Version]
  11. Ali, O.; Ramsubhag, A.; Jayaraman, J. Biostimulant Properties of Seaweed Extracts in Plants: Implications towards Sustainable Crop Production. Plants 2021, 10, 531. [Google Scholar] [CrossRef]
  12. Chontal, M.A.H.; Collado, C.J.L.; Orozco, N.R.; Velasco, J.V.; Gabriel, A.L.; Romero, G.L. Nutrient Content of Fermented Fertilizers and Its Efficacy in Combination with Hydrogel in Zea mays L. Int. J. Recycl. Org. Waste Agric. 2019, 8, 309–315. [Google Scholar] [CrossRef]
  13. Monteiro, P.; Lomartire, S.; Cotas, J.; Pacheco, D.; Marques, J.C.; Pereira, L.; Gonçalves, A.M.M. Seaweeds as a Fermentation Substrate: A Challenge for the Food Processing Industry. Processes 2021, 9, 1953. [Google Scholar] [CrossRef]
  14. Hirsch, P.R.; Mauchline, T.H. The Importance of the Microbial N Cycle in Soil for Crop Plant Nutrition. Adv. Appl. Microbiol. 2015, 93, 45–71. [Google Scholar] [CrossRef]
  15. Arioli, T.; Mattner, S.W.; Winberg, P.C. Applications of Seaweed Extracts in Australian Agriculture: Past, Present and Future. J. Appl. Phycol. 2015, 27, 2007. [Google Scholar] [CrossRef] [PubMed] [Green Version]
  16. Higa, T. Effective microorganisms: A biotechnology for mankind. In Proceedings of the 1st International Conference on Kyusei Nature Farming; Parr, J.F., Hornick, S.B., Whitman, S.E., Eds.; USDA: Washington, DC, USA, 1991; pp. 8–14. [Google Scholar]
  17. Dobrinčić, A.; Balbino, S.; Zorić, Z.; Pedisić, S.; Kovačević, D.B.; Garofulić, I.E.; Dragović-Uzelac, V. Advanced Technologies for the Extraction of Marine Brown Algal Polysaccharides. Mar. Drugs 2020, 18, 168. [Google Scholar] [CrossRef] [Green Version]
  18. Sunarpi, H.; Nikmatullah, A.; Sunarwidhi, A.L.; Sapitri, I.; Ilhami, B.T.K.; Widyastuti, S.; Prasedya, E.S. Growth and Yield of Rice Plants (Oryza sativa) Grown in Soil Media Containing Several Doses of Inorganic Fertilizers and Sprayed with Lombok Brown Algae Extracts. IOP Conf. Ser. Earth Environ. Sci. 2020, 594, 012032. [Google Scholar] [CrossRef]
  19. Nelson, D.W.; Sommers, L.E. Total Carbon, Organic Carbon, and Organic Matter. In Methods of Soil Analysis; John Wiley & Sons, Ltd.: Hoboken, NJ, USA, 1983; pp. 539–579. ISBN 978-0-89118-977-0. [Google Scholar]
  20. Jiang, Y.; Huang, X.; Zhang, X.; Zhang, X.; Zhang, Y.; Zheng, C.; Deng, A.; Zhang, J.; Wu, L.; Hu, S.; et al. Optimizing Rice Plant Photosynthate Allocation Reduces N2O Emissions from Paddy Fields. Sci. Rep. 2016, 6, 39333. [Google Scholar] [CrossRef] [PubMed] [Green Version]
  21. Jo, G.; Todorov, T.I. Distribution of Nutrient and Toxic Elements in Brown and Polished Rice. Food Chem. 2019, 289, 299–307. [Google Scholar] [CrossRef]
  22. Pavlovska, M.; Prekrasna, I.; Parnikoza, I.; Dykyi, E. Soil Sample Preservation Strategy Affects the Microbial Community Structure. Microbes Environ. 2021, 36, ME20134. [Google Scholar] [CrossRef] [PubMed]
  23. Magoč, T.; Salzberg, S.L. FLASH: Fast Length Adjustment of Short Reads to Improve Genome Assemblies. Bioinformatics 2011, 27, 2957–2963. [Google Scholar] [CrossRef]
  24. Caporaso, J.G.; Kuczynski, J.; Stombaugh, J.; Bittinger, K.; Bushman, F.D.; Costello, E.K.; Fierer, N.; Peña, A.G.; Goodrich, J.K.; Gordon, J.I.; et al. QIIME Allows Analysis of High-Throughput Community Sequencing Data. Nat. Methods 2010, 7, 335. [Google Scholar] [CrossRef] [Green Version]
  25. Edgar, R.C. MUSCLE: Multiple Sequence Alignment with High Accuracy and High Throughput. Nucleic Acids Res. 2004, 32, 1792–1797. [Google Scholar] [CrossRef] [Green Version]
  26. White, J.R.; Nagarajan, N.; Pop, M. Statistical Methods for Detecting Differentially Abundant Features in Clinical Metagenomic Samples. PLoS Comput. Biol. 2009, 5, e1000352. [Google Scholar] [CrossRef]
  27. Van de Poel, B.; Smet, D.; Van Der Straeten, D. Ethylene and Hormonal Cross Talk in Vegetative Growth and Development. Plant Physiol. 2015, 169, 61–72. [Google Scholar] [CrossRef] [PubMed] [Green Version]
  28. Kong, Y.; Ling, N.; Xue, C.; Chen, H.; Ruan, Y.; Guo, J.; Zhu, C.; Wang, M.; Shen, Q.; Guo, S. Long-Term Fertilization Regimes Change Soil Nitrification Potential by Impacting Active Autotrophic Ammonia Oxidizers and Nitrite Oxidizers as Assessed by DNA Stable Isotope Probing. Environ. Microbiol. 2019, 21, 1224–1240. [Google Scholar] [CrossRef] [PubMed]
  29. Xu, Q.; Ling, N.; Chen, H.; Duan, Y.; Wang, S.; Shen, Q.; Vandenkoornhuyse, P. Long-Term Chemical-Only Fertilization Induces a Diversity Decline and Deep Selection on the Soil Bacteria. mSystems 2020, 5, e00337-20. [Google Scholar] [CrossRef]
  30. De Oliveira e Silva, A.M.; Vidal-Novoa, A.; Batista-González, A.E.; Pinto, J.R.; Portari Mancini, D.A.; Reina-Urquijo, W.; Mancini-Filho, J. In Vivo and in Vitro Antioxidant Activity and Hepatoprotective Properties of Polyphenols from Halimeda opuntia (Linnaeus) Lamouroux. Redox Rep. 2012, 17, 47–53. [Google Scholar] [CrossRef] [PubMed] [Green Version]
  31. Liu, Q.; Meng, X.; Li, T.; Raza, W.; Liu, D.; Shen, Q. The Growth Promotion of Peppers (Capsicum annuum L.) by Trichoderma Guizhouense NJAU4742-Based Biological Organic Fertilizer: Possible Role of Increasing Nutrient Availabilities. Microorganisms 2020, 8, E1296. [Google Scholar] [CrossRef] [PubMed]
  32. Dahunsi, S.O.; Oranusi, S.; Efeovbokhan, V.E.; Adesulu-Dahunsi, A.T.; Ogunwole, J.O. Crop Performance and Soil Fertility Improvement Using Organic Fertilizer Produced from Valorization of Carica papaya Fruit Peel. Sci. Rep. 2021, 11, 4696. [Google Scholar] [CrossRef] [PubMed]
  33. Benítez García, I.; Dueñas Ledezma, A.K.; Martínez Montaño, E.; Salazar Leyva, J.A.; Carrera, E.; Osuna Ruiz, I. Identification and Quantification of Plant Growth Regulators and Antioxidant Compounds in Aqueous Extracts of Padina durvillaei and Ulva lactuca. Agronomy 2020, 10, 866. [Google Scholar] [CrossRef]
  34. Metay, A.; Magnier, J.; Guilpart, N.; Christophe, A. Nitrogen Supply Controls Vegetative Growth, Biomass and Nitrogen Allocation for Grapevine (Cv. Shiraz) Grown in Pots. Funct. Plant Biol. 2014, 42, 105–114. [Google Scholar] [CrossRef] [PubMed]
  35. Mbandi, S.K.; Hesse, U.; Rees, D.J.G.; Christoffels, A. A Glance at Quality Score: Implication for de Novo Transcriptome Reconstruction of Illumina Reads. Front. Genet. 2014, 5, 17. [Google Scholar] [CrossRef] [PubMed] [Green Version]
  36. Kielak, A.M.; Cipriano, M.A.P.; Kuramae, E.E. Acidobacteria Strains from Subdivision 1 Act as Plant Growth-Promoting Bacteria. Arch. Microbiol. 2016, 198, 987–993. [Google Scholar] [CrossRef] [Green Version]
  37. Chen, Y.; Li, J.; Huang, Z.; Su, G.; Li, X.; Sun, Z.; Qin, Y. Impact of Short-Term Application of Seaweed Fertilizer on Bacterial Diversity and Community Structure, Soil Nitrogen Contents, and Plant Growth in Maize Rhizosphere Soil. Folia Microbiol. 2020, 65, 591–603. [Google Scholar] [CrossRef] [PubMed]
  38. Ghaderiardakani, F.; Collas, E.; Damiano, D.K.; Tagg, K.; Graham, N.S.; Coates, J.C. Effects of Green Seaweed Extract on Arabidopsis Early Development Suggest Roles for Hormone Signalling in Plant Responses to Algal Fertilisers. Sci. Rep. 2019, 9, 1983. [Google Scholar] [CrossRef] [PubMed]
  39. Renaut, S.; Masse, J.; Norrie, J.P.; Blal, B.; Hijri, M. A Commercial Seaweed Extract Structured Microbial Communities Associated with Tomato and Pepper Roots and Significantly Increased Crop Yield. Microb. Biotechnol. 2019, 12, 1346–1358. [Google Scholar] [CrossRef] [PubMed] [Green Version]
  40. Juhmani, A.-S.; Vezzi, A.; Wahsha, M.; Buosi, A.; Pascale, F.D.; Schiavon, R.; Sfriso, A. Diversity and Dynamics of Seaweed Associated Microbial Communities Inhabiting the Lagoon of Venice. Microorganisms 2020, 8, 1657. [Google Scholar] [CrossRef] [PubMed]
  41. Singh, J.S.; Kumar, A.; Rai, A.N.; Singh, D.P. Cyanobacteria: A Precious Bio-Resource in Agriculture, Ecosystem, and Environmental Sustainability. Front. Microbiol. 2016, 7, 529. [Google Scholar] [CrossRef] [Green Version]
  42. Burson, A.; Stomp, M.; Greenwell, E.; Grosse, J.; Huisman, J. Competition for Nutrients and Light: Testing Advances in Resource Competition with a Natural Phytoplankton Community. Ecology 2018, 99, 1108–1118. [Google Scholar] [CrossRef]
  43. Rastogi, R.P.; Madamwar, D.; Incharoensakdi, A. Bloom Dynamics of Cyanobacteria and Their Toxins: Environmental Health Impacts and Mitigation Strategies. Front. Microbiol. 2015, 6, 1254. [Google Scholar] [CrossRef] [PubMed] [Green Version]
  44. Orellana, L.H.; Ben Francis, T.; Krüger, K.; Teeling, H.; Müller, M.-C.; Fuchs, B.M.; Konstantinidis, K.T.; Amann, R.I. Niche Differentiation among Annually Recurrent Coastal Marine Group II Euryarchaeota. ISME J. 2019, 13, 3024–3036. [Google Scholar] [CrossRef] [PubMed] [Green Version]
  45. Morin, L.; Goubet, A.; Madigou, C.; Pernelle, J.-J.; Palmier, K.; Labadie, K.; Lemainque, A.; Michot, O.; Astoul, L.; Barbier, P.; et al. Colonization Kinetics and Implantation Follow-up of the Sewage Microbiome in an Urban Wastewater Treatment Plant. Sci. Rep. 2020, 10, 11634. [Google Scholar] [CrossRef]
  46. Köberl, M.; Dita, M.; Martinuz, A.; Staver, C.; Berg, G. Members of Gammaproteobacteria as Indicator Species of Healthy Banana Plants on Fusarium Wilt-Infested Fields in Central America. Sci. Rep. 2017, 7, 45318. [Google Scholar] [CrossRef]
  47. Sinong, G.F.; Yasuda, M.; Nara, Y.; Lee, C.G.; Dastogeer, K.M.G.; Tabuchi, H.; Nakai, H.; Djedidi, S.; Okazaki, S. Distinct Root Microbial Communities in Nature Farming Rice Harbor Bacterial Strains With Plant Growth-Promoting Traits. Front. Sustain. Food Syst. 2021, 4, 314. [Google Scholar] [CrossRef]
  48. Michas, A.; Pastore, G.; Chiba, A.; Grafe, M.; Clausing, S.; Polle, A.; Schloter, M.; Spohn, M.; Schulz, S. Phosphorus Availability Alters the Effect of Tree Girdling on the Diversity of Phosphorus Solubilizing Soil Bacterial Communities in Temperate Beech Forests. Front. For. Glob. Chang. 2021, 4, 79. [Google Scholar] [CrossRef]
  49. Alori, E.T.; Glick, B.R.; Babalola, O.O. Microbial Phosphorus Solubilization and Its Potential for Use in Sustainable Agriculture. Front. Microbiol. 2017, 8, 971. [Google Scholar] [CrossRef] [Green Version]
  50. Chen, S.; Qi, G.; Ma, G.; Zhao, X. Biochar Amendment Controlled Bacterial Wilt through Changing Soil Chemical Properties and Microbial Community. Microbiol. Res. 2020, 231, 126373. [Google Scholar] [CrossRef] [PubMed]
  51. Zeng, Y.; Nupur; Wu, N.; Madsen, A.M.; Chen, X.; Gardiner, A.T.; Koblížek, M. Gemmatimonas Groenlandica sp. Nov. Is an Aerobic Anoxygenic Phototroph in the Phylum Gemmatimonadetes. Front. Microbiol. 2021, 11, 3395. [Google Scholar] [CrossRef] [PubMed]
  52. Luo, Y.; Wang, F.; Huang, Y.; Zhou, M.; Gao, J.; Yan, T.; Sheng, H.; An, L. Sphingomonas sp. Cra20 Increases Plant Growth Rate and Alters Rhizosphere Microbial Community Structure of Arabidopsis thaliana Under Drought Stress. Front. Microbiol. 2019, 10, 1221. [Google Scholar] [CrossRef] [PubMed] [Green Version]
  53. Kini, K.; Agnimonhan, R.; Dossa, R.; Soglonou, B.; Gbogbo, V.; Ouedraogo, I.; Kpemoua, K.; Traoré, M.; Silue, D. First Report of Sphingomonas sp. Causing Bacterial Leaf Blight of Rice in Benin, Burkina Faso, The Gambia, Ivory Coast, Mali, Nigeria, Tanzania and Togo. New Dis. Rep. 2017, 35, 32. [Google Scholar] [CrossRef] [Green Version]
  54. Sparks, A.H.; Forbes, G.A.; Hijmans, R.J.; Garrett, K.A. Climate Change May Have Limited Effect on Global Risk of Potato Late Blight. Glob. Chang. Biol. 2014, 20, 3621–3631. [Google Scholar] [CrossRef] [PubMed]
  55. Podlesnaya, G.V.; Krasnopeev, A.Y.; Potapov, S.A.; Tikhonova, I.V.; Shtykova, Y.R.; Suslova, M.Y.; Timoshkin, O.A.; Belykh, O.I. Diversity of Nitrifying Bacteria in Microbial Communities from Water and Epilithic Biofilms of the Lake Baikal Littoral Zone. Limnol. Freshw. Biol. 2020, 4, 1008–1010. [Google Scholar] [CrossRef]
  56. Chi, Z.; Hou, L.; Li, H. Effects of Pollution Load and Salinity Shock on Nitrogen Removal and Bacterial Community in Two-Stage Vertical Flow Constructed Wetlands. Bioresour. Technol. 2021, 342, 126031. [Google Scholar] [CrossRef]
  57. Kostka, J.E.; Green, S.J.; Rishishwar, L.; Prakash, O.; Katz, L.S.; Mariño-Ramírez, L.; Jordan, I.K.; Munk, C.; Ivanova, N.; Mikhailova, N.; et al. Genome Sequences for Six Rhodanobacter Strains, Isolated from Soils and the Terrestrial Subsurface, with Variable Denitrification Capabilities. J. Bacteriol. 2012, 194, 4461–4462. [Google Scholar] [CrossRef] [PubMed] [Green Version]
  58. Zhang, S.; Sun, L.; Wang, Y.; Fan, K.; Xu, Q.; Li, Y.; Ma, Q.; Wang, J.; Ren, W.; Ding, Z. Cow Manure Application Effectively Regulates the Soil Bacterial Community in Tea Plantation. BMC Microbiol. 2020, 20, 190. [Google Scholar] [CrossRef] [PubMed]
  59. Barot, S.; Allard, V.; Cantarel, A.; Enjalbert, J.; Gauffreteau, A.; Goldringer, I.; Lata, J.-C.; Le Roux, X.; Niboyet, A.; Porcher, E. Designing Mixtures of Varieties for Multifunctional Agriculture with the Help of Ecology. A Review. Agron. Sustain. Dev. 2017, 37, 13. [Google Scholar] [CrossRef] [Green Version]
  60. Niu, H.; Pang, Z.; Fallah, N.; Zhou, Y.; Zhang, C.; Hu, C.; Lin, W.; Yuan, Z. Diversity of Microbial Communities and Soil Nutrients in Sugarcane Rhizosphere Soil under Water Soluble Fertilizer. PLoS ONE 2021, 16, e0245626. [Google Scholar] [CrossRef]
  61. Bollmann, A.; Bullerjahn, G.S.; McKay, R.M. Abundance and Diversity of Ammonia-Oxidizing Archaea and Bacteria in Sediments of Trophic End Members of the Laurentian Great Lakes, Erie and Superior. PLoS ONE 2014, 9, e97068. [Google Scholar] [CrossRef] [Green Version]
  62. Prosser, J.I.; Head, I.M.; Stein, L.Y. The Family Nitrosomonadaceae. In The Prokaryotes: Alphaproteobacteria and Betaproteobacteria; Rosenberg, E., DeLong, E.F., Lory, S., Stackebrandt, E., Thompson, F., Eds.; Springer: Berlin/Heidelberg, Germany, 2014; pp. 901–918. ISBN 978-3-642-30197-1. [Google Scholar]
  63. Abbas, T.; Zhou, H.; Zhang, Q.; Li, Y.; Liang, Y.; Di, H.; Zhao, Y. Anammox Co-Fungi Accompanying Denitrifying Bacteria Are the Thieves of the Nitrogen Cycle in Paddy-Wheat Crop Rotated Soils. Environ. Int. 2019, 130, 104913. [Google Scholar] [CrossRef] [PubMed]
  64. Mannaa, M.; Han, G.; Jeon, H.W.; Kim, J.; Kim, N.; Park, A.R.; Kim, J.-C.; Seo, Y.-S. Influence of Resistance-Inducing Chemical Elicitors against Pine Wilt Disease on the Rhizosphere Microbiome. Microorganisms 2020, 8, 884. [Google Scholar] [CrossRef] [PubMed]
  65. Zhalnina, K.; Dörr de Quadros, P.; Camargo, F.A.O.; Triplett, E. Drivers of Archaeal Ammonia-Oxidizing Communities in Soil. Front. Microbiol. 2012, 3, 210. [Google Scholar] [CrossRef] [PubMed] [Green Version]
Figure 1. The effects of SF in vegetative growth of paddy plants. (A) Documentation was undertaken every 2 weeks. (B) Dynamics of plant height and number of tillers from week 0 to week 8 after transplantation. Data are shown as mean ± SEM from 10 independent replicates.
Fermentation 08 00046 g001
Figure 2. Effect of SF treatment in N contents of (A) leaves and (B) soil (depth of 15 cm) of paddy in vegetative stage. Data are shown as mean ± SEM from 10 independent replicates. Different letters indicated significant differences at p < 0.01.
Fermentation 08 00046 g002
Figure 3. The relative abundance of top 10 taxa from each treatment group based on the taxonomic annotation results to form the distribution histogram at (A) phylum taxa level and (B) genus taxa level.
Fermentation 08 00046 g003
Figure 4. (A) Rarefaction curves from alpha diversity index, based on the relative abundance (or the number of sequences included) from the largest to the smallest. If the curve becomes flatter, a credible number of samples have been taken, which means only the scarce species remain to be sampled. (B) Beta diversity heatmap showing the weighted UniFrac distance (top) and the unweighted UniFrac distance (bottom) to measure the dissimilarity coefficient between pairwise treatment groups.
Fermentation 08 00046 g004
Figure 5. Taxonomic abundance cluster heatmap showing the top 35 genus of all treatment groups.
Fermentation 08 00046 g005
Figure 6. Krona plot showing the analyses result of AOB (Gammaproteobacteria) taxonomic annotation of (A) CF-treated soil and (B) CFSF1-treated soil. Circles from inside to outside stand for different taxonomic ranks, and the area of the sector shows the respective proportion of different OUT annotation results.
Fermentation 08 00046 g006
Figure 7. Krona plot showing the analyses result of AOA taxonomic annotation of (A) CF-treated soil and (B) CFSF1-treated soil. Circles from inside to outside stand for different taxonomic ranks, and the area of the sector shows the respective proportion of different OUT annotation results.
Fermentation 08 00046 g007
Table 1. Physicochemical properties of soil used for pot experiment.
pHOM (mg/g)N (%)P (mg/kg)K (mg/kg)Soil Texture
7.6111.423.19481.7682.54Clay
Table 2. Chemical properties of seaweed fertilizer before and after fermentation.
Chemical ParametersBefore FermentationAfter Fermentation
pH7.57 a7.42 a
Water content (%)46.63 a31.49 b
Organic C (%)33.58 a43.14 b
N (%)1.06 a1.88 b
C:N (%)23.54 a22.99 a
P (%)2.23 a2.34 a
K (%)2.25 a3.16 b
Ca (mg/kg)315.23 a421.56 b
Mg (mg/kg)335.76 a432.67 b
B (mg/kg)9.89 a19.32 b
Na (mg/kg)NDND
Cl (mg/kg)NDND
Values with same letters in each row are statistically similar (Tukey α = 0.05). p ≤ 0.05. ND = Not Detected
Table 3. Sequencing quality check from five samples.
TreatmentRaw TagsClean TagsEffective TagsBase (nt)AvgLen (nt)Q20GC%Effective%
C0127,434125,46471,99529,902,89341597.6755.9245.54
CF157127,44266,04227,523,13541797.6755.4738.96
SF149,362147,55790,75137,439,02341398.3155.6857.72
CFSF1151,979149,896112,71047,254,45841998.2657.2770.75
CFSF2151,420149,89695,88039,851,90741698.3355.8660.85
Table 4. Alpha diversity indices.
TreatmentObserved SpeciesShannonSimpsonChao1ACEGoods
Coverage
PD Whole Tree
C022838.8230.9922505.2892542.5410.996228.506
CF25788.9910.9922752.4442779.9120.993247.965
SF29378.4120.9803215.7663414.6160.994257.892
CFSF136979.8380.9963940.1664049.9550.998476.768
CFSF236219.7760.9964211.1044249.7480.995446.746
Publisher’s Note: MDPI stays neutral with regard to jurisdictional claims in published maps and institutional affiliations.

