1. Introduction
Gibberellin is a natural plant hormone that regulates the growth and development of higher plants. Currently, 136 species have been discovered, which are sequentially termed GA1–GA136 in the order of discovery [
1]. The activity of gibberellin is GA3 > GA7 > GA4 in promoting stem growth [
2,
3,
4,
5]. However, due to its high activity, GA3 often causes excessive growth of the plant hypocotyl when it breaks plant dormancy and reduces the lodging resistance of the plant. At the same time, it promotes the rapid growth of epidermal cells, resulting in a thinner cuticle layer of the epidermis and rupture of spots of the fruit. GA7 can strongly inhibit the formation of flower buds, whereas GA4 promotes the formation of flower buds [
2]. In addition, GA4 exhibits high biological activity in terms of promoting plant growth, appearance, and shelf life in apples, sweet northern potatoes, and grapes. Although the biological activities of GA4 have been documented, commercial use in agriculture has remained limited compared to GA3, presumably due to low yield and cost competitiveness. Therefore, there is an urgent need to improve GA4 productivity.
GA4 production by fermentation with
Gibberella fujikuroi (
G. fujikuroi) has been reported [
6,
7,
8,
9].
G. fujikuroi belongs to
Fusarium, which is an industrial strain producing gibberellin. At present, there are two engineering strategies for enhancing GA4 production. One way to improve GA4 yield is by regulating the carbon metabolic flux to GA4 in
G. fujikuroi. For example, Tudzynski et al. [
10] deleted two genes at the end of the GA biosynthesis pathway, DES and P450-3, in order to construct an engineered strain that produces only GA4. It was shown that the DES knockout mutant strain did not produce GA3 and GA7, while GA1 and GA4 production increased significantly, with a yield ratio of approximately 5:1. However, the P450-3 knockout mutant strain did not produce GA3 and GA1, simultaneously improving the yield of GA4 and GA7 significantly compared with the wild-type strain. When both DES and P450-3 were simultaneously deleted, the mutant strain produced only GA4 and the yield was 7–8 times higher than that of the starting strain. However, the first method is difficult to perform, owing to a lack of genetic tools for this organism.
The optimization of fermentation conditions is a powerful alternative to GA4 production. The fermentation process is a complex system that is regulated by many factors. Vegetable oil, as a delayed effect carbon source, can provide a carbon source with strain reproduction, which significantly improves the yield of certain secondary metabolites, such as cephalosporin C [
11], spiramycin [
12], and erythromycin [
13]. Zhuang et al. found that adding sesame oil, olive oil, and soybean oil to the fermentation medium effectively increased GA3 production [
14]. This indicated that vegetable oil not only reduced the inhibition of carbon metabolism, but also provided the acetyl-coenzyme A and precursor of gibberellin GA3 [
15]. However, the effect of vegetable oil on GA4 production has not yet been reported. Moreover, there are few kinds of microorganisms that can effectively use vegetable oil as a carbon source. Therefore, it is very important to explore the ability of GA4 production by
G. fujikuroi using vegetable oil as carbon source and to determine the appropriate type and concentration of vegetable oil for GA4 fermentation. In addition, some studies have shown that the concentration of a product is closely related to the amount of supplied primary metabolite precursors (fatty acids, citric acids, sugars, and C
1 compounds) [
16], which can be directly used for cell growth and target product formation. However, the amount of precursor added should not be too high, as this exerts a toxic effect on microorganisms and affects target metabolite formation. If the added precursors were too low, the effect was not significant. Therefore, further studies regarding the precursor addition strategy are necessary to achieve a high yield of GA4.
Response surface methodology (RSM) is a common and effective tool for medium optimization and can be used to design various fermentation parameters simultaneously [
17]. In view of this, this study determined the main factors affecting the production of GA4 through a single-factor test and Plackett–Burman screening test to optimize the key factors based on the Box–Behnken design principle and central composite design optimization method, providing a reference for the optimization of GA4 and other terpenoid fermentation conditions.
2. Materials and Methods
2.1. Raw Materials
Soybean meal, corn steep liquor, corn gluten meal, and GA4 standard were provided by Zhejiang Qianjiang Biochemistry Company(Zhejiang China). Vegetable oil was purchased from a local supermarket. Methanol used was chromatographically pure, and the other reagents were analytically pure.
2.2. Strains and Media
The G. fujikuroi QJGA4-1 used in this study was provided by Zhejiang Qianjiang Biochemical Limited Corporation (Zhejiang China) and was kept in the China General Microbiological Culture Collection Center, and the preservation number was CGMCC17793.
In this study, potato dextrose agar (PDA) medium, containing 200 g/L potato, 20 g/L dextrose, and 20 g/L agar, was used. G. fujikuroi QJGA4-1 was incubated at 28 °C for five to six days in PDA medium. The hyphae of G. fujikuroi were placed into the inclined side of the test tube and underwent vibration with glass beads. The liquid (4%) was then inoculated into a triangular bottle. The samples were cultivated at 220 rpm and 33 °C for approximately 51 h in the seed media. The seed medium (per liter: 30 g sucrose, 12 g soybean meal, 3 g NH4Cl, 3 g NaNO3, 1.5 g KH2PO4, 0.2 g K2SO4, 0.2 g MgSO4·7H2O) was adjusted to pH 6.8 and the seed liquid (4%) was inoculated into a shaking flask. The production of GA4 was measured at 220 rpm and 33 °C for approximately 9 days. The fermentation medium (per liter: 140 g lactose, 10 g soybean meal, 10 g corn steep liquor, 5 g corn gluten meal, 2 g K2SO4, 1 g MgSO4·7H2O, 0.0005 g ZnSO4·7H2O, 0.0005 g CoCl2·6H2O, 1.25 g carbamide) was adjusted to pH 7.0.
2.3. Experimental Design
In a previous study, various nutritional conditions were evaluated for their effects on GA production [
18,
19]. The results revealed that the major variables affecting the fermentation performance in terms of GA3 production were vegetable oil and precursors. Therefore, ten types of vegetable oils (canola, soybean, rice, olive, peanut, sunflower, corn, palm, cottonseed, and sesame oils) and eight precursors (pyruvate, oxaloacetic acid, calcium gluconate, L-isoleucine, citric acid, glycerin, L-glutamic acid, and riboflavin) were selected for further optimization studies.
2.4. Box-Behnken Design (BBD)
The BBD is an efficient method for evaluating the nonlinear relationship between indexes and factors [
20]. In this study, three vegetable oils that significantly increased gibberellin yield were chosen based on a single factor experiment, and then further designed and analyzed by Expert Design 8.0. The experimental factors and their levels are listed in
Table 1.
2.5. Plackett–Burman Design (PBD)
The PBD was employed to screen the most suitable precursors for GA4 production by
G. fujikuroi QJGA4-1. Each independent variable was tested at two levels, high and low, which are denoted by (+) and (−), respectively. The experimental design with the factor name, symbol code, and actual level of the variables is shown in
Table 2.
Two dummy variables were studied in the 12 experiments to calculate the standard error. GA4 production was performed in duplicate, and the average value was taken as the response. Variables with confidence levels above 90% were considered to have a significant effect on GA4 production, and thus were used for further optimization.
2.6. Path of the Steepest Ascent Experiment
To move rapidly toward the optimal response, we used the steepest ascent method. The experiments were adopted to determine a suitable direction by increasing or decreasing the concentrations of variables according to the results of the PBD [
21].
2.7. Central Composite Designs (CCD) and Response Surface Methodology
A central composite design and response surface methodology were used to describe the nature of the response surface in the optimum region. The levels of each factor and the design matrix are listed in
Table 3.
2.8. Gibberellin Analysis
GA4 was analyzed using high performance liquid chromatography (HPLC; Thermo Fisher Scientific, Waltham, MA, USA). A reversed-phase C18 column with 150 mm Lichrospher and 5 μm particle size was used for analysis (Waters, Waltham, MA, USA). Detection was performed at 201 nm. Quantification was achieved using the external standard method with the peak area. Samples were filtered through 0.22-μm membrane filters and directly injected into the HPLC using the 20 μL loop of a Rheodyne injector. If required, the samples were diluted to <40 mg/L.
3. Results and Discussion
3.1. Screening of Vegetable Oils Affecting GA4 Production
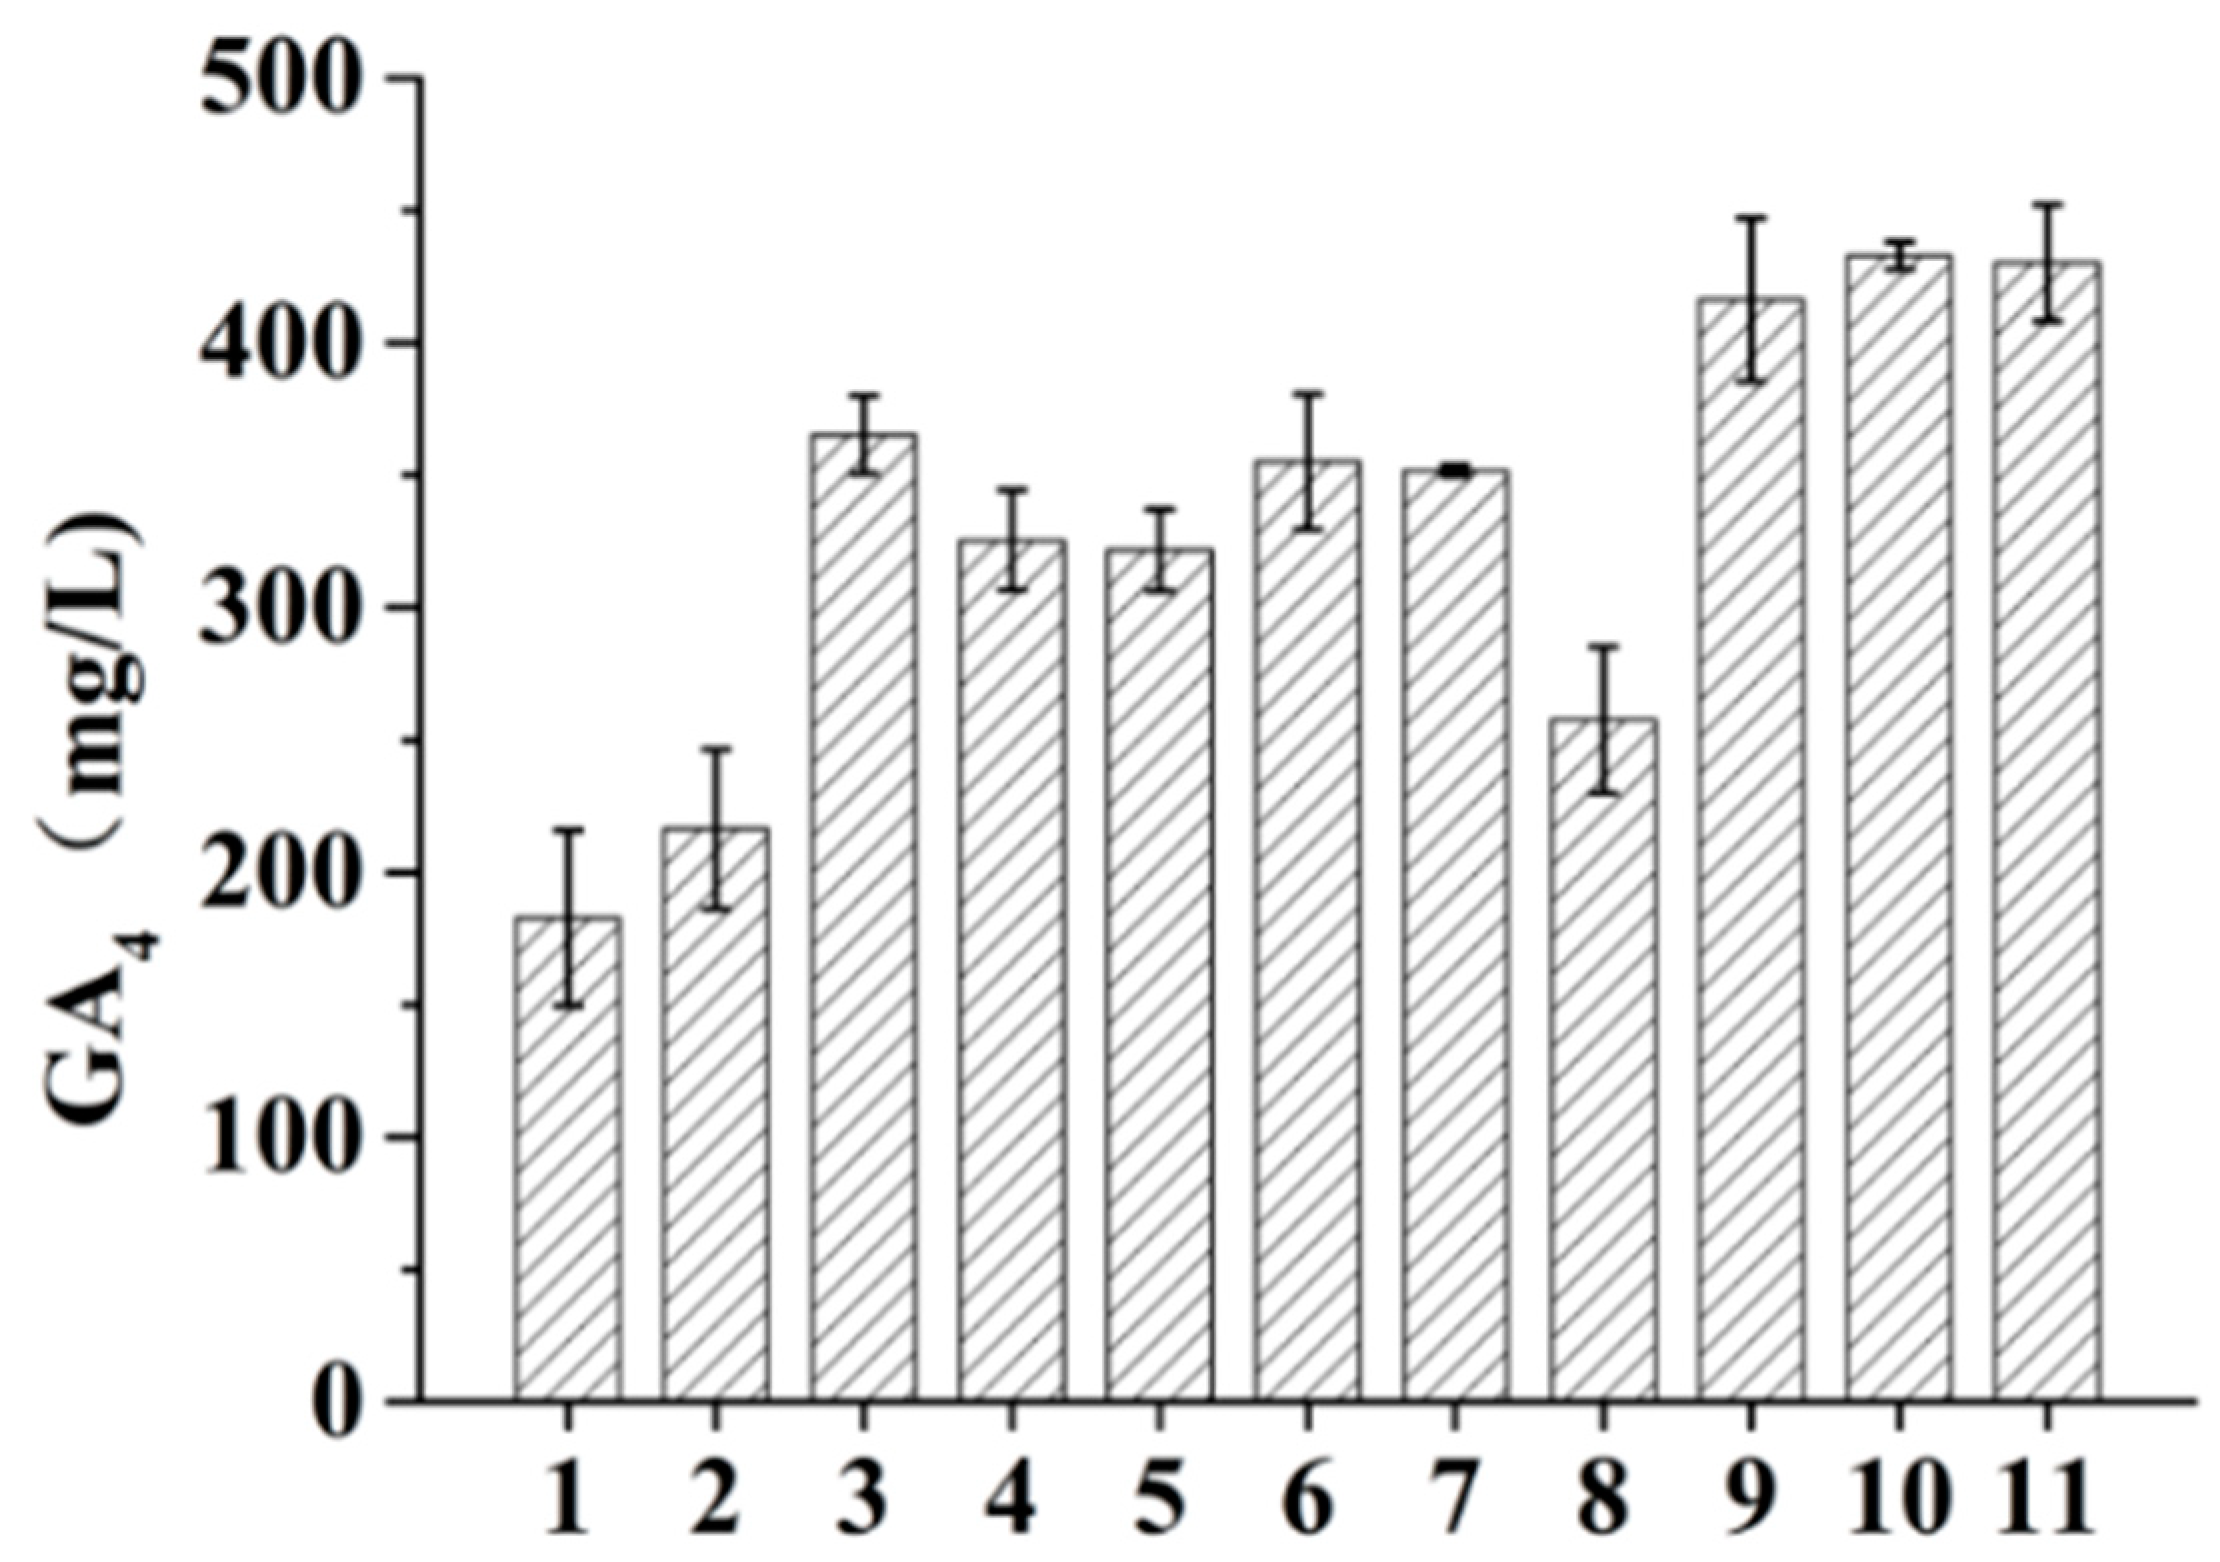
As a slow-acting carbon source, vegetable oil can increase the yield of secondary metabolites. As shown in
Figure 1, ten different vegetable oils were selected. The experimental treatments numbered 1–11 were without vegetable oil, canola, soybean, rice, olive, peanut, sunflower, corn, palm, cottonseed, and sesame oils to investigate the effect of 0.25% oil on GA4 production by
G. fujikuroi.The results showed that adding vegetable oil to the medium increased the GA4 production, among which the production of palm oil, cottonseed oil, and sesame oil were significantly higher than those of other oils. It can be found from
Figure 1 that there is no significant difference in improving the production of GA4 by comparing the three oils. Therefore, palm oil, cottonseed oil, and sesame oil were selected for further research.
3.2. Effect of Palm, Cottonseed, and Sesame Oils on the Production of GA4
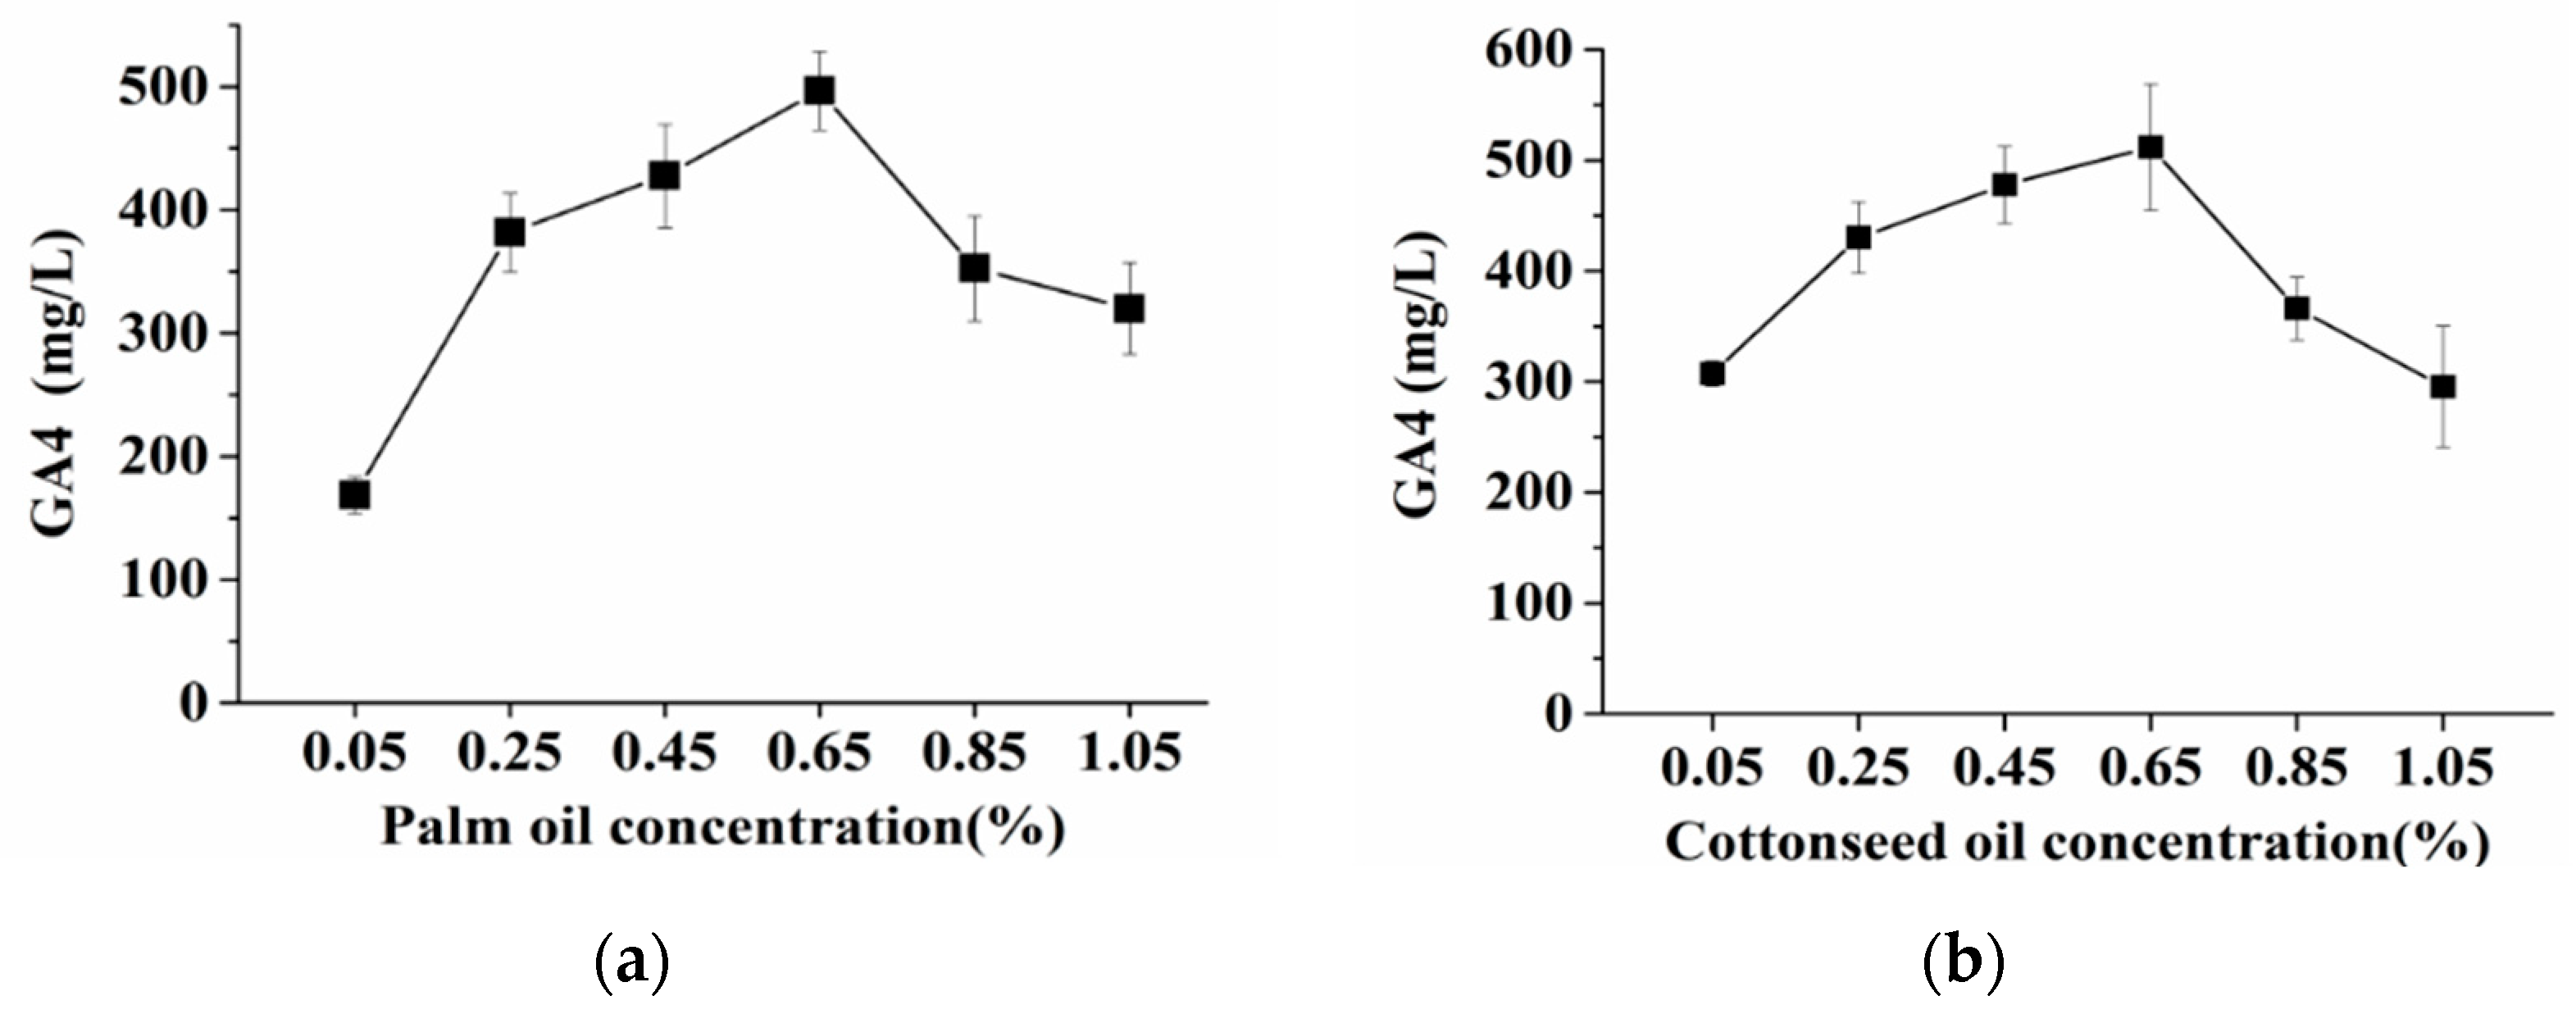
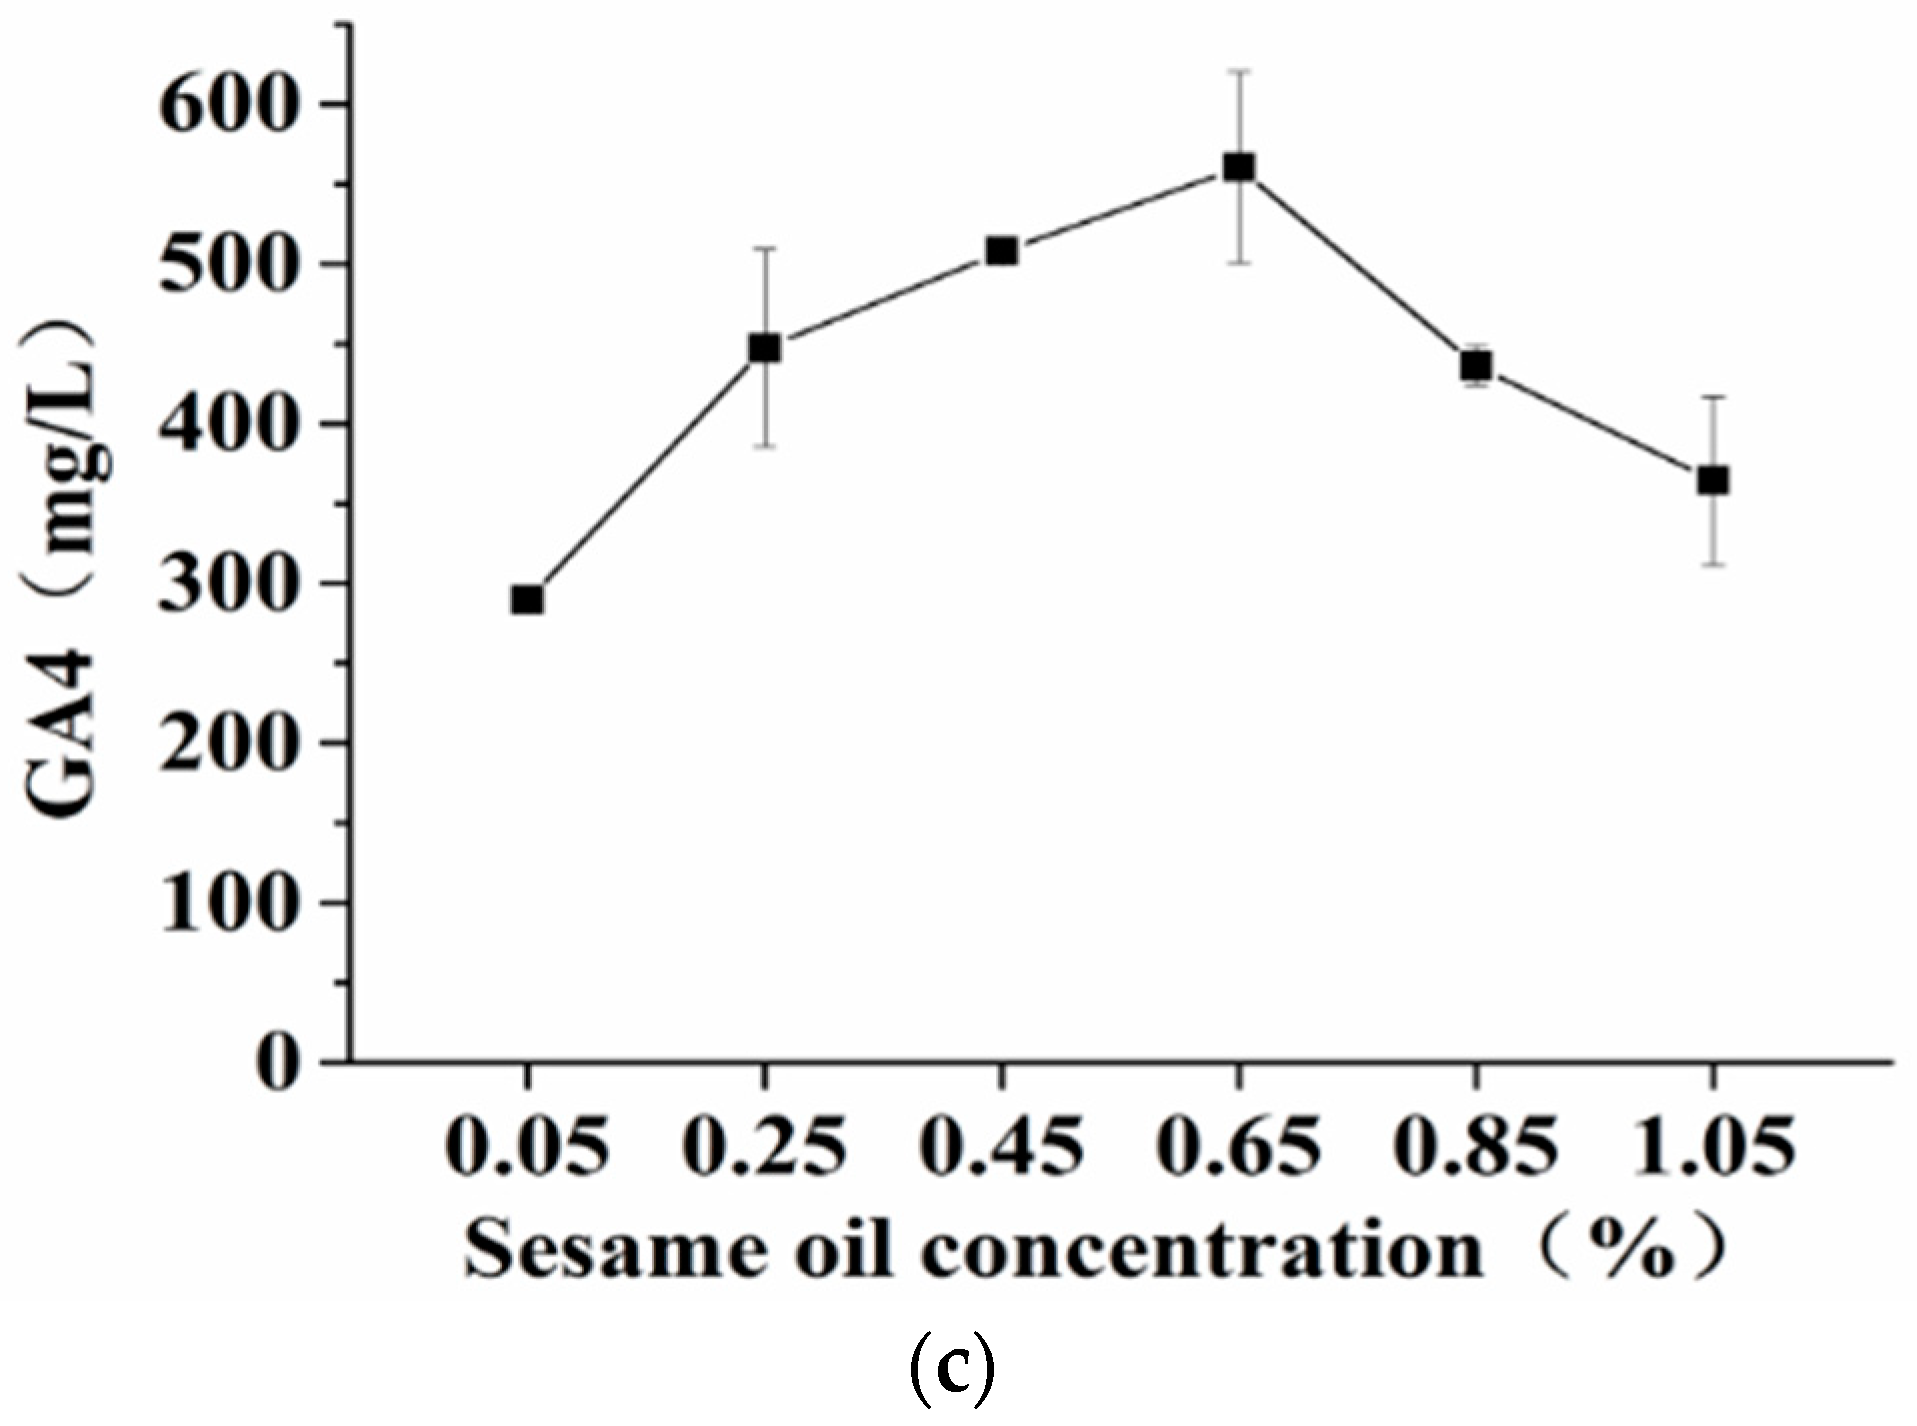
Based on the above results, the impact of different concentrations of palm, cottonseed, and sesame oils on GA4 production was investigated. The results are presented in
Figure 2. Palm oil, cottonseed oil, and sesame oil (0.05%, 0.25%, 0.45%, 0.65%, 0.85%, and 1.05%) were added to the medium. As the oil concentration increased, the GA4 value first increased and then decreased gradually. When 0.65% oil was added, the highest yield of GA4 was achieved. Therefore, 0.65% palm, cottonseed, and sesame oils were determined as optimal concentrations.
3.3. Interaction of Palm Oil, Cottonseed Oil, and Sesame Oil on GA4 Production Using BBD
Palm oil (A), cottonseed oil (B), and sesame oil (C) were independent variables, and GA4 (Y) was the response value in BBD. The Box–Behnken experimental design and results are shown in
Table 4.
The Box–Behnken experimental design and results are presented in
Table 4. The analysis of variance of the test results is presented in
Table 5, and the
p value of the model was less than 0.05, indicating that the ANOVA test was significant. The
p value of lack of fit was 0.9507, indicating a high degree of fit between the predicted and actual values. Therefore, the model could be used to analyze and predict the production of GA4.
The data were analyzed using Design Expert 8.0 software, and a quadratic response surface regression model was established. The fitting quadratic regression equation was obtained as follows:
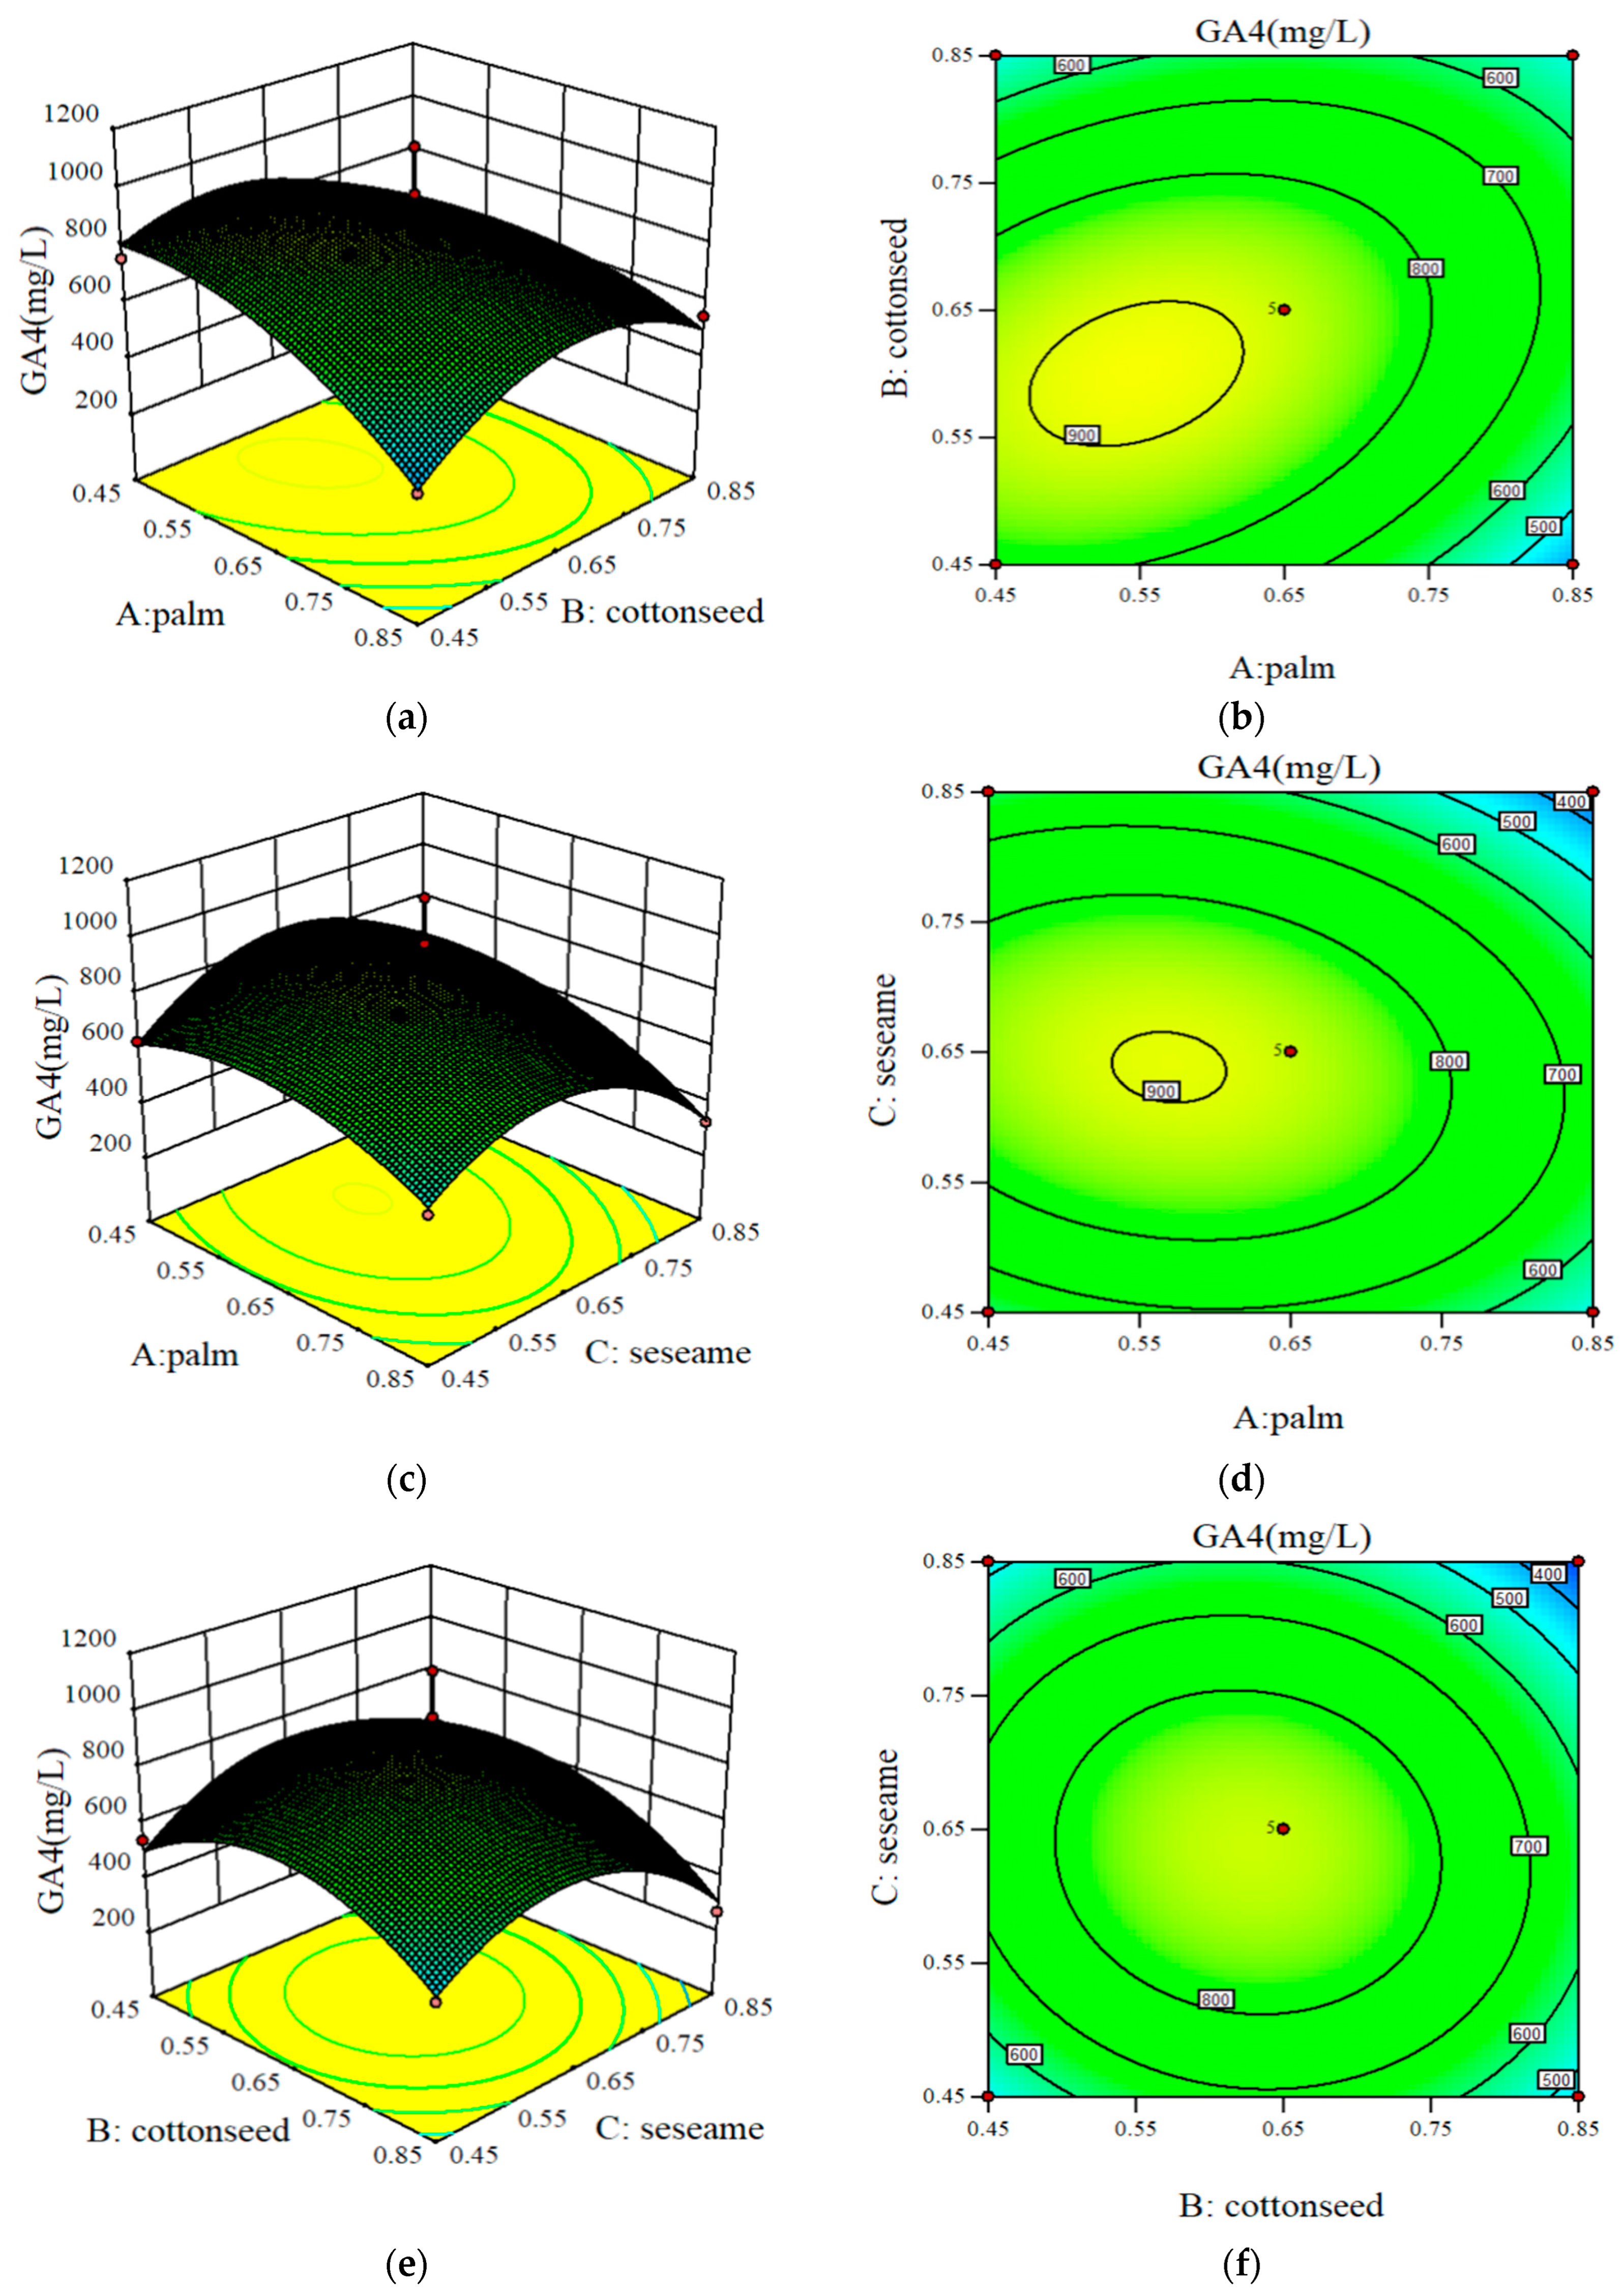
To better estimate the influence of the interactions between any two independent parameters on GA4 production, three-dimensional response surfaces and two-dimensional contour plots are plotted in
Figure 3. The effect of palm oil concentration and cottonseed oil concentration on GA4 production is shown in the three-dimensional response surface plot in
Figure 3a.
Figure 3c depicts the influence of the interactions between sesame oil concentration and palm oil concentration on GA4 production. A response surface plot was used to depict the effect of cottonseed oil concentration and sesame oil concentration on GA4 production (
Figure 3e). The downward opening of the response surface (
Figure 3a,c,e) revealed that GA4 production was improved by promoting palm, cottonseed, and sesame oil levels until the optimum value was obtained. However, continuing to increase the oil levels resulted in a linear decrease in GA4 production. The highest GA4 production was obtained using palm, cottonseed, and sesame oil values of 0.55%, 0.60%, and 0.64%, respectively.
Figure 3b,d,f shows the two-dimensional contour plot of the interaction between palm, cottonseed, and sesame oils, respectively, and the effect of variables on GA4 production. From the contour plot, we observe that the interactive contour map between palm, cottonseed, and sesame oil is nearly circular, indicating that the interaction has no significant effect on GA4 production.
Overall, analysis of the response surface showed that the optimal conditions for GA4 production were 0.55% palm oil, 0.60% cottonseed oil, and 0.64% sesame oil, the GA4 production was 915.35 mg/L under the above conditions (predicted with RSM).
Confirmation of the optimized medium component was performed in shake-flask cultures using the optimum predicted values of the various variables. To verify the accuracy of the model, GA4 fermentation experiments were performed on the optimum medium. The average production of GA4 obtained from three parallel experiments was 875.51 mg/L, which is close to the predicted value of the regression equation. This finding demonstrated that the constructed model was valid for predicting the generation of GA4 using QJGA 4-1. Similarly, Wang et al. reported that adding soybean oil to the fermentation medium effectively improved GA3 production [
22], because oil as a carbon source does not inhibit carbon metabolism but can provide the necessary acetyl-coenzyme for gibberellin synthesis [
18].
3.4. Screening of Precursors for GA4 Production Using the PBD
Pyruvate (A), oxaloacetic acid (B), calcium gluconate (C), L-isoleucine (D), citric acid (E), glycerin (F), L-glutamic acid (G), and riboflavin (H) were used as screening factors in the 12 fermentation experiments. The concentration of each factor and the experimental results are listed in
Table 6.
To investigate the influence of different precursors on GA4 production,
p value analysis was conducted using Design Expert 8.0. As shown in
Table 7, the
p value was 0.0453 < 0.05, and the R
2 value was 0.962, which indicates that the fitted model is significant and reliable. Among the eight factors, pyruvic acid, citric acid, and oxaloacetic acid were the most important factors for GA4. From the positive and negative effects of the statistical analysis coefficients of various factors in
Table 7, we observed that the concentrations of pyruvate, oxaloacetic acid, and citric acid should be increased to enhance the production of GA4.
3.5. Steepest Ascent Design
To find the proper direction of changing variables, the steepest ascent design experiment and the corresponding results are shown in
Table 8. Pyruvic acid (A), oxaloacetic acid (B), and citric acid (E) were important factors affecting the production of GA4.
The steepest ascent test showed that the maximum GA4 concentration near to the central point was A, 0.2 (g/L), B, 0.2 (g/L), and E, 0.2 (g/L).
3.6. CCD and Statistical Optimization of GA4 Production
Based on the central point, the central composite design, with three factors and five levels, was determined (
Table 9).
Design-Expert software (version 8.0) was used to fit the experimental data with quadratic polynomial regression. The following regression fitting equation is obtained:
The results of the variance analysis are presented in
Table 10 (
p = 0.0169), indicating that the regression model was significant. The fitting degree was 0.0707, which was not significant, indicating that the fitting degree was good. This model was found to be effective. The data can be analyzed using the model, and the GA4 content can be predicted using the regression equation.
Table 10 shows that factors A, B, AE, BE, and B
2 had significant effects on GA4 production.
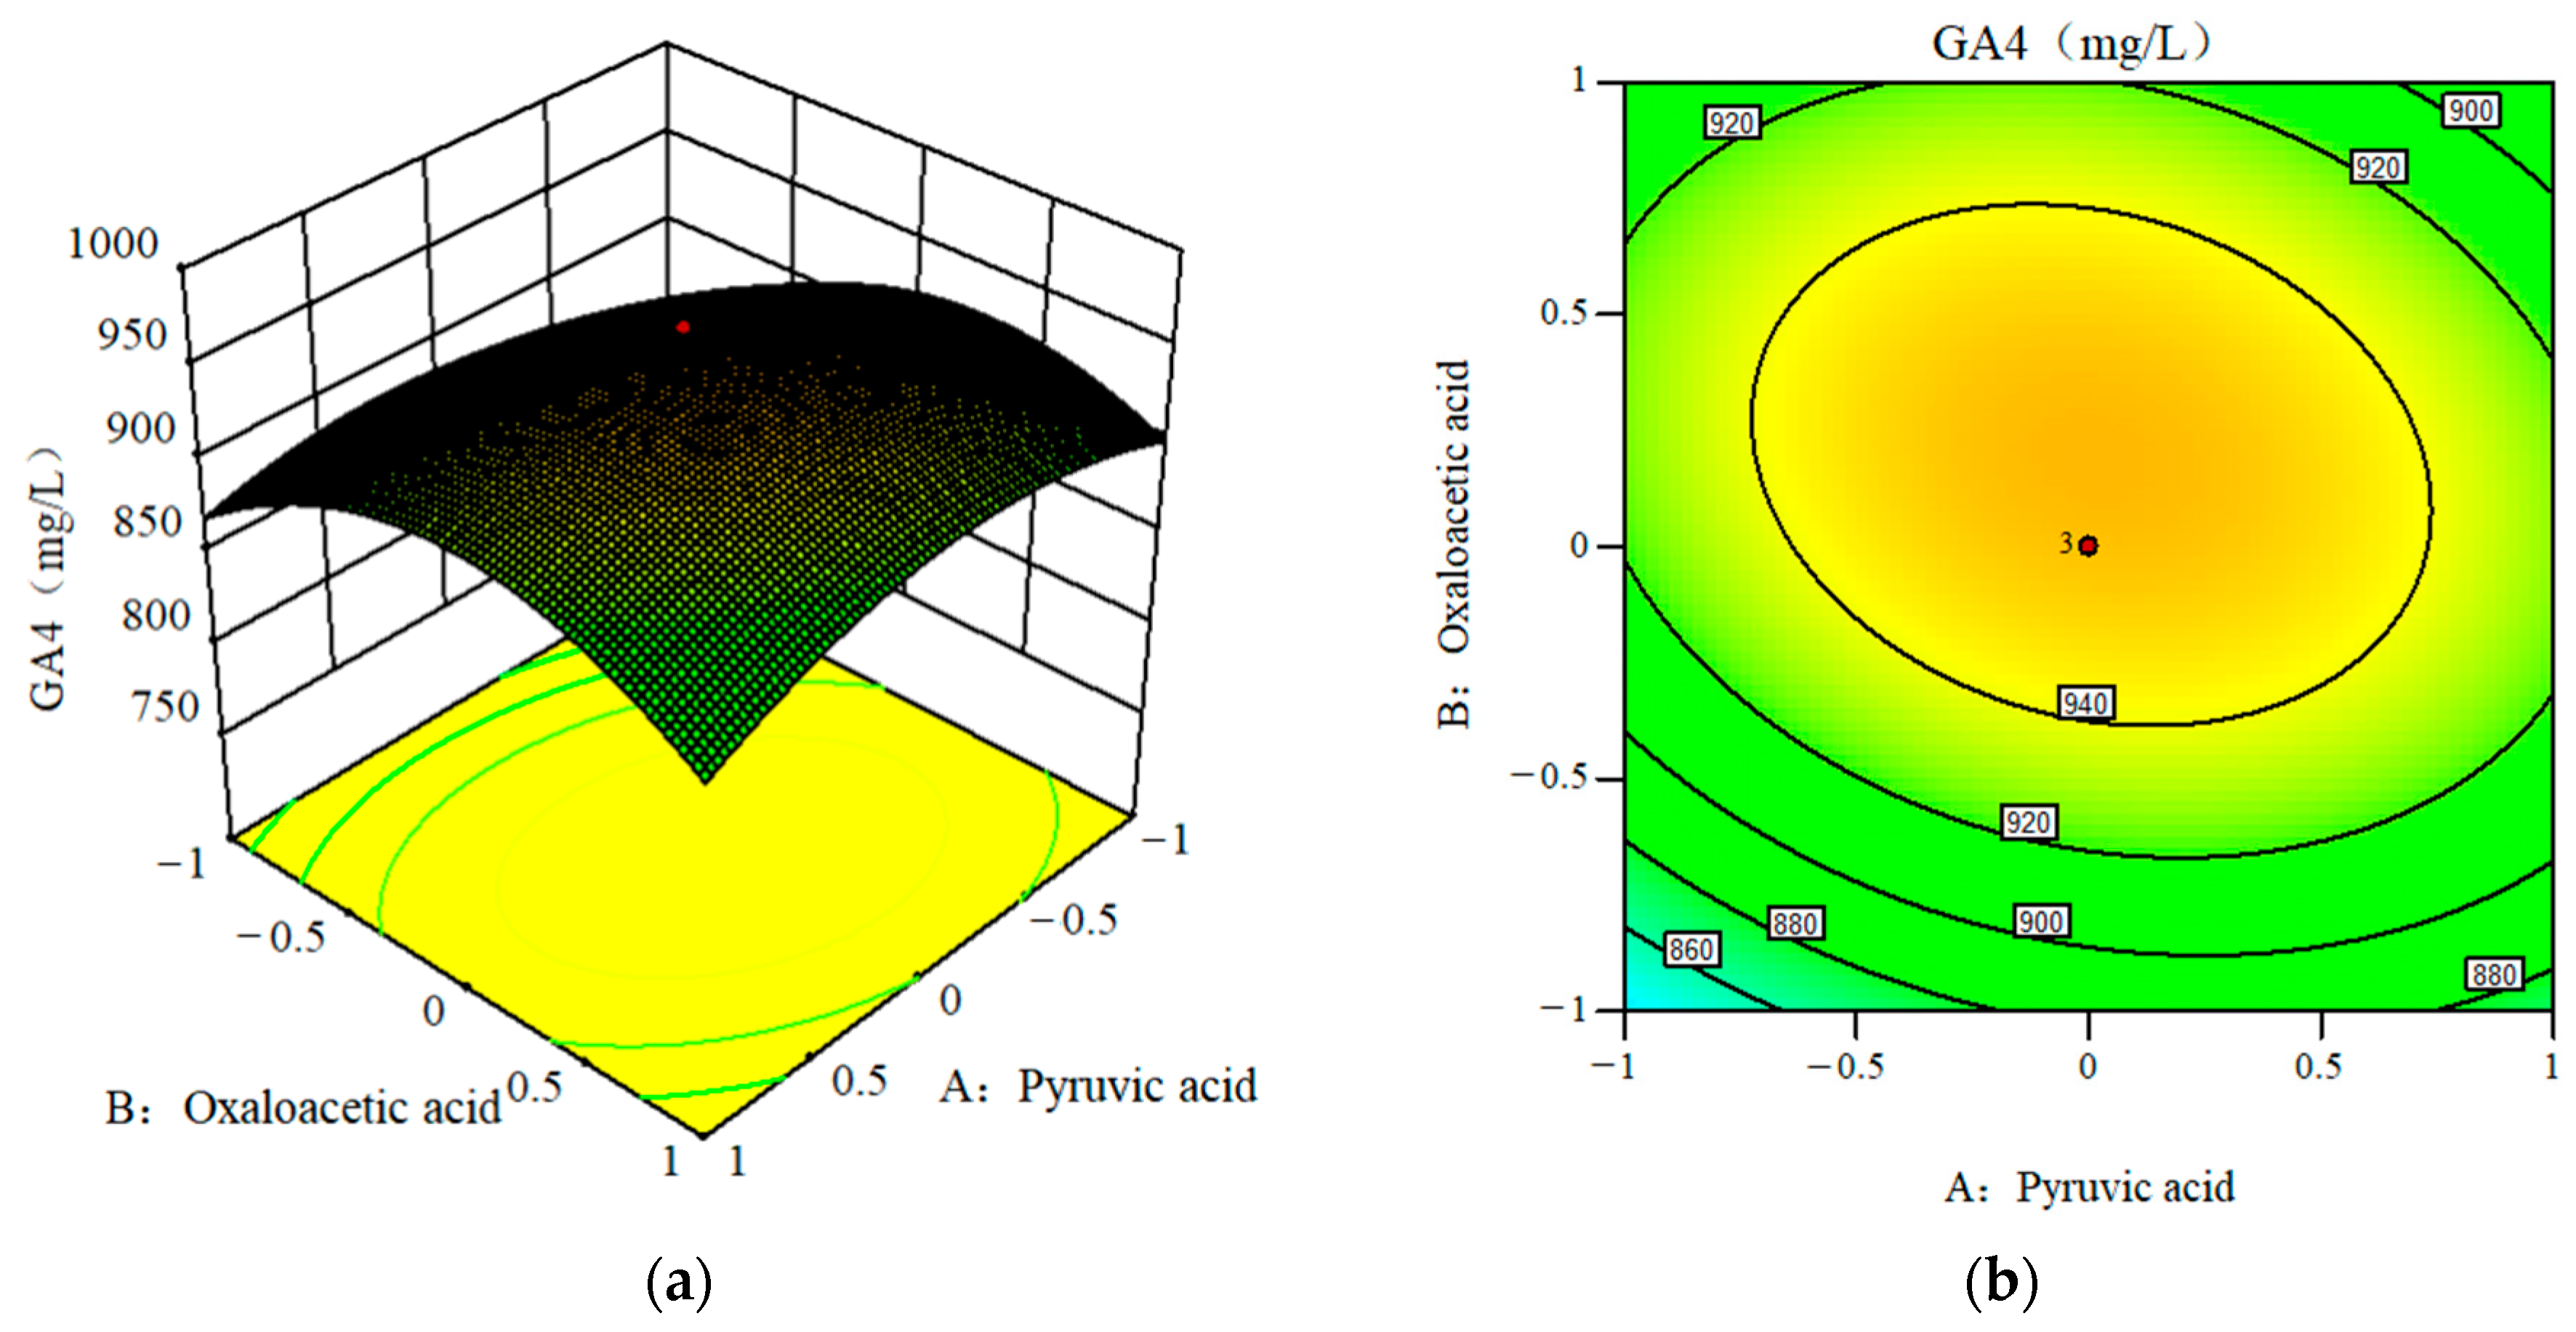
Design-Expert software (version 8.0) was used to obtain three-dimensional response surface plots and corresponding two-dimensional contour plots of the relationship between pyruvic acid, oxaloacetic acid, and citric acid on GA4 production (
Figure 4). From
Figure 4a,c,e, we observed the downward opening of the response surface, which proves that the model has a maximum value and GA4 has a maximum production.
Figure 4d shows that the contour plot of pyruvic acid and oxaloacetic acid on GA4 production is nearly circular, indicating that the interaction between pyruvic acid and oxaloacetic acid has no significant effect on GA4 production.
Figure 4b,f show the interactive contours of oxaloacetic acid with citric acid and pyruvic acid with citric acid, respectively. The contours are elliptical, which proves that the interactions between oxaloacetic acid and citric acid, and pyruvic acid and citric acid exerted a significant effect on GA4 production. When the concentration of A was 0.19 g/L, B 0.21 g/L, and E 0.21 g/L, the predicted production of GA4 was 960.34 mg/L.
3.7. Experimental Validation of the Model
To verify the predicted results of the model, three repeated shaking flask fermentation experiments were conducted under the optimized conditions. The actual GA4 production in the optimum medium was 972.95 mg/L, which is consistent with the predicted value of 960.34 mg/L. This demonstrated that the model could predict GA4 production well. Compared with the case without the precursor, GA4 production increased by 11.1%.
The type and concentration of the precursors affect the synthesis of gibberellin. At present, most studies have focused on the influence of the precursor on the synthesis of GA3. For example, Wang and et al. [
23] found that oxaloacetic acid, calcium gluconate, and riboflavin exerted obvious effects on the synthesis of GA3. Through experiments and metabolic flux analysis, some scholars found that oxaloacetate also had a significant effect on the formation of GA3 [
24]. This may be as a result of the metabolic flux distribution change. However, relevant studies on the optimization of fermentation conditions for GA4 have not been reported. Based on the relevant studies on GA3, we can further explore the influence of the precursor on the synthesis of GA4. In this study, oxaloacetic acid was also found to promote the synthesis of GA4. This may be a result of the metabolic flux distribution change between the HMP pathway and TCA cycle with the addition of oxaloacetic acid [
25,
26,
27]. Acetyl-CoA is a key regulator of metabolite synthesis by
Fusarium fujikuroi. Adding oxaloacetic acid relieved the inhibition of the EMP pathway. At the same time, it was decarboxylated to pyruvic acid and further metabolized to acetyl CoA, which is a substance promoting GA4 production. Some studies have shown that pyruvic acid, as the intermediate product of the tricarboxylic acid (TCA) cycle and the final product of the glycolysis pathway, can be converted into fatty acids, amino acids, and polysaccharides through coenzyme A and TCA cycle metabolites [
28]. Oxaloacetic acid, citric acid, and pyruvic acid are all important metabolites of the TCA cycle and the EMP pathway. Adding an appropriate amount of pyruvic acid, oxaloacetic acid, and citric acid may accelerate the metabolism of bacteria, promote the formation of acetyl CoA, and further improve GA4 production. In addition, the strain may have different affinities for different precursors. For example, in this study, calcium gluconate and riboflavin did not significantly affect the production of GA4.
4. Conclusions
G. fujikuroi QJGA4-1 is a GA4 producing strain, but its production level is not competitive. To further improve the production of GA4, the nutritional conditions of the vegetable oil and precursors were optimized using response surface methodology. Based on these results, response surface models for vegetable oils and precursors were determined. To the best of our knowledge, this GA4 production level is the highest by G. fujikuroi QJGA4-1 under the optimized conditions until now.
Regarding the industrial GA4 fermentation process, a large amount of vegetable oil is required, which will inevitably lead to an increase in production cost and pollution probability. Therefore, vegetable oil utilization efficiency needs to be improved to obtain a cheap substitute for GA4 production. In the future, we will analyze the type and content of oleic acid in vegetable oil and explore the mechanism of promoting GA4 synthesis via oleic acid metabolism. In addition, the precursor for the synthesis of GA4 was determined based on RSM. Subsequently, transcriptomics, proteomics, and metabolomics will be used to analyze GA4 biosynthesis, through global regulatory analysis, to explore the product synthesis mechanism, in order to identify new targets for increasing GA4 production.


