Article

Impact of Oil Sources on In Vitro Fermentation, Microbes, Greenhouse Gas, and Fatty Acid Profile in the Rumen

by
Sardar Muhammad Amanullah
1,†,
Seong-Shin Lee
2,†,
Dimas Hand Vidya Paradhipta
3,
Young-Hoo Joo
4,
Dong-Hyeon Kim
5,
Pil-Nam Seong
2,
Seung-Min Jeong
4 and
Sam-Churl Kim
4,*
1
Biotechnology Division, Bangladesh Livestock Research Institute, Dhaka 1341, Bangladesh
2
Animal Nutrition and Physiology Division, National Institute of Animal Science, Wanju 55356, Korea
3
Department of Animal Nutrition and Feed Science, Faculty of Animal Science, Universitas Gadjah Mada, Yogyakarta 55218, Indonesia
4
Division of Applied Life Science (BK21Four, Institute of Agriculture & Life Science), Gyeongsang National University, Jinju 52828, Korea
5
Dairy Science Division, National Institute of Animal Science, Cheonan 31000, Korea
*
Author to whom correspondence should be addressed.
These authors contributed equally to this work.
Submission received: 19 April 2022 / Revised: 20 May 2022 / Accepted: 21 May 2022 / Published: 23 May 2022
(This article belongs to the Special Issue Recent Advances in Rumen Fermentation Efficiency)

Abstract

:
This study estimated the effects of oil sources on fermentation characteristics, greenhouse gas, microbial diversity, and biohydrogenation of fatty acids in the rumen. In vitro ruminal incubation was performed with 7 mg of oil source, 15 mL rumen buffer, and 150 mg of synthetic diet at 39 °C for 0, 3, 6, 12, and 24 h. Oil sources consisted of corn oil (CO; linoleic acid (C18:2n-6)), linseed oil (LSO; linolenic acid (C18:3n-3)), or Ca-salts (protected C18:2n-6). The ruminal gas was collected for CH4 and CO2 analysis. Incubated rumen buffer was sub-sampled for the analysis of microbial quantification, fermentation characteristics, and fatty acid profiles. The results showed that Ca-salt increased acetate (p = 0.013), while CO increased propionate (p = 0.007). Fibrobacter succinogenes, Ruminococcus flavefaciens, and R. albus increased (p < 0.05) with Ca-salt after 12 h of incubation, while Streptococcus bovis increased (p < 0.05) by LSO. The CO and Ca-salt resulted in the highest C18:2n-6 (p = 0.002), while LSO resulted in the highest C18:3n-3 (p = 0.001). The Ca-salt had the lowest C18:0 (p = 0.002), but the highest C18:1cis-9 (p = 0.004). In conclusion, Ca-salt supplementation resisted biohydrogenation to some extent, decreased methanogenic archaea and protozoa, and exerted less toxic effects on fibrolytic bacteria.

1. Introduction

Research interest in the field of fatty acid (FA) supplementation for ruminants has increased in recent decades mainly with the desire to influence a number of physiological processes and to manipulate FA compositions of products derived from ruminants [1]. Those FAs having important biological functions as well as health benefits for both humans and livestock are of major concern, e.g., linoleic acid (C18:2n-6) and linolenic acid (C18:3n-3). These FAs were reported as essential FA for animals [1,2].
Supplementing oil sources to ruminant diet, poly-unsaturated FA (PUFA) in particular has been shown to reduce enteric methane (CH4) emission [3,4]. A depressing effect on ruminal methanogenesis was observed with linseed oil [5], sunflower seed oil [5,6], or canola oil [7]. The oil sources with free FAs in the rumen having antimicrobial effects [8,9] can change the proportional production of volatile FA (VFA) [9,10], and reduce CH4 production [11]. Nevertheless, oil sources undergo extensive lipolysis and biohydrogenation of their PUFA by rumen microbes [12]. Calcium salt of FAs was found to be degraded to a lower extent in rumen [13], exert less toxicity on microbes [14], and thereby may potentially manipulate FA compositions at a physiological or product level. In our previous study, the effects of pure C18:2n-6, C18:3n-3, and their combination were studied [10]. However, the application of pure FAs is not practical at the farm level due to the expensiveness and the difficulties of handling and storage. The use of rich-oil sources can be an alternative solution as a rumen modifier instead of pure FA, which is more applicable for farmers. Even though varied rich oil can be used as a source of essential FA, there is limited information concerning its use.
In general, rich-oil sources of C18:2n-6 FA and C18:3n-3 FA have been used to demonstrate the effect on growth performance, milk production, and meat fatty acids [5,6,7]. Corn oil is known as a source of C18:2n-6 FA with a concentration of approximately 50.0–58.2% of total FA [15,16]. Besides that, linseed oil also contains C18:3n-3 FA of approximately 52.5–55.6% of total FA [17,18]. Calcium salt is formed by an ionic bond between the free carboxyl group of the FA and calcium ions [19]. The FA can bypass the rumen without disturbing the rumen microorganisms by the insoluble character of the calcium salt [20], which is commercially available and widely used as a fat supplement for lactating cow and beef cattle, which demand high-energy diets. Generally, the supplementation of pure essential FA was reported to reduce enteric CH4 emission and biohydrogenation of essential FA, but it could present a negative effect on rumen microbes or fermentation [9,10]. Thus, protected FA was applied in the present study to investigate its effects on rumen fermentation. As a hypothesis, protecting C18:2n-6 FA with calcium salt was expected to reduce the negative effects of essential fatty acids on rumen microbes or fermentation.
Recently, there has been limited information concerning a comparison of the effects of corn oil, linseed oil, and protected C18:2n-6 FA using calcium salt as a rumen modifier in an in vitro study. Therefore, the present study was conducted to investigate the effects of oil sources of FAs containing C18:2n-6, C18:3n-3, and protected C18:2n-6 on rumen fermentation, greenhouse gas emission, microbial diversity, and biohydrogenation of FA through in vitro technique.

2. Materials and Methods

2.1. In Vitro Incubation

Animal care and handling in the present study was approved by the Animal Ethic Committee of Gyeongsang National University, Korea (GNU-191011-E0050). Two rumen cannulated Hanwoo heifers fed rice straw and commercial concentrate at a ratio of 8:2 were used to collect rumen fluid. The crude protein (CP) and neutral detergent fiber (NDF) of rice straw were 5.40% and 63.85%, respectively. CP and NDF of commercial concentrate containing ground corn, barley meal, soybean meal, rice bran, corn gluten feed, and so on were 12.51% and 47.51%, respectively. Approximately 1 L of rumen fluid was collected from both animals before morning feeding, filtered with double layers of cheesecloth, and bulked to obtain homogenous inoculum. Then, rumen fluid (600 mL) was mixed with anaerobic culture medium (1200 mL) at a 1:2 ratio according to Adesogan et al. [21], which mainly consisted of micro- and macro-minerals with trypticase. An anaerobic condition was maintained during mixing by continuous flushing of carbon dioxide (CO2) into the container of the rumen buffer in accordance with previous studies [22,23]. A fat-free synthetic diet containing 411 g cellulose (Sigma, C6413, St. Louis, MO, USA), 411 g starch (Sigma, S4180, St. Louis, MO, USA), and 178 g casein (Sigma, C3400, St. Louis, MO, USA) per kg DM was used as substrate [24]. Dietary treatments contained either corn oil (C18:2n-6; CO), linseed oil (C18:3n-3; LSO), or Ca-salts of rapeseed oil (protected C18:2n-6; Ca-salt). The FA compositions of oil sources are illustrated in Table 1. The Ca-salt of FA contained 28.50% C18:2n-6. Therefore, the Ca-salt treatment was considered as a rich source of protected n-6 FA in the present study. Ruminal incubation was performed in 50 mL glass serum bottles containing 150 mg of synthetic diet, 7 mg of each oil source (CO vs. LSO vs. Ca-salt), and 15 mL of rumen buffer. The application ratio of oil sources demonstrated the energy diet for beef cattle. Incubations were conducted at 39 °C for 0, 3, 6, 12, and 24 h with 5 replications and 5 blanks for each incubation time period. The blanks only contained 15 mL of rumen buffer without the synthetic diet and oil sources.

2.2. Sampling and Chemical Analysis

After each incubation time, the headspace gas pressure from incubation bottles was measured with a pressure transducer (Fisher Scientific, TraceableTM, Friendswood, TX, USA) attached with Luer-lock three-way stopcock, and then bottles were placed into the ice to stop microbial activity, as described by Honkanen et al. [25]. Total gas volume was calculated from gas pressure (psi) according to Mauricio et al. [26]. The gas sample was collected in vacutainer tubes without additives for CH4 and CO2 analysis using a multi-gas analyzer (Yes Plus LGA, Critical Environment Technologies, Canada Inc., Delta, BC, Canada). After the bottle was opened, an incubated sample was sub-sampled at 1 mL for microbial quantification using PCR. Additionally, 2 mL rumen buffer was collected for FA analysis. After that, the incubated sample was centrifuged at 2568× g for 15 min to separate incubated rumen buffer and the remaining diet [22,23]. The incubated rumen buffer was sampled for analyses of pH, ammonia-N (NH3-N), total VFA, and FA profiles. The pH was determined by using a pH meter (SevenEasy, Mettler Toledo, Greifensee, Switzerland). The NH3-N was measured according to Chaney and Marbach [27] through distillation of the sample in a Buchi apparatus (B-342, BÜCHI, Flawil, Switzerland) followed by titration with 0.1N H2SO4 in a burette. For further analyses of rumen fermentation, the incubated rumen buffer was centrifuged at 21,500× g for 15 min [22,23] and the supernatant was collected to determine the concentrations of VFA using HPLC (L-2200, Hitachi, Tokyo, Japan) fitted with a UV detector (L-2400, Hitachi, Tokyo, Japan) and a silica gel column (Metacarb 87H, Varian, Palo Alto, CA, USA) and concentrations were determined according to Muck and Dickerson [28].
The FA concentrations of oil source and rumen buffer were determined using the gas chromatography technique. One milligram of internal standard (C19:0) was added to the sample before freeze drying to calculate the total FA concentration. The two-step methylation procedure of Jenkins et al. [29] was used for the preparation of FA methyl ester (FAME), which was then analyzed using gas chromatography (450-GC, Varian, Palo Alto, CA, USA) equipped with an autosampler (CP-8400, Varian, Palo Alto, CA, USA), a flame ionization detector, and a Varian capillary column (CP-Sil 88, Palo Alto, CA, USA, 100 m × 0.25 mm × 0.2 µm). Hydrogen was the carrier gas. The injector and detector were maintained at 230 °C. The oven temperature was initially set at 120 °C for 1 min, increased by 5 °C/min up to 190 °C, held at 190 °C for 30 min, increased again by 2 °C/min up to 220 °C, and held at 220 °C for 40 min. The peak of the samples was identified, and the concentrations were calculated based on the retention time and peak area of known standards.

2.3. DNA Extraction, Primer Information, and Real-Time PCR Analysis

The DNA extraction procedure involved a physical disruption of cells by a mini bead-beater (BioSpec Products, Bartlesville, OK, USA) followed by isolation and purification using a commercial DNA extraction kit (QIAamp DNA mini kit, Qiagen, Germantown, MD, USA). A 700 mL aliquot of homogenously incubated rumen sample was transferred into a 1.5 mL microcentrifuge tube. Then, 180 mL of buffer animal tissue lysis (ATL) and 20 mL of proteinase K (supplied in the QIAamp DNA Mini Kit) was added into the tube, followed by vortexing. The tubes were then incubated at 56 °C for 12 h for cell lysis in a heating block (HB-48, Daihan Scientific Co., Ltd., Seoul, Korea). Next, the DNA purification protocol was followed as described in the manufacturer’s instruction manual (Qiagen, Germantown, MD, USA). A NanoDrop Spectrophotometer (Thermo Scientific, ND-1000, Santa Clara, CA, USA) was used to determine the genomic DNA concentrations in the extracted samples, and the concentrations of all template DNA samples were adjusted to 50 ng/μL. PCR conditions were 95 °C for 5 min, followed by 35 cycles of 95 °C for 15 s and 56~60 °C for 30 s. The universal primers for bacteria and species-specific primers for Fibrobacter succinogenes, Ruminococcus flavefaciens, Ruminococcus albus, Streptococcus bovis, rumen methanogenic archaea, and ciliates (Entodinium) are given in Table 2. Real-Time qPCR was performed using Bio-Rad C1000 TouchTM Thermal cycler Real-Time PCR detection system (CFX96TM Real-Time system, Bio-Rad Laboratories, Inc., Hercules, CA, USA), with fluorescence detection of SYBR Green Real-Time Master Mix (TOYOBO Co. Ltd., Osaka, Japan). The values of cycle threshold (Ct) after Real-Time PCR were used to determine fold change of different microbial populations relative to the control (universal bacteria). Abundance of these microbes was expressed by the equation: relative quantification = 2−ΔCT(Target)−ΔCT(Control), where Ct represents threshold cycle. The ribosomal protein gene for rumen bacteria was used as a reference gene for internal control as done by Kim et al. [30]. All quantitative PCR mixtures (final volume of 20 μL) contained forward and reverse primers (200 nM), SYBR Green Master Mix, DNA template (50 ng), and sterilized distilled water. A negative control without template DNA was used.

2.4. Statistical Analysis

The study was a completely randomized design. All data were analyzed using PROC ANOVA of Statistical Analysis System (SAS) ver. 9.3 [36]. Its model was Yij = μ + Ti + eij, where Yij = response variable, μ = overall mean, T = effect of treatment i, and eij = error effect. In addition, rumen pH, NH3-N, acetate, propionate, CH4, CO2, rumen microbes, and 18-carbon FA data were also analyzed using PROC GLM of SAS to test the significant levels of dietary treatment, incubation time, and the interaction between dietary treatment and incubation time. Its model was Yijk = µ + αi + βj + (αβ)ij + eijk, where Yijk = response variable, µ = overall mean, αi = the effect of dietary treatment, βj = the effect of incubation time, (αβ)ij = the interaction effect between dietary treatment and incubation time, eijk = error effect. Mean differences were tested for significance using Tukey test at p ≤ 0.05.

3. Results

3.1. Fatty Acid Profiles before Incubation

At 0 h of ruminal incubation, dietary treatment did not affect total FA, but had effects on concentrations of individual FA (Table 3). The C15:0 concentration was higher (p = 0.047) in LSO than in Ca-salt. The Ca-salt had higher C18:1cis-9 concentration (p = 0.026) than CO and LSO. The C18:2n-6 concentration was lower (p = 0.013) in LSO than in CO and Ca-salt. The C18:3n-3 concentration was higher (p = 0.004) in LSO than in CO and Ca-salt. The Ca-salt had higher mono-unsaturated FA (MUFA) concentration (p = 0.029) than CO and LSO. The ratio of n-6 to n-3 was lower (p < 0.006) in LSO than in CO and Ca-salt. The concentrations of other individual FAs, saturated FA (SFA), and PUFA were not affected by dietary treatments.

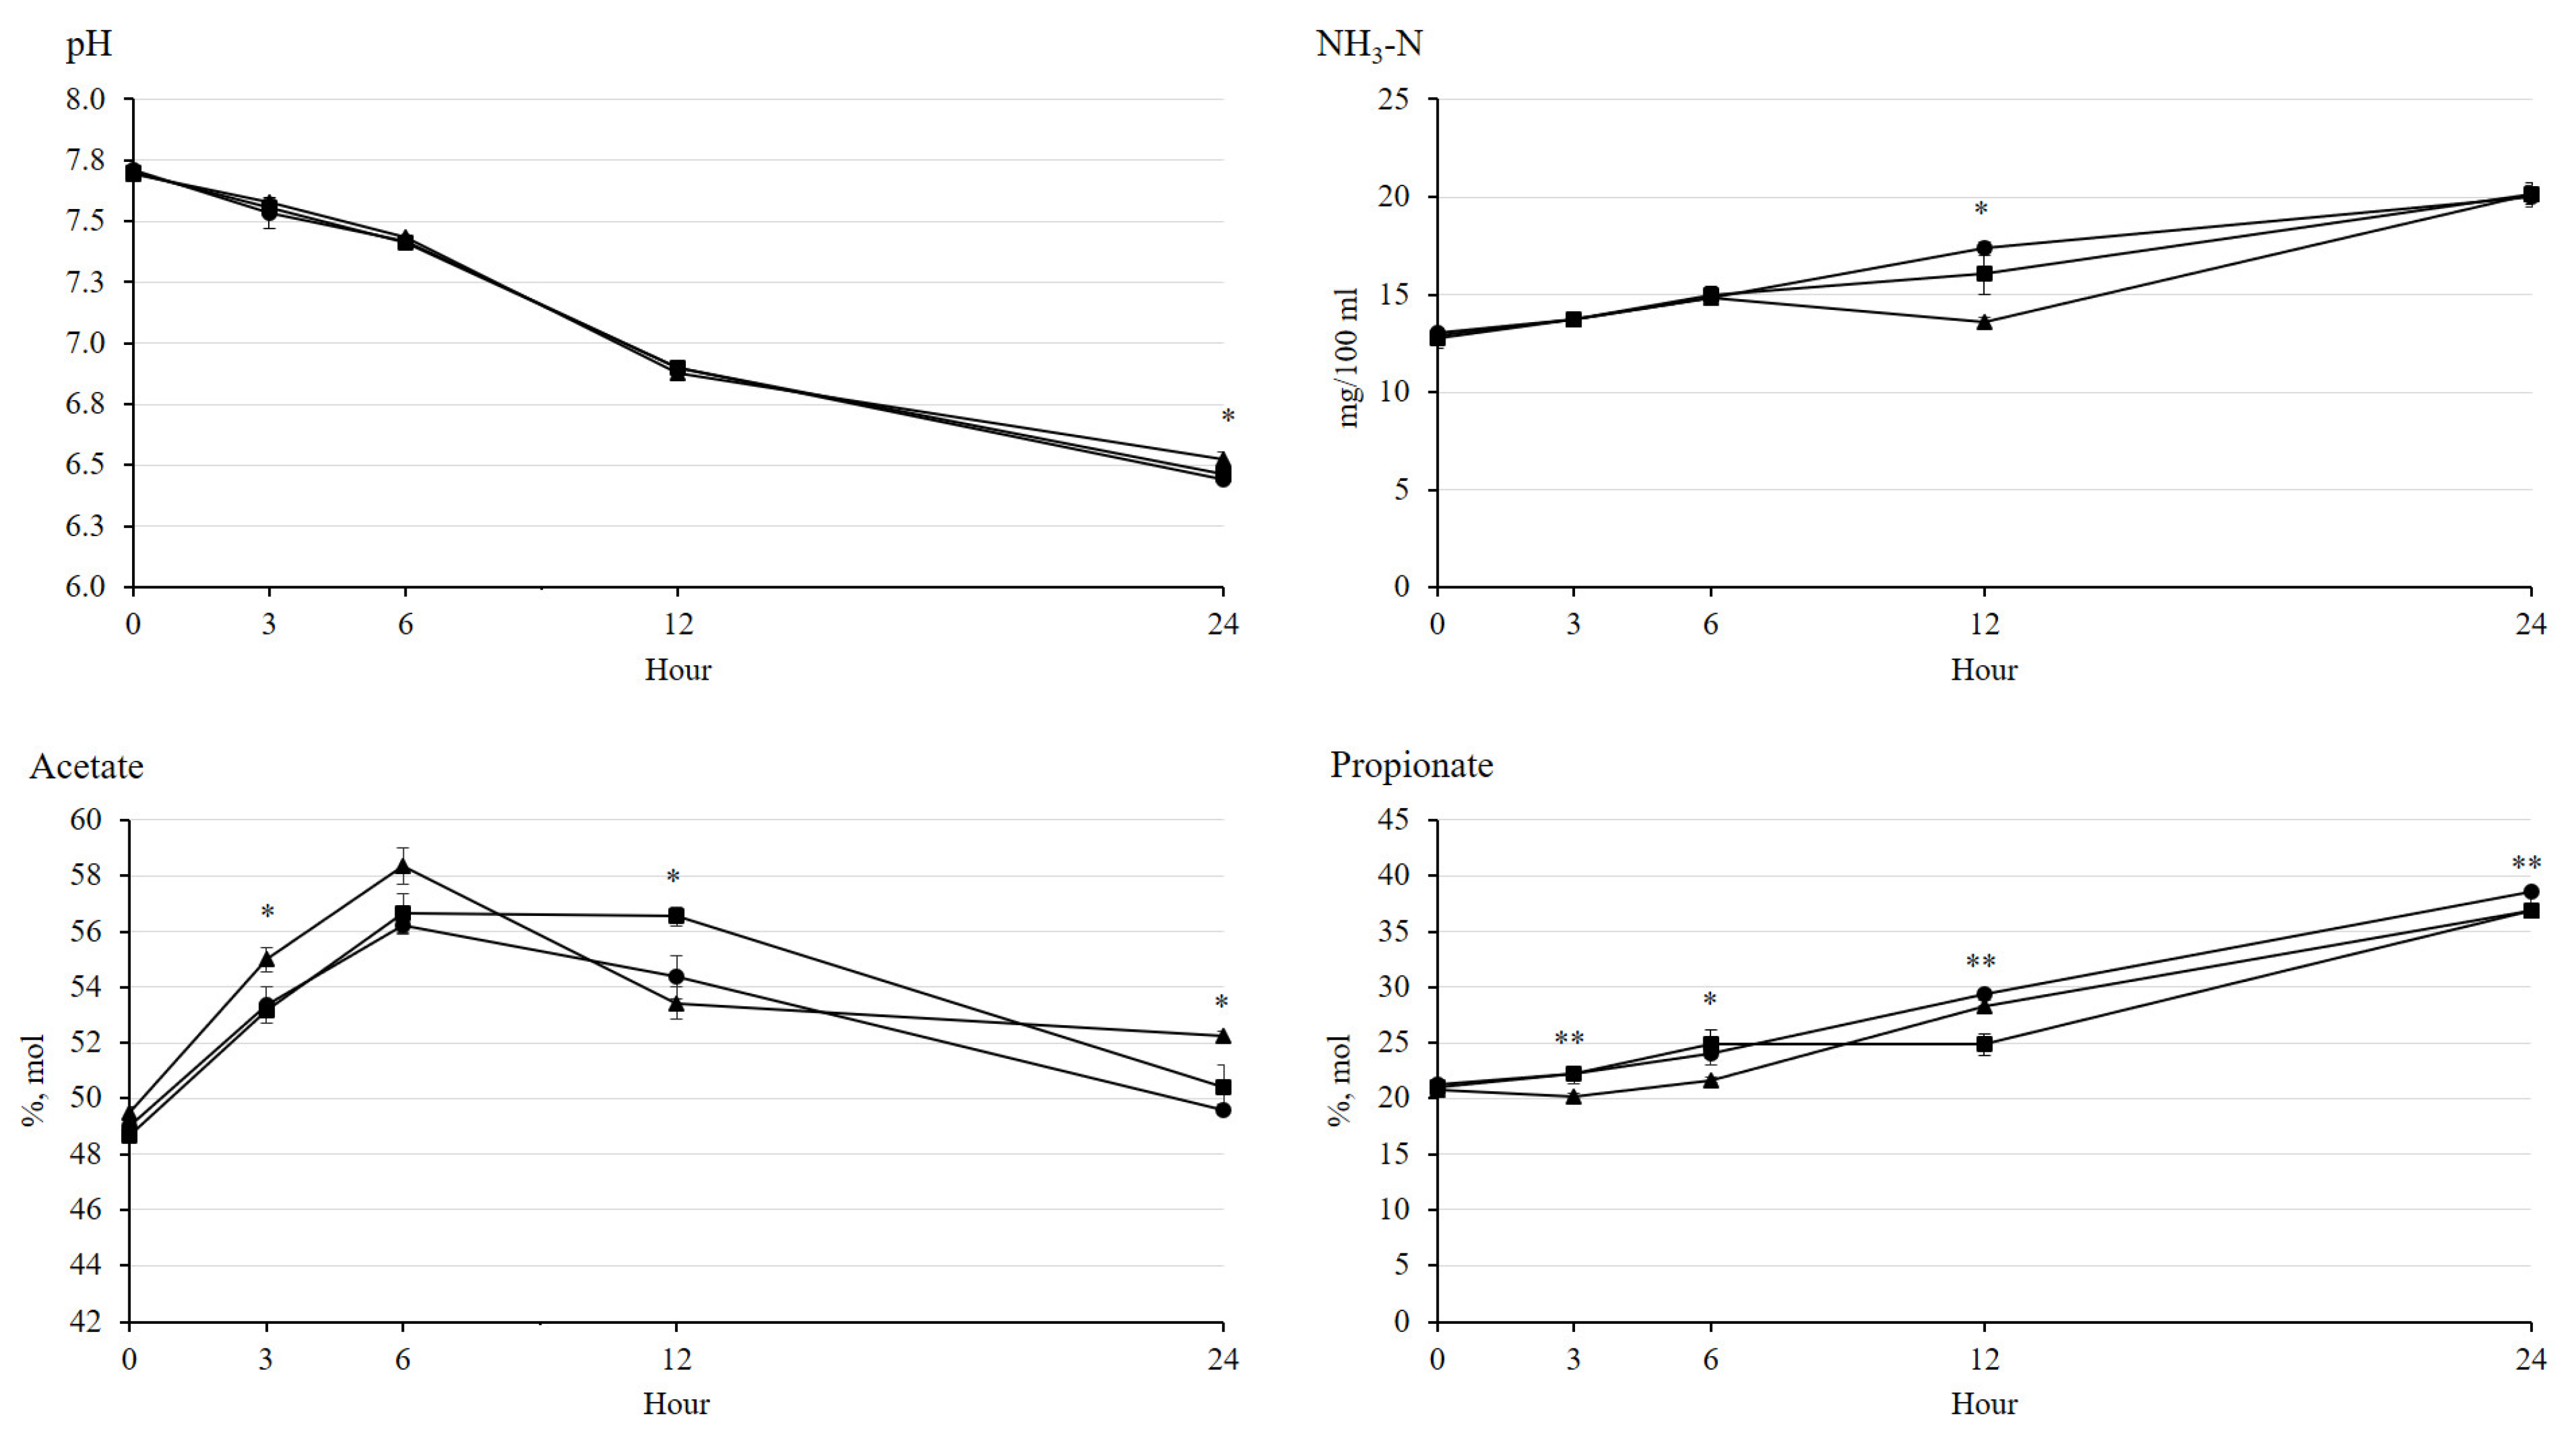
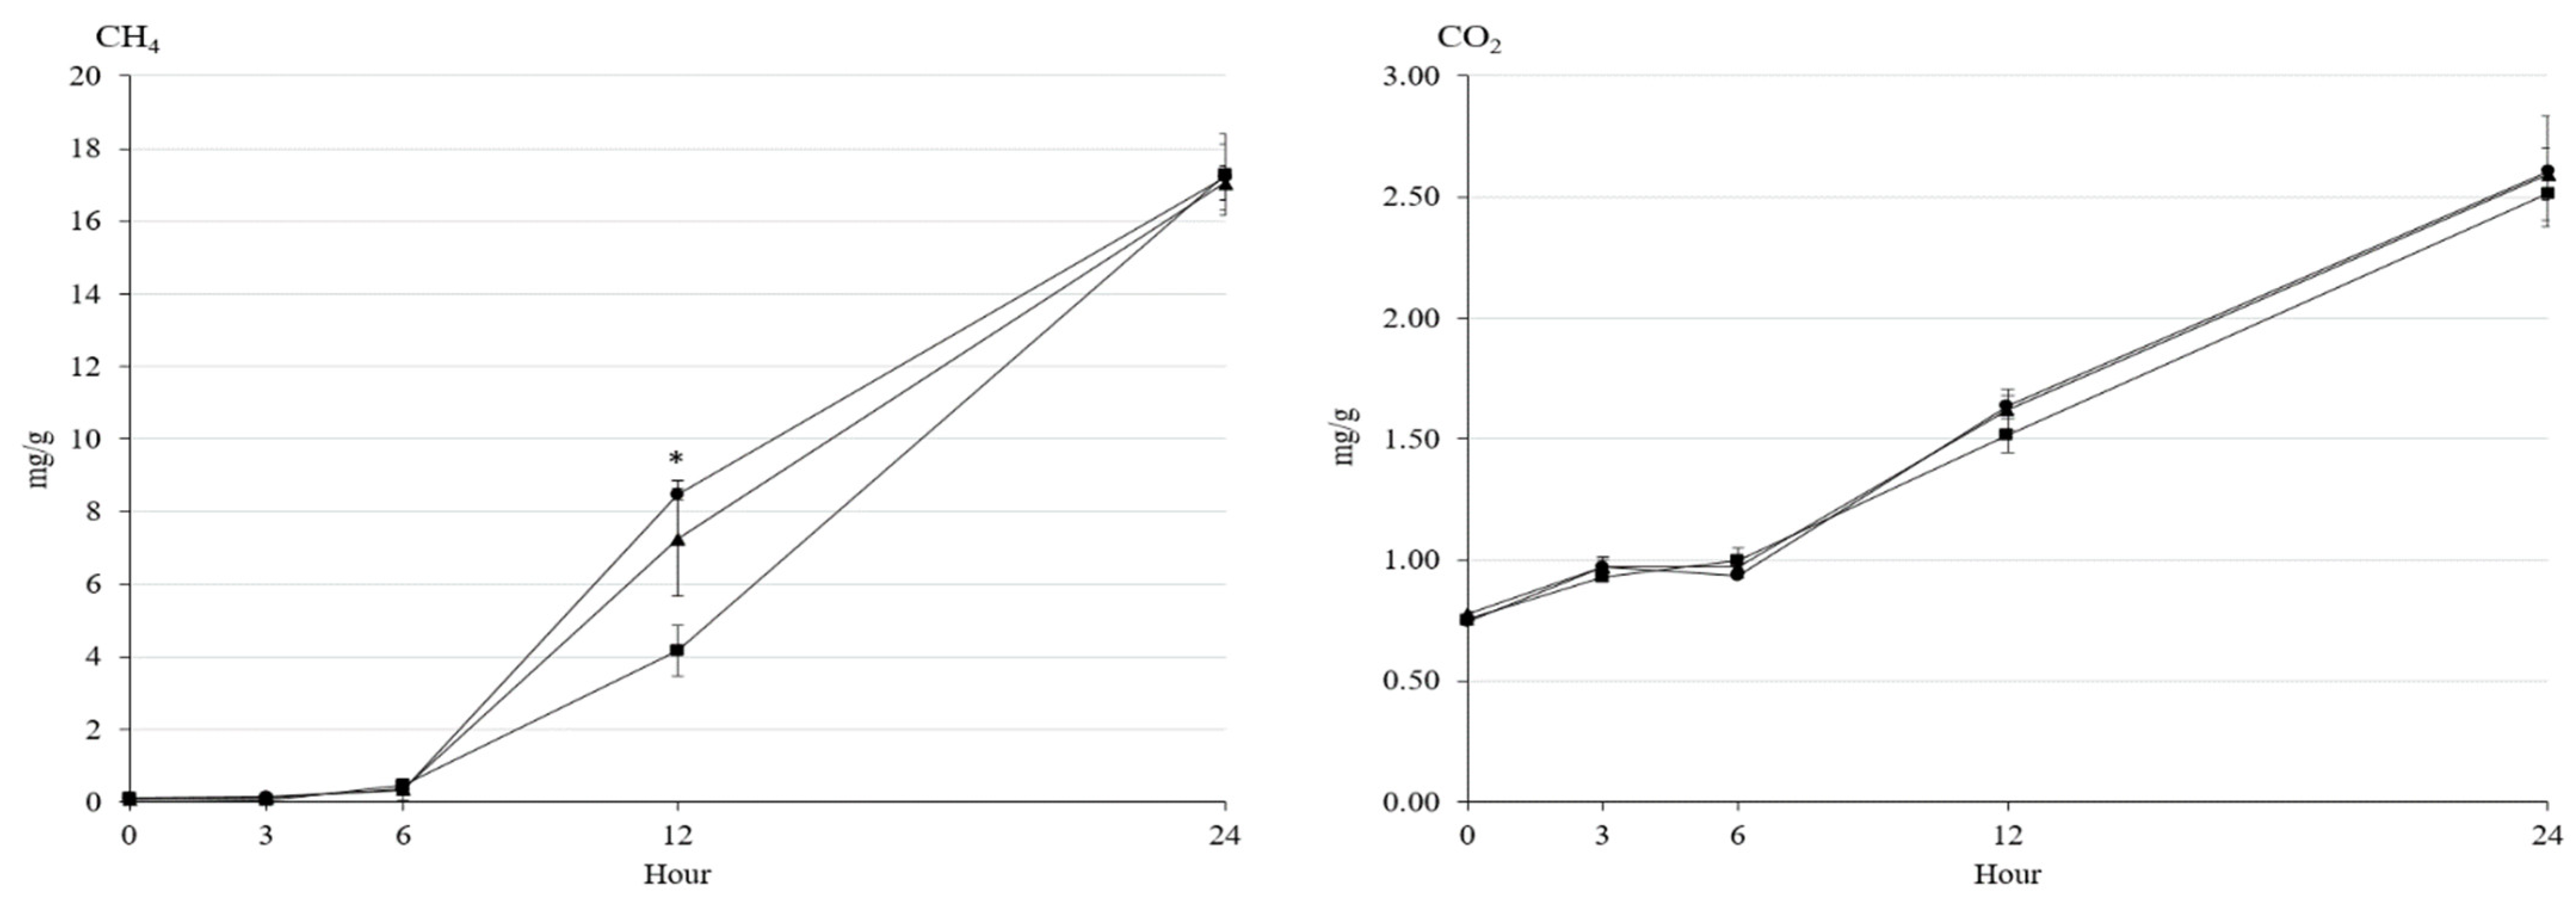
3.2. Fermentation Characteristics and Greenhouse Gas Emission
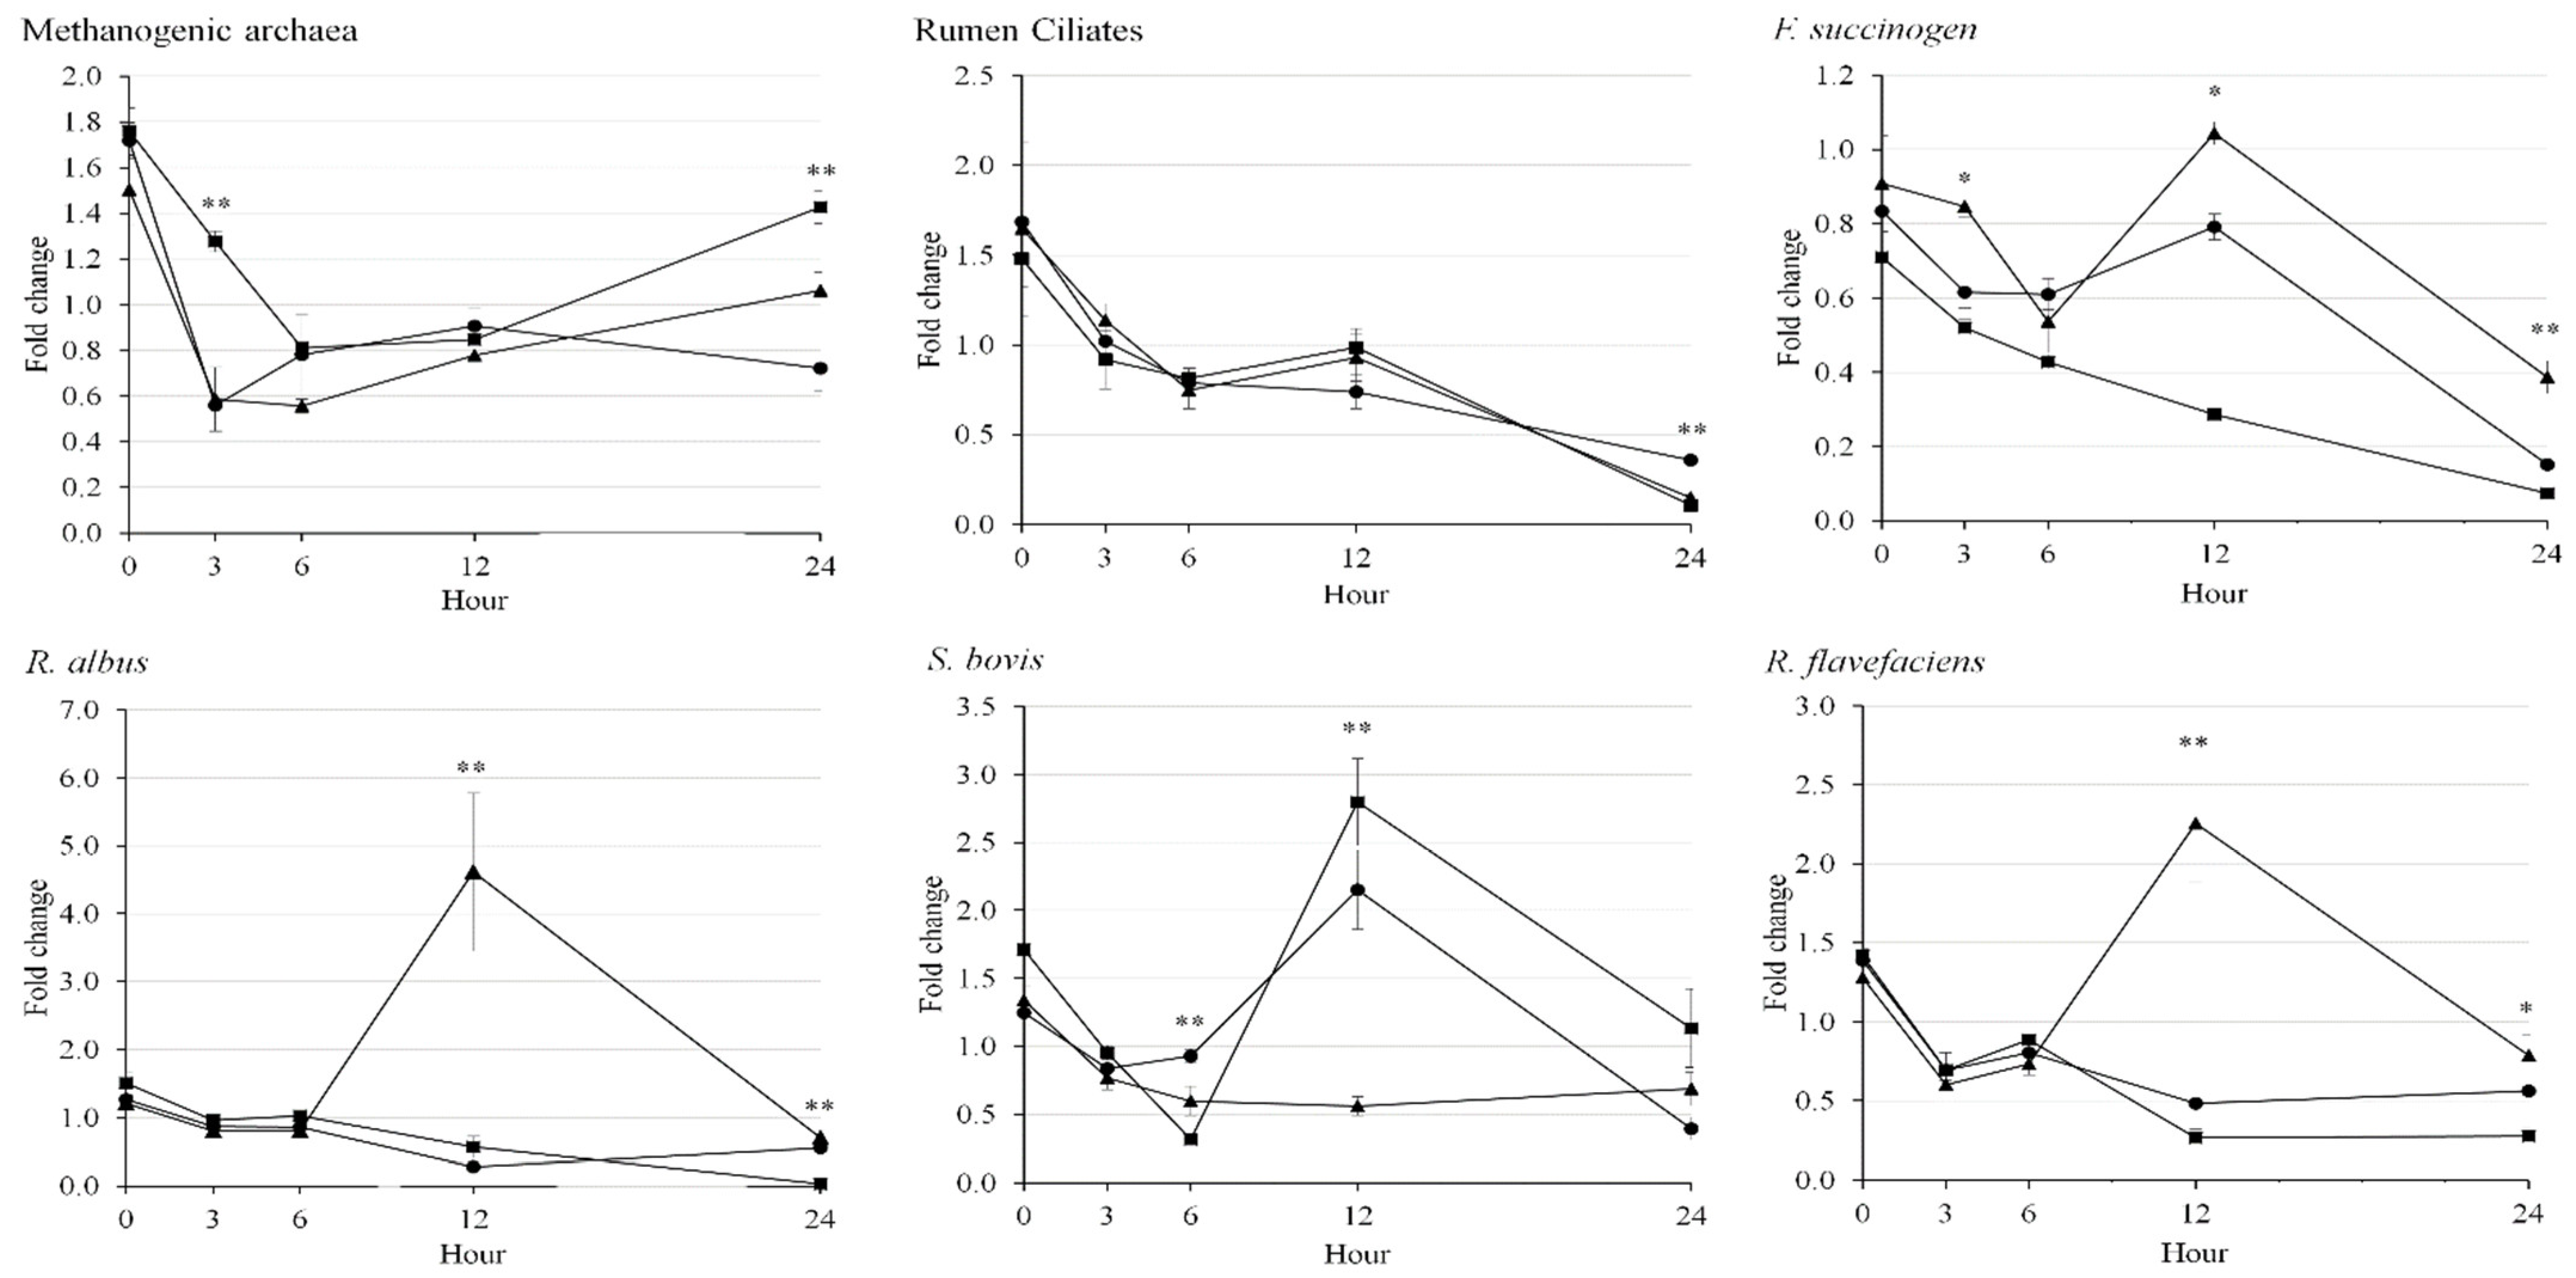
The Ca-salt had higher pH (p = 0.024) and acetate concentration (p = 0.013) than CO, while dietary LSO was not different compared to other treatments (Table 4). The Ca-salt and LSO had a higher propionate concentration (p = 0.007) than CO. Moreover, Ca-salt had a higher acetate to propionate ratio (p = 0.015) than CON. Total gas volume, and concentrations of NH3-N, total VFA, butyrate, CH4, and CO2 were not affected by the treatments.
The rumen pH decreased by an increase of incubation time without any effect by treatments (Figure 1). The NH3-N concentration increased by incubation time, and Ca-salt presented the lowest (p < 0.05) NH3-N concentration among the treatments at 12 h. The acetate concentration increased by 6 h, but then decreased by 24 h of incubation. The highest acetate concentration was shown in Ca-salt among the treatments at 3 h (p < 0.05) and in LSO at 12 h (p < 0.05) of incubation. The propionate concentration gradually increased with the increase in incubation time. At 3 and 6 h of incubation, the propionate concentration was higher (p < 0.01) either in CO or LSO than in Ca-salt, but higher (p < 0.01) either in CO or Ca-salt than in LSO at 12 h of incubation. There was an interaction between dietary treatment and incubation time (p < 0.001) on NH3-N, acetate, and propionate concentrations. In addition, concentrations of CH4 and CO2 gases gradually increased with incubation time (Figure 2). The LSO resulted in the lowest (p < 0.05) CH4 emission at 12 h of incubation among the treatments, while the emission of CO2 was not affected by dietary treatment during incubation.

3.3. Rumen Microbes

In the present study, methanogenic archaea were lower (p = 0.003) in CO and Ca-salt than in LSO (Table 5). Rumen ciliates were lower (p = 0.018) in LSO than in CO, but not different in Ca-salt compared to other treatments. On the other hand, Ca-salt had higher abundance of F. succinogens (p < 0.001) and R. flavefaciens (p = 0.005) than CO and LSO. The abundance of R. albus was highest with Ca-salt, followed by CO, and the lowest was in LSO (p < 0.001). The abundance of S. bovis was not affected by treatment in the present study. In general, all rumen microbes studied in the present study decreased with longer incubation (Figure 3). Abundance of methanogenic archaea was higher (p < 0.01) in dietary LSO than in CO and Ca-salt at 3 h and 24 h of incubations. Ca-salt had the highest (p < 0.05) abundance of F. succinogens at 3, 12, and 24 h, R. albus at 12 h, and R. flavefaciens at 12 h and 24 h among the treatments. The abundance of S. bovis in LSO was highest (p < 0.01) among the treatments at 12 h. The interaction effects between dietary treatment and incubation time (p < 0.05) were reported in the present study, which was founded in all rumen microbes, except rumen ciliates. The abundance of rumen ciliates was not affected by dietary treatments during 12 h of incubation.

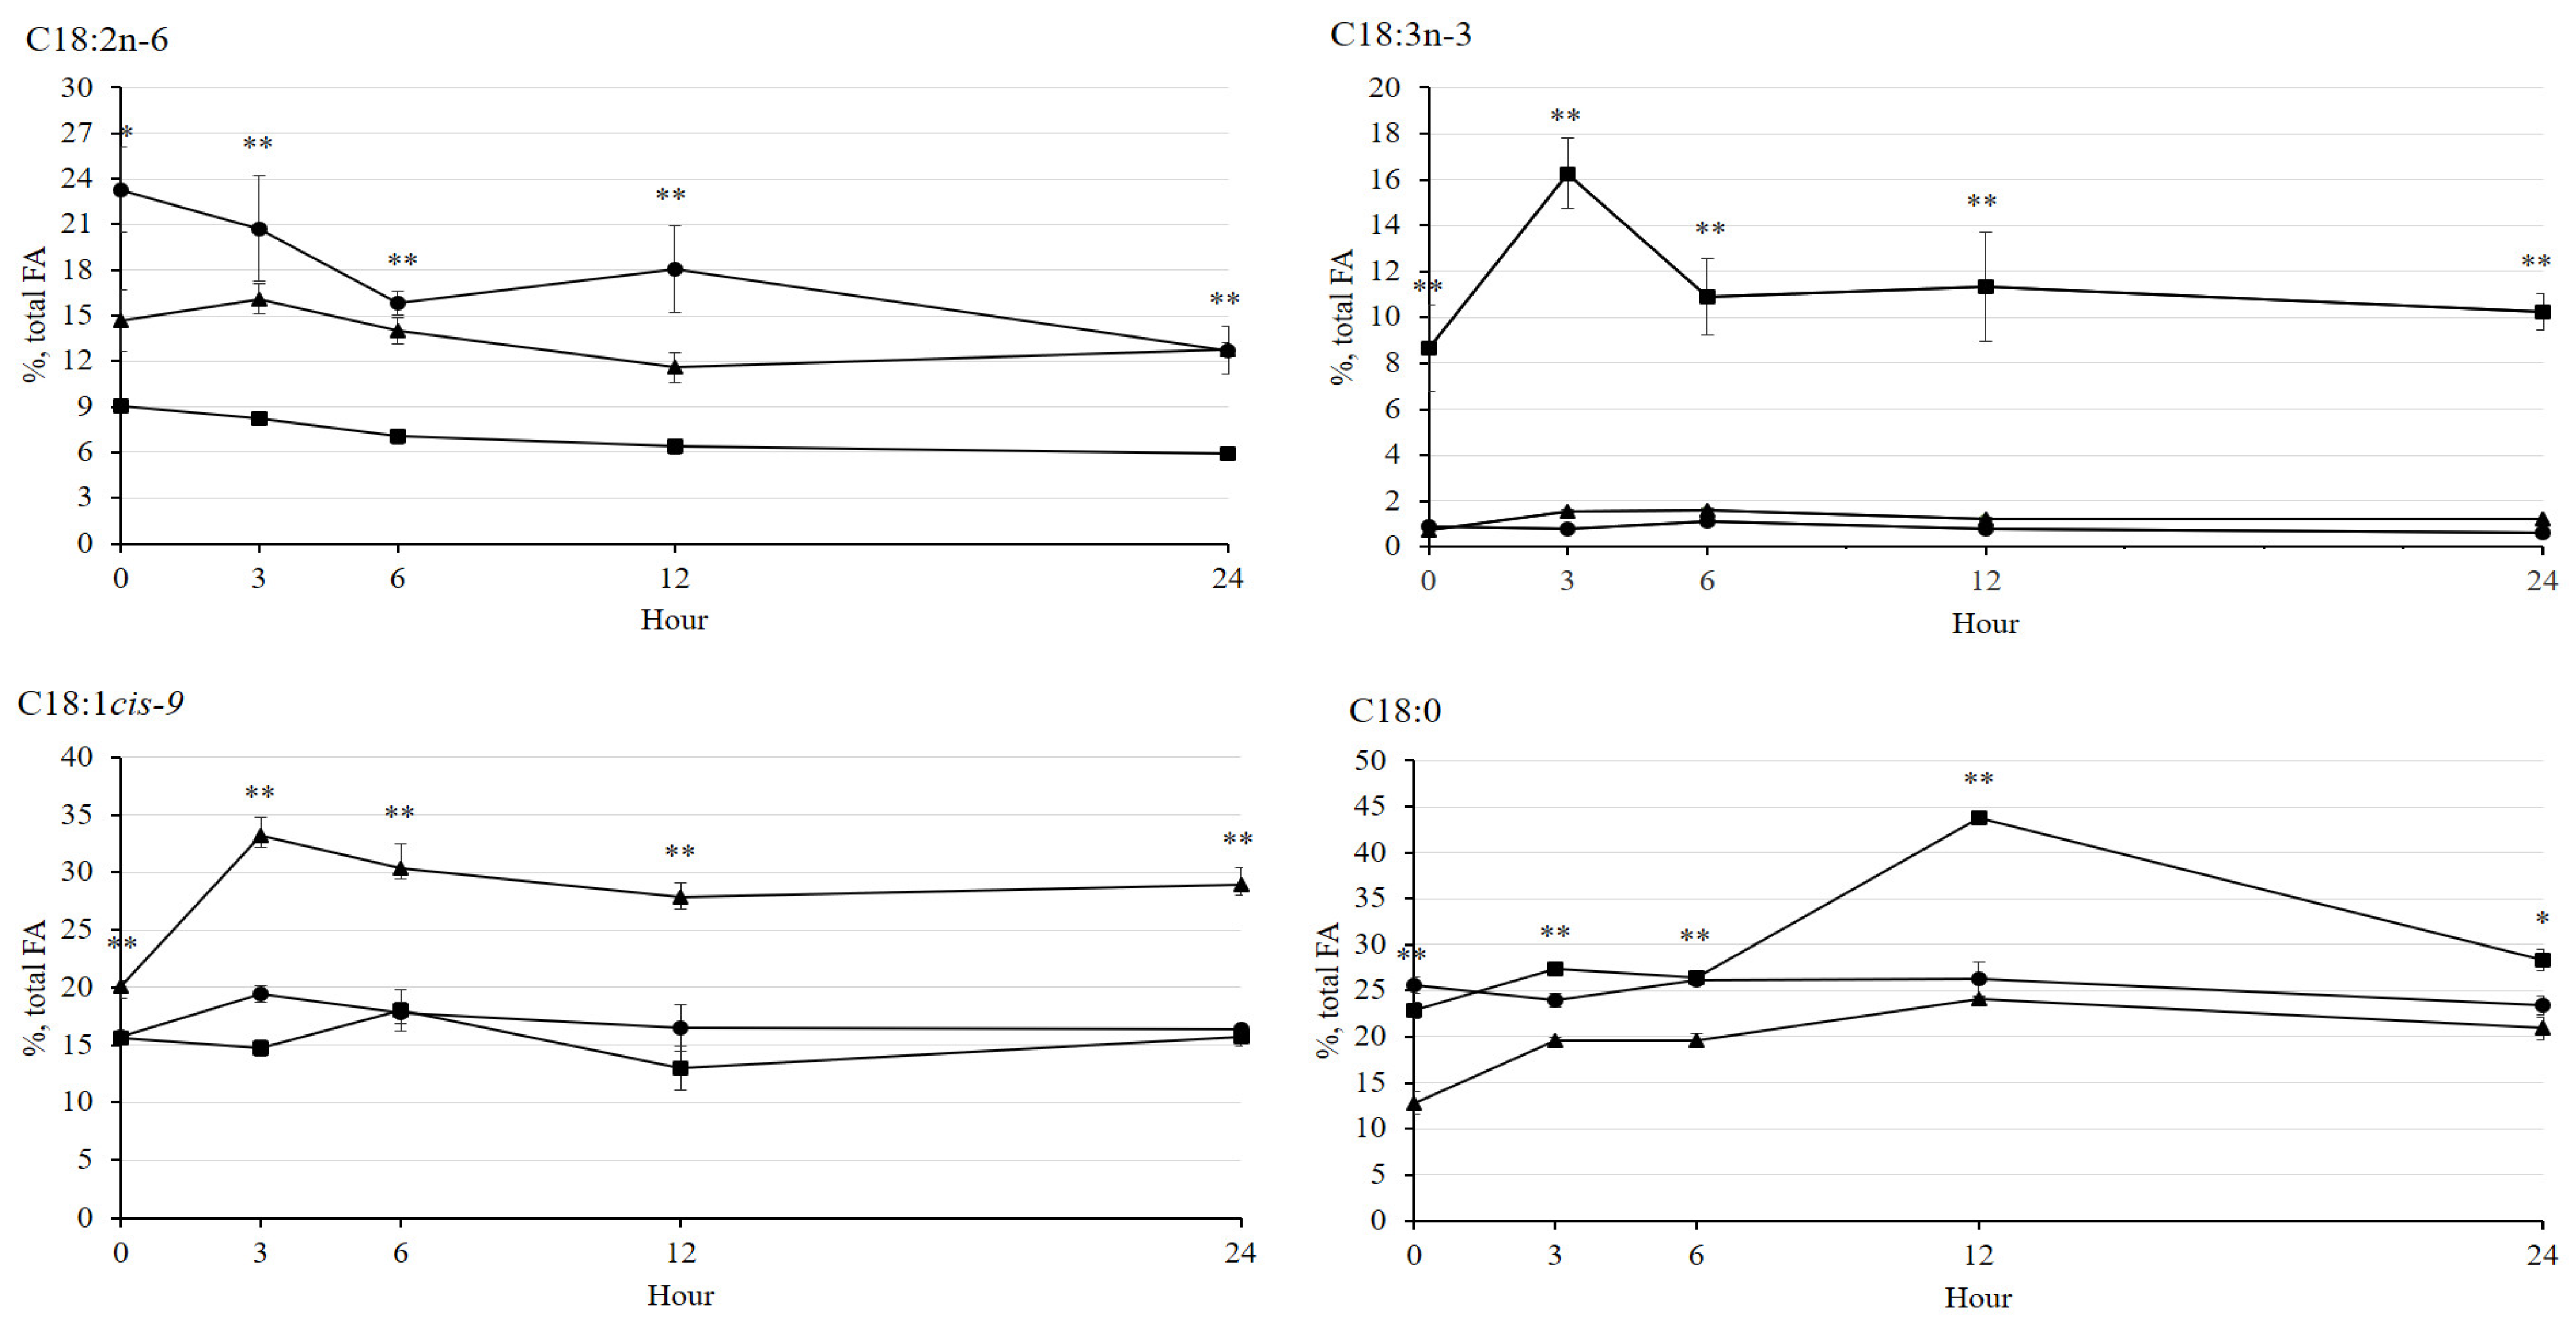
3.4. Fatty Acid Profiles after Incubation

After 24 h of ruminal incubation, total FA was not affected by treatment in the present study but had effects on concentrations of individual FAs (Table 6).
CO had higher concentrations of C14:0 (p = 0.007), C15:0 (p = 0.035), C16:0 (p = 0.005), and C16:1 (p = 0.003) than LSO and Ca-salt. LSO had the highest C18:0 concentration (p = 0.002), followed by CO, and then by Ca-salt. Ca-salt had higher C18:1cis-9 concentration (p < 0.004) than CO and LSO. The C18:2n-6 concentration (p = 0.002) was higher in CO and Ca-salt than LSO. The C18:3n-3 concentration (p < 0.001) was highest in LSO, followed by Ca-salt, and then by CO. The concentrations of C20:0 (p = 0.020) were higher in LSO than in Ca-salt, while CO was not different from other treatments. The SFA concentration (p = 0.008) was higher in CON and LSO than in Ca-salt, but the MUFA concentration (p < 0.004) was higher in Ca-salt than in CO and LSO. The concentration of PUFA was higher (p = 0.048) in LSO and Ca-salt than in CO in the present study. The SFA to PUFA ratio was higher in CO than in LSO and Ca-salt (p = 0.016), while the n-6 to n-3 FA ratio was higher in CO and Ca-salt than in LSO (p < 0.001).
In the present study, it was observed that the higher (p < 0.05) concentration of C18:2n-6 was either in CO or Ca-salt rather than in LSO during incubation (Figure 4). On the other hand, the C18:3n-3 concentration in LSO was highest (p < 0.01) among the treatments in all incubation time periods, while Ca-salt showed the highest (p < 0.01) concentration of C18:1cis-9. In general, LSO showed the highest (p < 0.01) C18:0 concentration among the treatments throughout the incubation, especially at 3, 12, and 24 h of incubation. These results could be influenced by interaction effects between dietary treatment and incubation time (p < 0.05) in the present study, which were reported in all major 18-carbon fatty acids, except C18:2n-6.

4. Discussion

4.1. Rumen Fermentation Characteristics, Microbial Population, and Methanogenesis

The rumen pH gradually decreased with dietary FA with the advancement of time during ruminal incubation in the present study, but it still remained in a normal range [37]. Another study also observed that dietary linoleic and linolenic acids presented rumen pH within the range of 6.46 to 6.56 after 24 h of incubation [10], which was similar to the present study. On the other hand, CO showed the lowest acetate concentration, but the highest propionate concentration after 24 h of incubation in the present study, which might be caused by a lower population of methanogenesis archaea than other treatments. Decreased methanogens in the rumen usually shift hydrogen utilization from methanogenesis towards propionate synthesis [9,10]. Moreover, dietary C18:2n-6 reduced the methanogenic archaea during incubation [9,10]. Similar to our previous study [10], the present study reported that C18:3n-3 in LSO inhibits the CH4 emission more effectively than the other dietary treatments, especially at 12 h of incubation.
Unlike our previous study, rumen ciliates decreased significantly with LSO as the C18:3n-3 source compared to CO and Ca-salt as the C18:2n-6 sources in the present study. Usually, the ciliate population in rumen decreased with fat supplementation, even though effects may have varied [14]. In agreement with the present study, linseed oil was reported to have more negative effects on ciliates (protozoa) than other sources of lipids [38]. Doreau and Ferlay [14] suggested that C18:3n-3 content of linseed might be responsible for negative effects on ciliates. A marked reduction in rumen ciliates (protozoa) with the increasing level of stearic (C18:0) and oleic acid (C18:1cis-9) was reported earlier [10]. In the present study, together with linolenic acid (C18:3n-3), stearic acid concentrations were also highest in LSO at 24 h of incubation. Therefore, these two FAs together might affect the rumen ciliate concentration in LSO.
In the present study, the negative effects of FA on the growth of most fibrolytic bacteria examined were lower in Ca-salt compared to CO and LSO. It is well recognized that calcium salts of FAs affect rumen fermentation to a lesser extent [39,40]. These salts are dissociated slowly in rumen [20] and hence produce lower toxicity to microbes compared to unprotected oil sources. The negative effects of FA on bacterial growth depend on their adsorption on the substrate cell wall [20]. Adsorption of FA decreases when the concentration of divalent cations is high [41] and its effect seems more dominant for Ca2+ than others cations [42]. On the other hand, ionized Ca enhances the adhesion of bacteria to cellulose [43]. Application of LSO has shown greater toxicity to rumen ciliates as well as fibrolytic bacteria (except S. bovis) compared to CO. It was shown in a previous study that C18:3n-3 was comparatively more lethal to microbes, especially fibrolytic bacteria compared to C18:2n-6 [9,10]. The result of the present study regarding fibrolytic rumen bacteria is therefore in agreement with previous studies.

4.2. Rumen Fatty Acid and Profiles

After 24 h of incubation, along with C18:2n-6 and C18:3n-3, most other FAs were also found to be affected by dietary treatments in the present study. Honkanen et al. [25] and Amanullah et al. [10] had similar results, and reported that the results might be caused by a different rate of lipolysis and/or biohydrogenation among the treatments. The lowest total SFA, especially C18:0 along with the highest C18:1cis-9, and total MUFA in dietary Ca-salt indicated a lower degree of biohydrogenation with this treatment [12].
In the process of biohydrogenation of C18:2 and C18:3, different cis- and/or trans-isomers of C18:1 intermediates are produced, and then converted into C18:0 as the end product [12,25]. In the present study, a Ca-salt diet had the lowest C18:0 concentration, but highest total C18:1cis-9 concentration from 0 to 24 h of incubation. The C18:1 cis-9 concentration was increased rapidly at 3 h, which resulted from biohydrogenation mainly of C18:2n-6 and the higher level continued till the end. Results indicated calcium salts of FA can resist biohydrogenation of UFA by rumen microbes to some extent, as also reported by Wu et al. [13]. In particular, the release of free FA (lipolysis) in the rumen is markedly reduced when lipids are supplied in the form of calcium salts [44].
Higher n-6 to n-3 FA ratio in CO and Ca-salt than LSO at 24 h of incubation is an important indication for dietary supplementation strategy of n-6 and n-3 FAs in ruminants. For a long time, efforts have been made to incorporate these FAs or change their ratio in the products considering the health benefits of consumers. However, extensive biohydrogenation of those FAs acts as a bottleneck concerning the use of dietary supplementation strategies. The increased concentrations of n-6 and n-3 FA in the bottle content of respective treatments after 24 h of incubation suggest the potential incorporation of these FAs at a physiological level by dietary supplementation. By fitting data with single-pool, first-order kinetic models, Honkanen et al. [25] showed that the rate of linoleic acid disappearance decreased with increases in substrate availability.

5. Conclusions

Based on the present study with a high-energy diet for beef cattle, the supplementation of CO increased the molar proportion of propionate concentrations after 24 h of in vitro incubation compared to other FAs. Supplementation of CO and Ca-salt decreased methanogenic archaea, while supplementation of LSO decreased rumen ciliates efficiently. As a recommendation, the supplementation of Ca-salt was found to be less toxic to rumen fibrolytic bacteria and resistant against FA biohydrogenation indicated by lower total SFA, especially C18:0 along with the highest C18:1cis-9, and total MUFA compared to other treatments.

Author Contributions

Conceptualization, S.-C.K. and S.M.A.; Methodology, S.M.A., S.-S.L., Y.-H.J. and D.-H.K.; Software, S.M.A., D.H.V.P. and S.-M.J.; Validation, S.M.A., S.-S.L., Y.-H.J., D.-H.K. and S.-C.K.; Formal analysis, S.M.A., Y.-H.J. and S.-M.J.; Data curation, S.M.A., S.-S.L. and D.-H.K.; Writing—original draft preparation, S.M.A., S.-S.L. and D.H.V.P.; Writing—review and editing, S.-C.K. and P.-N.S.; Project administration, S.-C.K. and P.-N.S. All authors have read and agreed to the published version of the manuscript.

Funding

This research was supported (Project No. 321083-05-1-HD040) by IPET (Korea Institute of Planning and Evaluation for Technology in Food, Agriculture, Forestry and Fisheries), and Ministry of Agriculture, Food and Rural Affairs, Republic of Korea.

Institutional Review Board Statement

The animal care and procedure to maintain cannulated heifers was approved by animal ethical committee of Gyeongsang National University, Jinju, Korea (GNU-191011-E0050).

Informed Consent Statement

Not applicable.

Data Availability Statement

Data are available on request from the corresponding author with justifiable reason.

Conflicts of Interest

The authors declare no conflict of interest.

References

  1. Vahmani, P.; Mapiye, C.; Prieto, N.; Rolland, D.C.; McAllister, T.A.; Aalhus, J.L.; Dugan, M.E.R. The scope for manipulating the polyunsaturated fatty acid content of beef: A review. J. Anim. Sci. Biotechnol. 2015, 6, 29. [Google Scholar] [CrossRef] [PubMed] [Green Version]
  2. Lanier, J.S.; Cor, B.A. Challenges in enriching milk fat with polyunsaturated fatty acids. J. Anim. Sci. Biotechnol. 2015, 6, 26. [Google Scholar] [CrossRef] [PubMed] [Green Version]
  3. Beauchemin, K.A.; Kreuzer, M.; O’Mara, F.; McAllister, T.A. Nutritional management for enteric methane abatement: A review. Aust. J. Exp. Agric. 2008, 48, 21–27. [Google Scholar] [CrossRef]
  4. Patra, A.; Park, A.; Kim, M.; Yu, Z. Rumen methanogens and mitigation of methane emission by anti-methanogenic compounds and substance. J. Anim. Sci. Biotechnol. 2017, 8, 13. [Google Scholar] [CrossRef] [PubMed] [Green Version]
  5. Bayat, A.R.; Ventto, L.; Kairenius, P.; Stefański, T.; Leskinen, H.; Tapio, I.; Negussie, E.; Vilkki, J.; Shingfield, K.J. Dietary forage to concentrate ratio and sunflower oil supplement alter rumen fermentation, ruminal methane emission, and nutrient utilization in lactating cows. Transl. Anim. Sci. 2017, 1, 277–286. [Google Scholar] [CrossRef] [PubMed] [Green Version]
  6. Vargas, J.E.; Andrés, S.; López-Ferreras, L.; Snelling, T.J.; Yánez-Ruíz, D.R.; Garcia-Estrada, G.; López, S. Dietary supplemental plant oils reduce methanogenesis from anaerobic microbial fermentation in the rumen. Sci. Rep. 2020, 10, 1613. [Google Scholar] [CrossRef] [Green Version]
  7. Beauchemin, K.A.; McGinn, S.M. Methane emissions from beef cattle: Effects of fumaric acid, essential oil, and canola oil. J. Anim. Sci. 2006, 84, 1489–1496. [Google Scholar] [CrossRef]
  8. Palmquist, D.L.; Jenkins, T.C. Fat in lactation rations for dairy: A review. J. Dairy Sci. 1980, 63, 1–14. [Google Scholar] [CrossRef]
  9. Zhang, C.M.; Guo, Y.Q.; Yuan, Z.P.; Wu, Y.M.; Wang, J.K.; Liu, J.X.; Zhu, W.Y. Effect of octadeca carbon fatty acids on microbial fermentation, methanogenesis and microbial flora in vitro. Anim. Feed Sci. Technol. 2008, 146, 259–269. [Google Scholar] [CrossRef]
  10. Amanullah, S.M.; Kim, D.H.; Paradhipta, D.H.V.; Lee, H.J.; Joo, Y.H.; Lee, S.S.; Kim, E.T.; Kim, S.C. Effects of essential fatty acid supplementation on in vitro fermentation indices, greenhouse gas, microbes, and fatty acid profiles in the rumen. Front. Microbiol. 2021, 12, 401. [Google Scholar] [CrossRef]
  11. Duarte, A.C.; Durmic, Z.; Vercoe, P.E.; Chaves, A.V. Dose-response effects of dietary pequi oil on fermentation characteristics and microbial population using a rumen simulation technique (Rusitec). Anaerobe 2017, 28, 59–65. [Google Scholar] [CrossRef] [PubMed]
  12. Bauman, D.E.; Baumgard, L.H.; Corl, B.A.; Griinari, J.M. Biosynthesis of conjugated linoleic acid in ruminants. J. Anim. Sci. 2000, 77, 1–15. [Google Scholar] [CrossRef]
  13. Wu, Z.; OhajuruLa, O.A.; Palmquist, D.L. Ruminal synthesis, biohydrogenation, and digestibility of fatty acids by dairy cows. J. Dairy Sci. 1991, 74, 3025–3034. [Google Scholar] [CrossRef]
  14. Doreau, M.; Ferlay, A. Effects of dietary lipids on nitrogen metabolism in the rumen: A review. Livest. Prod. Sci. 1995, 43, 97–110. [Google Scholar] [CrossRef]
  15. Gillis, M.H.; Duckett, S.K.; Sackmann, J.R. Effects of supplemental rumen-protected conjugated linoleic acid or corn oil on fatty acid composition of adipose tissues in beef cattle. J. Anim. Sci. 2004, 82, 1419–1427. [Google Scholar] [CrossRef] [PubMed] [Green Version]
  16. Radcliffe, J.D.; Czajka-Narins, D.M.; Imrhan, V. Fatty acid composition of serum, adipose tissue, and liver in rats fed diets containing corn oil or cottonseed oil. Plant Foods Hum. Nutr. 2004, 59, 73–77. [Google Scholar] [CrossRef] [PubMed]
  17. Suksombat, W.; Thanh, L.P.; Meeprom, C.; Mirattanaphrai, R. Effect of linseed oil supplementation on performance and milk fatty acid composition in dairy cows. Anim. Sci. J. 2016, 87, 1545–1553. [Google Scholar] [CrossRef] [PubMed]
  18. Hassanat, F.; Benchaar, C. Corn silage-based diet supplemented with increasing amounts of linseed oil: Effects on methane production, rumen fermentation, nutrient digestibility, nitrogen utilization, and milk production of dairy cows. J. Dairy Sci. 2021, 104, 5375–5390. [Google Scholar] [CrossRef]
  19. Gadeyne, F.; De Neve, N.; Vlaeminck, B.; Fievez, V. State of the art in rumen lipid protection technologies and emerging interfacial protein cross-linking methods. Eur. J. Lipid Sci. Technol. 2017, 119, 1600345. [Google Scholar] [CrossRef]
  20. Sukhija, P.S.; Palmquist, D.L. Dissociation of calcium soaps of long-chain fatty acids in rumen fluid. J. Dairy Sci. 1990, 73, 1784–1787. [Google Scholar] [CrossRef]
  21. Adesogan, A.T.; Krueger, N.K.; Kim, S.C. A novel, wireless, automated system for measuring fermentation gas production kinetics of feeds and its application to feed characterization. Anim. Feed Sci. Technol. 2005, 123–124, 211–223. [Google Scholar] [CrossRef]
  22. Lee, S.S.; Kim, D.H.; Paradhipta, D.H.V.; Lee, H.J.; Yoon, H.; Joo, Y.H.; Adesogan, A.T.; Kim, S.C. Effects of wormwood (Artemisia montana) essential oil on digestibility, fermentation indices, and microbial diversity in the rumen. Microorganisms 2020, 8, 1605. [Google Scholar] [CrossRef] [PubMed]
  23. Paradhipta, D.H.V.; Joo, Y.H.; Lee, H.J.; Lee, S.S.; Kwak, Y.G.; Han, O.K.; Kim, D.H.; Kim, S.C. Effects of wild and mutated inoculants on rye silage and its rumen fermentation indices. Asian-Australas. J. Anim. Sci. 2020, 33, 949–956. [Google Scholar] [CrossRef] [PubMed] [Green Version]
  24. Carriquiry, M.; Weber, W.J.; Baumgard, L.H.; Crooker, B.A. In vitro biohydrogenation of four dietary fats. Anim. Feed Sci. Technol. 2008, 141, 339–355. [Google Scholar] [CrossRef]
  25. Honkanen, A.M.; Griinari, J.M.; Vanhatalo, A.; Ahvenjärvi, S.; Toivonen, V.; Shingfield, K.J. Characterization of the disappearance and formation of biohydrogenation intermediates during incubations of linoleic acid with rumen fluid in vitro. J. Dairy Sci. 2012, 95, 1376–1394. [Google Scholar] [CrossRef] [Green Version]
  26. Mauricio, R.M.; Mould, F.L.; Dhanoa, M.S.; Owen, E.; Channa, K.S.; Theodorou, M.K. A semi-automated in vitro gas production technique for ruminant feedstuff evaluation. Anim. Feed Sci. Technol. 1999, 79, 321–330. [Google Scholar] [CrossRef]
  27. Chaney, A.L.; Marbach, E.P. Modified reagents for determination of urea and ammonia. Clin. Chem. 1962, 8, 130–132. [Google Scholar] [CrossRef]
  28. Muck, R.E.; Dickerson, J.T. Storage temperature effects on proteolysis in alfalfa silage. Trans. ASAE 1988, 31, 1005–1009. [Google Scholar] [CrossRef]
  29. Jenkins, T.C.; Thies, E.J.; Mosley, E.E. Direct methylation procedure for converting fatty amides to fatty acid methyl ester in feed and digesta samples. J. Agric. Food Chem. 2001, 49, 2142–2145. [Google Scholar] [CrossRef]
  30. Kim, E.T.; Kim, C.H.; Min, K.S.; Lee, S.S. Effects of plant extracts on microbial population, methane emission and ruminal fermentation characteristics in in vitro. Asian-Aust. J. Anim. Sci. 2012, 25, 806–811. [Google Scholar] [CrossRef]
  31. Denman, S.E.; McSweeney, C.S. Development of a real-time PCR assay for monitoring anaerobic fungal and cellulolytic bacterial populations within the rumen. FEMS Microbiol. Ecol. 2006, 58, 572–582. [Google Scholar] [CrossRef] [PubMed]
  32. Koike, S.; Kobayashi, Y. Development and use of competitive PCR assays for the rumen cellulolytic bacteria: Fibrobacter succinogens, Ruminococcus albus and Ruminococcus falvefaciens. FEMS Microbiol. Lett. 2001, 204, 361–366. [Google Scholar] [CrossRef] [PubMed]
  33. Tajima, K.; Aminov, R.I.; Nagamine, T.; Matsui, H.; Nakamura, M.; Benno, Y. Diet-dependent shifts in the bacterial population of the rumen revealed with Real-Time PCR. Appl. Environ. Microb. 2001, 67, 2766–2774. [Google Scholar] [CrossRef] [PubMed] [Green Version]
  34. Denman, S.E.; Tomkins, N.W.; McSweeney, C.S. Quantitation and diversity analysis of ruminal methanogenic populations in response to the antimethanogenic compound bromochloromethane. FEMS Microbiol. Ecol. 2007, 62, 313–322. [Google Scholar] [CrossRef] [Green Version]
  35. Skillman, L.C.; Toovey, A.F.; Williams, A.J.; Wright, A.G. Development and validation of a Real-Time PCR method to quantify rumen protozoa and examination of variability between Endodinium populations in sheep offered a hay-based diet. Appl. Environ. Microb. 2006, 72, 200–206. [Google Scholar] [CrossRef] [Green Version]
  36. SAS User’s Guide, 8th ed.; SAS Inst., Inc.: Cary, NC, USA, 2002.
  37. Mao, S.Y.; Zhang, R.Y.; Wang, D.S.; Zhu, W.Y. Impact of subacute ruminal acidosis (SARA) adaptation on rumen microbiota in dairy cattle using pyrosequencing. Anaerobe 2013, 24, 12–19. [Google Scholar] [CrossRef]
  38. Sutton, J.D.; Knight, R.; McAllan, A.B.; Smith, R.H. Digestion and synthesis in the rumen of sheep given diets supplemented with free and protected oils. Br. J. Nutr. 1983, 49, 419–432. [Google Scholar] [CrossRef]
  39. Castañeda-Gutiérrez, E.; De Veth, M.J.; Lock, A.L.; Dwyer, D.A.; Murphy, K.D.; Bauman, D.E. Effect of supplementation with calcium salts of fish oil on n−3 fatty acids in milk fat. J. Dairy Sci. 2007, 90, 4149–4156. [Google Scholar] [CrossRef] [Green Version]
  40. Ferlay, A.; Legay, F.; Bauchart, D.; Poncet, C.; Doreau, M. Effect of a supply of raw or extruded rapeseeds on digestion in dairy cows. J. Anim. Sci. 1992, 70, 915–923. [Google Scholar] [CrossRef]
  41. Galbraith, H.; Miller, T.B.; Paton, A.M.; Thompson, J.K. Antibacterial activity of long-chain fatty acids and the reversal with calcium, magnesium, ergocalciferol and cholesterol. J. Appl. Bacteriol. 1971, 34, 803–813. [Google Scholar] [CrossRef]
  42. El-Hag, G.A.; Miller, T.B. Evaluation of whisky distillery by-products. VI. The reduction in digestibility of malt distiller’s grains by fatty acids and the interaction with calcium and other reversal agents. J. Sci. Food Agric. 1972, 23, 247–258. [Google Scholar] [CrossRef] [PubMed]
  43. Roger, V.; Fonty, G.; Komisarczuk-Bony, S.; Gouet, P. Effects of physicochemical factors on the adhesion to cellulose Avicel of the ruminal bacteria Ruminococcus flavefaciens and Fibrobacter succinogenes subsp. Succinogenes. Appl. Environ. Microbiol. 1990, 56, 3081–3087. [Google Scholar] [CrossRef] [PubMed] [Green Version]
  44. Moate, P.J.; Chalupa, W.; Jenkins, T.C.; Boston, R.C. A model to describe ruminalmetabolism and intestinal absorption of long chain fatty acids. Anim. Feed Sci. Technol. 2004, 112, 79–105. [Google Scholar] [CrossRef]
Figure 1. Changes in rumen pH and concentrations of NH3-N, acetate, and propionate during rumen incubation with oil sources containing essential fatty acid for 24 h. Diet with corn oil, C18:2n-6 (●); diet with linseed oil, C18:3n-3 (■); and diet with Ca-salt, protected C18:2n-6 (▲). The respective significance levels of dietary treatment, incubation time, dietary treatment × incubation time, and SEM for pH, NH3-N, acetate, and propionate are p < 0.001, p = 0.310, p = 0.376, and SEM=0.048; p < 0.001, p = 0.011, p < 0.001, and SEM = 0.864; p < 0.001, p = 0.002, p < 0.001, and SEM = 0.982; and p < 0.001, p < 0.001, p <0.001, and SEM = 1.007. Different symbols at the same time differ (*, p < 0.05; **, p < 0.01).
Fermentation 08 00242 g001
Figure 2. Changes in concentrations of CH4 and CO2 during rumen incubation with oil sources containing essential fatty acid for 24 h of incubation. Diet with corn oil, C18:2n-6 (●); diet with linseed oil, C18:3n-3 (■); and diet with Ca-salt, protected C18:2n-6 (▲). The respective significance levels of dietary treatment, incubation time, dietary treatment × incubation time, and SEM for CH4 and CO2 are p < 0.001, p = 0.272, p = 0.052, and SEM = 1.120; and p < 0.001, p = 0.616, p = 0.930, and SEM = 128.76. Different symbols at the same time differ (*, p < 0.05).
Fermentation 08 00242 g002
Figure 3. Fold changes in rumen microbes compared to that during rumen incubation with oil sources containing essential fatty acid for 24 h of incubation. Diet with corn oil, C18:2n-6 (●); diet with linseed oil, C18:3n-3 (■); and diet with Ca-salt, protected C18:2n-6 (▲). The respective significance levels of dietary treatment, incubation time, dietary treatment × incubation time, and SEM for Methanogenic archaea, rumen ciliates, F. succionogens, R. albus, S. bovis, and R. flavefaciens are p < 0.001, p < 0.001, p < 0.001, and SEM = 0.157; p < 0.001, p = 0.803, p = 0.838, and SEM = 0.283; p < 0.001, p < 0.001, p = 0.014, and SEM = 0.138; p < 0.001, p < 0.001, p < 0.001, and SEM = 0.336; p < 0.001, p < 0.001, p < 0.001, and SEM = 0.263; and p < 0.001, p < 0.001, p < 0.001, and SEM = 0.198. Different symbol at the same time differ (*, p < 0.05; **, p < 0.01).
Fermentation 08 00242 g003
Figure 4. Changes in major 18-carbon fatty acid concentrations (%, FA) during rumen incubation with oil sources containing essential fatty acid for 24 h of incubation. Diet with corn oil, C18:2n-6 (●); diet with linseed oil, C18:3n-3 (■); and diet with Ca-salt, protected C18:2n-6 (▲). The respective significance levels of dietary treatment, incubation time, dietary treatment × incubation time, and SEM for C18:2n-6, C18:3n-6, C18:1cis-9, and C18:0 FAs are p < 0.001, p < 0.001, p = 0.478, and SEM = 2.442; p < 0.001, p < 0.001, p < 0.001, and SEM = 0.967; p < 0.001, p < 0.001, p = 0.040, and SEM = 2.098; p < 0.001, p < 0.001, p < 0.001, and SEM = 2.199. Different symbols at the same time differ (*, p < 0.05; **, p < 0.01).
Fermentation 08 00242 g004
Table 1. Fatty acid compositions of oil sources (% total fatty acid).
ItemTreatment 1
COLSOCa-Salt
C10:00.010.010.02
C12:00.020.020.10
C14:00.060.060.28
C14:10.000.000.01
C15:00.010.020.03
C16:011.55.3012.4
C16:10.040.030.05
C17:10.030.050.00
C18:01.943.843.59
C18:1cis-929.719.250.8
C18:2n-655.015.628.5
C18:3n-31.2255.72.32
C20:00.400.040.53
C20:10.000.000.99
C20:30.120.150.32
1 CO, corn oil (C18:2n-6); LSO, linseed oil (C18:3n-3); Ca-salt, calcium salt of FA (protected C18:2n-6).
Table 2. Oligonucleotide primers used for Real-Time PCR assay.
Target OrganismSequence (5′-3′)Annealing Temp (°C)/Size (bp)Reference
BacteriaF-CGGCAACGAGCGCAACCC
R-CCATTGTAGCACGTGTGTAGCC
55.3/130Denman and McSweeney [31]
Fibrobacter succinogenesF-GTTCGGAATTACTGGGCGTAAA
R-CGCCTGCCCCTGAACTATC
61.0/121Denman and McSweeney [31]
Ruminococcus falvefaciensF-GAACGGAGATAATTTGAGTTTACTTAGG
R-CGGTCTCTGTATGTTATGAGGTATTACC
57.7/132Denman and McSweeney [31]
Ruminococcus albusF-CCCTAAAAGCAGTCTTAGTTCG
R-CCTCCTTGCGGTTAGAACA
59.3/175Koike and Kobayashi [32]
Streptococcus bovisF-CTAATACCGCATAACAGCAT
R-AGAAACTTCCTATCTCTAGG
57.0/869Tajima et al. [33]
Methanogenic archaeaF-TTCGGTGGATCDCARAGRGC
R-GBARGTCGWAWCCGTAGAATCC
56.0/140Denman et al. [34]
Ciliates (Entodinium)F-GAGCTAATACATGCTAAGGC
R-CCCTCACTACAATCGAGATTTAAGG
55.0/180Skillman et al. [35]
Table 3. Effects of oil source supplementation containing essential fatty acid on fatty acid profile of rumen buffer just before incubation.
Treatments 1SEMp-Value
COLSOCa-Salt
Total FA, mg/mL3.053.193.620.0690.604
 C14:0, % total FA2.652.521.960.3930.316
 C15:0, % total FA11.4 ab12.6 a8.55 b0.8370.047
 C16:0, % total FA21.823.220.11.0150.115
 C16:1, % total FA0.891.340.630.1740.059
 C17:0, % total FA0.580.550.470.0700.368
 C18:0, % total FA24.624.525.60.9180.501
 C18:1cis-9, % total FA14.7 b14.9 b21.4 a1.3600.026
 C18:2n-6, % total FA20.0 a9.33 b18.7 a1.6430.013
 C18:3n-3, % total FA0.92 b8.78 a1.25 b0.8510.004
 C20:0, % total FA1.761.520.851.0110.686
 C22:0, % total FA0.640.640.480.0870.245
 SFA 2, % total FA63.565.758.12.7020.135
 MUFA, % total FA15.6 b16.2 b22.0 a1.3250.029
 PUFA, % total FA20.918.119.91.9110.435
SFA: PUFA3.073.652.920.4360.347
n-6/n-321.7 a1.06 b15.0 a2.2160.006
1 CO, corn oil (C18:2n-6); LSO, linseed oil (C18:3n-3); Ca-salt, calcium salt of FA (protected C18:2n-6). 2 SFA, saturated fatty acid; MUFA, mono-unsaturated fatty acid; PUFA, poly-unsaturated fatty acid. a,b Means having different superscripts in the same row differ significantly (p < 0.05).
Table 4. Effects of oil source supplementation containing essential fatty acid on rumen fermentation characteristics and greenhouse gas emissions of rumen buffer after 24 h of incubation.
Treatments 1SEMp-Value
COLSOCa-Salt
pH6.44 b6.46 ab6.52 a0.0410.024
NH3-N, mg/100 mL20.020.220.21.1570.976
Total VFA, mmol/L58.960.157.01.6410.065
 Acetate, % mol49.6 b50.4 ab52.2 a0.9970.013
 Propionate, % mol38.5 a36.9 b36.9 b0.6300.007
 Butyrate, % mol11.011.910.60.6850.060
Acetate: propionate1.28 b1.36 ab1.41 a0.0480.015
Gas volume, mL/g DM38.837.437.70.8160.059
 CH4, mg/g17.215.217.11.1710.209
 CO2, mg/g2.612.512.590.2710.879
1 CO, corn oil (C18:2n-6); LSO, linseed oil (C18:3n-3); Ca-salt, calcium salt of FA (protected C18:2n-6). a,b Means having different superscripts in the same row differ significantly (p < 0.05).
Table 5. Effects of oil sources supplementation containing essential fatty acid on rumen microbes after 24 h of incubation (fold change unit).
Treatments 1SEMp-Value
COLSOCa-Salt
Methanogenic archaea0.72 b1.43 a1.06 b0.1450.003
Ciliates0.36 a0.13 b0.22 ab0.1110.018
Fibrolytic bacteria
F. succinogens0.15 b0.06 b0.45 a0.067<0.001
R. albus0.43 b0.04 c0.82 a0.146<0.001
S. bovis0.391.130.680.3240.083
R. flavefaciens0.48 b0.34 b1.02 a0.2760.005
1 CO, corn oil (C18:2n-6); LSO, linseed oil (C18:3n-3); Ca-salt, calcium salt of FA (protected C18:2n-6). a–c Means having different superscripts in the same row differ significantly (p < 0.05).
Table 6. Supplementation effects of oil sources containing essential fatty acid on fatty acid profiles of rumen buffer after 24 h of incubation.
Treatments 1SEMp-Value
COLSOCa-salt
Total FA, mg/mL4.045.025.510.0760.086
 C14:0, % total FA8.27 a6.28 b5.24 b0.4940.007
 C15:0, % total FA8.00 a5.02 b5.46 b0.7850.035
 C16:0, % total FA27.8 a22.2 b23.0 b0.8760.005
 C16:1, % total FA3.04 a1.75 b2.06 b0.1610.003
 C17:0, % total FA1.060.800.810.0820.058
 C18:0, % total FA25.4 b33.8 a20.1 c0.9380.002
 C18:1cis-9, % total FA14.2 b15.0 b28.2 a2.3390.004
 C18:2n-6, % total FA11.0 a5.41 b13.1 a0.8870.002
 C18:3n-3, % total FA0.65 c9.24 a1.24 b0.066<0.001
 C20:0, % total FA0.62 ab0.53 b0.68 a0.0340.020
 SFA, % total FA71.2 a68.6 a55.3 b3.0530.008
 MUFA, % total FA17.2 b16.8 b30.3 a2.2040.004
 PUFA, % total FA11.6 b14.6 a14.4 a0.9100.048
SFA: PUFA6.14 a4.69 b3.88 b0.6260.016
n-6/n-316.9 a0.58 b10.6 a1.045<0.001
1 CO, corn oil (C18:2n-6); LSO, linseed oil (C18:3n-3); Ca-salt, calcium salt of FA (protected C18:2n-6). SFA, saturated fatty acid; MUFA, mono-unsaturated fatty acid; PUFA, poly-unsaturated fatty acid. a–c Means having different superscripts in the same row differ significantly (p < 0.05).
Publisher’s Note: MDPI stays neutral with regard to jurisdictional claims in published maps and institutional affiliations.

