Article

Sequencing Batch Reactor Performance Evaluation on Orthophosphates and COD Removal from Brewery Wastewater

by
Siphesihle Mangena Khumalo
1,2,*,
Babatunde Femi Bakare
2,
Emmanuel Kweinor Tetteh
1 and
Sudesh Rathilal
1
1
Green Engineering Research Group, Department of Chemical Engineering, Faculty of Engineering and the Built Environment, Steve Campus, Durban University of Technology, S3 L3, P.O. Box 1334, Durban 4000, South Africa
2
Environmental Pollution and Remediation Research Group, Department of Chemical Engineering, Faculty of Engineering, Mangosuthu University of Technology, P.O. Box 12363, Jacobs, Durban 4026, South Africa
*
Author to whom correspondence should be addressed.
Submission received: 30 April 2022 / Revised: 18 June 2022 / Accepted: 20 June 2022 / Published: 23 June 2022

Abstract

:
The discharge of industrial effluent constituting high orthophosphates and organic pollutants in water receiving bodies compromises freshwater quality and perpetuates eutrophication. In this study, an anaerobic–aerobic sequencing batch reactor (SBR) under activated sludge was investigated for orthophosphates and chemical oxygen demand (COD) removal from brewery wastewater. Raw brewery wastewater samples were collected on a daily basis for a period of 4 weeks. The findings of the study are reported based on overall removal efficiencies recording 69% for orthophosphates and 54% for total COD for a sludge retention time (SRT) of 7 days and hydraulic retention time of 18 h at mesophilic temperature conditions of ±25 °C. Moreover, the SBR system showed stability on orthophosphate removal at a SRT ranging from 3 to 7 days with a variation in organic volumetric loading rate ranging from 1.14 to 4.83 kg COD/m3.day. The anaerobic reaction period was experimentally found to be 4 h with the aerobic phase lasting for 14 h. The SBR system demonstrated feasibility on orthophosphates and COD removal with variation in organic loading rate.

1. Introduction

The issue of freshwater scarcity perpetuated by environmental pollution among many other factors has become a global phenomenon, particularly in the sub-Saharan region [1,2,3]. The substantial increase in biological nutrients particularly phosphorus and nitrogenous compounds in water bodies results in eutrophic waters [4,5,6]. The environmentally detrimental eutrophic waters are characterized by high concentrations of aquatic weeds and algae, which eventually die, sink to the bottom, and decay, thus reducing the levels of dissolved oxygen in the water killing fish [4,6,7,8]. Moreover, eutrophic waters can cause adverse effects on human society, such as drinking water problems (i.e., taste and odor) and promotion of toxic phytoplankton species [8]. Phosphorus is one of the essential nutrients for plant growth, enriching water bodies with phosphorus results in the stimulation of toxic cyanobacterial (algal blooms) [5,8]. The occurrence of excess phosphorus and other biological nutrients in aquatic ecosystems perpetuated by environmental population necessitates the need to reduce biological nutrient loads entering the environment. One of the human activities perpetuating the formation of eutrophic waters is the discharge of voluminous untreated industrial wastewater into water-receiving bodies [6,9,10]. The brewing industry is not an exception, the beer-producing process is characterized by the use of large volumes of fresh water and generate voluminous amounts of wastewater [1,11,12], which require treatment prior to being discharged into water-receiving bodies.
Wastewater emanating from the brewery is characterized by high concentration levels of chemical oxygen demand (COD) (Table 1) which results from the high organic compounds found in brewery wastewater such as sugars, yeast, and soluble starch [11,12,13,14].
Furthermore, industrial wastewater generated from the brewery also contains phosphorus and nitrogenous pollutants; however, their concentrations depend greatly on the type of chemicals that are used during the cleaning process (i.e., caustic soda, phosphoric acid, and nitric acid) and the amount of yeast in wastewater [1,12,15]. From the data presented in Table 1, it is clear that the brewery’s wastewater contains a significant percentage of COD in terms of pollutant composition, which can be harmful to the environment. It is worth mentioning that most nations, including South Africa (SA) and the European Union (EU), have dewatering regulations that the brewing business is obligated to uphold. Dewatering regulations are designed to manage and/or eradicate environmental issues associated with the discharge of untreated industrial effluent [1]. Hence, breweries should be able to manage their impacts on the environment, by developing wastewater treatment processes that can effectively treat their effluent to meet dewatering limits set by national and international environmental entities.
Table 1. Brewery wastewater composition and dewatering limits in SA and EU.
Present Study[1][16][17]
ParameterMean ± SDRangeRangeRangeSA Discharge
Limits
EU Discharge
Limits
Temperature, °C31 ± 3.725.3–3718–40-<44-
pH6.5 ± 2.44.4–6.173–123–125.0–9.5-
Turbidity, NTU570 ± 164303–1039----
Total COD, mg/L7687 ± 20303447–11,8132000–60001800–500075125
BOD5, mg/L--1200–36001005–3800-25
Phosphates, mg/L343 ± 64229–42410–5010–50101–2
TS, mg/L5951 ± 33872942–14,9815100–875050–6000--
VSS, mg/L1799 ± 5711043–2572----
There are reported studies conducted on brewery wastewater treatment using a SBR with the common goal of minimizing wastewater-related environmental issues, namely anaerobic SBR [18], aerobic SBR [19], aerobic/anoxic SBR [20], and suspended and attached growth SBR [21]. Shao et al. [18] evaluated the performance of an anaerobic SBR in COD removal from raw brewery wastewater. Shao and co-workers reported 90% COD removal for a HRT and STR of 24 h and 60 days, respectively, for an OVLR range of 1.5 to 5.0 kg COD/m3.day. Moreover, Wang et al. [19] reported 88% COD removal from brewery wastewater using a SBR for HRT and STR of 15 h and 90 days, respectively. It is worth noting that for the work reported by Wang and co-workers, the reactor effluent had a total COD concentration of 346 mg/L which is above the dewatering limits as indicated in Table 1.
The removal of phosphorus biologically from waste streams is achieved by introducing waste streams into an anaerobic environment in which phosphorus is released followed by an aerobic environment in which phosphorus is taken up by polyphosphate-accumulating organisms (PAOs) [22,23,24]. Ge et al. [25] investigated the performance of a SBR for phosphorus removal in abattoir wastewater. The findings of the investigation reported 90% phosphorus removal for a HRT and SRT of 0.5 to 1 day and 2 to 2.5 days, respectively, at an OVLR of between 2 to 3 g COD/L.
It should be noted that there are emerging advanced oxidation processes (AOPs) for wastewater treatment such as photocatalytic degradation known as photocatalysis [26]. The photocatalysis process involves the use of solids (photocatalysts) which can promote reactions in the presence of light without being consumed in the overall reaction [27], titanium oxide and zinc oxide are the most widely used photocatalysts [26]. Previous studies [28,29,30] have indicated that photocatalysis demonstrated good performance in degrading organic pollutants in wastewater streams. However, there are some drawbacks associated with the photocatalysis process such as high energy requirements for photocatalysts with a wide band gap energy [31], low light absorption abilities which hinder the overall photocatalytic quantum efficiency [26], and high costs of recycling and recuperating suspended photocatalysts [32]. On the other hand, biological methods have cemented their application in wastewater treatment because they are economically attractive and mostly used in industry [33].
Despite the advancement in wastewater treatment processes, biological methods are still widely used in wastewater treatment works as reported by Chen et al. [33]. It should be noted that the application of SBRs in brewery wastewater treatment has been investigated extensively [20,21,23,24]; however, to our knowledge, none of the reported studies have reported on the performance evaluation of a SBR for simultaneous COD and orthophosphates removal from brewery wastewater relative to the microbial population growth rate. The current study aims to evaluate the performance of a SBR for simultaneous COD and orthophosphates removal from brewery wastewater. The SBR system is selected on the basis that the settling and reaction phase takes place in the same vessel, which makes it easy to operate and economically attractive. Furthermore, the findings of the study will provide wastewater-producing industries with practical and technical reference information to assist in developing the most effective in-house wastewater treatment systems to reduce phosphorus and carbon pollutants, thus reducing the environmental pollution in water-receiving bodies. Moreover, the current study will give an insight into the substrate utilization rate relative to substrate concentration as well as microbial population growth rate relative to substrate utilization rate.

2. Materials and Methods

2.1. Sample Collection and Preparation

Brewery wastewater samples were collected at the effluent stream of the brewery on a daily basis for a period of 28 days using sterile glass sampling bottles. Samples were transported to the laboratory in a cooler box full of ice to maintain a temperature of 4 °C. Samples were collected mainly for the operation of a laboratory-scale SBR to investigate the performance of the SBR system on orthophosphates and COD removal from brewery wastewater. Upon arrival at the laboratory, samples were allowed to warm up to room temperature and sample composition analyses were conducted within 48 h from the time of sampling by standard methods [34]. Thereafter, charged into the reactor to commence treatment immediately.

2.2. Activated Sludge

Activated sludge was harvested from an anaerobic digester at a local brewery wastewater treatment plant. The microbial population was harvested using a 10 L bucket and then transported to the laboratory. In preparing the harvested microbial population for treatment, no chemicals were added to the sludge nor into the raw brewery wastewater to balance the N:C:P ratio. Only the condensed almost granular sludge was used for treatment since granular sludge is associated with good settleability, which is imperative for optimum treatment efficiencies.

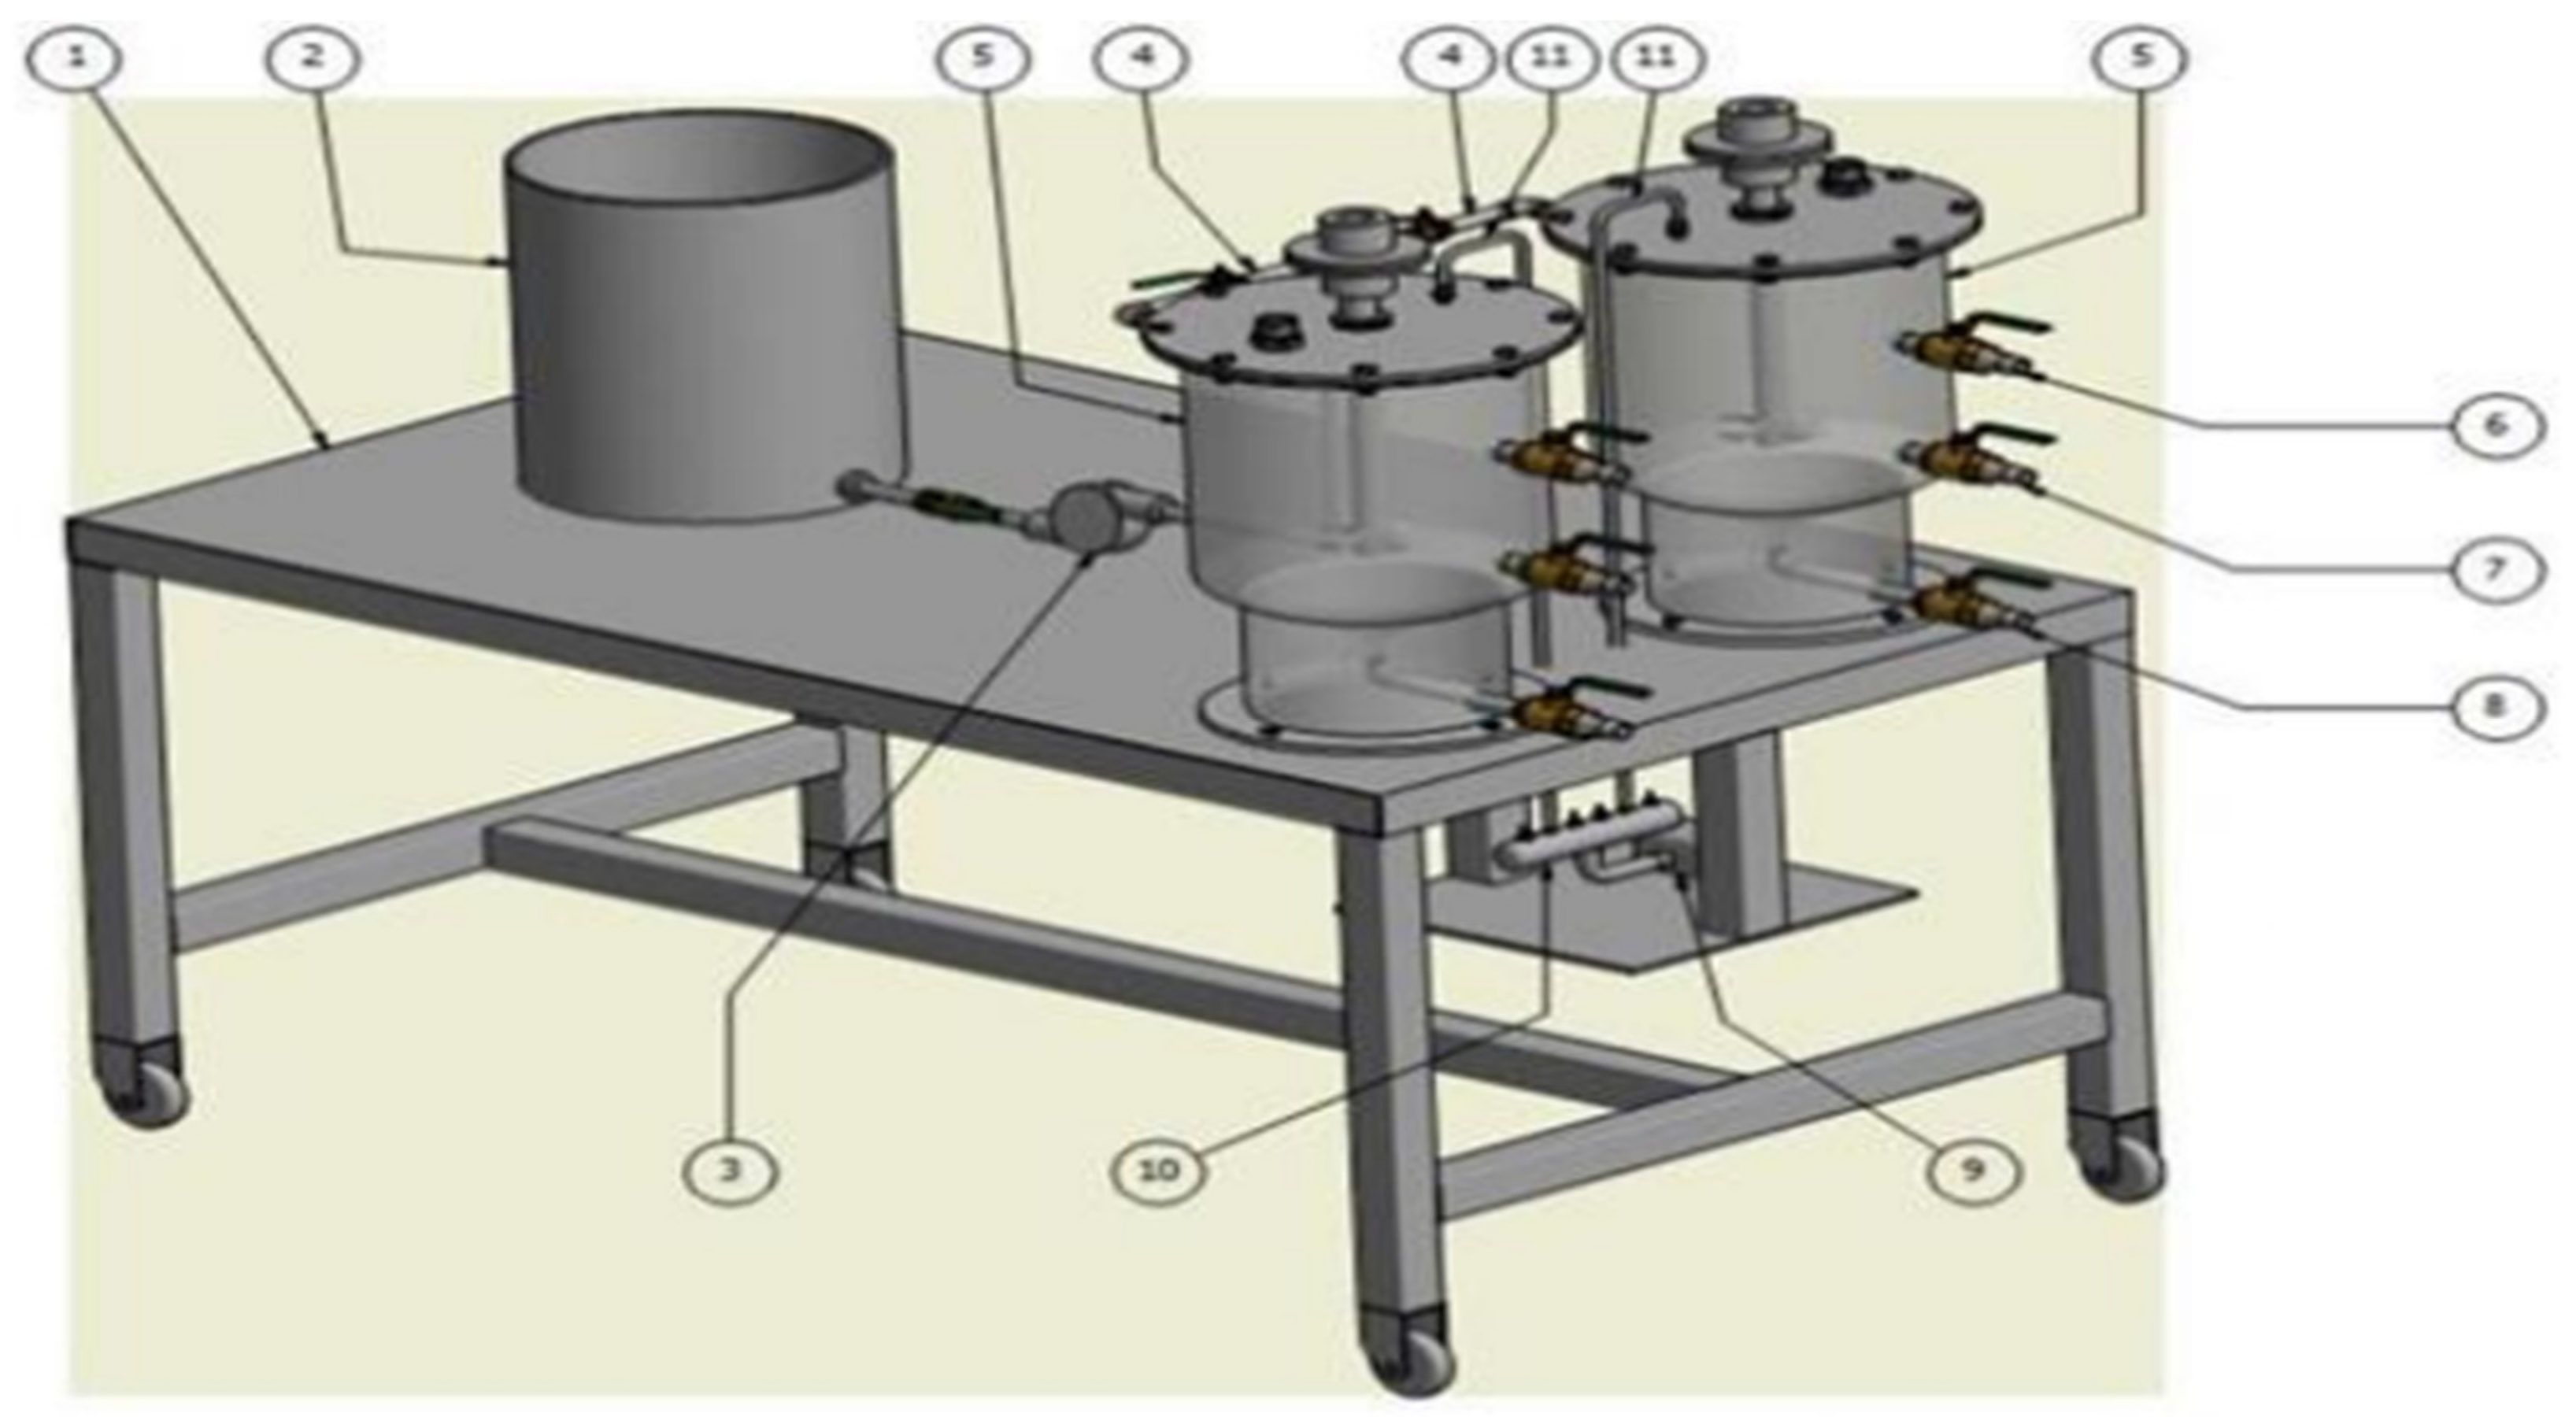
2.3. Sequencing Batch Reactor Design

The laboratory-scale SBR, as shown in Figure 1, was made of transparent polyvinyl chloride, having a total volume of 22 L with a conical base having a slope of 60° for easy drainage of bio-solids. For experimental runs, the working volume was set at 13 L with the microbial population occupying 4 L and raw brewery wastewater occupying 9 L. This working volume was based on the selected HRT and SRT since they are both affected by the reactor working volume.
Moreover, the reactor was not utilized into its maximum working volume to accommodate sludge bulking since the microbial growth rate is directly proportional to the substrate utilization rate [23]. The conical bottom of the reactor allowed a quiescent and easy gravitational settling mechanism. The reactor had a portable shaft mixer which was operated continuously to keep bio-solids suspended inside the reactor, thus allowing perfect mixing. Both the mixer shaft and impeller blades were made of stainless steel, with a drive motor mounted at the top of the reactor tank in a rubber gasket operating at 10 W.

2.4. Experimental Approach

The experimental approach which was adopted in this study is similar to the work reported by Shabangu and Bakare [36] which includes a sequence of operational steps which are defined as follows:
  • The filling phase—This was considered the first operational phase of the SBR system. The reactor was first seeded with 4 L of activated sludge under anaerobic conditions. Raw brewery wastewater was fed into the holding tank where suspended solids were allowed to settle by gravitational force for a period of 2 h. After the settling phase, 9 L of raw brewery wastewater supernatant was pumped into the reactor. The filling phase took place under anaerobic conditions; however, the stirrer was switched on and set to operate at 350 rpm to allow mixing. According to Tchobanoglous [23], only mixing during the filling stage promotes filamentous growth control thus improving sludge settling and thickening. The agitation speed of the stirrer was set to be at 350 rpm because it was observed that higher agitation speed resulted in sludge bulking, thus compromising the solids’ settleability. The filling phase on average for all experimental runs lasted for 5 min.
  • Reaction phase—After the filling phase, the system was allowed to undergo an anaerobic phase which favored the polyphosphate-accumulating organisms, which lasted for a period of 4 h and thereafter the reaction phase was instigated. Oxygen was supplied using an aerator pump as depicted in Figure 1 at a flow rate of 7.5 L/min, maintaining a dissolved oxygen concentration of 3 mg/L. It is worth noting that for the current work, the effect of dissolved oxygen was not investigated. During the reaction phase, microorganisms consume substrate, i.e., orthophosphates under a controlled pH which was kept within the range of 4 to 9.5. According to Tchobanoglous [23], microbial activities are hindered at pH levels less than 4 and pH levels more than 9.5. The aeration duration and anaerobic phase duration were predetermined experimentally which lasted for 14 h and 4 h, respectively. Moreover, the SBR was operated at mesophilic temperature of ±25 °C.
  • Settling phase—During this phase, bio-solids were allowed to separate gravitationally from the treated liquid under quiescent conditions resulting in a clear clarified supernatant. During this phase, the stirrer was switched off as well as the aeration system, and no influent was charged into the reactor nor effluent drawn. The settling period lasted for 2 h to enhance optimum settling of bio-solids containing biodegradable organic and biological pollutants, thus resulting in a clear clarified supernatant with minimum suspended solids.
  • Drawing phase—This phase was considered the final treatment operational stage for the SBR system. During this phase, the clarified supernatant was sampled as the treated reactor effluent by tapping the reactor effluent into a 250 mL sterile glass bottle for laboratory analysis.

2.5. Laboratory Analysis

Orthophosphates ( PO 4 3 ), total COD (TCOD), total solids (TS), volatile suspended solids (VSS), temperature, and pH were measured in accordance with the Standard Methods for the Examination of Water and Wastewater [34] standard method. Orthophosphate concentration was measured colorimetrically using a DR3900 spectrophotometer manufactured by Hach South Africa Pty Ltd, Johannesburg, supplied by Universal Water Supplies, from South Africa. The molybdovanadate method was implemented, in which orthophosphate reacts with molybdate in an acid medium to produce a mixed phosphate/molybdate complex. In the presence of vanadium, a yellow molybdovanadophosphiric acid is formed. The intensity of the yellow color is proportional to the phosphate concentration. Samples were measured at a wavelength of 430 nm. TCOD was measured as a quick indicator of organic pollutants in industrial wastewater emanated from the brewery. The TCOD was expressed in milligrams of oxygen per liter, which is the amount of oxygen consumed per liter of brewery wastewater. This parameter was measured spectrophotometrically (Hach DR3900) using the colorimetric method. According to the Standard methods for the Examination of Water and Wastewater [34], total solids are total dissolved solids plus suspended and settleable solids in water. In the case of brewery wastewater, dissolved solids consist of nitrate, phosphorus, and other particles. On the other hand, suspended solids include fine organic debris and other particulate matter.
Total solids were measured gravimetrically in mg TS/L, a well-mixed sample was dried at 105 °C for 24 h, the TS fraction was given by the weight of the residue after drying. Both temperature and pH were measured online, i.e., during the treatment process. Temperature and pH monitoring inside the reactor was carried out using a calibrated Thermo Scientific Orion Star A215 pH/conductivity meter manufactured by Thermo Fisher Scientific, Johannesburg, supplied by Universal Water Supplies, from South Africa.

2.6. Data Analysis

For data credibility, samples were measured in triplicates and statistically validated at a 95% confidence level. The removal efficiency for the SBR was calculated using Equation (1) below:
Removal efficiency (%) = [(C0Cf)/C0] × 100%
where C0 and Cf are the substrate concentrations (mg/L) in the SBR influent and effluent streams, respectively.
Substrate utilization/uptake rate and the microbial growth rate were monitored by using the Michaelis–Menten and the Monod empirical models as presented by Equations (2) and (3) [18]:
rsu = kXS/(Ks + S)
rg = µmXS/(Ks + S)
where rsu and rg are the substrate utilization rate and bacteria growth rate from substrate utilization per unit of reactor volume, g/m3.day, respectively, k is the maximum specific substrate utilization rate, g-substrate/g-microorganisms.day, X is the biomass concentration, g/m3, S is the growth-limiting substrate concentration in a solution, g/m3, Ks is the half-velocity constant, which is the substrate concentration at one-half the maximum specific substrate utilization rate, g/m3, and µm is the maximum specific bacteria growth rate, g-biomass/g-biomass.day.
Moreover, a descriptive statistical analysis was conducted to calculate the mean and standard deviation (SD) using Equations (4) and (5), respectively, as well as the range.
x ¯ = X n
S D = X x ¯ 2 n 1
where x ¯ is the mean, X is the numerical value of each sample, and n is the total number of samples analyzed. The SD was used to measure how far each of the measured physiochemical properties lies from the mean. It should be noted that high SD values mean that the value of the measured physiochemical property lies generally far from the mean, while low SD values mean the measured physiochemical property values are clustered close to the mean. Moreover, the SD was calculated by reducing the sample size from n to n − 1, this was implemented to avoid a biased estimate when using a sample size of n, thus underestimating the variability [37].

3. Results and Discussion

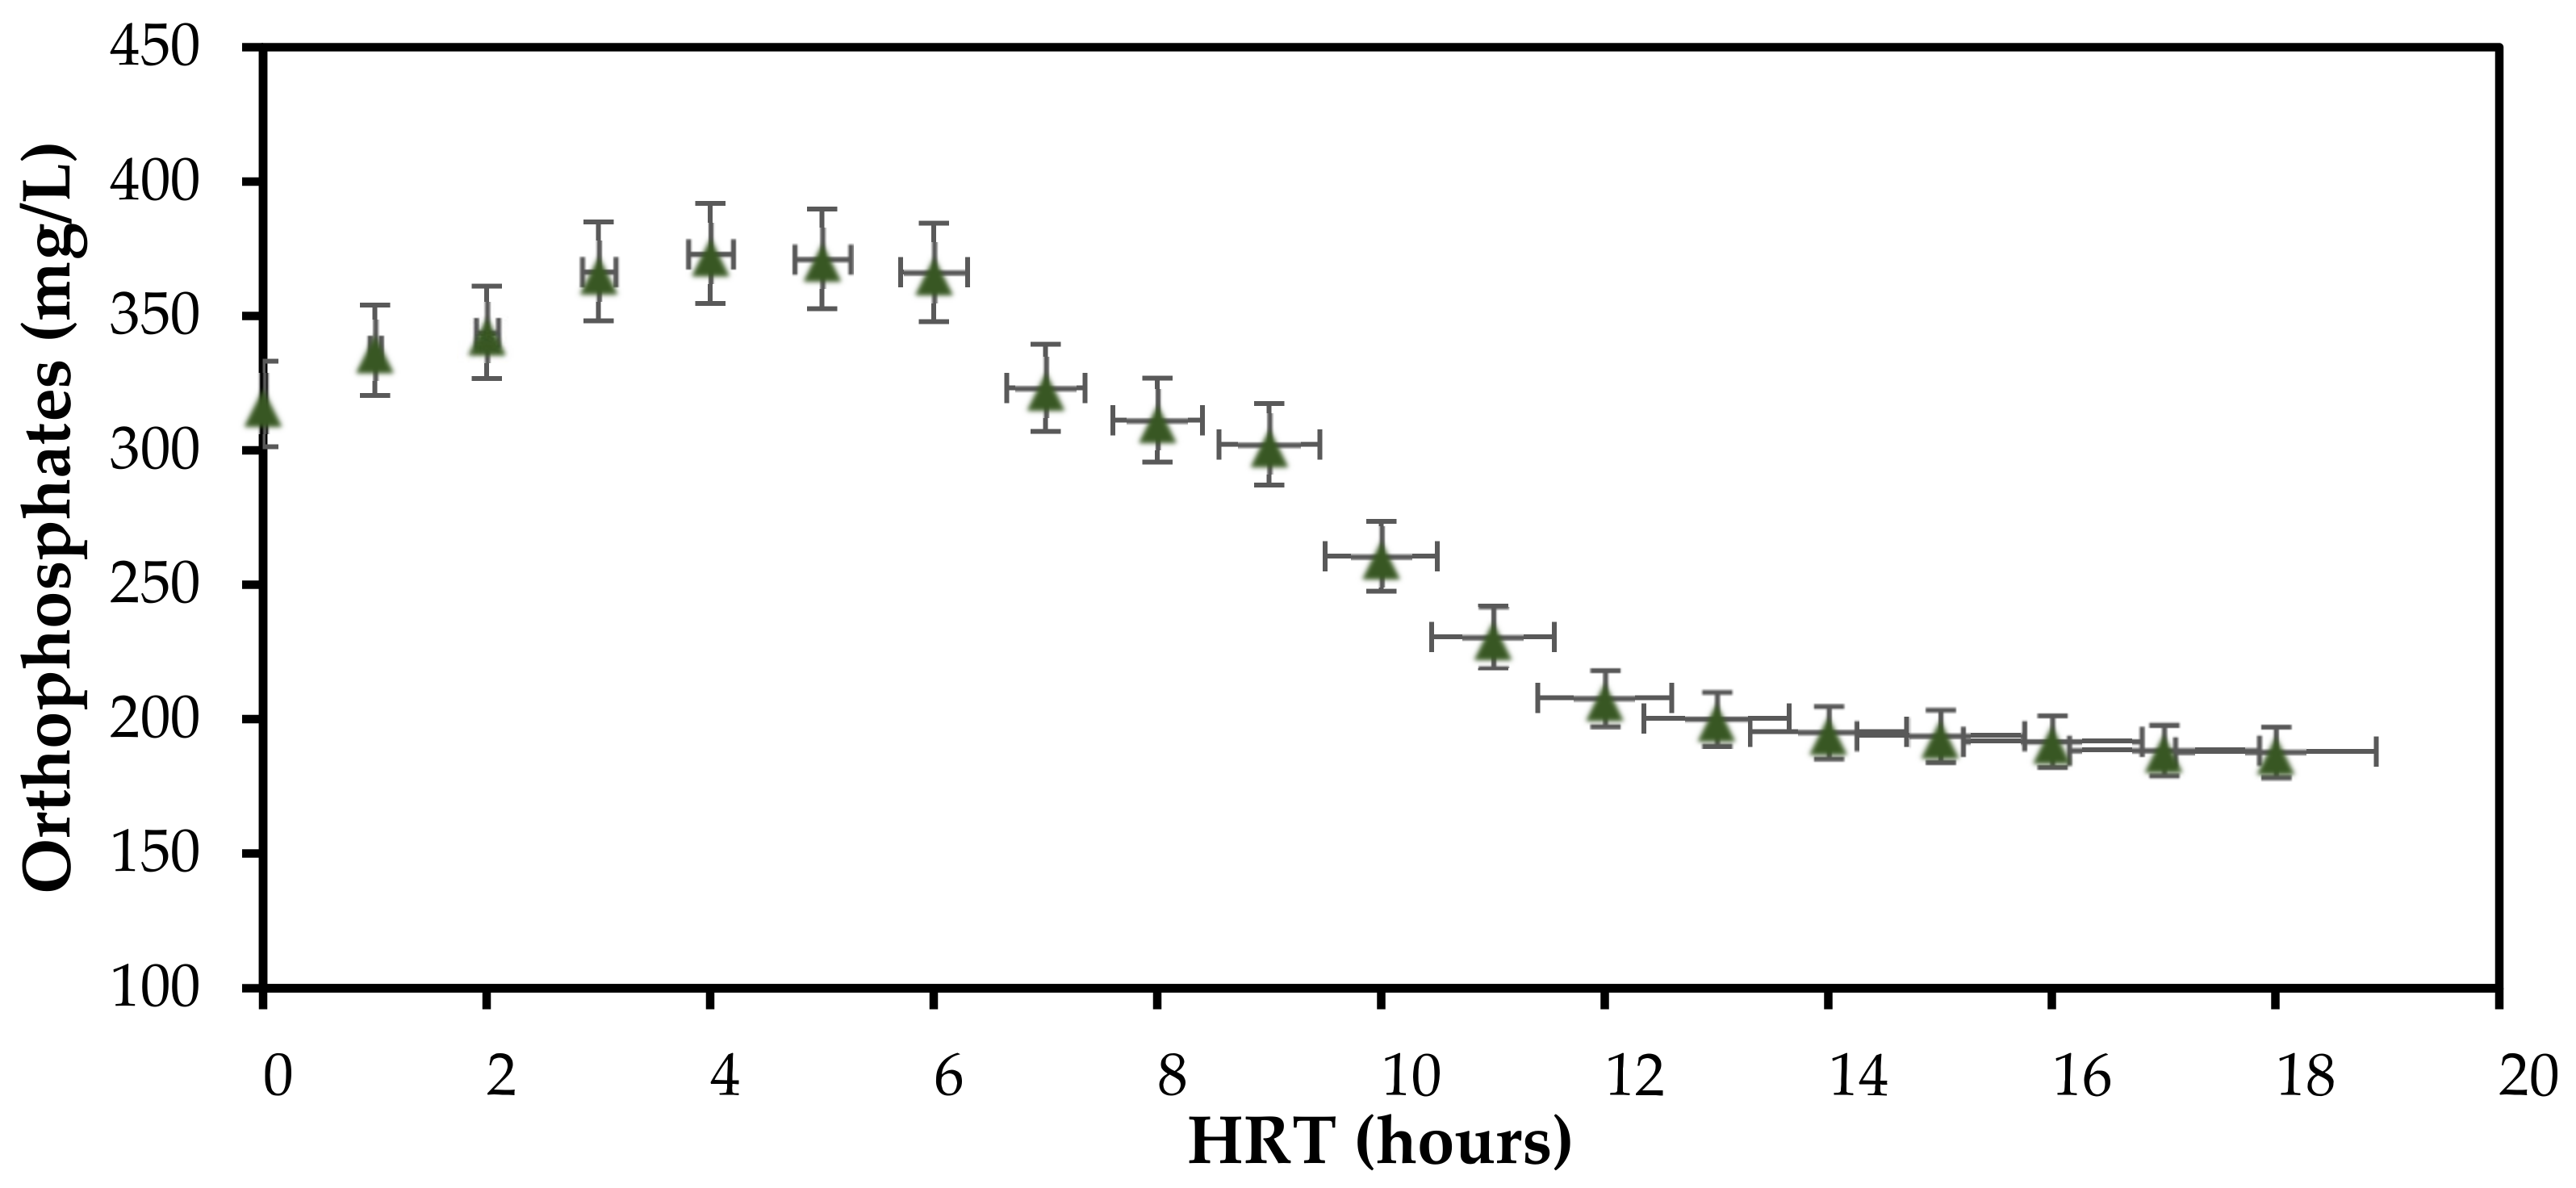
3.1. Effect of Hydraulic Retention Time (HRT) on Orthophosphate Removal

For the current study, the HRT was determined experimentally and the results obtained are presented in Figure 2. It can be seen that there was a significant increase in orthophosphate concentration during the first 4 h of the anaerobic phase. The increase in orthophosphate production was an indication that the PAOs were favored which are essential for orthophosphate removal in the aerobic phase. The PAOs are favored in the anaerobic environment because they do not require oxygen as an electron donor. However, they consume readily biodegradable substrates in wastewater using energy made available from stored phosphorus as polyphosphates, thus enabling PAOs to become dominant.
Furthermore, it is evident from Figure 2 that at a HRT of 5 to 12 h there was a significant removal of orthophosphates and it reduced significantly at a HRT of between 13 and 18 h. Orthophosphate removal was achieved in the aerobic phase because in an aerobic environment, microorganisms grow new biomass and take up orthophosphates, typically more than the amount they released in the anaerobic environment [23]. Moreover, the orthophosphate removal mechanism is characterized by a faster orthophosphate release rate than the subsequent orthophosphate uptake rate in the aerobic phase. Thus, the aerobic phase last longer than the anaerobic phase for maximum orthophosphate removal, as presented by the orthophosphate concentration profile in Figure 2. Therefore, for the current study, a HRT of 18 h was considered with the anaerobic phase lasting 4 h and the aerobic phase duration being 14 h.

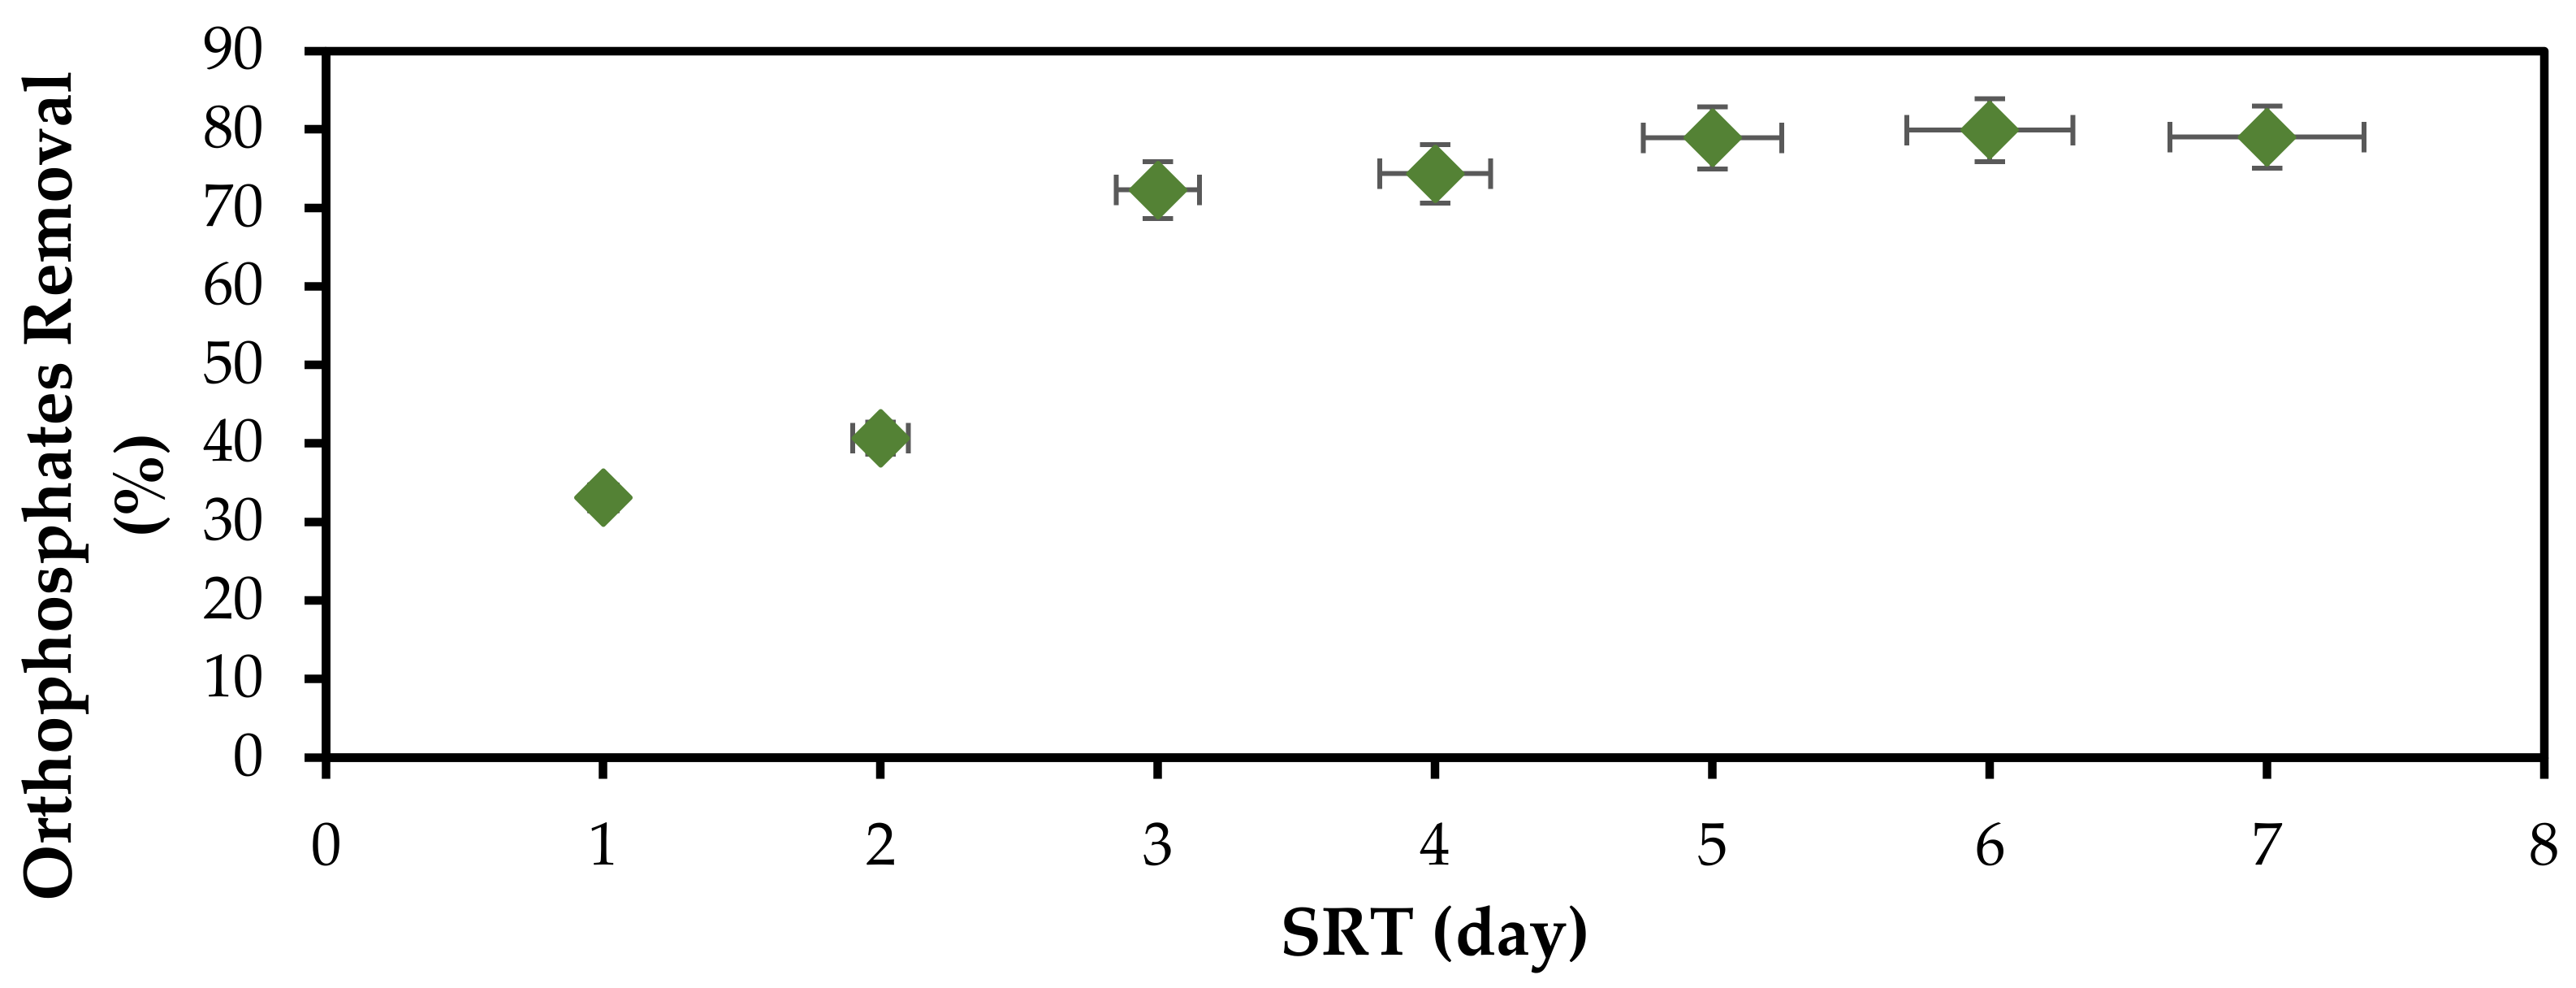
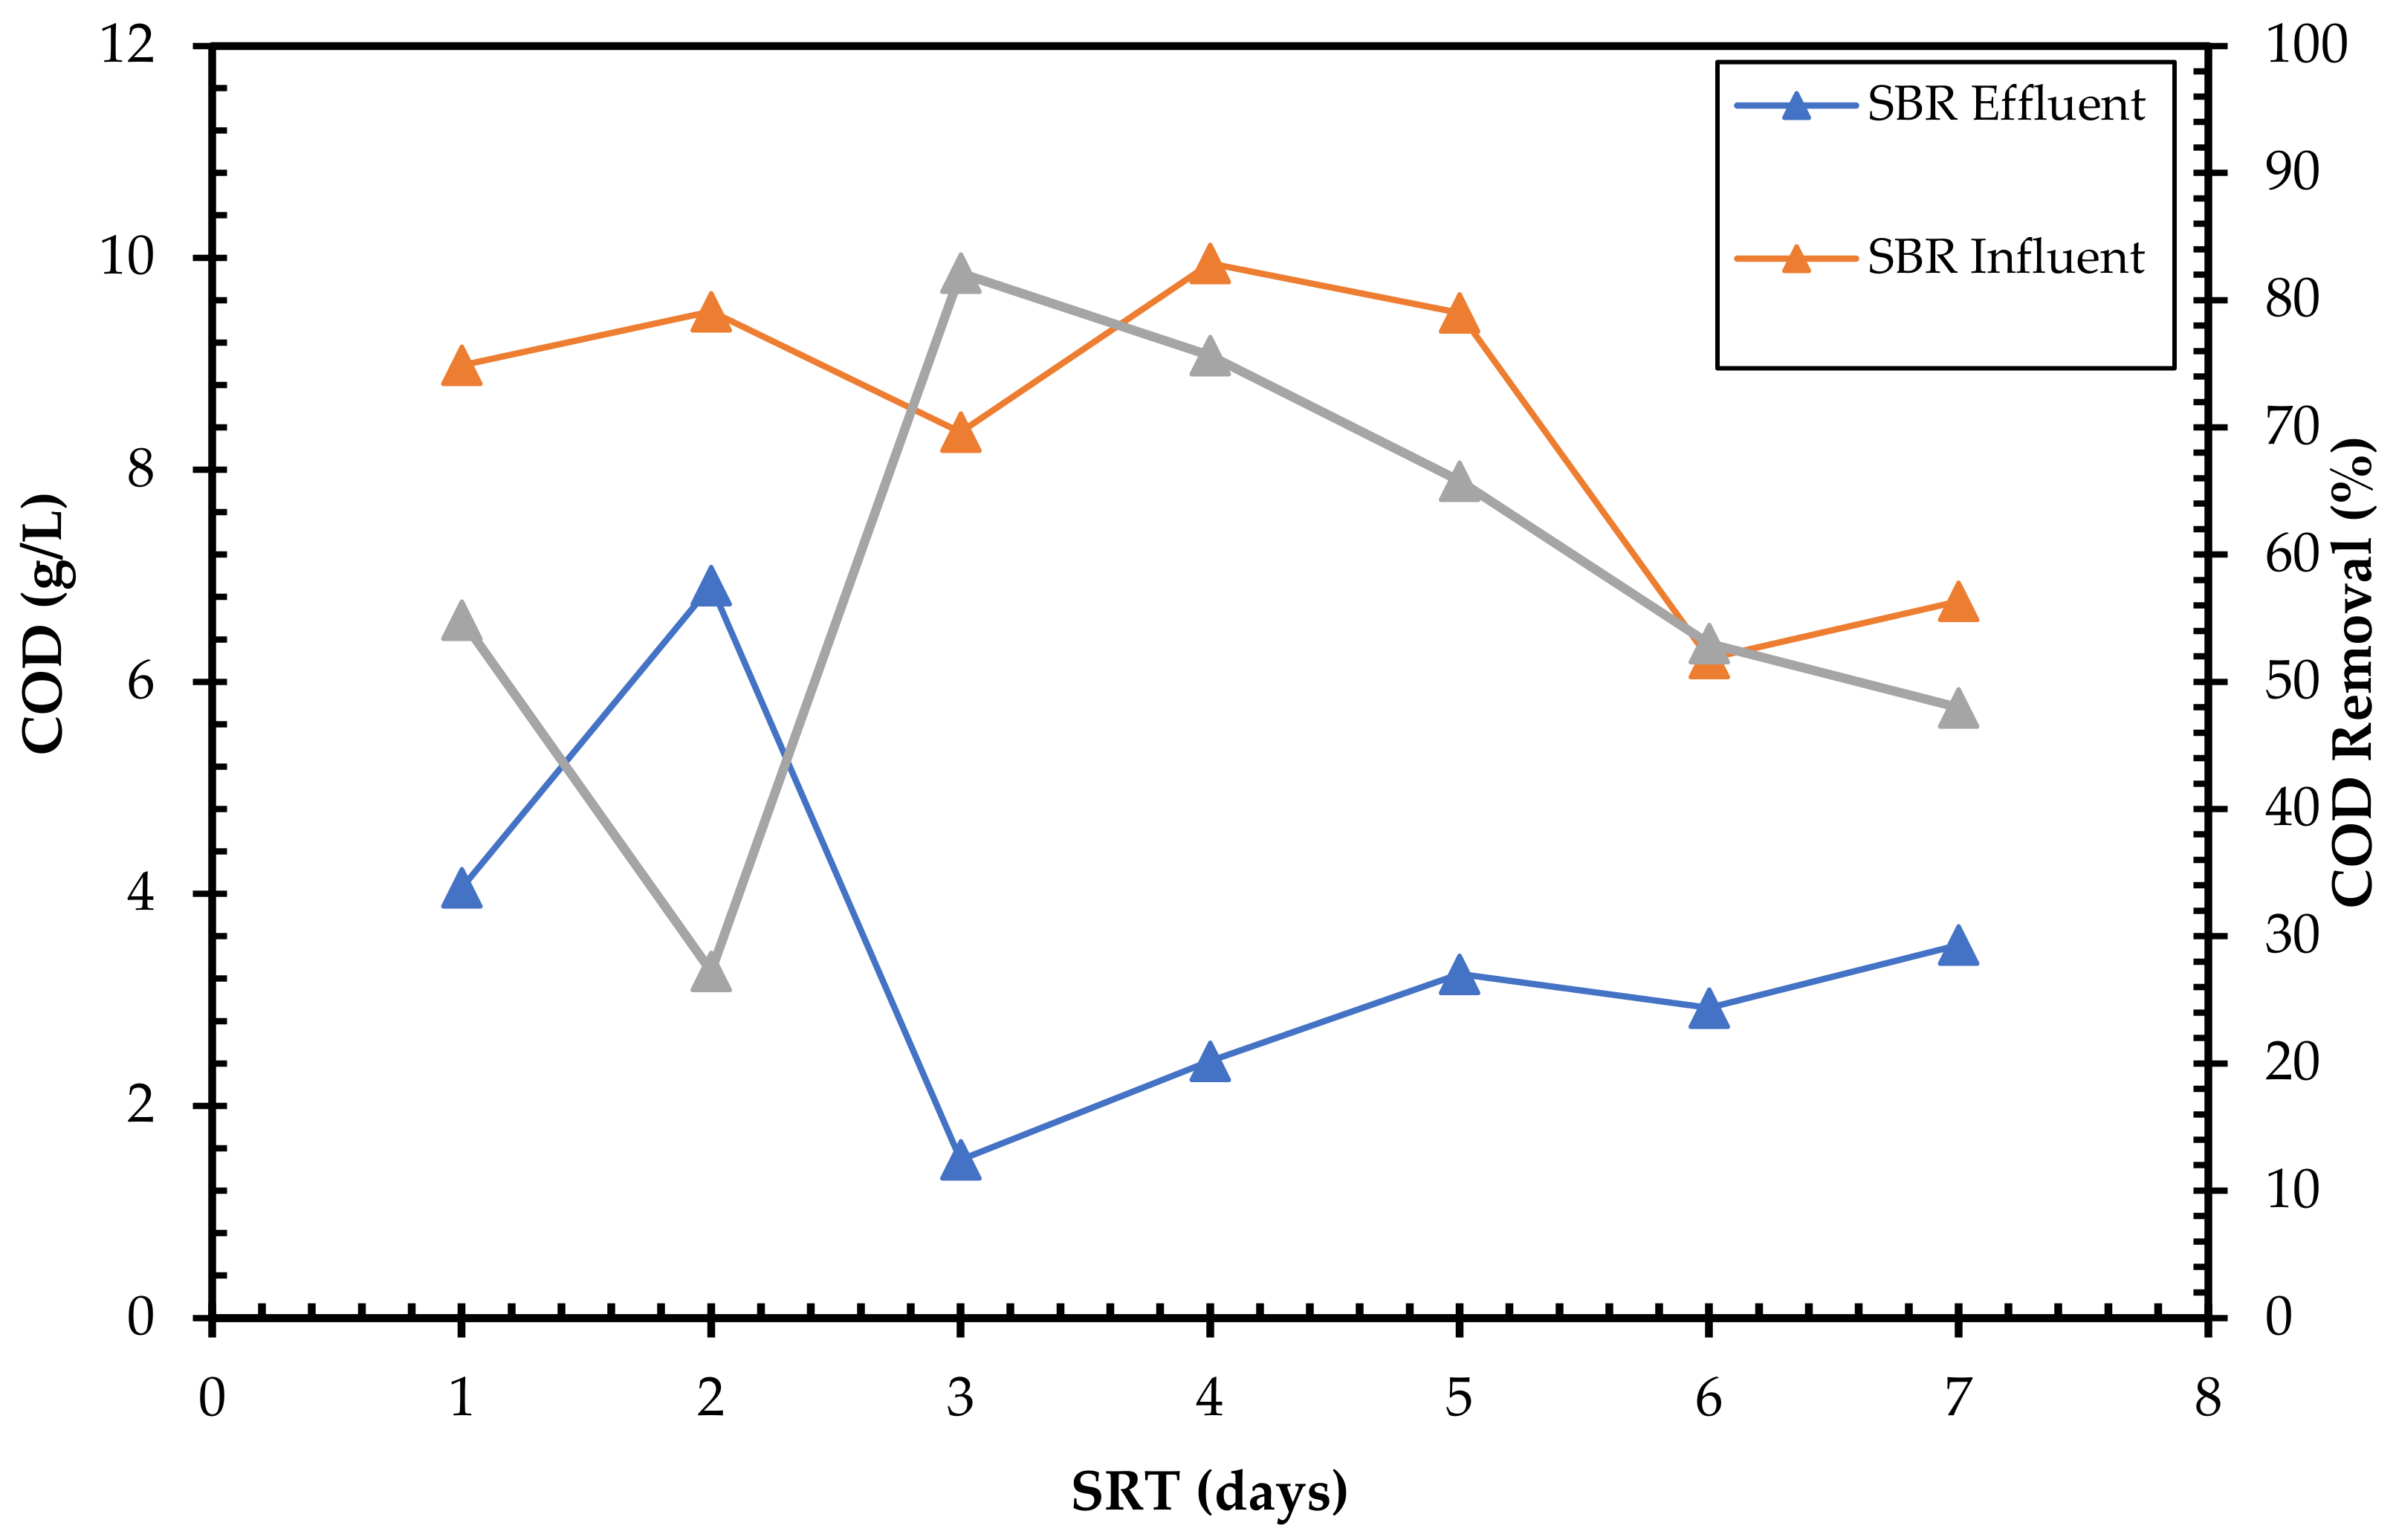
3.2. Effect of Solid Retention Time (STR) on Orthophosphate and COD Removal

Figure 3 and Figure 4 present the findings of the study on orthophosphate and COD removal profile with variation in the SRT. It was observed that at a SRT of 3 days and above there was a significant removal in orthophosphates, recording a percentage removal of 70% and above. The significant removal at a SRT of 3 days and above was an indication that the sludge in the reactor was well acclimated to PAOs which are essential for orthophosphate removal. Furthermore, the findings of the study explicitly indicated that the system gained stability at a SRT of between 5 and 7 days, recording a maximum orthophosphate percentage removal of 80%. It was observed that operating at a SRT of 7 days and above promoted the growth of “glycogen-accumulating organisms”, which cause a decrease in the growth rate of PAOs. Chan et al. [22] reported that longer SRTs of more than 10 days have the advantage of promoting the growth of “glycogen-accumulating organisms”, causing a decrease in PAOs.
From Figure 4, it is apparent that biodegradation in terms of COD removal from brewery wastewater was taking place in the SBR, which is confirmed by the low COD concentration in the SBR effluent stream as compared to the SBR influent stream. However, the system under investigation did not yield conclusive findings on the relationship between SRT and COD removal. From the results presented in Figure 4, the lowest and highest COD removal efficiencies were recorded at a SRT of 2 and 3 days, respectively. The variation in COD removal is attributed to the variation in COD concentrations in the SBR influent stream. The lowest COD removal at a SRT of 2 days suggests that the SBR influent had a high fraction of slowly biodegradable COD, which constitutes particulate COD which is not explicitly accounted for in the current study. On the other hand, the highest COD removal at a SRT of 3 days suggests that the SBR influent stream has a high fraction of readily biodegradable COD, which constitutes soluble COD which is not explicitly accounted for in this study.
Moreover, the results presented in Figure 3 and Figure 4 suggest that the SBR system under investigation needs to be combined with another wastewater treatment technology such as coagulation or advanced oxidation processes to comply with the dewatering limits presented in Table 1.

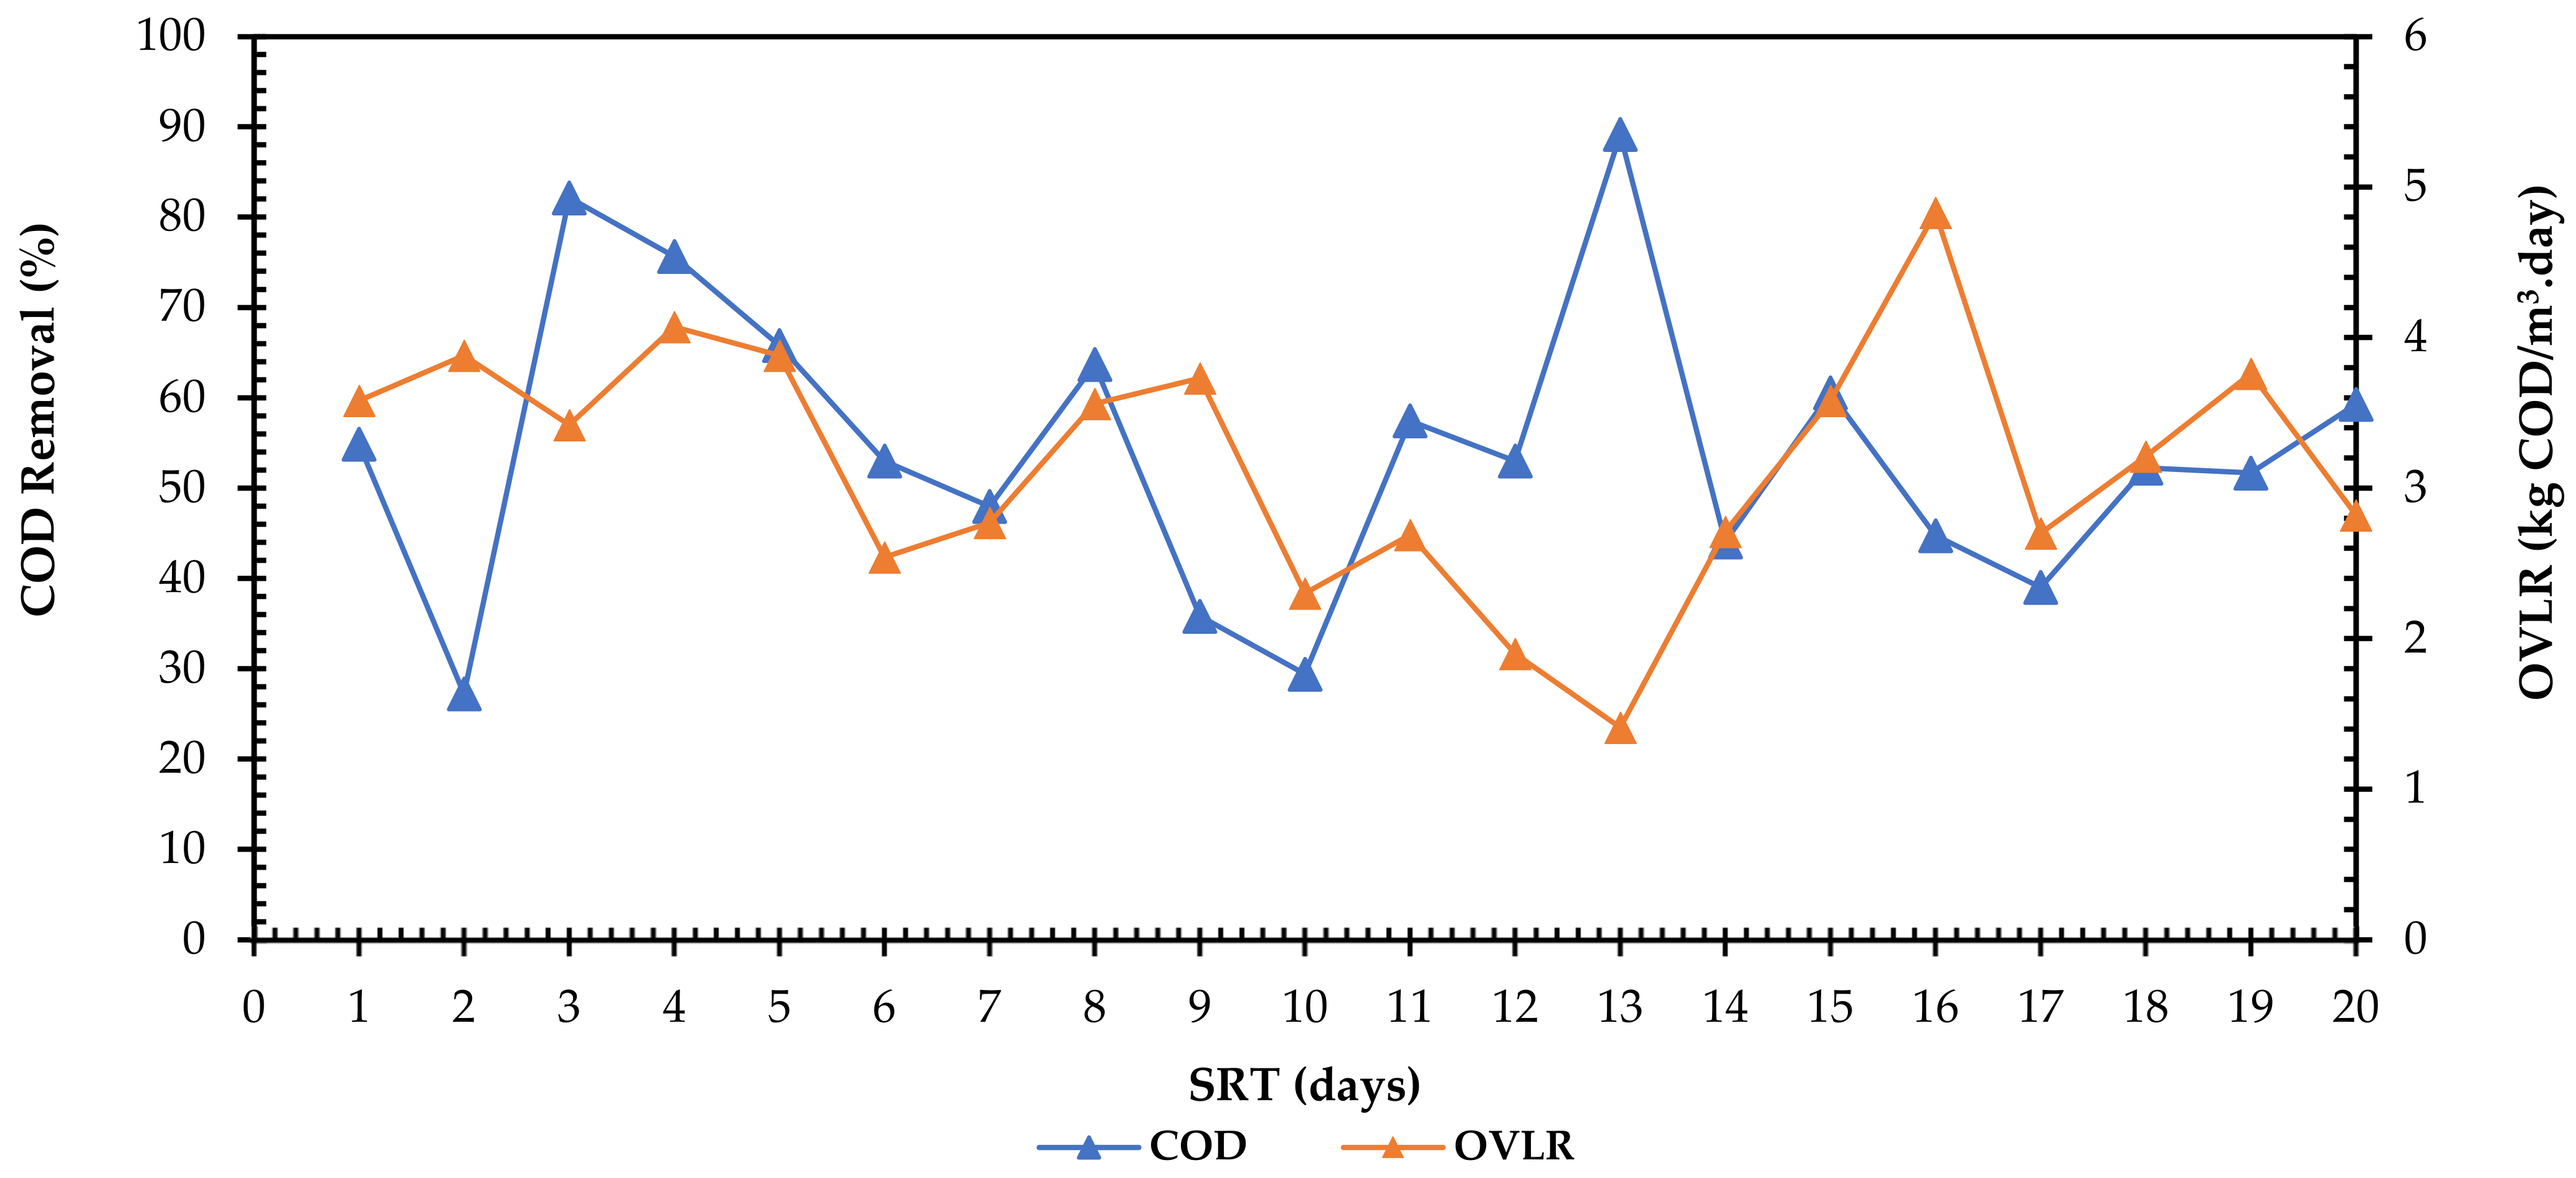
3.3. Orthophosphate and COD Removal with Variation in Organic Volumetric Loading Rate (OVLR)

According to Carucci et al. [38], fluctuations in organic loads in influent streams compromise the treatment efficacy of biological nutrient removal systems. In this research study, the orthophosphate and COD percentage removals were investigated with a variation in OVLR, and the findings of the study are presented in Figure 5 and Figure 6. However, when analyzing Figure 5, it can be seen that the variation in OVLR had an insignificant effect on the orthophosphate percentage removal. This may be attributed to the basis that the microbial population used in this study was harvested from an anaerobic digester treating wastewater with high-strength organic loads; therefore, the microbial population adapted to variations in OVLR. Microbial populations in nature, when subjected to certain environmental conditions over a period of time, turn out to adapt to particular conditions, this period is referred to as the acclimation period. Orthophosphate removal of up to 80% was achieved in this study which was an indication that the microbial population in the reactor was well acclimated to a microbial population which was not affected by the variation in organic loads. Furthermore, the findings presented in Figure 5 suggests that the organic load in wastewater samples investigated in this study was within a range which did not have a negative effect on the system’s microbial activities in orthophosphate removal.
Figure 5 shows the findings of the current study, indicating that there is a variation in COD removal with OVLR variation as a function of SRT. As it was indicated in Section 3.2, the variation in COD removal is attributed to the variation in SBR influent stream composition. The results presented in Figure 6 suggest that the microbial community was able to biodegrade readily biodegradable COD which is not explicitly accounted for in this work. Moreover, the results presented in Figure 6 suggest that the brewery effluent under investigation constitutes a high composition of slowly biodegradable and particulate COD which can be removed by other advanced wastewater treatment processes.

3.4. Orthophosphate and Total Chemical Oxygen Demand (TCOD) Removal

The TCOD is a combination of the particulate COD and soluble COD. The findings of the study on orthophosphate and TCOD removal are presented in Figure 7. The current study on average achieved a TCOD removal efficiency of 54% which was lower than the orthophosphate percentage removal of 69%. Shabangu [35] and Bakare et al. [39] reported that higher COD efficiencies of up to 90% in SBR systems operated at mesophilic temperature conditions ranging between 20 and 25 °C can be achieved at longer HRTs ranging from 5 to 7 days. However, long HRT of up to 7 days may not be feasible for regions experiencing freshwater scarcity such as the southern part of Africa. Moreover, high HRTs of up to 7 days can result in high operation costs in terms of aeration.
Furthermore, the lower TCOD concentrations in the effluent stream when compared to the influent stream was an indication that indeed microbial activities were taking place inside the reactor during treatment. According to Tchobanoglous [23], during the anaerobic phase, POAs consume readily biodegradable organic substrates (e.g., biodegradable COD) with the aid of energy made available from stored phosphorus. Thus, enriching the sludge with PAOs. Based on organic substrate consumption mechanisms on orthophosphate removal systems reported by Tchobanoglous [23], it can be said that the 54% TCOD removal represents the fraction of readily biodegradable TCOD.
Moreover, for the current work, the pH range of the SBR influent stream was between 4.9–8.4 for different batches. The range in pH is attributed to varying brewery wastewater composition, depending on the brewery activities taking place inside the brewing house. The pH was left adjusted, as it was alluded in Section 2.4 that metabolic activities for microorganisms are inhibited at pH values of 9.5 and above or pH values below 4 [23]. The effect of pH on microbial activities is not explicitly accounted for in the current study; however, it can be seen from Figure 2, Figure 3, Figure 4, Figure 5, Figure 6 and Figure 7 that microbial activities were not inhibited despite the pH variation for different batches.
Table 2 presents a summary of similar work conducted on brewery wastewater treatment using a SBR system. The majority of reported studies do not focus on simultaneous COD and phosphorus removal. The high COD removal [18,19,39] compared to the current study, is attributed to high SRT and soluble COD [18,19]. Bakare et al. [39] reported high COD removal efficiency at a HRT of 120 days, which suggests that the brewery wastewater investigated had a high fraction of slowly biodegradable COD. Based on the results presented in Table 2, it is evident that a lot of work must be carried out aimed at investigating simultaneous COD and phosphorus removal from brewery wastewater.

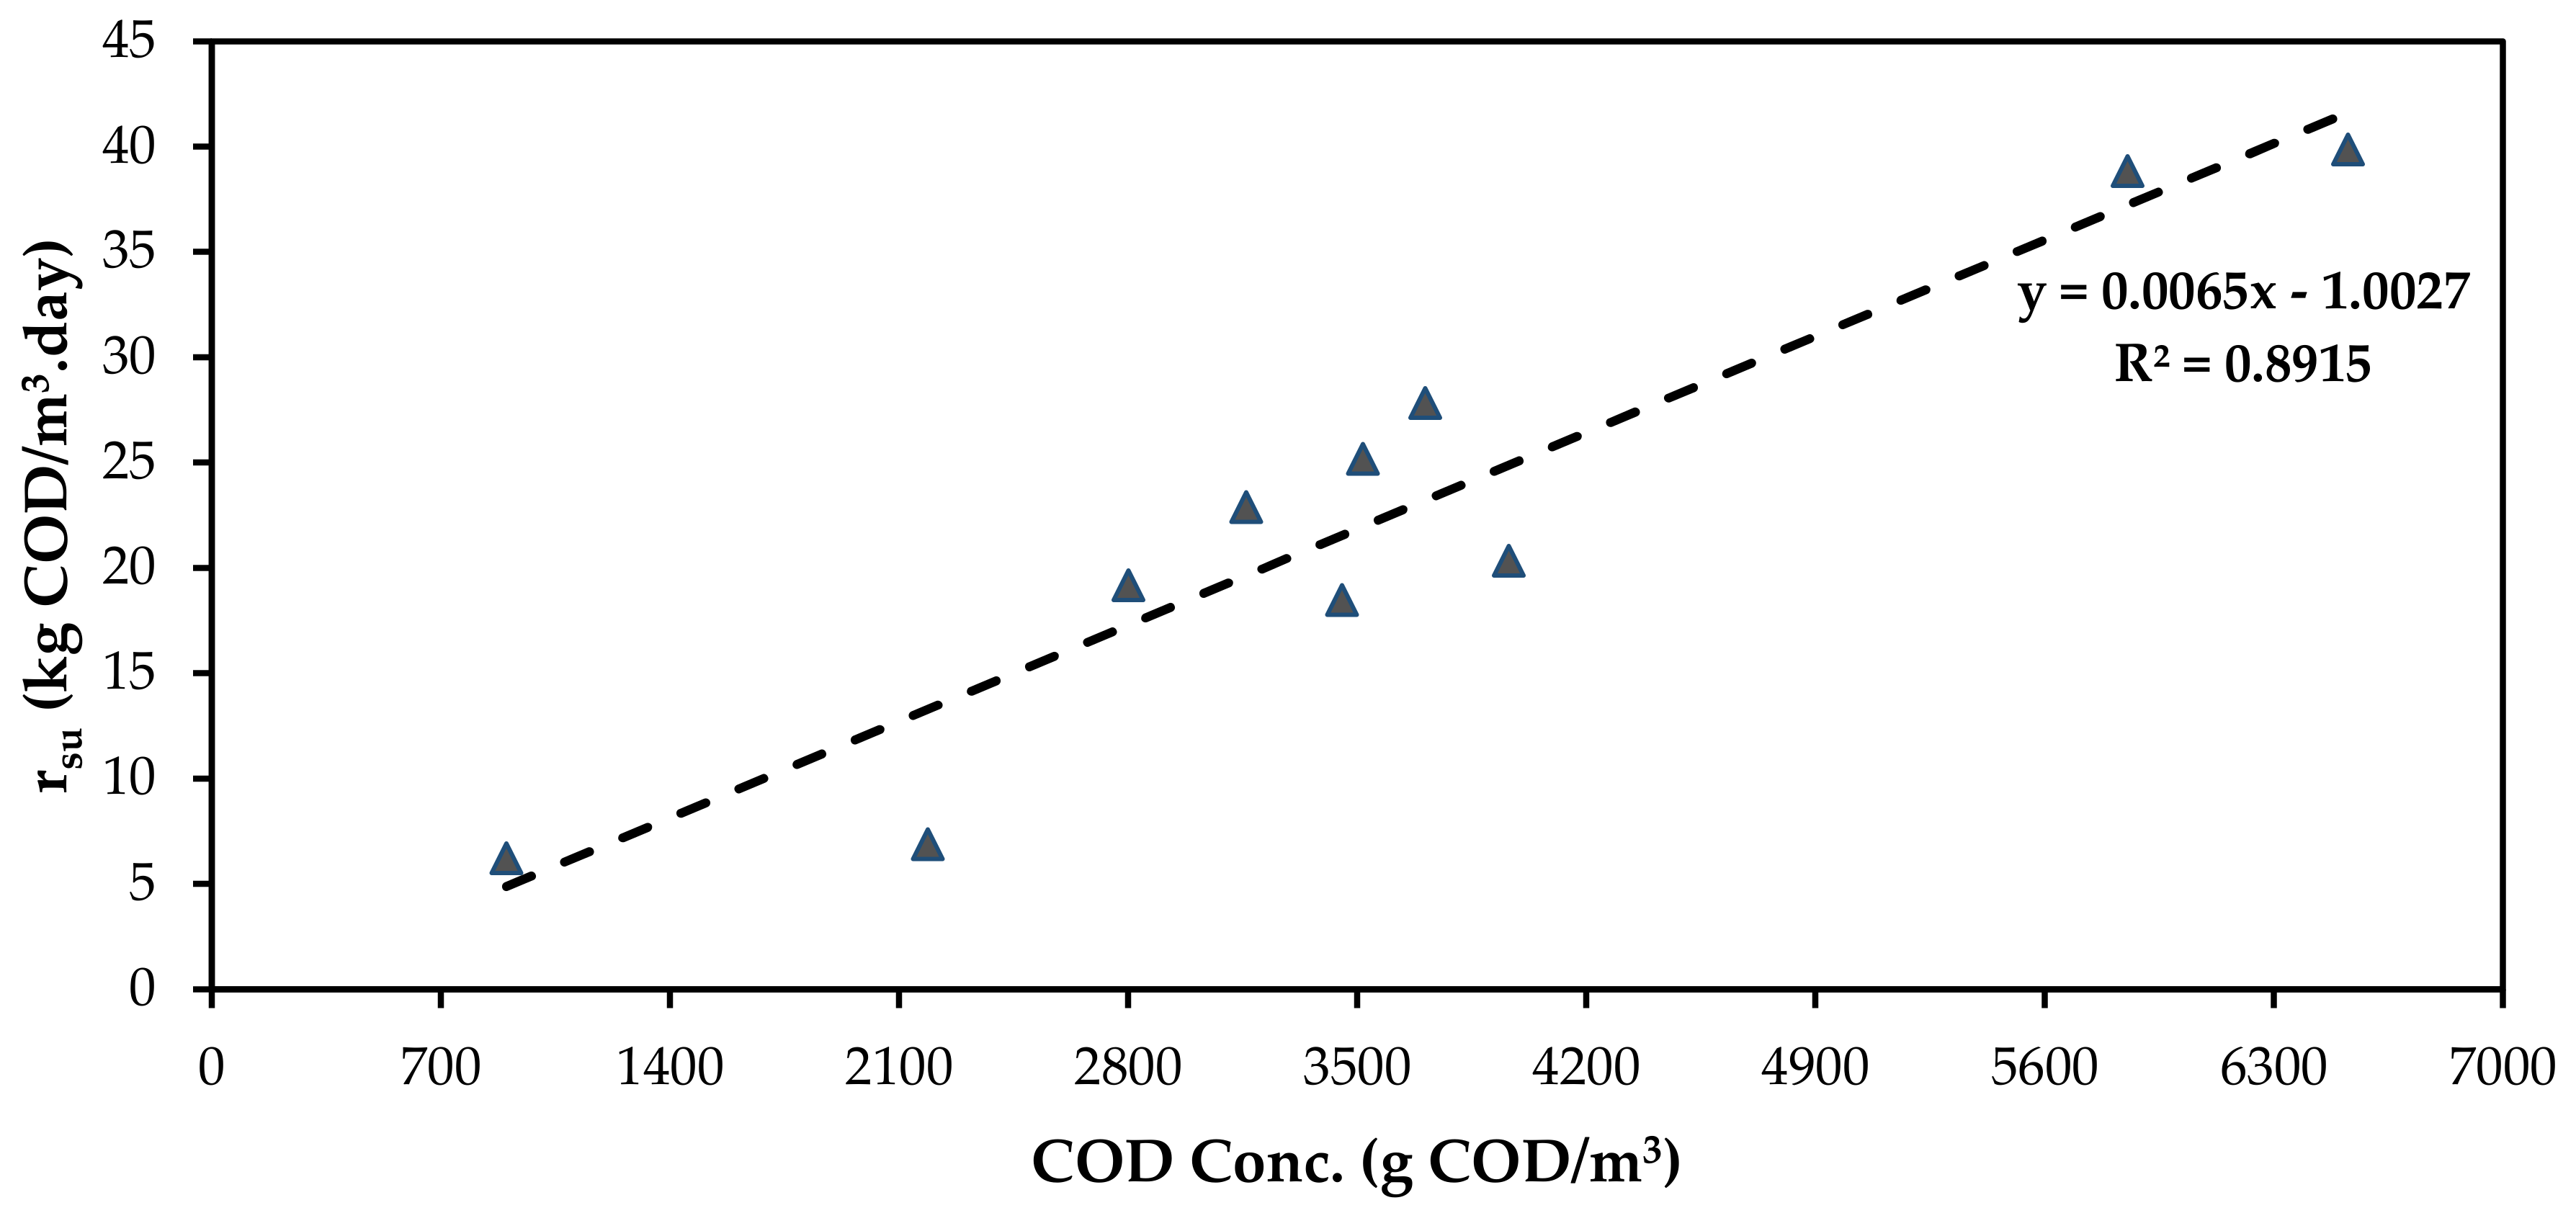
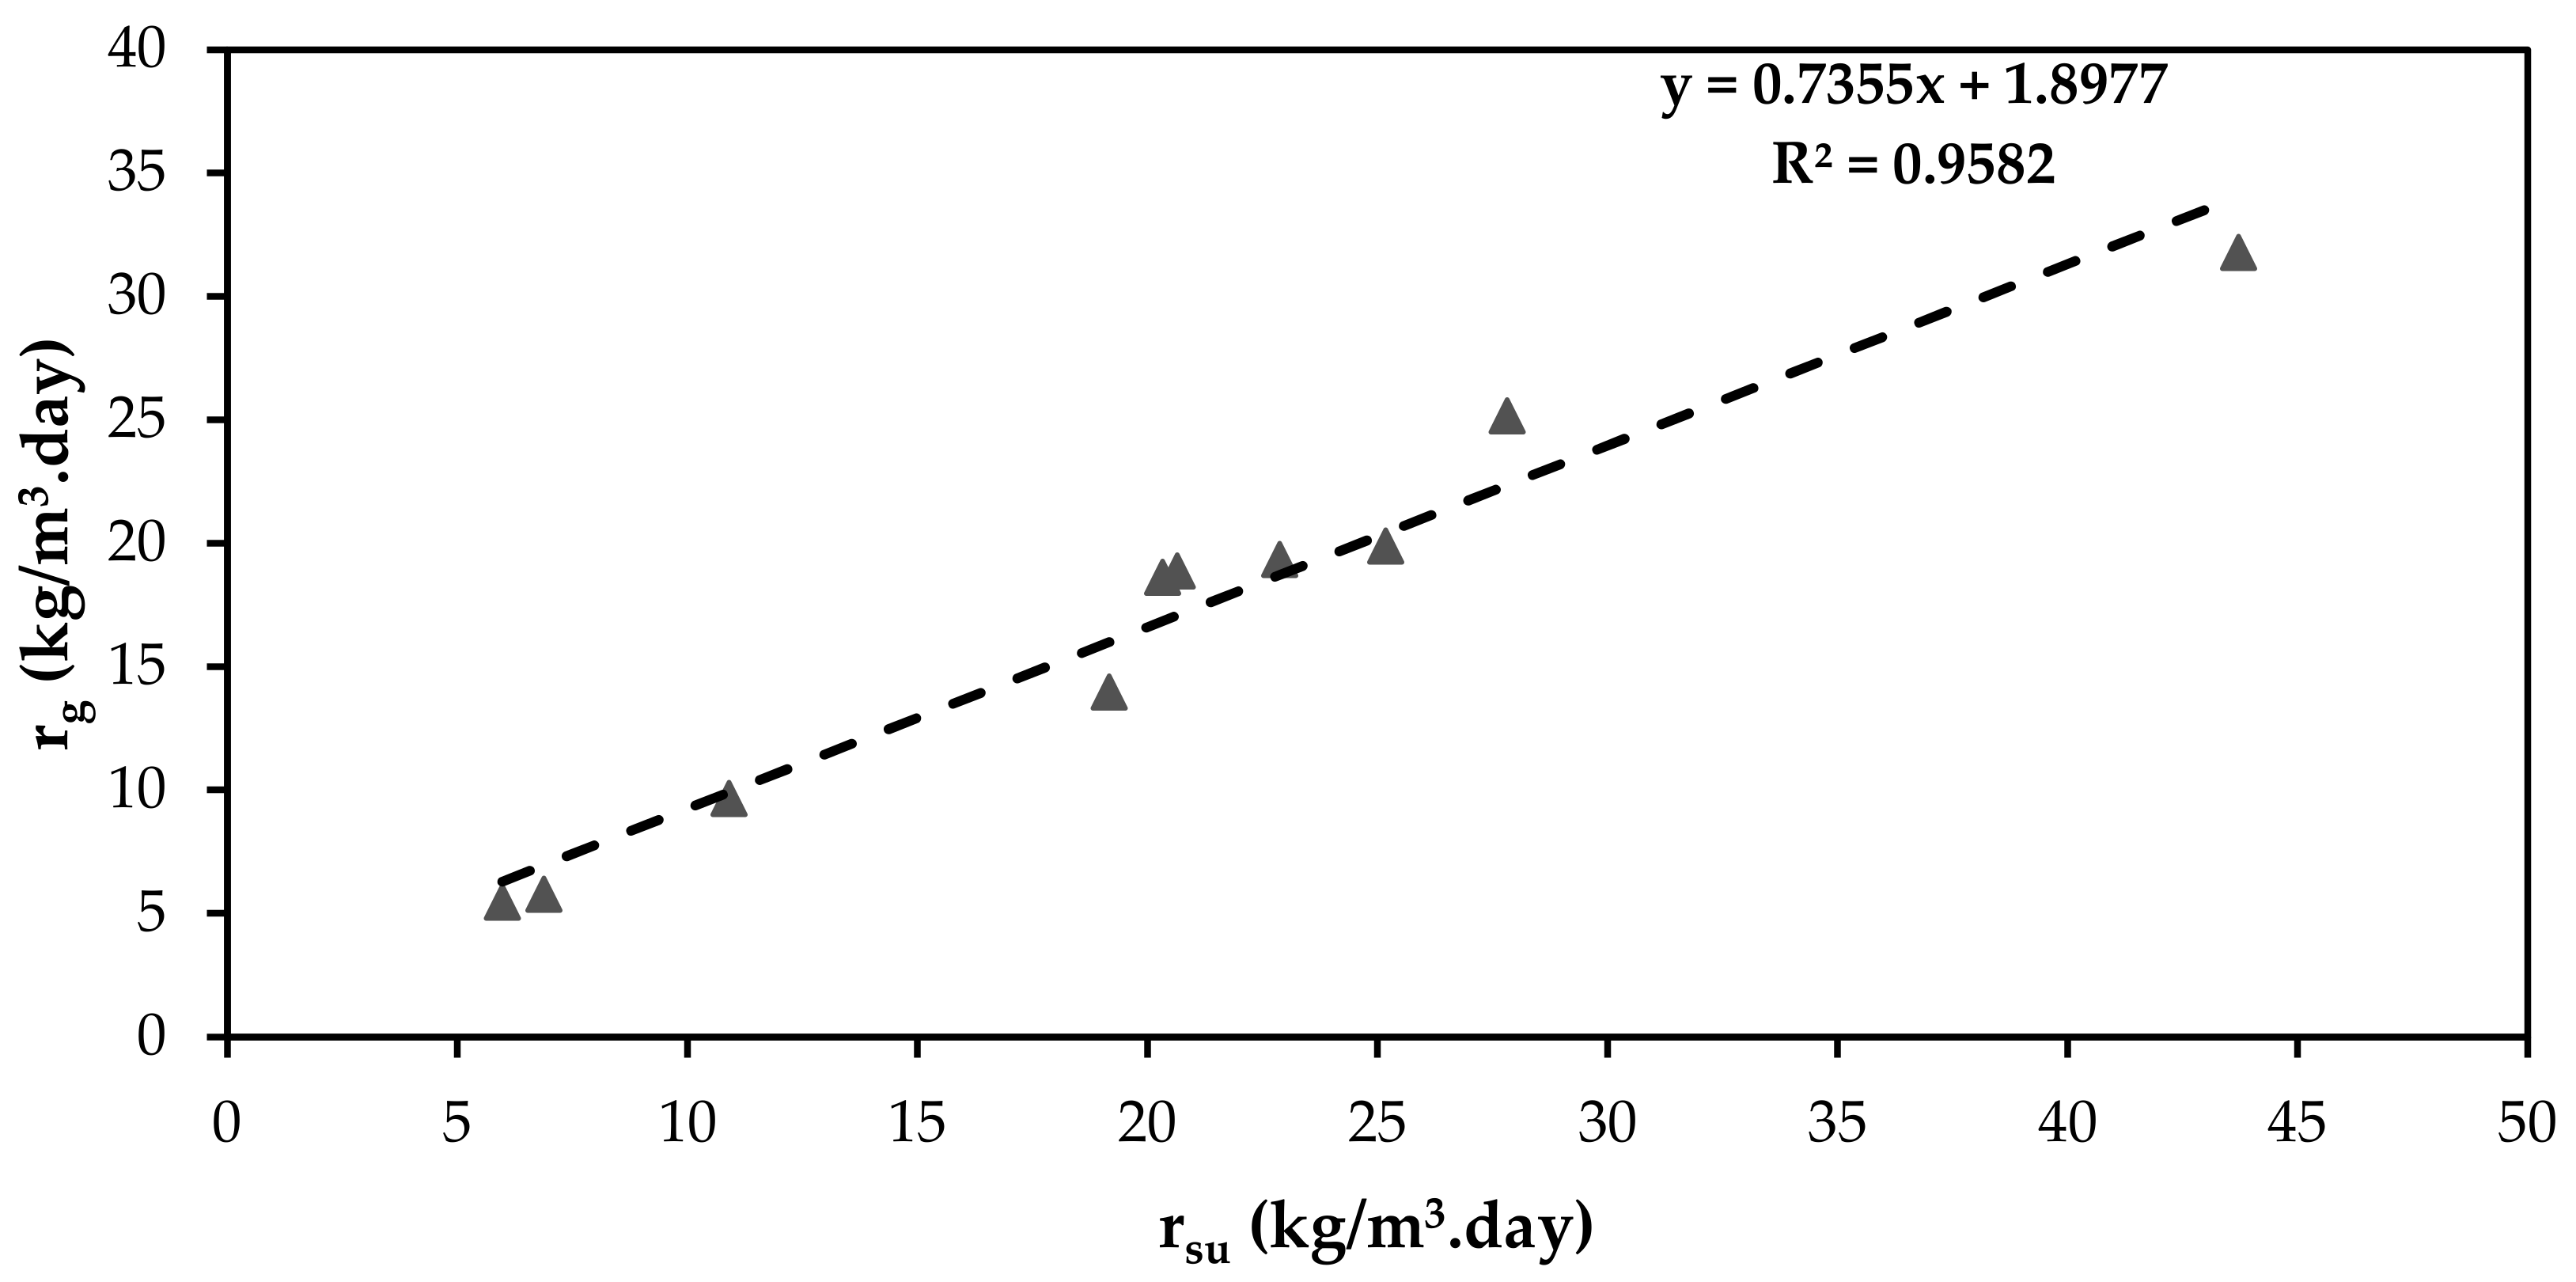
3.5. Substrate Utilisation Rate and Microbial Population Growth Late

From Table 1, it is apparent that the brewery wastewater used in this study had a high COD composition compared to orthophosphates. Hence, COD was considered the microbial substrate. According to the Michaelis–Menten empirical model presented in Equation (2), the substrate utilization rate is directly proportional to the substrate concentration. The findings of the study presented in Figure 8 are congruent to the Michaelis–Menten’s principle on substrate utilization rate. Note that the correlation between the utilization rate and the substrate (COD) concentration gave a coefficient of determination of less than 0.9. This is attributed to the fact that the first three system points which are beneath the trend line gave low substrate utilization rates relative to high COD concentrations. It is worth mentioning that the substrate utilization rate is a function of volatile suspended solids which are considered to be organic bio-solids. Therefore, low substrate utilization rates relative to high COD concentration could be attributed to the reactor influent stream having a high composition of inorganic bio-solids compared to organic bio-solids. Such bio-solid ratios result in low VSS fractions, consequently resulting in low substrate utilization rates despite high COD concentrations. This is accounted for in the findings presented in Table 1 showing a higher TS range compared to VSS.
The relationship between the substrate utilization rate and microbial population growth rate was investigated using the Monod empirical model presented as Equation (3). Figure 9 presents the findings of the current study on the microbial growth rate, which indicates a strong correlation between microbial growth rate and substrate utilization rate. This is explicitly accounted for by the coefficient of determination R2 = 0.9582. Moreover, the findings are congruent to the Monod’s principle on microbial growth rate which clearly states that the substrate utilization rate is directly proportional to the microbial growth. The findings of the study recorded an average microbial growth rate of 16.86 kg/m3.day.

4. Conclusions and Future Perspectives

In this study, the performance of an anaerobic–aerobic SBR for orthophosphate and COD removal from brewery wastewater was investigated. The findings of the study demonstrated good removal efficiencies on orthophosphates ranging from 33 to 81%, recording an overall treatment efficiency of 69%. Additionally, an average COD removal efficiency of 54% was recorded. Moreover, high removal efficiencies of orthophosphates and COD were obtained at a SRT of 3 to 7 days and a HRT of 18 h under mesophilic temperature of ±25 °C. Furthermore, the system did not show any negative effect on orthophosphate removal with the variation in organic volumetric loading rate which ranged from 1.14 to 4.83 kg COD/m3.day. The low removal efficiency of COD maybe attributed to brewery effluent having particulate as well as slowly bio-degradable COD which can be removed by chemical methods. Based on the findings of the study, it can be concluded that the SBR demonstrated good treatment efficiency on orthophosphate removal from brewery wastewater with high-strength organic pollutants. However, the findings on COD suggests that the SBR performance can be improved by incorporating the SBR system with a chemical process aimed at eradicating pollutant fractions which cannot be removed by biological processes.
Despite the good performance of the SBR for the current study and from previous studies as reported in Table 2 on brewery wastewater treatment, none of the reported studies recorded a SBR effluent meeting the dewatering limits as presented in Table 1. This suggests that a lot of work still needs to be carried out on biological COD and orthophosphate removal from brewery wastewater. There are limited studies reporting on optimizing the OVLR to microbial population ratio for optimal biodegradation of organic pollutants. Moreover, more work needs to be carried out on techno-economic analysis for biological wastewater treatment processes integrated with AOPs since it is a promising emerging technology in wastewater treatment.

Author Contributions

Conceptualization, S.M.K., B.F.B. and S.R.; methodology, S.M.K. and E.K.T.; validation, S.M.K., B.F.B., S.R. and E.K.T.; formal analysis, S.M.K. and E.K.T.; investigation, S.M.K.; resources, B.F.B. and S.R.; data curation, S.M.K.; writing—original draft preparation, S.M.K.; writing—review and editing, B.F.B., S.R. and E.K.T.; visualization, S.M.K. and E.K.T.; supervision, B.F.B. and S.R.; project administration, E.K.T.; funding acquisition, B.F.B. and S.R. All authors have read and agreed to the published version of the manuscript.

Funding

This research was funded by the South African National Research Foundation under the Research Development Grants for Y-Rated Researchers, grant number 137765.

Institutional Review Board Statement

Not applicable.

Informed Consent Statement

Not applicable.

Data Availability Statement

Not applicable.

Acknowledgments

The authors wish to express their appreciation to the department of chemical engineering at the Durban University of Technology for proving necessary equipment to make this study a success. The authors also wish to express their appreciation to the department of chemical engineering at the Mangosuthu University of Technology for granting access to their well-equipped research laboratory.

Conflicts of Interest

The authors declare no conflict of interest.

References

  1. Simate, G.S.; Cluett, J.; Iyuke, S.E.; Musapatika, E.T.; Ndlovu, S.; Walubita, L.F.; Alvarez, A.E. The treatment of brewery wastewater for reuse: State of the art. Desalination 2011, 273, 235–247. [Google Scholar] [CrossRef]
  2. Dhakal, N.; Salinas-Rodriguez, S.G.; Hamdani, J.; Abushaban, A.; Sawalha, H.; Schippers, J.C.; Kennedy, M.D. Is Desalination a Solution to Freshwater Scarcity in Developing Countries? Membranes 2022, 12, 381. [Google Scholar] [CrossRef] [PubMed]
  3. Abd-Elaty, I.; Kuriqi, A.; Shahawy, A.E. Environmental rethinking of wastewater drains to manage environmental pollution and alleviate water scarcity. Nat. Hazards 2022, 110, 2353–2380. [Google Scholar] [CrossRef] [PubMed]
  4. Loza, V.; Perona, E.; Mateo, P. Specific responses to nitrogen and phosphorus enrichment in cyanobacteria: Factors influencing changes in species dominance along eutrophic gradients. Water Res. 2014, 48, 622–631. [Google Scholar] [CrossRef]
  5. Qin, B.; Gao, G.; Zhu, G.; Zhang, Y.; Song, Y.; Tang, X.; Xu, H.; Deng, J. Lake eutrophication and its ecosystem response. Chin. Sci. Bull. 2013, 58, 961–970. [Google Scholar] [CrossRef] [Green Version]
  6. Schindler, D.W.; Carpenter, S.R.; Chapra, S.C.; Hecky, R.E.; Orihel, D.M. Reducing phosphorus to curb lake eutrophication is a success. Environ. Sci. Technol. 2016, 50, 8923–8929. [Google Scholar] [CrossRef]
  7. Liu, D.H.; Lipták, B.G. Environmental Engineers’ Handbook, 2nd ed.; CRC Press Company: London, UK, 1997. [Google Scholar]
  8. Homayoun Aria, S.; Asadollahfardi, G.; Heidarzadeh, N. Eutrophication modelling of Amirkabir Reservoir (Iran) using an artificial neural network approach. Lakes Reserv. Res. Manag. 2019, 24, 48–58. [Google Scholar] [CrossRef] [Green Version]
  9. Atalay, S.; Ersöz, G. Advanced Oxidation Processes. In Novel Catalysts in Advanced Oxidation of Organic Pollutants; Springer: Cham, Swizerland, 2016; pp. 23–34. [Google Scholar]
  10. Lu, X.; Zhen, G.; Estrada, A.L.; Chen, M.; Ni, J.; Hojo, T.; Kubota, K.; Li, Y.Y. Operation performance and granule characterization of upflow anaerobic sludge blanket (UASB) reactor treating wastewater with starch as the sole carbon source. Bioresour. Technol. 2015, 180, 264–273. [Google Scholar] [CrossRef]
  11. Chen, H.; Chang, S.; Guo, Q.; Hong, Y.; Wu, P. Brewery wastewater treatment using an anaerobic membrane bioreactor. Biochem. Eng. J. 2016, 105, 321–331. [Google Scholar] [CrossRef]
  12. Corsino, S.F.; di Biase, A.; Devlin, T.R.; Munz, G.; Torregrossa, M.; Oleszkiewicz, J.A. Effect of extended famine conditions on aerobic granular sludge stability in the treatment of brewery wastewater. Bioresour. Technol. 2017, 226, 150–157. [Google Scholar] [CrossRef] [Green Version]
  13. Enitan, A.M.; Adeyemo, J.; Kumari, S.K.; Swalaha, F.M.; Bux, F. Characterization of brewery wastewater composition. Int. J. Environ. Ecol. Eng. 2015, 9, 1073–1076. [Google Scholar] [CrossRef]
  14. Khumalo, S.M. Biological Nutrient Removal from Industrial Wastewater Using a Sequencing Batch Reactor. Master’s Thesis, Durban University of Technology, Durban, South Africa, 2018. [Google Scholar]
  15. Goldammer, T. The Brewers’ Handbook; Keen Vision Publishing, LLC: Jordan, MN, USA, 1999. [Google Scholar]
  16. Werkneh, A.A.; Beyene, H.D.; Osunkunle, A.A. Recent advances in brewery wastewater treatment; approaches for water reuse and energy recovery: A review. Environ. Sustain. 2019, 2, 199–209. [Google Scholar] [CrossRef]
  17. Enitan, A.M.; Swalaha, F.M.; Adeyemo, J.; Bux, F. Assessment of brewery effluent composition from a beer producing industry in KwaZulu-Natal, South Africa. Fresenius Environ. Bull. 2014, 23, 693–701. [Google Scholar]
  18. Shao, X.; Peng, D.; Teng, Z.; Ju, X. Treatment of brewery wastewater using anaerobic sequencing batch reactor (ASBR). Bioresour. Technol. 2008, 99, 3182–3186. [Google Scholar] [CrossRef]
  19. Wang, S.G.; Liu, X.W.; Gong, W.X.; Gao, B.Y.; Zhang, D.H.; Yu, H.Q. Aerobic granulation with brewery wastewater in a sequencing batch reactor. Bioresour. Technol. 2007, 98, 2142–2147. [Google Scholar] [CrossRef]
  20. Rodrigues, A.C.; Brito, A.G.; Melo, L.F. Posttreatment of a brewery wastewater using a sequencing batch reactor. Water Environ. Res. 2001, 73, 45–51. [Google Scholar] [CrossRef] [Green Version]
  21. Ling, L.; Lo, K. Brewery wastewater treatment using suspended and attached growth sequencing batch reactors. J. Environ. Sci. Health A 1999, 34, 341–355. [Google Scholar] [CrossRef]
  22. Chan, C.; Guisasola, A.; Baeza, J.A. Enhanced Biological Phosphorus Removal at low Sludge Retention Time in view of its integration in A-stage systems. Water Res. 2017, 118, 217–226. [Google Scholar] [CrossRef]
  23. Tchobanoglous, G. Wastewater Engineering: Treatment and Resource Recovery Volume 2; McGraw-Hill: New York, NY, USA, 2014. [Google Scholar]
  24. Wang, X.; Wang, S.; Xue, T.; Li, B.; Dai, X.; Peng, Y. Treating low carbon/nitrogen (C/N) wastewater in simultaneous nitrification-endogenous denitrification and phosphorous removal (SNDPR) systems by strengthening anaerobic intracellular carbon storage. Water Res. 2015, 77, 191–200. [Google Scholar] [CrossRef]
  25. Ge, H.; Batstone, D.J.; Keller, J. Biological phosphorus removal from abattoir wastewater at very short sludge ages mediated by novel PAO clade Comamonadaceae. Water Res. 2015, 69, 173–182. [Google Scholar] [CrossRef] [Green Version]
  26. Koe, W.S.; Lee, J.W.; Chong, W.C.; Pang, Y.L.; Sim, L.C. An overview of photocatalytic degradation: Photocatalysts, mechanisms, and development of photocatalytic membrane. Environ. Sci. Pollut. Res. 2020, 27, 2522–2565. [Google Scholar] [CrossRef] [PubMed]
  27. Bhatkhande, D.S.; Pangarkar, V.G.; Beenackers, A.A.C.M. Photocatalytic degradation for environmental applications—A review. J. Chem. Technol. Biotechnol. 2002, 77, 102–116. [Google Scholar] [CrossRef]
  28. Jia, C.; Wang, Y.; Zhang, C.; Qin, Q. UV-TiO2 photocatalytic degradation of landfill leachate. Water Air Soil Pollut. 2011, 217, 375–385. [Google Scholar] [CrossRef]
  29. Cailotto, S.; Massari, D.; Gigli, M.; Campalani, C.; Bonini, M.; You, S.; Vomiero, A.; Selva, M.; Perosa, A.; Crestini, C. N-Doped Carbon Dot Hydrogels from Brewing Waste for Photocatalytic Wastewater Treatment. ACS Omega 2022, 7, 4052–4061. [Google Scholar] [CrossRef]
  30. Wani, A.; Bhasarkar, J.B.; Gaikwad, R. Photocatalytic Degradation of Sugar and Distillery Industry Effluent. J. Inst. Eng. Ser. E 2021, 103, 1–8. [Google Scholar] [CrossRef]
  31. Micheal, K.; Ayeshamariam, A.; Boddula, R.; Arunachalam, P.; AlSalhi, M.S.; Theerthagiri, J.; Prasad, S.; Madhavan, J.; Al-Mayouf, A.M. Assembled composite of hematite iron oxide on sponge-like BiOCl with enhanced photocatalytic activity. Mater. Sci. Energy Technol. 2019, 2, 104–111. [Google Scholar] [CrossRef]
  32. Ghernaout, D.; Elboughdiri, N. Advanced oxidation processes for wastewater treatment: Facts and future trends. Open Access Libr. J. 2020, 7, 1–15. [Google Scholar] [CrossRef]
  33. Chen, D.; Cheng, Y.; Zhou, N.; Chen, P.; Wang, Y.; Li, K.; Huo, S.; Cheng, P.; Peng, P.; Zhang, R.; et al. Photocatalytic degradation of organic pollutants using TiO2-based photocatalysts: A review. J. Clean. Prod. 2020, 268, 121725. [Google Scholar] [CrossRef]
  34. APHA. Standard Methods for the Examination of Water and Wastewater; American Public Health Association: Washington, DC, USA, 2005. [Google Scholar]
  35. Shabangu, K.P. Aerobic Sequencing Batch Reactor for the Treatment of Industrial Wastewater from the Brewery. Master’s Thesis, Durban University of Technology, Durban, South Africa, 2017. [Google Scholar]
  36. Shabangu, K.P.; Bakare, B.F. Study of an SBR Treating Brewery Wastewater: Case of COD-HRT and BOD Removal. In Proceedings of the World Congress on Engineering and Computer Science, San Francisco, CA, USA, 22–24 October 2019. [Google Scholar]
  37. Khumalo, S.M.; Bakare, B.F.; Rathilal, S.; Tetteh, E.K. Characterization of South African Brewery Wastewater: Oxidation-Reduction Potential Variation. Water 2022, 14, 1604. [Google Scholar] [CrossRef]
  38. Carucci, A.; Lindrea, K.; Majone, M.; Ramadori, R. Different mechanisms for the anaerobic storage of organic substrates and their effect on enhanced biological phosphate removal (EBPR). Water Sci. Technol. 1999, 39, 21–28. [Google Scholar] [CrossRef]
  39. Bakare, B.; Shabangu, K.; Chetty, M. Brewery wastewater treatment using laboratory scale aerobic sequencing batch reactor. S. Afr. J. Chem. Eng. 2017, 24, 128–134. [Google Scholar] [CrossRef]
Figure 1. SBR isometric view: (1) table, (2) SBR holding tank, (3) centrifugal pump, (4) influent feed stream, (5) SBR vessel, (6) effluent sample point 1, (7) effluent sample point 2, (8) sludge discharge stream, (9) aerator pump, (10) manifold, and (11) oxygen aerator pipe [35].
Fermentation 08 00296 g001
Figure 2. Orthophosphate concentration as a function of HRT profile.
Fermentation 08 00296 g002
Figure 3. Orthophosphate removal with SRT variation.
Fermentation 08 00296 g003
Figure 4. COD removal with SRT variation.
Fermentation 08 00296 g004
Figure 5. Orthophosphate removal with variation in OVLR.
Fermentation 08 00296 g005
Figure 6. COD removal with variation in OVLR.
Fermentation 08 00296 g006
Figure 7. Orthophosphate and TCOD removal profile.
Fermentation 08 00296 g007
Figure 8. Substrate utilization rate as a function of COD concentration (g COD/m3).
Fermentation 08 00296 g008
Figure 9. Microbial population growth rate as a function of substrate utilization rate.
Fermentation 08 00296 g009
Table 2. Summary of studies on brewery wastewater treatment using a SBR system.
Treatment MethodCOD, %TP, %HRT, HoursSRT, DaysOVLR,
kg COD/m3.day
Reference
Anaerobic SBR>90-24601.5–5[13]
Aerobic SBR88.7-15903.5[14]
Aerobic SBR90-120--[26]
Aerobic–anaerobic SBR54691871.4–4.1Present study
Publisher’s Note: MDPI stays neutral with regard to jurisdictional claims in published maps and institutional affiliations.

