Article

Comparison of Secondary Metabolite Contents and Metabolic Profiles of Six Lycoris Species

1
Department of Crop Science, Chungnam National University, 99 Daehak-Ro, Yuseong-gu, Daejeon 34134, Korea
2
Division of Life Sciences, College of Life Sciences and Bioengineering, Incheon National University, Yeonsugu, Incheon 22012, Korea
3
Department of Well-being Resources, Sunchon National University, Suncheon, Jeollanam-do 57922, Korea
4
Department of Smart Agriculture Systems, Chungnam National University, 99 Daehak-Ro, Yuseong-gu, Daejeon 34134, Korea
*
Authors to whom correspondence should be addressed.
Hyeon Ji Yeo and Ye Jin Kim contributed equally to this work.
Submission received: 22 November 2020 / Revised: 22 December 2020 / Accepted: 23 December 2020 / Published: 5 January 2021

Abstract

:
Quantitative HPLC analysis was performed on six different species of Lycoris herbs to investigate variation in phytochemical content, especially galantamine and phenylpropanoid-derived compounds. The contents of these compounds differed widely among the Lycoris species, with L. radiata and L. chinensis containing the lowest and highest galantamine contents, respectively. Specifically, the galantamine content of L. radiata was 62.5% higher than that of L. chinensis. Following L. radiata, L. sanguinea contained the next highest galantamine content, which was 59.1% higher than that of L. chinensis. Furthermore, a total of 12 phenylpropanoid-derived compounds were found in the different Lycoris species, where L. sanguinea, L. squamigera, and L. uydoensis had the largest accumulation of these compounds. The total phenylpropanoid content of L. sanguinea was the highest, while that of L. radiata was the lowest. Seven of the phenylpropanoid-derived compounds, rutin, quercetin, catechin, epicatechin gallate, chlorogenic acid, benzoic acid, and kaempferol, were dominant. L. sanguinea, L. uydoensis, and L. squamigera showed amounts of these seven compounds that were 5–6 times greater than those of the other species in the study. To the best of our knowledge, our results provide the most detailed phytochemical information on these species to date, which is valuable for future applications using these medicinal plants.

1. Introduction

The Amaryllidaceae family is composed of 80 genera with approximately 1600 species [1] that are dispersed throughout the warm and moist woodlands of Eastern Asia (Japan, China, and Korea), with a few species extending to Nepal and northern Indochina [2]. Plants in the Lycoris genus fall under this family, and among them, Lycoris chinensis var. sinuolata K.H. Tae & S.C. Ko are legally protected species, while Lycoris uydoensis M.Y. Kim, Lycoris chejuensis K.H. Tae & S.C. Ko, and Lycoris sanguinea var. koreana (Nakai) T. Koyama are rare species distributed in South Korea [3].
The representative Lycoris species in Korea are L. chinensis var. sinuolata, L. chejuensis, L. uydoensis, L. squamigera, L. sanguinea var. koreana, and L. radiata [4]. Numerous studies have been conducted with Lycoris spp. in many research fields, such as evolutionary biology, molecular biology, genetics, and biochemistry.
Lycoris plant bulbs have been used in China as an herbal medicine to treat poliomyelitis, furuncle, tympanitis, suppurative wounds, ulcers, mastitis, laryngeal trouble, and carbuncles [5,6]. Furthermore, the Lycoris bulb contains abundant amounts of lycorine, galantamine, and other alkaloid compounds that possess important medicinal value [7]. It is believed that plants of the Amaryllidaceae family have been utilized for thousands of years as herbal remedies [8]. Furthermore, numerous studies have demonstrated the pharmaceutical activities of Amaryllidaceae alkaloids (AAs), such as anti-malarial, anti-tumor, and acetylcholinesterase inhibitory activities [9,10,11,12,13,14,15,16]. The L. radiata species has various biologically active chemicals, including lycoricidinoal, lycorin, lycoricidine, galantamine, lycoramine, galantamine n-oxide, tazettine, vittatine, lycoramine, hemanthidine, O-methylycorenine, O-demethyhomolycorine, dipalmitoylphosphatidylcholine, O-demethyllycoramine, and homolycorine n-oxide [4,17,18].
Galantamine is the main alkaloid found in the flowers and bulbs of Galanthus spp. and other related genera, including Leucojum spp., Lycoris spp., and Narcissus spp. Galantamine is often used as an Alzheimer’s disease (AD) painkiller and for AD treatments, where it activates the allosteric properties of nicotinic acetylcholine receptors (nAChRs) and increases their sensitivity to acetylcholine (ACh). In addition, the substance inhibits acetylcholinesterase (AChE), providing the cholinergic synapses with Ach [19,20].
Phenylpropanoids are one of the largest secondary metabolite groups that protect plants against physical, environmental, and biological stresses including physical wounds, pathogens, insect attacks, excess ultraviolet UV radiation, exposure to excess light, as well as high and low temperatures [21]. Moreover, Park et al. [19] reported that dietary phenolic compounds exhibit anti-estrogenic, antimicrobial, and antioxidant properties and have helped prevent cardiovascular disease and cancer. Therefore, the consumption of plant phenylpropanoids is highly recommended to improve human health [22].
Metabolomic profiling provides insight into the understanding of cellular biology by identifying and quantifying various internal metabolites. Thus, an accurate measurement of diverse metabolites is required. Among the several analytical platforms for metabolic profiling, gas chromatography (GC) time-of-flight mass spectrometry (GC-TOFMS) has been considered very reliable because of its excellent mass accuracy, range, and resolution. It also has a fast scanning time, high sensitivity, and has successfully identified and quantified a wide range of endogenous plant metabolites in various research fields [23,24,25].
This GC-TOFMS-based metabolic profiling has also been coupled with chemometrics to identify plant species [26,27]. We have previously performed transcriptome analysis and metabolic profiling of L. radiata [24]; however, to the best of our knowledge, few investigations have compared the metabolome of different Lycoris species. Therefore, this study aimed to provide information on endogenous metabolites (sugars, sugar alcohols, amino acids, organic acids, galantamine, and phenylpropanoids) from the bulbs of six Lycoris spp. by high-performance liquid chromatography (HPLC).

2. Materials and Methods

2.1. Plant Materials, Experimental Design, and Cultural Management

The bulbs of six Lycoris species, L. sanguinea var. koreana (Nakai) T. Koyama, L. squamigera Maxim., L. radiata (L’ Herit) Herb., L. uydoensis M. Y. Kim, L. chejuensis K. H. Tae & S. C. Ko, and L. chinensis var. sinuolata K. H. Tae & S. C. Ko, having diameters of 4.0 ± 0.5 cm were used in this study. The bulbs of the six species were collected from Flower Seed Mall, Gwangju, Gyeonggi-do, Korea. The experiment was conducted in plastic tray-type pots with 58 cm × 18 cm dimensions. In each pot, there were 15 bulbs of each species. The experiment was conducted as a completely randomized design (CRD). Pots were filled with commercial ‘Horticulture Nursery Media’ soil (Punong Co., Gyeongju-si, South Korea), respectively, and shallow planting depth is 1 cm. Three independent biological replicates were used for each species and one biological replicate consisted of five bulbs, thus, there were 15 bulbs for each species. The bulbs were grown in a PVC vinyl greenhouse located at Chungnam National University (36°22′08.0″ N 127°21′14.2″ E) from July to September. The plants were watered with 500 mL per pot once weekly. Temperature conditions, relative humidity, and daylight hours in Daejeon, South Korea were represented in Figure S1. These bulbs were washed with tap-water after harvest and frozen in liquid nitrogen. Then, the harvested bulbs were ground in liquid nitrogen using a mortar and pestle. The powdered samples were freeze-dried for the HPLC and GC-TOFMS analyses. All the metabolites identified in the six different Lycoris species were shown in Table S1. Analysis of variance (ANOVA) and Duncan’s multiple range tests (DMRT) to compare means were performed with the data.

2.2. HPLC Analysis and Extraction of Galantamine

Extraction of galatamine using a previously reported method with slight modifications was used [24]. Using 100 mg dry weight (DW) of powdered tissue, trifluoroacetic acid (0.1%, v/v) in water (2 mL) was added, voltexed, and sonicated (1 h). The samples were left overnight at 4 °C. Afterward, the samples were sonicated for another 30 min and then centrifuged (16,300× g, 20 min, 4 °C). The supernatant was filtered and transferred into vials using a 0.45 μm Acrodisc syringe filter (Pall Corporation, Port Washington, NY, USA). An NS-4000 HPLC system coupled with an NS-6000 auto-sampler and UV–VIS detector (FUTECS Corporation, Daejeon, Korea) was used for galantamine quantification. An OptimaPak C18 column (250 × 4.6 mm2, 5 μm, RStech Corporation, Daejeon, Korea) was used to separate galantamine using a mobile phase of (A) 50 mM ammonium formate aqueous buffer and (B) acetonitrile. A flow rate of 1 mL/min, oven temperature of 30 °C, a wavelength of detection of 285 nm, and an injection volume of 20 μL were used. A gradient program of A: B was set as follows: A; 98% (0–15 min), A; 98–35% (15–30 min), A; 35–0% (30–31 min), A; 0% (31–35 min), A; 0–98% (35–36 min), and A; 98% (36–38 min). A refined galantamine standard (ChemFaces (Korea)) was used. The calibration curve was plotted using six different concentrations of galantamine to increase accuracy, and the linear equation was y = 12.7704 × −12.5000 (R2 = 0.9996). The values were presented as mean ± standard deviation.

2.3. GC-TOFMS Analysis

A previous study described a method to analyze sugars, organic acids, sugar alcohols, and amino acids in the bulbs of the six Lycoris species [24]. Here, a chloroform: methanol: water (1 mL, 1:2.5:1, v/v/v) solution and 0.06 mL of ribitol (0.2 g/L) as an internal standard (IS) were added to the bulb powder (10 mg DW) in a 2 mL tube. The sample was extracted using a compact thermomixer (Model 5355, Eppendorf AG, Hamburg, Germany) at 37 °C and 196× g for 30 min. After centrifuging the mixture at 4 °C and 16,000× g for 5 min, the upper layer (0.8 mL) was transferred to a glass tube. Then, 0.4 mL of deionized water was added to the tube, and the mixture was centrifuged at 4 °C and 16,000× g for 5 min. Next, the supernatant (0.9 mL) was evaporated in a speedVac vacuum concentrator for a maximum of 3 h (VS-802F, Visionbionex, Gyeonggi, Korea). The concentrated sample was then lyophilized using a freeze-dryer (MCFD8512, Ilshin, Gyeonggi-do, South Korea) for 16 h. After drying, 0.08 mL of methoxylamine hydrochloride (20 g/L) was added to derivatize the sample and reacted at 196× g and 30 °C for 90 min. The sample was then mixed with 0.08 mL of n-methyl-n-(trimethylsilyl) trifluoroacetamide at 196× g and 37 °C for 30 min. Finally, for GC-TOFMS analysis, the derivatized sample was injected into an Agilent 7890B GC system (Agilent, Santa Clara, CA, USA) equipped with a CP-Sil 8 CBLow Bleed/MS (30 m × 0.25 mm × 0.25 mm; CP 5860, Agilent) column and a LECO Pegasus BT TOF mass spectrometer (LECO, St. Joseph, MI, USA). The column temperature was maintained at 80 °C for 2 min, then raised to 320 °C at a rate of 15 °C/min and held at this level for 10 min. The ion-source temperatures, transfer line, and front inlet were set to 280, 280, and 230 °C, respectively. Helium was used as the carrier gas at a flow rate of 1 mL/min. The injection volume was 1 μL, and the split ratio was 1:25. The scanned mass range was 85–600 m/z. ChromaTOF software (version4.51; LECO) was used to identify the metabolites by comparing their retention times and mass spectra with standard compounds, an in-house library, and an MS library (NIST and Wiley9). Quantification was performed using the ratio of the analyte peak area to IS peak area. Three biological replicates were performed for each sample.

2.4. Statistical Analysis

The data of this study were analyzed by analysis of variance (ANOVA) with Duncan’s multiple range tests (DMRTs) to compare means at α < 0.05 using SAS program (software Ver. 9.4, 2013; SAS Institute, Inc., Cary, NC, USA). The quantified GC-TOFMS data underwent unit variance scaling before all the variables were subjected to principal component analysis (PCA) using SIMCA-P (software Ver. 14.1; Umetrics, Umeå, Sweden). All figures and tables are presented as the mean ± standard deviation.

3. Results

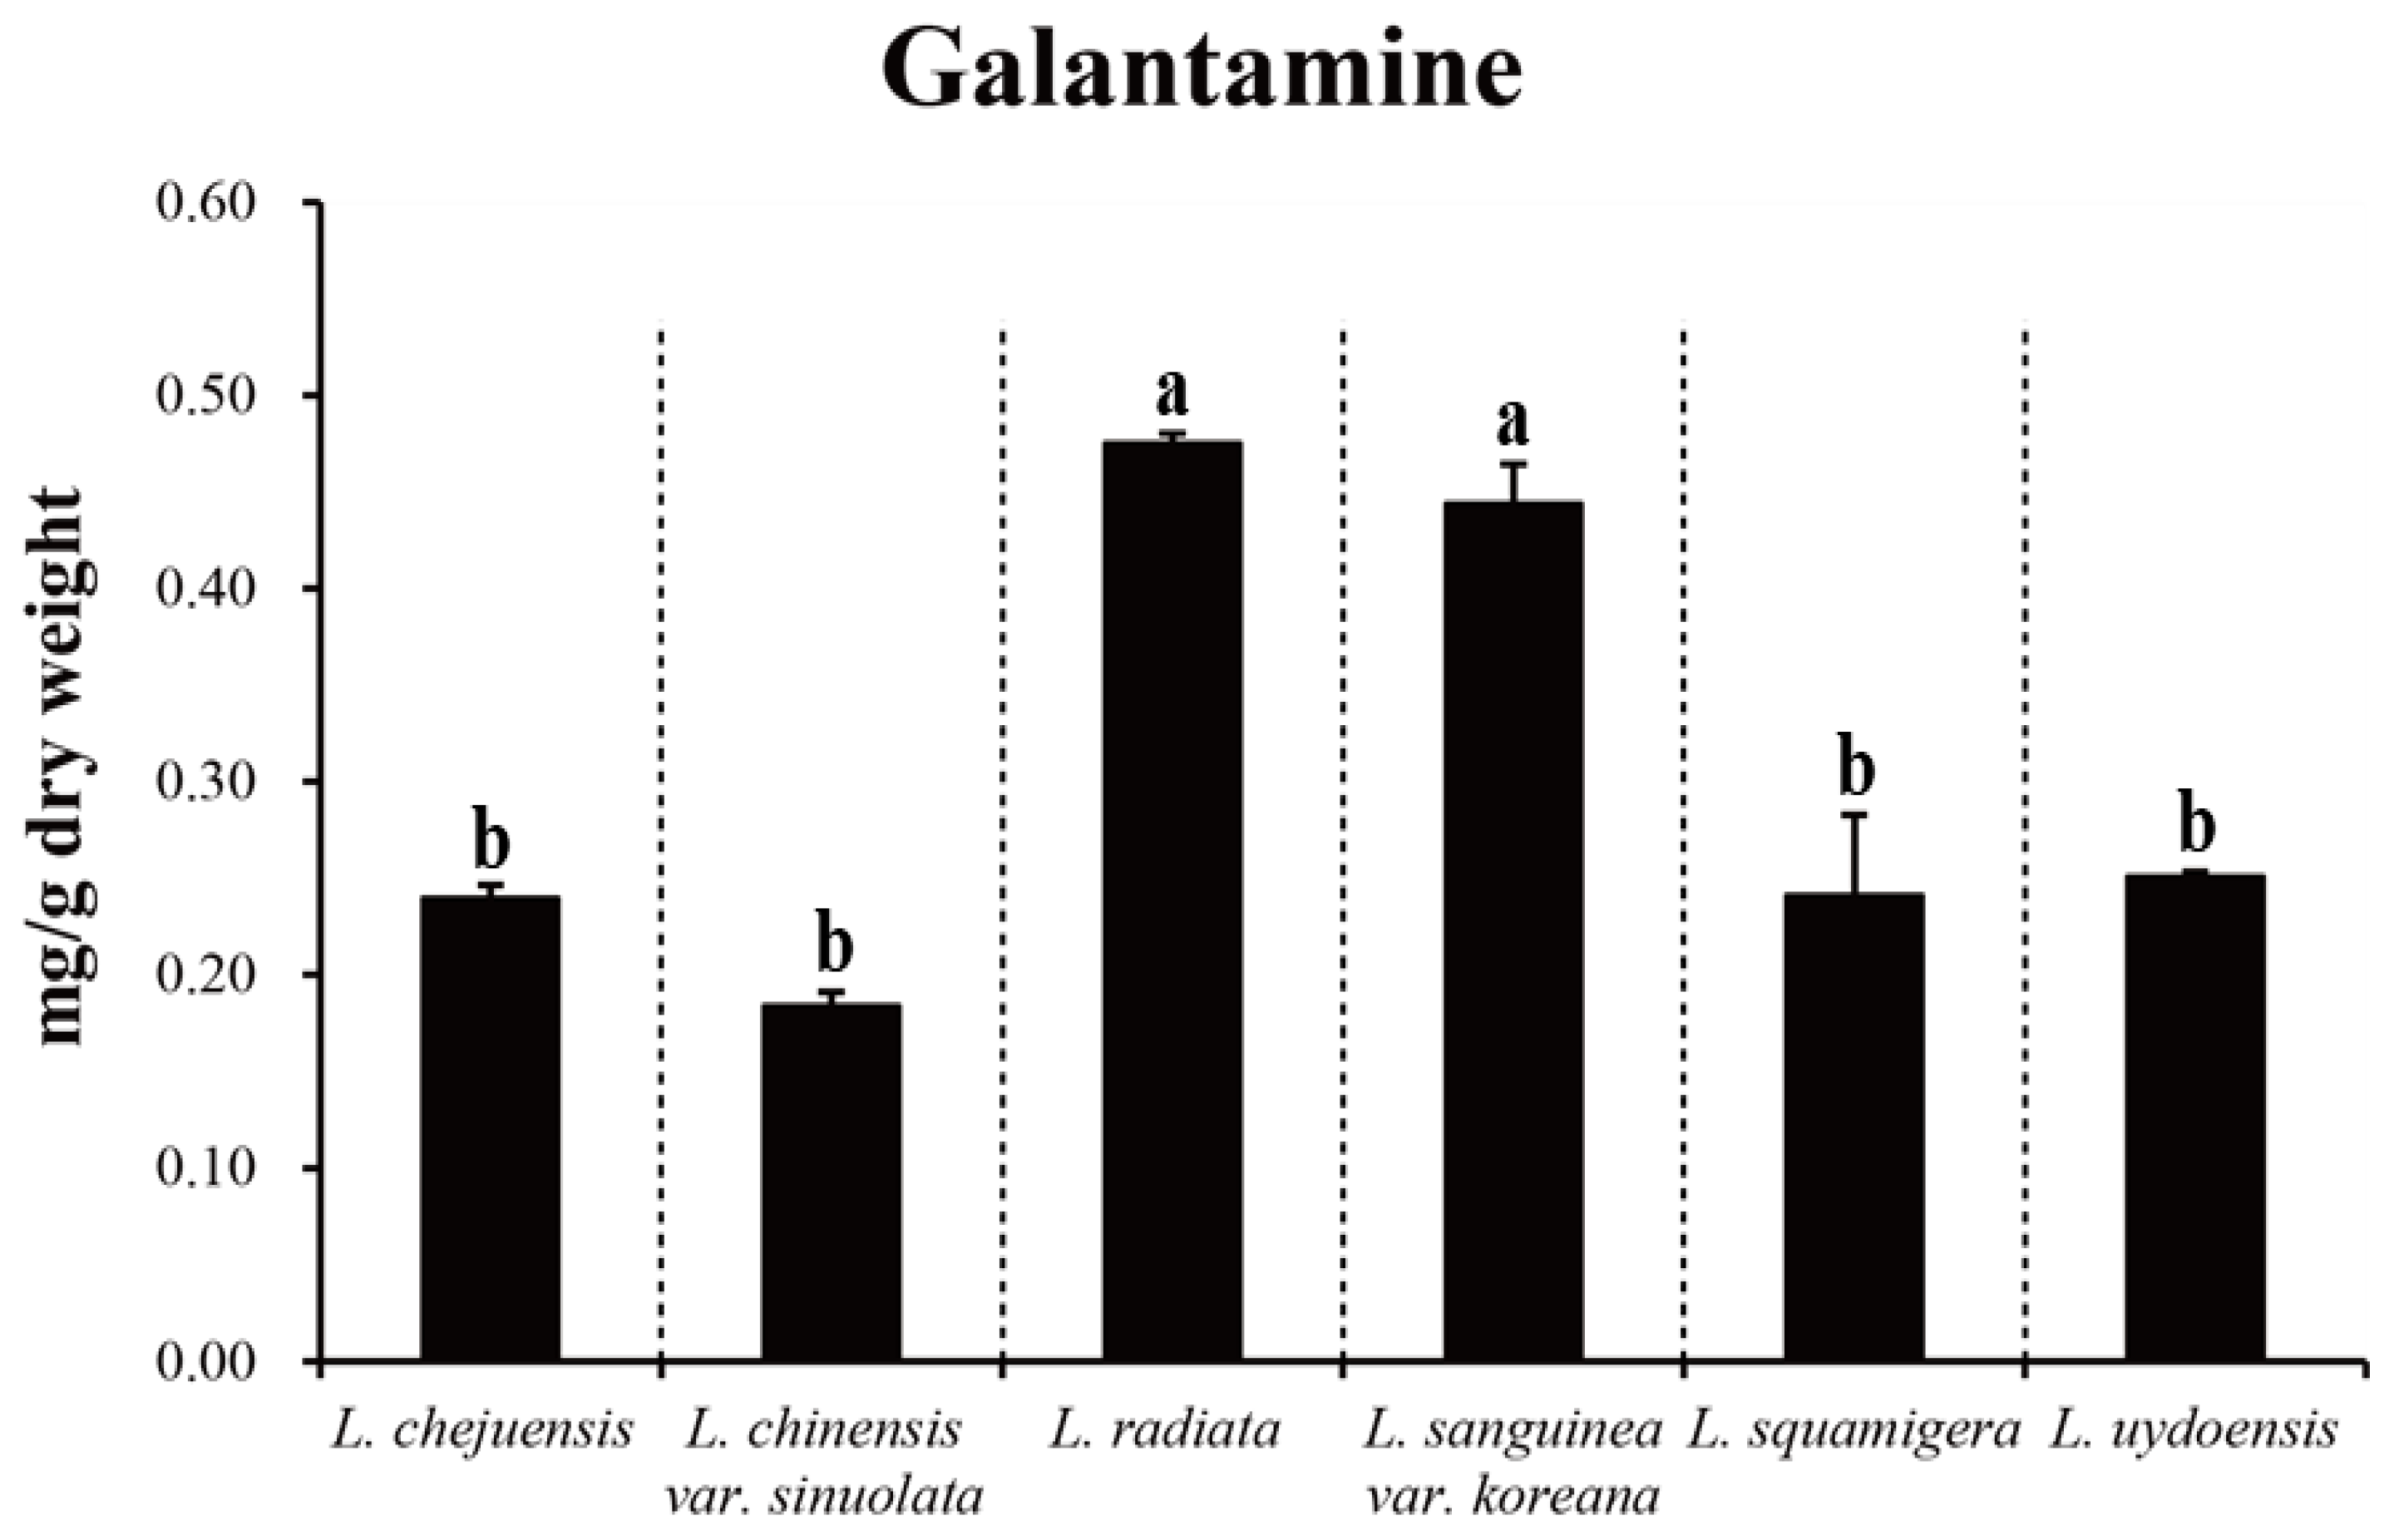
3.1. Subsection Variation of Galantamine Content Among the Lycoris spp.

The galantamine content varied greatly among the Lycoris species (Figure 1), from 0.18 to 0.48 mg/g dry weight (DW). The galantamine content of L. radiata and L. sanguinea were much higher than those in the other species. The galantamine content in L. radiata was the highest (0.48 ± 0.00 mg/g DW), while the lowest content (0.18 ± 0.01 mg/g DW) was present in L. chinensis. The galantamine contents in L. radiata, L. sanguinea, L. uydoensis, L. chejuensis, and L. squamigera were higher than that in L. chinensis by 62.5%, 59.1%, 28%, 25%, and 25%, respectively.

3.2. Phenylpropanoid Content of Six Lycoris spp.

Analysis of the Lycoris species indicated that a total of 12 phenylpropanoid-derived compounds were detected (Table 1): gallic acid, catechin, 4-hydroxybenzoic acid, chlorogenic acid, caffeic acid, (−)-epicatechin, epicatechin gallate, sinapic acid, benzoic acid, rutin, quercetin, and kaempferol. Among these, ten were present in all the species.
The gallic acid content in the six species ranged from 0.009 to 0.063 mg/g DW, the highest being that of L. squamigera (0.063 ± 0.005 mg/g DW) and the lowest being that of L. chejuensis (0.009 ± 0.000 mg/g DW). L. squamigera, L. uydoensis, L. sanguinea, L. chinensis, and L. radiata showed levels of gallic acid that were higher than that of L. chejuensis by 7.0, 6.44, 5.22, 1.22, and 1.11 times, respectively. The catechin content ranged from 0.053 to 0.348 mg/g DW, where L. sanguinea and L. radiata exhibited the highest and lowest values, respectively. The catechin content of L. sanguinea, L. squamigera, L. uydoensis, L. chinensis, and L. chejuensis was higher than that of L. radiata by 6.56, 6.53, 5.94, 2.55, and 2.36 times, respectively.
4-Hydroxybenzoic acid was detected in L. chinensis, L. radiata, and L. sanguinea species, where the amount in L. sanguinea (0.020 ± 0.001 mg/g DW) was 10 times higher than that in L. radiata (0.002 ± 0.000 mg/g DW). The chlorogenic acid content ranged from 0.048 to 0.304 µg/mg DW among the Lycoris species. The highest and lowest chlorogenic acid contents were those of L. uydoensis (0.304 ± 0.024 mg/g DW) and L. chejuensis (0.048 ± 0.000 mg/g DW), respectively. L. uydoensis, L. squamigera, L. sanguinea, L. chinensis, and L. radiata exhibited chlorogenic acid levels that exceeded that of L. chejuensis by 6.33, 6.02, 5.98, 1.33, and 1.15 times, respectively.
The range of caffeic acid content in the six Lycoris species ranged from 0.016 to 0.093 mg/g DW. L. sanguinea, L. squamigera, and L. uydoensis contained the highest caffeic acid levels, while L. radiata at 0.016 ± 0.000 mg/g DW had the lowest. The levels of caffeic acid in L. sanguinea, L. squamigera, and L. uydoensis were 5.81 times higher than that of L. radiata. The (−)-epicatechin content in the six species ranged from 0.010 to 0.100 mg/g DW, with the highest and lowest being those of the L. sanguinea and L. radiata, respectively. L. sanguinea, L. squamigera, L. uydoensis, L. chinensis, and L. chejuensis possessed (−)-epicatechin levels that were higher than that of L. radiata by 10.0, 7.3, 7.1, 1.9, and 1.3 times, respectively.
The species possessed epicatechin gallate contents from 0.049 to 0.315 µg/mg DW. L. uydoensis at 0.315 ± 0.024 mg/g DW contained the highest epicatechin gallate, whereas L. chejuensis at 0.049 ± 0.000 mg/g DW had the lowest. The epicatechin gallate levels of L. uydoensis, L. squamigera, L. sanguinea, L. chinensis, and L. radiata were higher than that of L. chejuensis by 6.43, 5.69, 5.67, 1.35, and 1.02 times, respectively. The sinapic acid was detected in L. radiata at a low concentration of 0.002 mg/g DW. Sinapic acid was also in L. chejuensis at <0.001 mg/g DW.
The benzoic acid content in the six species of Lycoris ranged from 0.051 to 0.284 mg/g DW, where L. squamigera had the highest content and both L. chejuensis and L. radiata had the lowest content. L. squamigera, L. uydoensis, L. sanguinea, and L. chinensis had benzoic acid levels higher than those of L. chejuensis and L. radiata by 5.57, 5.53, 5.53, and 1.31 times, respectively. The rutin content ranged from 0.148 to 0.832 mg/g DW. The highest rutin content was detected in L. sanguinea (0.832 ± 0.051 mg/g DW), and the lowest rutin content was found in L. chejuensis (0.148 ± 0.001 mg/g DW). Among the six species, L. sanguinea, L. uydoensis, and L. squamigera were unique for their rutin accumulation, which was higher than those of the other species. The range of rutin content among these three species was 0.814–0.832 mg/g DW, where only a small variation in content was evident. The rutin content in L. sanguinea, L. uydoensis, L. squamigera, L. chinensis, and L. radiata was higher than that in L. chejuensis by 5.62, 5.55, 5.50, 1.26, and 1.06 times, respectively.
The quercetin content in the six species ranged from 0.108 to 0.605 mg/g DW, with L. sanguinea and L. squamigera containing the highest amount and L. chejuensis containing the lowest. L. sanguinea, L. squamigera, and L. uydoensis were distinguishable from the other species for their higher quercetin accumulations, and the range of quercetin content among them did not vary much (0.602 to 0.605 mg/g DW). When comparing the quercetin content among all six species, those of L. sanguinea, L. squamigera, L. uydoensis, L. chinensis, and L. radiata were higher than that of L. chejuensis by 5.60, 5.60, 5.57, 1.32, and 1.06 times, respectively. The kaempferol content in the six species ranged from 0.038 to 0.218 mg/g DW. The highest kaempferol content was found in L. sanguinea (0.218 ± 0.013 mg/g DW), and the lowest kaempferol content was found in L. chejuensis (0.038 ± 0.000 mg/g DW). L. sanguinea, L. squamigera, L. uydoensis, L. chinensis, and L. radiata showed 5.74, 5.71, 5.66, 1.34, and 1.03 times higher kaempferol content than that of L. chejuensis, respectively.
Finally, the total accumulation of all phenylpropanoid compounds ranged from 0.561 to 3.109 mg/g DW. The species with the highest total phenylpropanoid content was L. sanguinea (3.109 ± 0.209 mg/g DW), while that with the lowest total phenylpropanoid content was L. radiata (0.561 ± 0.010 mg/g DW). Among the six species tested, L. sanguinea, L. uydoensis, and L. squamigera showed very distinctive phenylpropanoid accumulation, 3.062 to 3.109 mg/g DW, which was not a notable variation. L. sanguinea, L. uydoensis, L. squamigera, L. chinensis, and L. chejuensis exhibited total phenylpropanoid contents that were 5.54, 5.49, 5.46, 1.36, and 1.08 times, respectively, greater than that of the lowest total phenylpropanoid content of L. radiata.

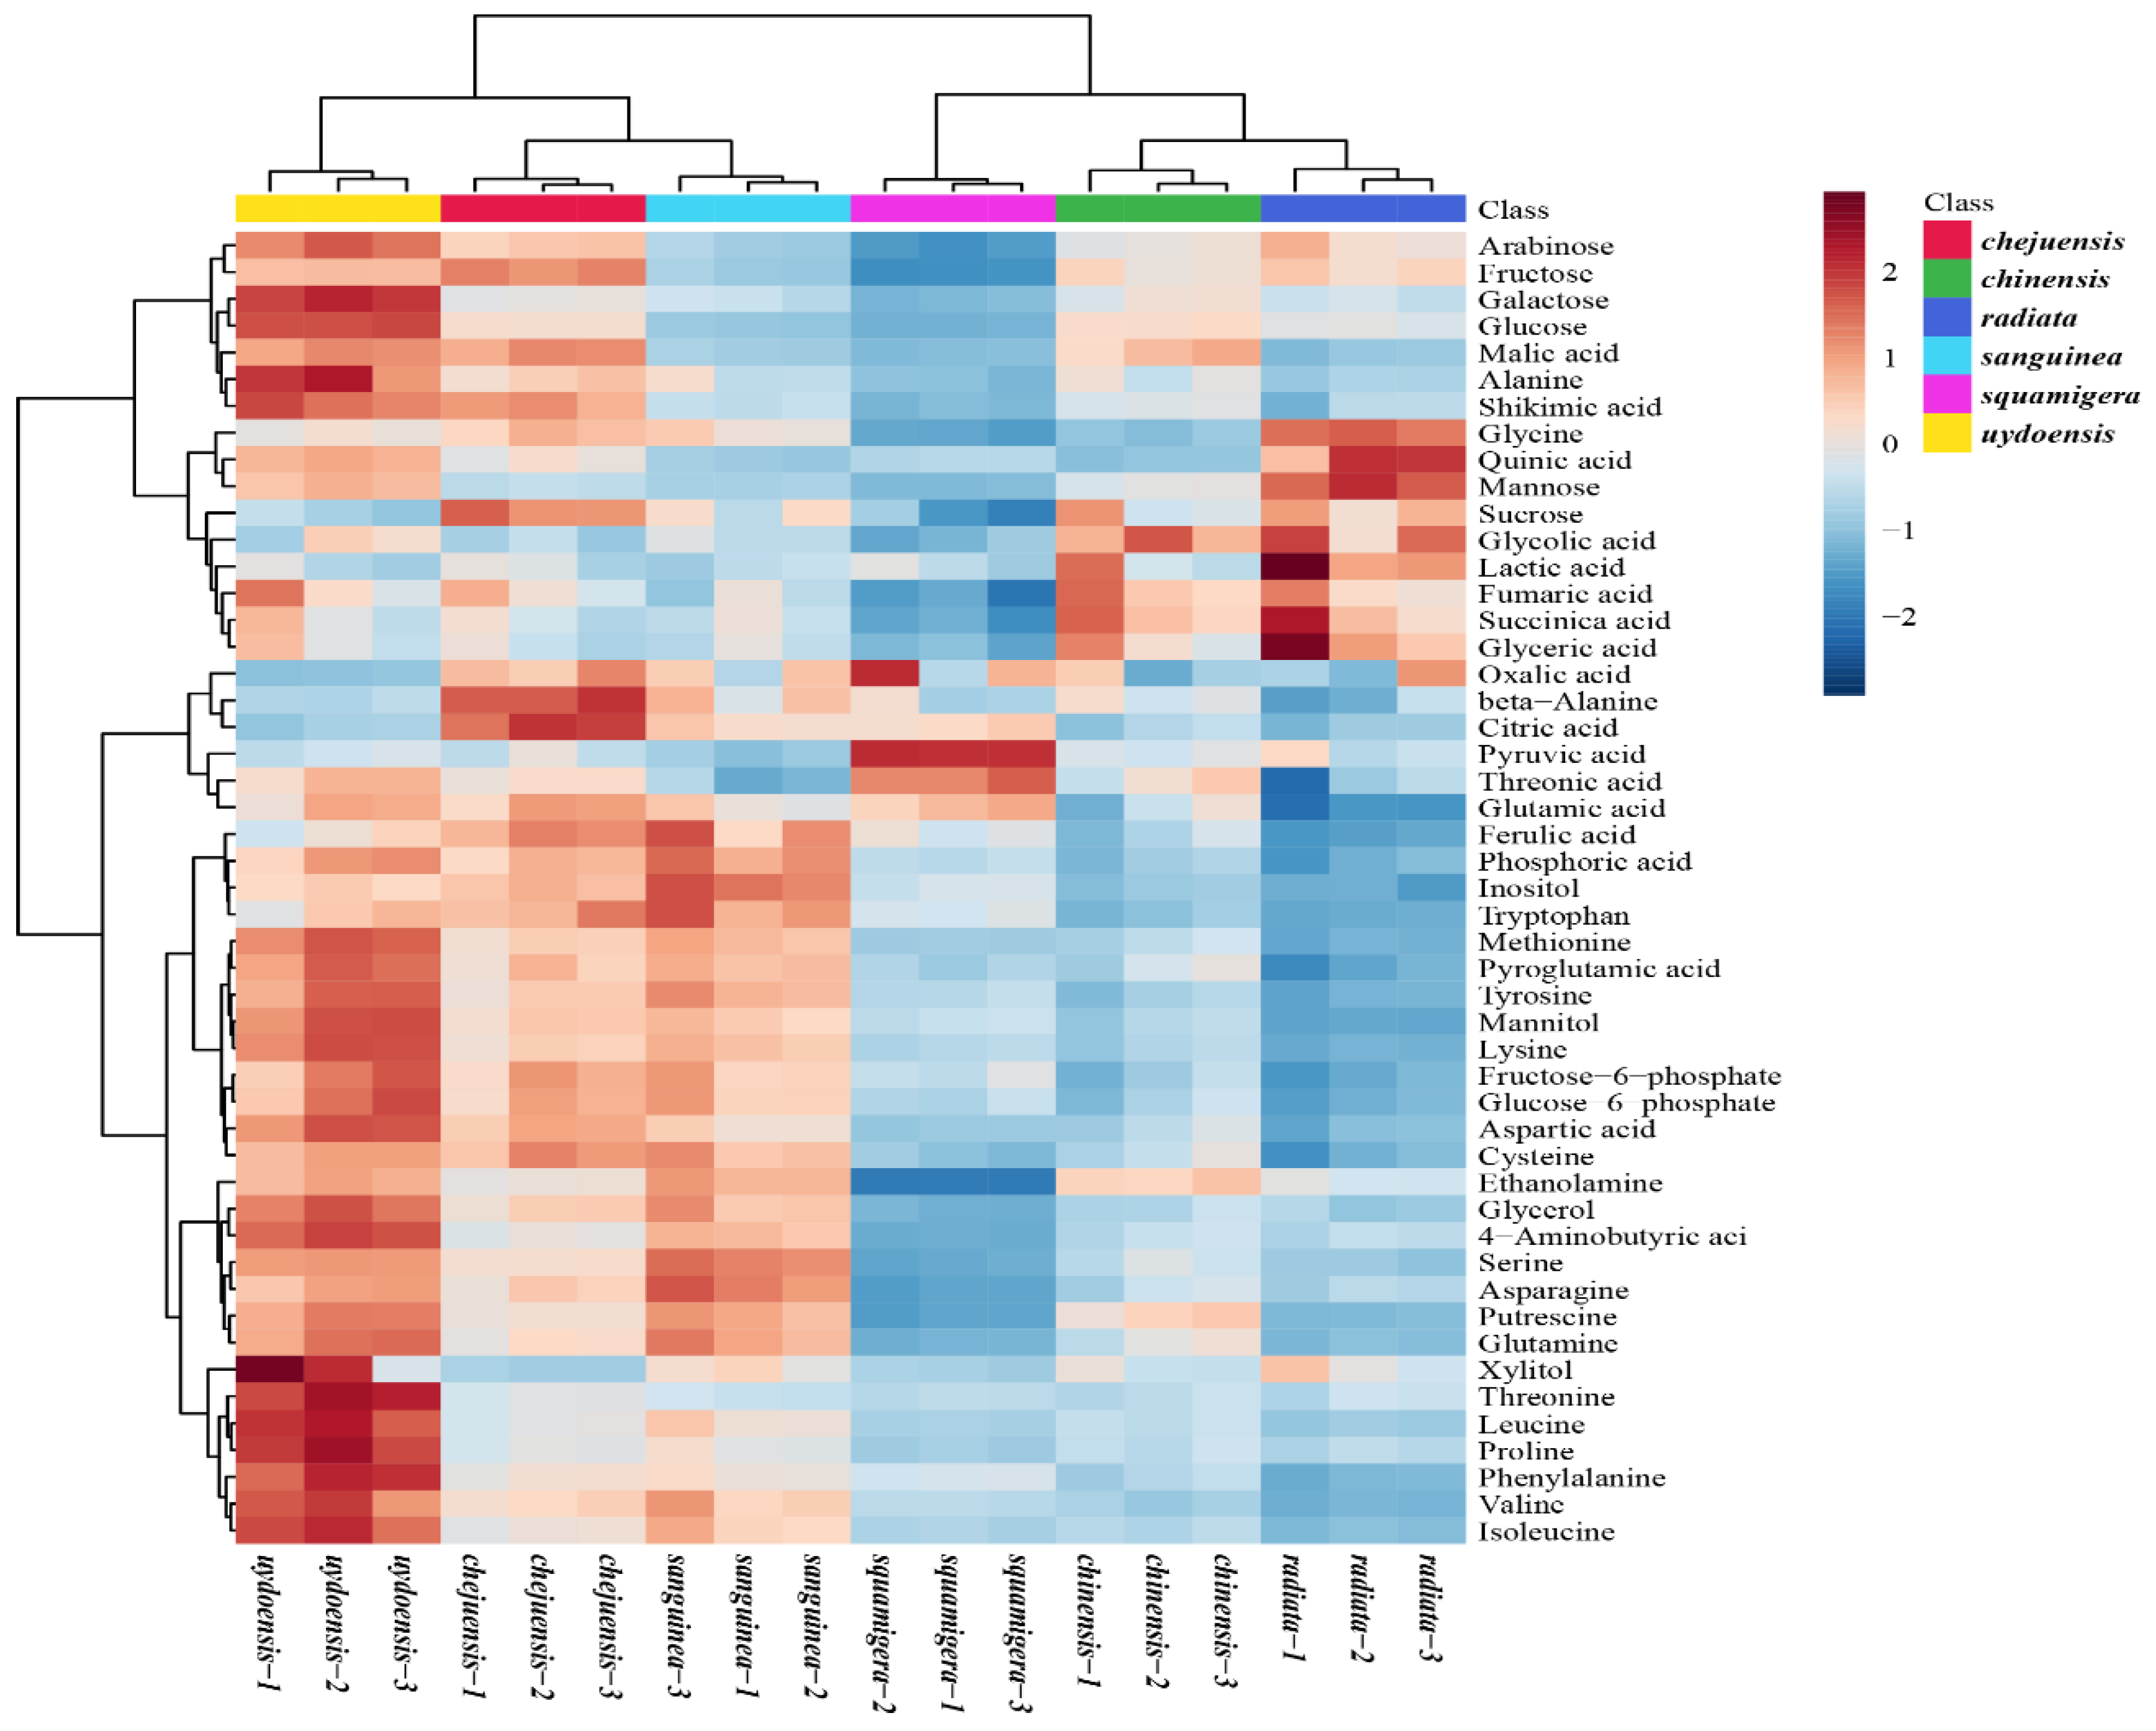
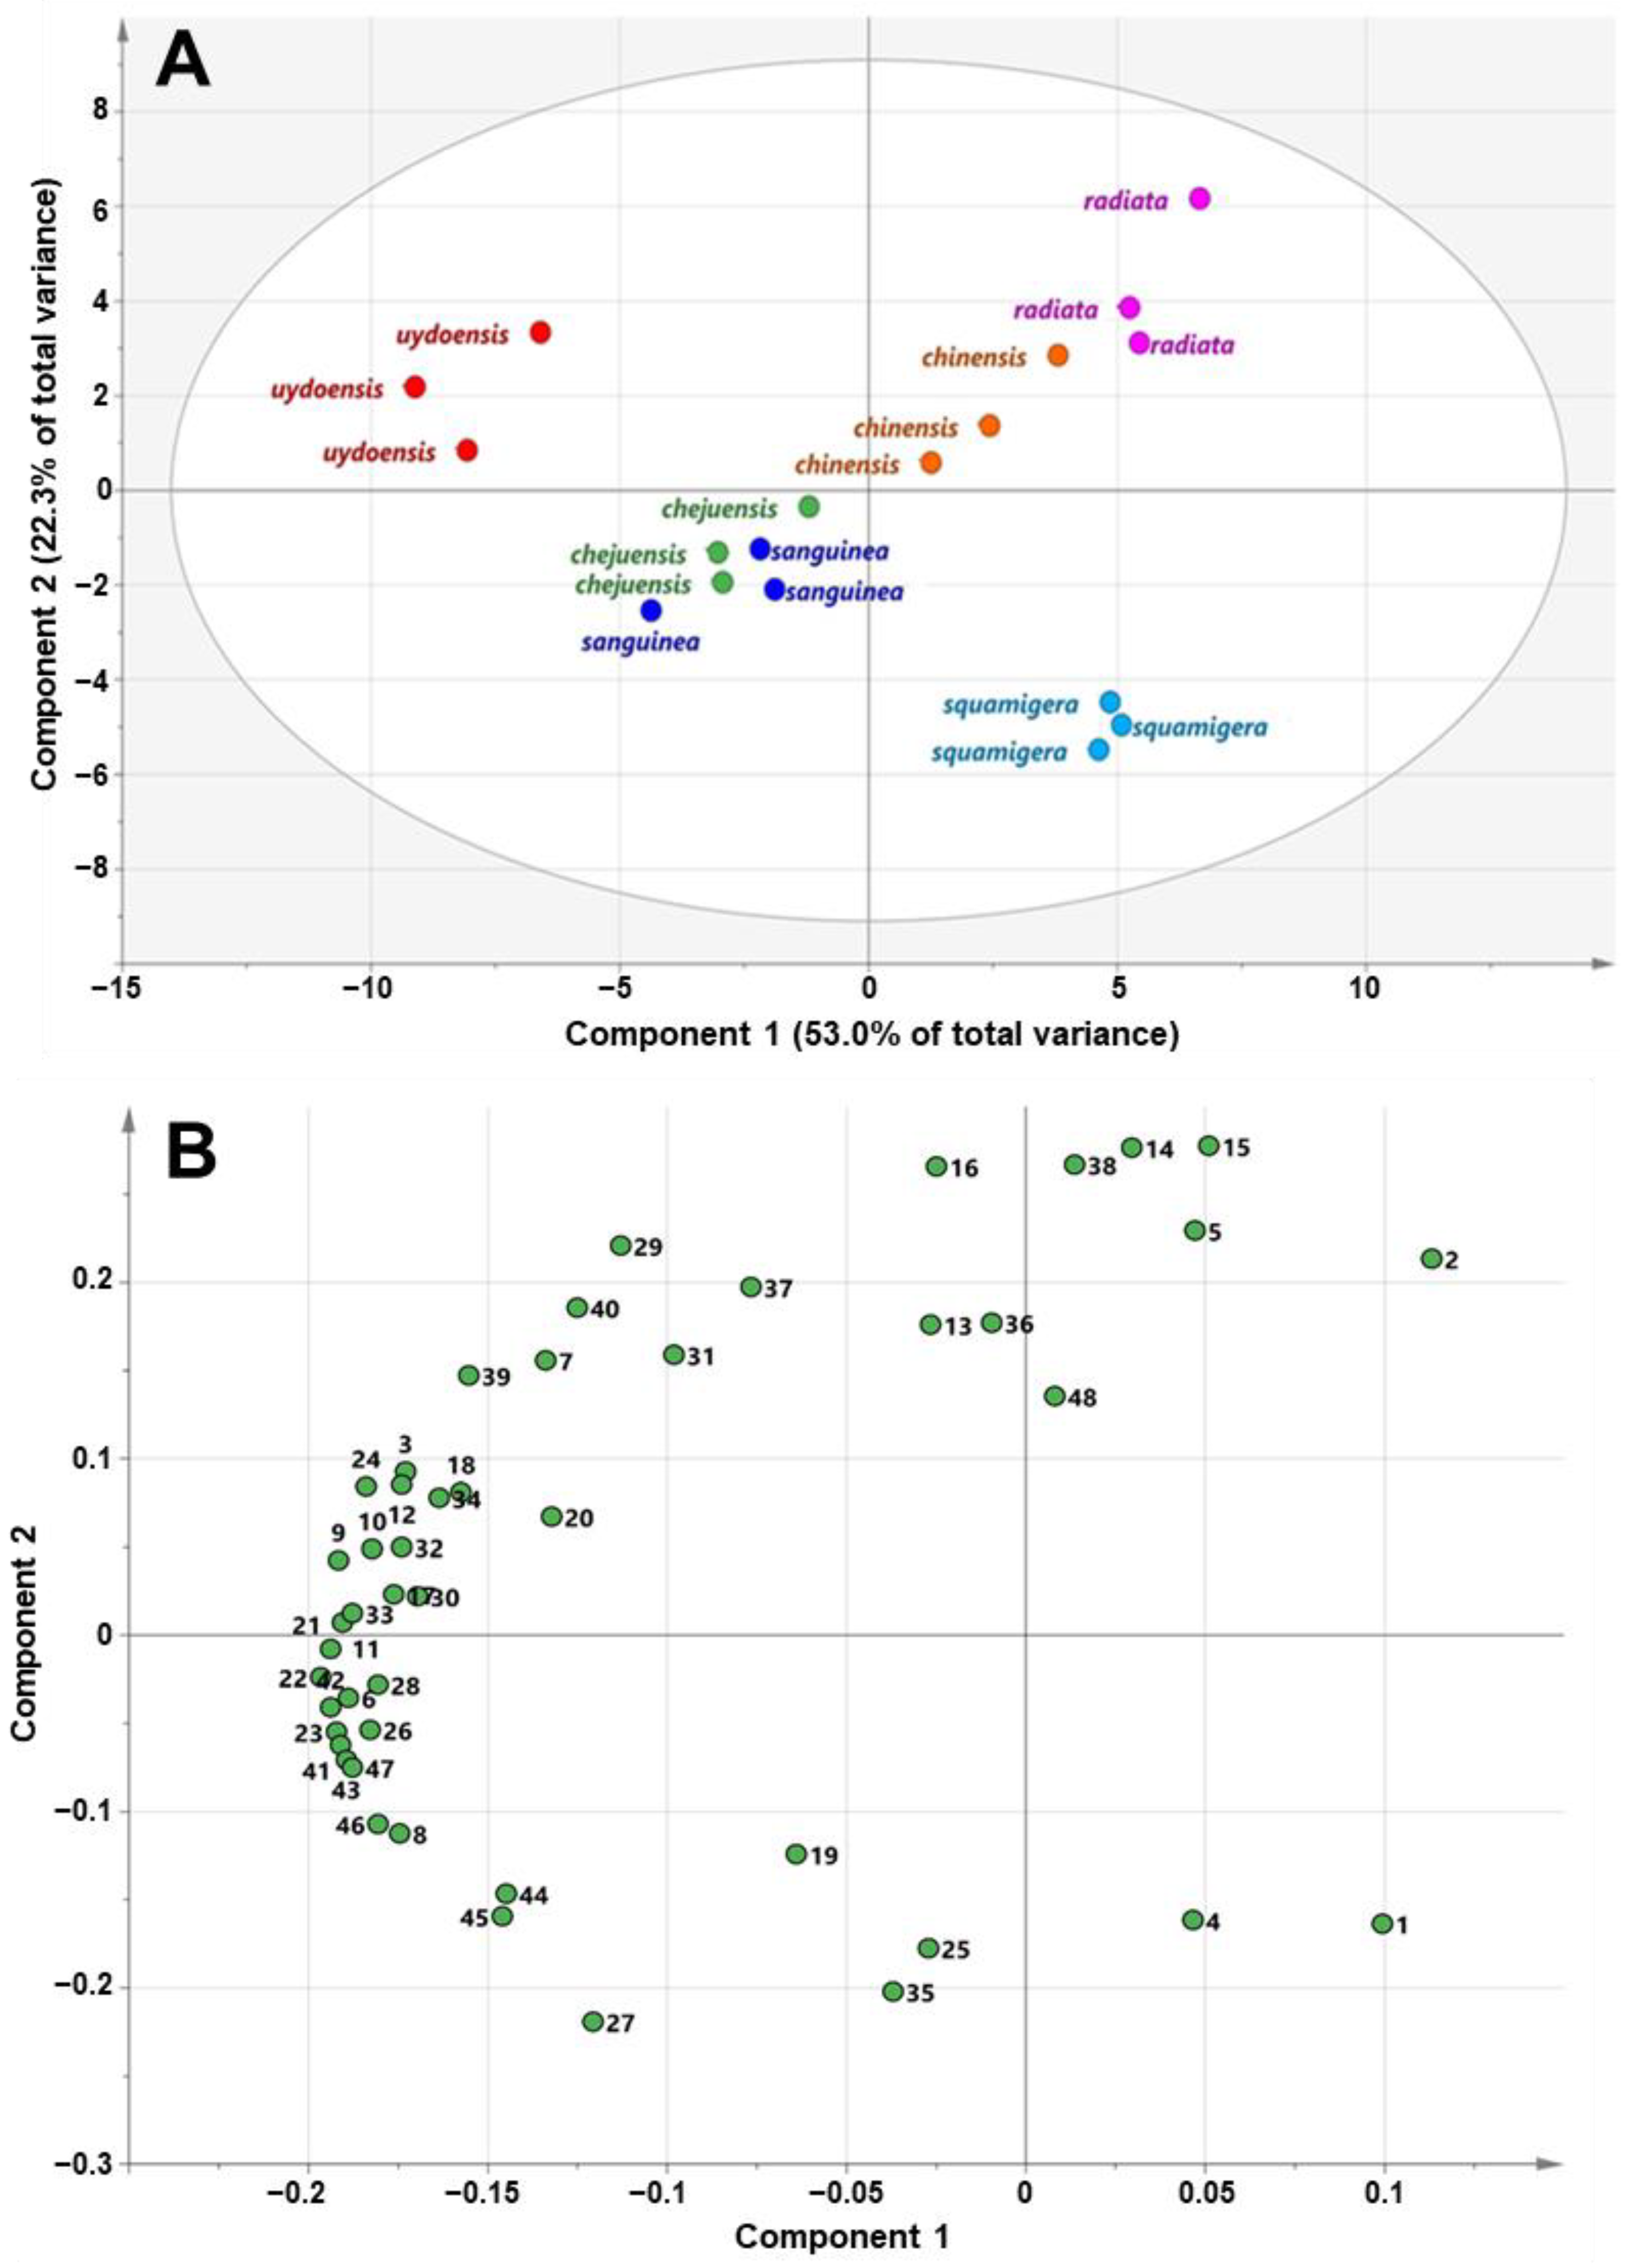
3.3. GC-TOFMS Metabolic Profiling of Six Lycoris spp.

From the metabolic profiling of the six Lycoris species using GC-TOFMS, a total of 48 metabolites, including 14 organic acids, 21 amino acids, 4 sugar alcohols, 8 sugars, and 1 amine, were detected (Figure 2). In particular, 18 proteinogenic and 3 non-proteinogenic amino acids were detected, and their levels differed among the species. Most amino acids, except tryptophan and β-alanine, were higher in L. sanguinea and L. uydoensis. Furthermore, the amounts of phenylalanine and tyrosine, precursors of the biosynthetic pathway of galantamine, were the highest in L. uydoensis. Among the eight sugars, glucose was the highest in L. uydoensis, while L. chejuensis contained notably higher levels of fructose and sucrose.
PCA multivariate analysis was used to evaluate the differences among the six Lycoris spp. regarding the contribution of their metabolites to their separation. PCA subjects an orthogonal linear transformation that converts the original data into a new set of variables as the principal component (PC). There were no differences among the three biological replicates of each species (Figure 3). The two highest-ranking components represented 75.3% of the total variance (component 1: 53.0%; component 2: 22.3%). Remarkably, PC 1 separated L. uydoensis from the other species. According to the loading plot, the metabolites responsible for the highest contribution to the separation were amino acids, such as methionine, lysine, pyroglutamic acid, isoleucine, and tyrosine, whose eigenvector values were −0.1965, −0.1941, −0.1922, −0.1904, and −0.1894, respectively. This indicated that L. uydoensis was richer in several amino acids than other samples. Consequently, metabolic profiling with multivariate analysis showed differences between the six Lycoris species regarding their sugar and amino acid contents.

4. Discussion

The quantitative analysis of galantamine and the phenylpropanoid-derived compounds in six Lycoris species is reported here for the first time, where the amounts of these compounds in each species varied significantly. The same species did not show the same trends for both galantamine and the phenylpropanoid-derived compounds. L. sanguinea, L. uydoensis, and L. squamigera were very distinctive for exhibiting the highest accumulation of each individual phenylpropanoid, as well as total phenylpropanoid content. Among all the species tested, L. sanguinea, L. squamigera, and L. uydoensis were notable for their accumulation of most phenylpropanoids and galantamine. They also exhibited similar accumulation levels to one another. There have been previous reports on variations in the phenylpropanoid compounds present in different plant species, including Lycoris, that arise from the specific species, plant organs, and the location of the plants.
de Paiva et al. [28] reported the analysis of four alkaloids (galantamine, sanguinine, pseudolycorine, and narciclasine) in different Amaryllidaceae plants, and galantamine was detected in all of them [28]. Our results coincide with this observation because galantamine was detected in all of the Lycoris species. The galantamine content in L. radiata and L. sanguinea were much higher than those of the other species. The highest galantamine content (0.48 ± 0.00 mg/g DW) was detected in L. radiata and the lowest content (0.18 ± 0.01 mg/g DW) was present in L. chinensis. Our results were also consistent with those of Tian et al. [29], where galantamine-type alkaloids were predominant (40.1%) in L. radiata. A similar observation was made by Janssen and Sch a ¯ fer [30], where galantamine was mostly obtained from the red spider lily (Lycoris radiata) of Asia, while daffodils served as the main source in Europe and the United States. Our results are also in line with those of Nikolova and Gevrenova [31] who advanced an HPLC method that simultaneously determined seven phenolic acids, namely, protocatechuic, 4-hydroxybenzoic, vanillic, caffeic, syringic, and p-coumaric, from five Amaryllidaceae species (Sternbergia colchiciflora W. K., Leucojum aestivum L., Galanthus elwesii Hook., Pancratium maritimum L., and Galanthus nivalis L.). In our study, 12 phenylpropanoid-derived compounds were detected: gallic acid, catechin, 4-hydroxybenzoic acid, chlorogenic acid, caffeic acid, (−)-epicatechin, epicatechin gallate, sinapic acid, benzoic acid, rutin, quercetin, and kaempferol.
Variations in secondary metabolite composition between different species are not surprising. For example, Park et al. [32] reported differences in the contents of 4-hydroxybenzoic acid, chlorogenic acid, caffeic acid, p-coumaric acid, and rutin detected in the flowers of Magnolia Denudata Desr. and Magnolia Liliiflora Desr. In addition, differences in rutin accumulation of buckwheat were due to genotype [31,33]. Recently, there have been studies identifying variations in the phenolic contents of different cultivars within species. Red and green mizuna (Brassica rapa L. var. japonica) showed differences in gallic acid, caffeic acid, catechin, and (−)-epicatechin [34] content as well as the concentrations of various phenolics, such as 4-hydroxybenzoic acid, catechin hydrate, chlorogenic acid, caffeic acid, epicatechin, ferulic acid, rutin, and trans-cinnamic acid [22]. Furthermore, Park et al. [19] reported variations in gallic acid, catechin, chlorogenic acid, and caffeic acid in four cultivars of Liriope platyphylla. These studies supported our results and have found significant differences between species and/or cultivars.
In addition, similar results have been observed regarding phenolic contents variation in the cultivars of Tartary buckwheat (Fagopyrum tataricum) originating from different regions. The phenolic contents of different parts of Tartary buckwheat varied widely, where cultivar had a great influence on the content of phenolics, but flowers were found to have the highest phenolic levels [35]. Kim et al. [36] reported that the content of the phenylpropanoid compound charantin varied widely among different bitter melon (Momordica charantia L.) cultivars, especially between Japanese and Philippine cultivars. The Japanese cultivars contained higher charantin levels than those of the Philippine cultivars, with the highest content in the Japanese ‘Peacock’ cultivar and the lowest detected in the ‘Trident 357’ cultivar from the Philippines. Park et al. [37] also showed that the levels of most phenylpropanoids were higher in purple-colored kohlrabi (Brassica oleracea) than in pale-green kohlrabi. Furthermore, trans-cinnamic acid content was 12.7-fold higher in the flesh of purple kohlrabi than in pale-green kohlrabi. Kim et al. [38] revealed that the concentration of phenolic compounds in the hairy roots of Tartary buckwheat was several-fold higher than that in wild-type roots of the same species, indicating that a hairy root culture of F. tataricum is a valuable alternative approach for producing phenolic compounds. Thwe et al. [39] reported that the phenylpropanoid compounds rutin, quercetin, gallic acid, caffeic acid, and 4-hydroxybenzoic acid varied among the cultivars of Tartary buckwheat, which provided useful information on the molecular and physiological dynamic processes that are correlated with phenylpropanoid biosynthetic gene expression and phenolic compound content in Fagopyrum tataricum species.
Park et al. [40] reported that the phenolic compound content of the thin F. tataricum phenotype was higher than that of the thick phenotype. Recently, some studies have shown that methyl jasmonate (MJ) and nitric oxide (NO) induced the production of secondary metabolites, such as galantamine [41], ginseng (Panax sp.) saponin [42], and artemisinin [43]. Mu et al. [44] have reported that MJ and NO significantly promoted total alkaloid and galantamine accumulation, while SA has reportedly promoted total alkaloid accumulation but restrained the accumulation of galantamine in Lycoris chinensis. Baicalin, baicalein, and wogonin accumulated in the hairy roots derived from Scutellaria baicalensis and Scutellaria lateriflora. The accumulation of baicalin and baicalein in S. baicalensis was higher than those in S. lateriflora by 6.8 and 5.0 times, respectively [45].

5. Conclusions

In this study, varying contents of galantamine and phenylpropanoid-derived compounds were quantitatively analyzed in six Lycoris species. The highest galantamine content was detected in L. radiata and was 62.5% higher than that of L. chinensis, which contained the lowest content. HPLC analyses indicated that the amount of phenylpropanoid-derived compounds significantly varied among the Lycoris species, with L. sanguinea, L. uydoensis, and L. squamigera containing the highest accumulation of individual phenylpropanoids, as well as the highest total phenylpropanoid content. To the best of our knowledge, this study provides the most detailed phytochemical profiles of amino acids in these Lycoris species and offers valuable information for future applications aimed at utilizing these medicinal plants. Furthermore, species-specific phenolic compound profiles, such as those presented here, might be helpful for the commercial use or production of galantamine and phenylpropanoid-derived compounds.

Supplementary Materials

The following are available online at https://0-www-mdpi-com.brum.beds.ac.uk/2311-7524/7/1/5/s1, Figure S1: Temperature conditions (A), relative humidity (B), and daylight hours (C) in Daejeon, South Korea, Table S1. Metabolites identified in the six different Lycoris species using HPLC (mg/g) and GC-TOFMS (ratio/g).

Author Contributions

J.K.K. and S.U.P. designed the experiments and analyzed the data; H.J.Y., Y.J.K., B.V.N., Y.E.P., C.H.P., and H.H.K. performed the experiments and analyzed the data; C.H.P. and S.U.P. wrote the manuscript. All authors have read and agreed to the published version of the manuscript.

Funding

This research was supported by the Bio and Medical Technology Development Program of the National Research Foundation (NRF) funded by the Ministry of Science, ICT and Future Planning (2016M3A9A5919548).

Institutional Review Board Statement

Not applicable.

Informed Consent Statement

Not applicable.

Data Availability Statement

Not applicable.

Conflicts of Interest

The authors declare no conflict of interest.

References

  1. Jimenez, H.J.; Silva, A.D.F.; Martins, L.S.S.; Carvalho, R.D.; Moraes, F.R.M. Comparative genomics plastomes of the Amaryllidaceae family species. Scientia Plena 2020, 16, 1–11. [Google Scholar]
  2. Hayashi, A.; Saito, T.; Mukai, Y.; Kurita, S.; Hori, T.-A. Genetic variations in Lycoris radiata var. radiata in Japan. Genes Genet. Syst. 2005, 80, 199–212. [Google Scholar] [CrossRef] [PubMed] [Green Version]
  3. Oh, H.; Han, Y.; Park, K. Vegetation present and vascular plants of habitats Lycoris flavescens MY Kim et ST Lee and Iris koreana Nakai, Byeonsanbando. J. Agric. Life Sci. 2011, 42, 54–67. [Google Scholar]
  4. Lee, D.G.; Lee, A.Y.; Kim, S.-J.; Lee, S.; Cho, E.; Lee, S. Antibacterial phytosterols and alkaloids from Lycoris radiata. Nat. Prod. Sci. 2014, 20, 107–112. [Google Scholar]
  5. Arias, E.; Alés, E.; Gabilan, N.H.; Cano-Abad, M.F.; Villarroya, M.; García, A.G.; López, M.G. Galantamine prevents apoptosis induced by β-amyloid and thapsigargin: Involvement of nicotinic acetylcholine receptors. Neuropharmacology 2004, 46, 103–114. [Google Scholar] [CrossRef]
  6. Chang, K.L.; Ho, P.C. Gas chromatography time-of-flight mass spectrometry (GC-TOF-MS)-based metabolomics for comparison of caffeinated and decaffeinated coffee and its implications for Alzheimer’s disease. PLoS ONE 2014, 9, e104621. [Google Scholar] [CrossRef] [Green Version]
  7. Li, A.; Du, Z.; Liao, M.; Feng, Y.; Ruan, H.; Jiang, H. Discovery and characterisation of lycorine-type alkaloids in Lycoris spp. (Amaryllidaceae) using UHPLC-QTOF-MS. Phytochem Anal. 2019, 30, 268–277. [Google Scholar] [CrossRef]
  8. Bastida, A.J.; Berkov, S.; Torras, C.L.; Pigni, N.B.; Andrade, J.P.D.; Martínez, V.; Codina, M.C.; Meya, F. Chemical and biological aspects of Amaryllidaceae alkaloids. Recent Adv. Pharm. Sci. 2011, 3, 65–100. [Google Scholar]
  9. Wang, D.; Gao, C.; Liu, S.; Wei, L. Structure investigation of a new alkaloid from Zanthoxylum schinifolium Siebet zucc. Chem. Res. Chin. Univ. 1991, 7, 124–128. [Google Scholar]
  10. Liu, J.; Hu, W.; He, L.; Ye, M.; Li, Y. Effects of lycorine on HL-60 cells via arresting cell cycle and inducing apoptosis. FEBS Lett. 2004, 578, 245–250. [Google Scholar] [CrossRef] [Green Version]
  11. Jin, Z. Amaryllidaceae and Sceletium alkaloids. Nat. Prod. Rep. 2007, 24, 886–905. [Google Scholar] [CrossRef] [PubMed]
  12. Jiang, Y.; Xia, N.; Li, X.; Shen, W.; Liang, L.; Wang, C.; Wang, R.; Peng, F.; Xia, B. Molecular cloning and characterization of a phenylalanine ammonia-lyase gene (LrPAL) from Lycoris radiata. Mol. Biol. Rep. 2011, 38, 1935–1940. [Google Scholar] [CrossRef] [PubMed]
  13. Cao, P.; Pan, D.-S.; Han, S.; Yu, C.-Y.; Zhao, Q.-J.; Song, Y.; Liang, Y. Alkaloids from Lycoris caldwellii and their particular cytotoxicities against the astrocytoma and glioma cell lines. Arch. Pharmacal Res. 2013, 36, 927–932. [Google Scholar] [CrossRef] [PubMed]
  14. Hao, B.; Shen, S.-F.; Zhao, Q.-J. Cytotoxic and antimalarial amaryllidaceae alkaloids from the bulbs of Lycoris radiata. Molecules 2013, 18, 2458–2468. [Google Scholar] [CrossRef] [Green Version]
  15. Song, J.-H.; Zhang, L.; Song, Y. Alkaloids from Lycoris aurea and their cytotoxicities against the head and neck squamous cell carcinoma. Fitoterapia 2014, 95, 121–126. [Google Scholar] [CrossRef]
  16. Atanasova, M.; Stavrakov, G.; Philipova, I.; Zheleva, D.; Yordanov, N.; Doytchinova, I.A. Galantamine derivatives with indole moiety: Docking, design, synthesis and acetylcholinesterase inhibitory activity. Bioorg. Med. Chem. 2015, 23, 5382–5389. [Google Scholar] [CrossRef]
  17. Suffness, M.; Cordell, G.A. Antitumor alkaloids. In The Alkaloids: Chemistry and Pharmacology; Brossi, A., Ed.; Academic Press INC: Orlando, FL, USA, 1985; Volume 25, pp. 1–355. [Google Scholar]
  18. Kihara, M.; Konishi, K.; Xu, L.; Kobayashi, S. Alkaloidal constituents of the flowers of Lycoris radiata herb amaryllidaceae. Chem. Pharm. Bull. 1991, 39, 1849–1853. [Google Scholar] [CrossRef] [Green Version]
  19. Park, C.H.; Morgan, A.M.; Park, B.B.; Lee, S.Y.; Lee, S.; Kim, J.K.; Park, S. Metabolic analysis of four cultivars of Liriope platyphylla. Metabolites 2019, 9, 59. [Google Scholar] [CrossRef] [Green Version]
  20. Park, C.H.; Yeo, H.J.; Baskar, T.B.; Park, Y.E.; Park, J.; Lee, S.Y.; Park, S. In vitro antioxidant and antimicrobial properties of flower, leaf, and stem extracts of Korean mint. Antioxidants 2019, 8, 75. [Google Scholar] [CrossRef] [Green Version]
  21. Park, C.H.; Yeo, H.J.; Kim, J.B.; Eun, P.Y.; Kim, S.-J.; Arasu, M.V.; Al-Dhabi, N.A.; Park, S.-Y.; Kim, J.K.; Park, S. Metabolic profiling of pale green and purple kohlrabi (Brassica oleracea var. gongylodes). Appl. Biol. Chem. 2017, 60, 249–257. [Google Scholar] [CrossRef]
  22. Park, C.H.; Yeo, H.J.; Park, S.-Y.; Kim, J.K.; Park, S. Comparative phytochemical analyses and metabolic profiling of different phenotypes of Chinese cabbage (Brassica Rapa ssp. Pekinensis). Foods 2019, 8, 587. [Google Scholar] [CrossRef] [PubMed] [Green Version]
  23. Quan, M.; Ou, L.; She, C.; Wu, X.; Chen, D. rDNA internal transcribed spacer sequence analysis of Lycoris Hert. Afr. J. Biotechnol. 2012, 11, 29. [Google Scholar]
  24. Park, C.H.; Yeo, H.J.; Park, Y.E.; Baek, S.-A.; Kim, J.K.; Park, S. Transcriptome analysis and metabolic profiling of Lycoris radiata. Biology 2019, 8, 63. [Google Scholar] [CrossRef] [PubMed] [Green Version]
  25. Shi, T.; Yue, Y.; Shi, M.; Chen, M.; Yang, X.; Wang, L. Exploration of floral volatile organic compounds in six typical Lycoris taxa by GC-MS. Plants 2019, 8, 422. [Google Scholar] [CrossRef] [PubMed] [Green Version]
  26. Lee, K.B.; Kim, Y.J.; Kim, H.J.; Choi, J.; Kim, J.K. Phytochemical profiles of Brassicaceae vegetables and their multivariate characterization using chemometrics. Appl. Biol. Chem. 2018, 61, 131–144. [Google Scholar] [CrossRef]
  27. Kim, T.J.; Hyeon, H.; Park, N.-I.; Yi, T.G.; Lim, S.-H.; Park, S.-Y.; Ha, S.-H.; Kim, J.K. A high-throughput platform for interpretation of metabolite profile data from pepper (Capsicum) fruits of 13 phenotypes associated with different fruit maturity states. Food Chem. 2020, 331, 127286. [Google Scholar] [CrossRef]
  28. De Paiva, J.; Souza, A.; Pereira, R.; Ribeiro, P.; Zocolo, G.J.; De Brito, E.S.; Pessoa, O.D.L.; Canuto, K.M. Development and validation of a UPLC-ESI-MS method for quantitation of the anti-alzheimer drug galantamine and other amaryllidaceae alkaloids in plants. J. Braz. Chem. Soc. 2020, 31, 265–272. [Google Scholar] [CrossRef]
  29. Tian, Y.; Zhang, C.-Y.; Guo, M. Comparative analysis of Amaryllidaceae alkaloids from three Lycoris species. Molecules 2015, 20, 21854–21869. [Google Scholar] [CrossRef] [Green Version]
  30. Janssen, B.; Schäfer, B. Galantamine. Chemtexts 2017, 3, 7. [Google Scholar] [CrossRef]
  31. Nikolova, M.; Gevrenova, R. Determination of phenolic acids in Amaryllidaceae species by high performance liquid chromatography. Pharm. Biol. 2005, 43, 289–291. [Google Scholar] [CrossRef]
  32. Park, C.H.; Park, S.-Y.; Lee, S.Y.; Kim, J.K.; Park, S. Analysis of metabolites in white flowers of Magnolia Denudata Desr. and violet flowers of Magnolia Liliiflora Desr. Molecules 2018, 23, 1558. [Google Scholar] [CrossRef] [PubMed] [Green Version]
  33. Francisco, M.; Velasco, P.; Moreno, D.A.; García-Viguera, C.; Cartea, M.E. Cooking methods of Brassica rapa affect the preservation of glucosinolates, phenolics and vitamin C. Food Res. Int. 2010, 43, 1455–1463. [Google Scholar] [CrossRef] [Green Version]
  34. Park, C.H.; Bong, S.J.; Lim, C.J.; Kim, J.K.; Park, S.U. Transcriptome analysis and metabolic profiling of green and red mizuna (Brassica rapa L. var. japonica). Foods 2020, 9, 1079. [Google Scholar] [CrossRef] [PubMed]
  35. Uddin, M.R.; Li, X.; Park, W.T.; Kim, Y.B.; Kim, S.J.; Kim, Y.S.; Lee, M.Y.; Park, C.H.; Park, S.U. Phenolic compound content in different organs of Korean common buckwheat cultivars. Asian J. Chem. 2013, 25, 424. [Google Scholar] [CrossRef]
  36. Kim, Y.K.; Park, W.T.; Uddin, M.R.; Kim, Y.B.; Bae, H.; Kim, H.H.; Park, K.W.; Park, S.U. Variation of charantin content in different bitter melon cultivars. Asian J. Chem. 2014, 26, 309. [Google Scholar] [CrossRef]
  37. Park, W.T.; Kim, J.K.; Park, S.; Lee, S.-W.; Li, X.; Kim, Y.B.; Uddin, M.R.; Park, N.I.; Kim, S.-J.; Park, S.U. Metabolic profiling of glucosinolates, anthocyanins, carotenoids, and other secondary metabolites in kohlrabi (Brassica oleracea var. gongylodes). J. Agric. Food Chem. 2012, 60, 8111–8116. [Google Scholar] [CrossRef]
  38. Kim, Y.K.; Li, X.; Xu, H.; Park, N.I.; Uddin, M.R.; Pyon, J.Y.; Park, S.U. Production of phenolic compounds in hairy root culture of Tartary buckwheat (Fagopyrum tataricum Gaertn). J. Crop Sci. Biotechnol. 2009, 12, 53–57. [Google Scholar] [CrossRef]
  39. Thwe, A.A.; Kim, J.K.; Li, X.; Kim, Y.B.; Uddin, M.R.; Kim, S.J.; Suzuki, T.; Park, N.I.; Park, S.U. Metabolomic analysis and phenylpropanoid biosynthesis in hairy root culture of Tartary buckwheat cultivars. PLoS ONE 2013, 8, e65349. [Google Scholar] [CrossRef]
  40. Park, N.I.; Xiaohua, L.; Uddin, R.M.; Park, S.U. Phenolic compound production by different morphological phenotypes in hairy root cultures of Fagopyrum tataricum Gaertn. Arch. Biol. Sci. 2011, 63, 193–198. [Google Scholar] [CrossRef]
  41. Colque, R.; Viladomat, F.; Bastida, J.; Codina, C. Improved production of galanthamine and related alkaloids by methyl jasmonate in Narcissus confusus shoot-clumps. Planta Medica 2004, 70, 1180–1188. [Google Scholar] [CrossRef]
  42. Hu, X.; Neill, S.J.; Cai, W.; Tang, Z. Nitric oxide mediates elicitor-induced saponin synthesis in cell cultures of Panax ginseng. Funct. Plant Biol. 2003, 30, 901–907. [Google Scholar] [CrossRef] [PubMed]
  43. Zheng, L.P.; Guo, Y.T.; Wang, J.W.; Tan, R.X. Nitric oxide potentiates oligosaccharide-induced artemisinin production in Artemisia annua hairy roots. J. Integr. Plant Biol. 2008, 50, 49–55. [Google Scholar] [CrossRef] [PubMed]
  44. Mu, H.-M.; Wang, R.; Li, X.-D.; Jiang, Y.-M.; Wang, C.-Y.; Quan, J.-P.; Peng, F.; Xia, B. Effect of abiotic and biotic elicitors on growth and alkaloid accumulation of Lycoris chinensis seedlings. Zeitschrift Naturforschung C 2009, 64, 541–550. [Google Scholar] [CrossRef] [PubMed]
  45. Kim, J.K.; Kim, Y.S.; Kim, Y.; Uddin, M.R.; Kim, Y.B.; Kim, H.H.; Park, S.Y.; Lee, M.Y.; Chung, S.O.; Park, S.U. Comparative analysis of flavonoids and polar metabolites from hairy roots of Scutellaria baicalensis and Scutellaria lateriflora. World J. Microbiol. Biotechnol. 2014, 30, 887–892. [Google Scholar] [CrossRef] [PubMed]
Figure 1. HPLC analysis of galantamine in six Lycoris spp. Mean values with different letters (a and b) were significantly different (p < 0.05, ANOVA, DMRT).
Horticulturae 07 00005 g001
Figure 2. Heatmap representing differences in relative metabolite concentrations of six Lycoris species. Increasing and decreasing the contents of metabolites are shown by blue and red color, respectively.
Horticulturae 07 00005 g002
Figure 3. (A) Score plot; (B) loading plot of principal component analysis (PCA) derived from gas chromatography time-of-flight mass spectrometry (GC-TOFMS) metabolite profiles. 1. Pyruvic acid; 2. Lactic acid; 3. Alanine; 4. Oxalic acid; 5. Glycolic acid; 6. Valine; 7. Ethanolamine; 8. Phosphoric acid; 9. Glycerol; 10. Leucine; 11. Isoleucine; 12. Proline; 13. Glycine; 14. Succinic acid; 15. Glyceric acid; 16. Fumaric acid; 17. Serine; 18. Threonine; 19. β-Alanine; 20. Malic acid; 21. Aspartic acid; 22. Methionine; 23. Pyroglutamic acid; 24. 4-Aminobutyric acid; 25. Threonic acid; 26. Cysteine; 27. Glutamic acid; 28. Phenylalanine; 29. Arabinose; 30. Asparagine; 31. Xylitol; 32. Putrescine; 33. Glutamine; 34. Shikimic acid; 35. Citric acid; 36. Quinic acid; 37. Fructose; 38. Mannose; 39. Galactose; 40. Glucose; 41. Mannitol; 42. Lysine; 43. Tyrosine; 44. Inositol; 45. Tryptophan; 46. Fructose-6-phosphate; 47. Glucose-6-phosphate; 48. Sucrose.
Horticulturae 07 00005 g003
Table 1. Accumulation of phenylpropanoids in six Lycoris spp.
L. uydoensisL. squamigeraL. sanguineaL. radiataL. chinensisL. chejuensisCompounds
0.058 ± 0.004 b0.063 ± 0.005 a0.047 ± 0.004 c0.010 ± 0.000 d0.011 ± 0.000 d0.009 ± 0.000 d zGallic acid
0.315 ± 0.024 a0.346 ± 0.025 a0.348 ± 0.024 a0.053 ± 0.002 c0.135 ± 0.003 b0.125 ± 0.003 bCatechin
NDND0.020 ± 0.001 a0.002 ± 0.000 b<0.000 bND y4-hydroxybenzoic acid
0.304 ± 0.024 a0.289 ± 0.015 a0.287 ± 0.015 a0.055 ± 0.001 b0.064 ± 0.000 b0.048 ± 0.000 bChlorogenic acid
0.093 ± 0.006 a0.093 ± 0.006 a0.093 ± 0.006 a0.016 ± 0.000 b0.022 ± 0.000 b0.017 ± 0.000 bCaffeic acid
0.071 ± 0.001 b0.073 ± 0.001 b0.100 ± 0.001 a0.010 ± 0.000 e0.019 ± 0.002 c0.013 ± 0.001 d(−)-Epicatechin
0.315 ± 0.024 a0.279 ± 0.015 b0.278 ± 0.015 b0.050 ± 0.001 c0.066 ± 0.000 c0.049 ± 0.000 cEpicatechin gallate
NDNDND0.002 ± 0.000 aND<0.000 bSinapic acid
0.282 ± 0.015 a0.284 ± 0.015 a0.282 ± 0.015 a0.051 ± 0.000 b0.067 ± 0.001 b0.051 ± 0.001 bbenzoic acid
0.821 ± 0.051 a0.814 ± 0.051 a0.832 ± 0.051 a0.159 ± 0.002 b0.187 ± 0.001 b0.148 ± 0.001 bRutin
0.602 ± 0.036 a0.605 ± 0.048 a0.605 ± 0.036 a0.114 ± 0.009 b0.143 ± 0.001 b0.108 ± 0.001 bQuercetin
0.215 ± 0.013 a0.217 ± 0.013 a0.218 ± 0.013 a0.039 ± 0.002 b0.051 ± 0.000 b0.038 ± 0.000 bKaempferol
3.079 ± 0.208 a3.062 ± 0.205 a3.109 ± 0.209 a0.561 ± 0.010 b0.765 ± 0.004 b0.607 ± 0.001 bTotal
z Mean values with different letters (a–e) were significantly different (p < 0.05, ANOVA, DMRT). y ND indicates it was not detected.
Publisher’s Note: MDPI stays neutral with regard to jurisdictional claims in published maps and institutional affiliations.

