
Genomic Resource Development for Hydrangea (Hydrangea macrophylla (Thunb.) Ser.)—A Transcriptome Assembly and a High-Density Genetic Linkage Map

 and
and
Abstract
:1. Introduction
2. Materials and Methods
2.1. Plant Materials and Sample Preparation
2.2. Transcriptome Sequencing, Assembly, and Analyses
2.3. Transcriptome Assembly
2.4. EST-SSR Identification and Genotyping
2.5. Genotyping by Sequencing and SNP Identification
2.6. Linkage Map Construction
3. Results
3.1. Transcriptome Analysis and EST-SSR Identification
3.2. EST-SSR Genotyping
3.3. GBS-SNP Discovery
3.4. Construction of Genetic Linkage Maps
4. Discussion
5. Conclusions
Supplementary Materials
Author Contributions
Funding
Data Availability Statement
Acknowledgments
Conflicts of Interest
References
- Wilson, E.H. The hortensias Hydrangea macrophylla DC. and Hydrangea serrata DC. J. Arnold Arbor. 1923, 4, 233–246. [Google Scholar]
- Griffiths, M. The New Royal Horticultural Society Dictionary: Index of Garden Plants; Macmillan Press Ltd.: London, UK, 1994. [Google Scholar]
- The 2014 Census of Horticultural Specialties; U.S. Department of Agriculture, National Agricultural Statistics Service (USDA-NASS): Washington, DC, USA, 2015; Volume 3, Special Studies, Part 3, AC-12-SS-3.
- Rinehart, T.; Wadl, P.; Staton, M. An update on Hydrangea macrophylla breeding targets and genomics. In Proceedings of the III International Symposium on Woody Ornamentals of the Temperate Zone 1191, Minneapolis, MI, USA, 2–5 August 2016; pp. 217–224. [Google Scholar]
- Leus, L. Breeding for Disease Resistance in Ornamentals in Ornamental Crops 97-125; Springer: Cham, Switzerland, 2018. [Google Scholar]
- Mohan, M.; Nair, S.; Bhagwat, A.; Krishna, T.G.; Yano, M.; Bhatia, C.R.; Sasaki, T. Genome mapping, molecular markers and marker-assisted selection in crop plants. Mol. Breed. 1997, 3, 87–103. [Google Scholar] [CrossRef]
- Cerbah, M.; Cerbah, M.; Mortreau, E.; Brown, S.; Siljak-Yakovlev, S.; Bertrand, H.; Lambert, C. Genome size variation and species relationships in the genus Hydrangea. Appl. Genet. 2001, 103, 45–51. [Google Scholar] [CrossRef]
- Chen, H.; Lu, C.; Jiang, H.; Peng, J. Global transcriptome analysis reveals distinct aluminum-tolerance pathways in the Al-accumulating species Hydrangea macrophylla and marker identification. PLoS ONE 2015, 10, e0144927. [Google Scholar] [CrossRef] [Green Version]
- Negishi, T.; Oshima, K.; Hattori, M.; Kanai, M.; Mano, S.; Nishimura, M.; Yoshida, K. Tonoplast-and plasma membrane-localized aquaporin-family transporters in blue hydrangea sepals of aluminum hyperaccumulating plant. PLoS ONE 2012, 7, e43189. [Google Scholar] [CrossRef] [Green Version]
- Rinehart, T.A.; Scheffler, B.E.; Reed, S.M. Genetic diversity estimates for the genus Hydrangea and development of a molecular key based on SSR. J. Am. Soc. Hortic. Sci. 2006, 131, 787–797. [Google Scholar] [CrossRef]
- Rinehart, T.A.; Scheffler, B.E.; Reed, S.M. Ploidy variation and genetic diversity in Dichroa. HortScience 2010, 45, 208–213. [Google Scholar] [CrossRef] [Green Version]
- Reed, S.M.; Rinehart, T.A. Simple sequence repeat marker analysis of genetic relationships within Hydrangea macrophylla. J. Am. Soc. Hortic. Sci. 2007, 132, 341–351. [Google Scholar] [CrossRef] [Green Version]
- Waki, T.; Kodama, M.; Akutsu, M.; Namai, K.; Iigo, M.; Kurokura, T.; Yamamoto, T.; Nashima, K.; Nakayama, M.; Yagi, M. Development of DNA Markers Linked to Double-Flower and Hortensia Traits in Hydrangea macrophylla (Thunb.) Ser. Hortic. J. 2018, 87, 264–273. [Google Scholar] [CrossRef] [Green Version]
- Li, S.; Yang, G.; Yang, S.; Just, J.; Yan, H.; Zhou, N.; Jian, H.; Wang, Q.; Chen, M.; Qiu, X.; et al. The development of a high-density genetic map significantly improves the quality of reference genome assemblies for rose. Sci. Rep. 2019, 9, 5985. [Google Scholar] [CrossRef] [PubMed]
- Yang, Y.; Sun, M.; Li, S.; Chen, Q.; Da Silva, J.A.T.; Wang, A.; Yu, X.; Wang, L. Germplasm resources and genetic breeding of Paeonia: A systematic review. Hortic. Res. 2020, 7, 1–19. [Google Scholar] [CrossRef]
- Song, X.; Xu, Y.; Gao, K.; Fan, G.; Zhang, F.; Deng, C.; Dai, S.; Huang, H.; Xin, H.; Li, Y. High-density genetic map construction and identification of loci controlling flower-type traits in Chrysanthemum (Chrysanthemum × morifolium Ramat.). Hortic. Res. 2020, 7, 1–13. [Google Scholar] [CrossRef] [PubMed]
- Walve, R.; Rastas, P.; Salmela, L. Kermit: Linkage map guided long read assembly. Algorithms Mol. Biol. 2019, 14, 8. [Google Scholar] [CrossRef]
- He, J.; Zhao, X.; Laroche, A.; Lu, Z.-X.; Liu, H.; Li, Z. Genotyping-by-sequencing (GBS), an ultimate marker-assisted selection (MAS) tool to accelerate plant breeding. Front. Plant Sci. 2014, 5, 484. [Google Scholar] [CrossRef] [PubMed] [Green Version]
- Elshire, R.J.; Glaubitz, J.C.; Sun, Q.; Poland, J.A.; Kawamoto, K.; Buckler, E.S.; Mitchell, S.E. A Robust, Simple Genotyping-by-Sequencing (GBS) Approach for High Diversity Species. PLoS ONE 2011, 6, e19379. [Google Scholar] [CrossRef] [Green Version]
- Yan, M.; Byrne, D.H.; Klein, P.E.; Yang, J.; Dong, Q.; Anderson, N. Genotyping-by-sequencing application on diploid rose and a resulting high-density SNP-based consensus map. Hortic. Res. 2018, 5, 17. [Google Scholar] [CrossRef]
- Di Pierro, E.A.; Gianfranceschi, L.; Di Guardo, M.; Koehorst-van Putten, H.J.; Kruisselbrink, J.W.; Longhi, S.; Troggio, M.; Bianco, L.; Muranty, H.; Pagliarani, G.; et al. A high-density, multi-parental SNP genetic map on apple validates a new mapping approach for out-crossing species. Hortic. Res. 2016, 3, 1–13. [Google Scholar] [CrossRef] [PubMed] [Green Version]
- Wu, X.; Alexander, L.W. Genetic Diversity and Population Structure Analysis of Bigleaf Hydrangea Using Genotyping-by-sequencing. J. Am. Soc. Hortic. Sci. 2019, 144, 257–263. [Google Scholar] [CrossRef] [Green Version]
- Wu, X.; Alexander, L.W. Genome-wide association studies for inflorescence type and remontancy in Hydrangea macrophylla. Hortic. Res. 2020, 7, 1–9. [Google Scholar] [CrossRef] [Green Version]
- Tränkner, C.; Krüger, J.; Wanke, S.; Naumann, J.; Wenke, T.; Engel, F. Rapid identification of inflorescence type markers by genotyping-by-sequencing of diploid and triploid F1 plants of Hydrangea macrophylla. BMC Genet. 2019, 20, 60. [Google Scholar] [CrossRef] [Green Version]
- Li, Y.; Mmbaga, M.; Zhou, B.; Joshua, J.; Rotich, E.; Parikh, L. Diseases of Hydrangea. Handbook of Florists’ Crops Diseases. Handbook of Plant Disease Management; Springer: Cham, Germany, 2016; pp. 1–19. [Google Scholar]
- Adkins, J.A.; Dirr, M.A. Remontant flowering potential of ten Hydrangea macrophylla (Thunb.) Ser. cultivars. HortScience 2003, 38, 1337–1340. [Google Scholar] [CrossRef]
- Tae, H.; Ryu, D.; Sureshchandra, S.; Choi, J.-H. ESTclean: A cleaning tool for next-gen transcriptome shotgun sequencing. BMC Bioinf. 2012, 13, 247. [Google Scholar] [CrossRef] [Green Version]
- Margulies, M.; Egholm, M.; Altman, W.E.; Attiya, S.; Bader, J.S.; Bemben, L.A.; Berka, J.; Braverman, M.S.; Chen, Y.-J.; Chen, Z.; et al. Genome sequencing in microfabricated high-density picolitre reactors. Nat. Cell Biol. 2005, 437, 376–380. [Google Scholar] [CrossRef] [PubMed]
- Haas, B.J.; Papanicolaou, A.; Yassour, M.; Grabherr, M.; Blood, P.D.; Bowden, J.; Couger, M.B.; Eccles, D.; Li, B.; Lieber, M.; et al. De novo transcript sequence reconstruction from RNA-seq using the Trinity platform for reference generation and analysis. Nat. Protoc. 2013, 8, 1494–1512. [Google Scholar] [CrossRef]
- Finn, R.D.; Coggill, P.; Eberhardt, R.Y.; Eddy, S.R.; Mistry, J.; Mitchell, A.L.; Potter, S.C.; Punta, M.; Qureshi, M.; Sangrador-Vegas, A.; et al. The Pfam protein families database: Towards a more sustainable future. Nucleic Acids Res. 2016, 44, D279–D285. [Google Scholar] [CrossRef]
- Finn, R.D.; Clements, J.; Arndt, W.; Miller, B.L.; Wheeler, T.J.; Schreiber, F.; Bateman, A.; Eddy, S.R. HMMER web server: 2015 update. Nucleic Acids Res. 2015, 43, W30–W38. [Google Scholar] [CrossRef]
- Apweiler, R. UniProt: The Universal Protein knowledgebase. Nucleic Acids Res. 2004, 32, 115D–119D. [Google Scholar] [CrossRef] [PubMed]
- Jones, P.; Binns, D.; Chang, H.-Y.; Fraser, M.; Li, W.; McAnulla, C.; McWilliam, H.; Maslen, J.; Mitchell, A.; Nuka, G.; et al. InterProScan 5: Genome-scale protein function classification. Bioinformatics 2014, 30, 1236–1240. [Google Scholar] [CrossRef] [Green Version]
- Simão, F.A.; Waterhouse, R.M.; Ioannidis, P.; Kriventseva, E.V.; Zdobnov, E.M. BUSCO: Assessing genome assembly and annotation completeness with single-copy orthologs. Bioinformatics 2015, 31, 3210–3212. [Google Scholar] [CrossRef] [PubMed] [Green Version]
- Stieneke, D.; Eujayl, I. Imperfect SSR Finder, Version 1.0. Available online: http://ssr.nwisrl.ars.usda.gov/ (accessed on 12 April 2017).
- Waldbieser, G.C.; Quiniou, S.M.; Karsi, A. Rapid development of gene-tagged microsatellite markers from bacterial artificial chromosome clones using anchored TAA repeat primers. Biotechniques 2003, 35, 976–979. [Google Scholar] [CrossRef]
- Brownstein, M.J.; Carpten, J.D.; Smith, J.R. Modulation of non-templated nucleotide addition by Taq DNA polymerase: Primer modifications that facilitate genotyping. Biotechniques 1996, 20, 1004–1010. [Google Scholar] [CrossRef] [Green Version]
- Glaubitz, J.C.; Casstevens, T.M.; Lu, F.; Harriman, J.; Elshire, R.J.; Sun, Q.; Buckler, E.S. TASSEL-GBS: A High Capacity Genotyping by Sequencing Analysis Pipeline. PLoS ONE 2014, 9, e90346. [Google Scholar] [CrossRef]
- Bradbury, P.J.; Zhang, Z.; Kroon, D.E.; Casstevens, T.M.; Ramdoss, Y.; Buckler, E.S. TASSEL: Software for association mapping of complex traits in diverse samples. Bioinformatics 2007, 23, 2633–2635. [Google Scholar] [CrossRef]
- Van Ooijen, J. JoinMap 4. Software for the Calculation of Genetic Linkage Maps in Experimental Populations; Kyazma BV: Wageningen, The Netherlands, 2006; p. 33. [Google Scholar]
- Voorrips, R. MapChart: Software for the graphical presentation of linkage maps and QTLs. J. Hered. 2002, 93, 77–78. [Google Scholar] [CrossRef] [Green Version]
- Consortium, U. UniProt: A hub for protein information. Nucleic Acids Res. 2015, 43, D204–D212. [Google Scholar] [CrossRef]
- Ashburner, M.; Ball, C.A.; Blake, J.A.; Botstein, D.; Butler, H.; Cherry, J.M.; Davis, A.P.; Dolinski, K.; Dwight, S.S.; Eppig, J.T.; et al. Gene Ontology: Tool for the unification of biology. Nat. Genet. 2000, 25, 25–29. [Google Scholar] [CrossRef] [Green Version]
- Bailey, D.A. Hydrangea Production; Timber Press, Inc.: Portland, OR, USA, 1989. [Google Scholar]
- Reed, S.M.; Jones, K.D.; Rinehart, T.A. Production and characterization of intergeneric hybrids between Dichroa febrifuga and Hydrangea macrophylla. J. Am. Soc. Hortic. Sci. 2008, 133, 84–91. [Google Scholar] [CrossRef] [Green Version]
- McCallum, S.; Graham, J.; Jorgensen, L.; Rowland, L.J.; Bassil, N.V.; Hancock, J.F.; Wheeler, E.J.; Vining, K.J.; Poland, J.; Olmstead, J.W.; et al. Construction of a SNP and SSR linkage map in autotetraploid blueberry using genotyping by sequencing. Mol. Breed. 2016, 36, 41. [Google Scholar] [CrossRef]
- Wang, N.; Fang, L.; Xin, H.; Wang, L.; Li, S. Construction of a high-density genetic map for grape using next generation restriction-site associated DNA sequencing. BMC Plant Biol. 2012, 12, 148. [Google Scholar] [CrossRef] [Green Version]
- Sun, L.; Yang, W.; Zhang, Q.; Cheng, T.; Pan, H.; Xu, Z.; Zhang, J.; Chen, C. Genome-Wide Characterization and Linkage Mapping of Simple Sequence Repeats in Mei (Prunus mume Sieb. et Zucc.). PLoS ONE 2013, 8, e59562. [Google Scholar] [CrossRef] [Green Version]
- Guajardo, V.; Solís, S.; Sagredo, B.; Gainza-Cortés, F.; Muñoz, C.; Gasic, K.; Hinrichsen, P. Construction of High Density Sweet Cherry (Prunus avium L.) Linkage Maps Using Microsatellite Markers and SNPs Detected by Genotyping-by-Sequencing (GBS). PLoS ONE 2015, 10, e0127750. [Google Scholar] [CrossRef] [PubMed]
- Kirov, I.; Van Laere, K.; De Riek, J.; De Keyser, E.; Van Roy, N.; Khrustaleva, L. Anchoring Linkage Groups of the Rosa Genetic Map to Physical Chromosomes with Tyramide-FISH and EST-SNP Markers. PLoS ONE 2014, 9, e95793. [Google Scholar] [CrossRef] [Green Version]


| Length | 4 | 5 | 6 | 7 | 8 | 10 | >10 | Total | Distribution Frequency (%) | |
|---|---|---|---|---|---|---|---|---|---|---|
| Type | ||||||||||
| Dinucleotide | 0 | 0 | 1040 | 692 | 861 | 395 | 274 | 3262 | 37.15 | |
| Trinucleotide | 2675 | 997 | 434 | 246 | 202 | 60 | 24 | 4638 | 52.82 | |
| Tetranucleotide | 226 | 57 | 23 | 15 | 9 | 2 | 0 | 332 | 3.78 | |
| Pentanucleotide | 125 | 25 | 6 | 5 | 0 | 0 | 0 | 161 | 1.83 | |
| Hexanucleotide | 241 | 93 | 29 | 12 | 6 | 0 | 0 | 381 | 4.34 | |
| Other | 6 | 0 | 0 | 0 | 0 | 0 | 0 | 6 | 0.07 | |
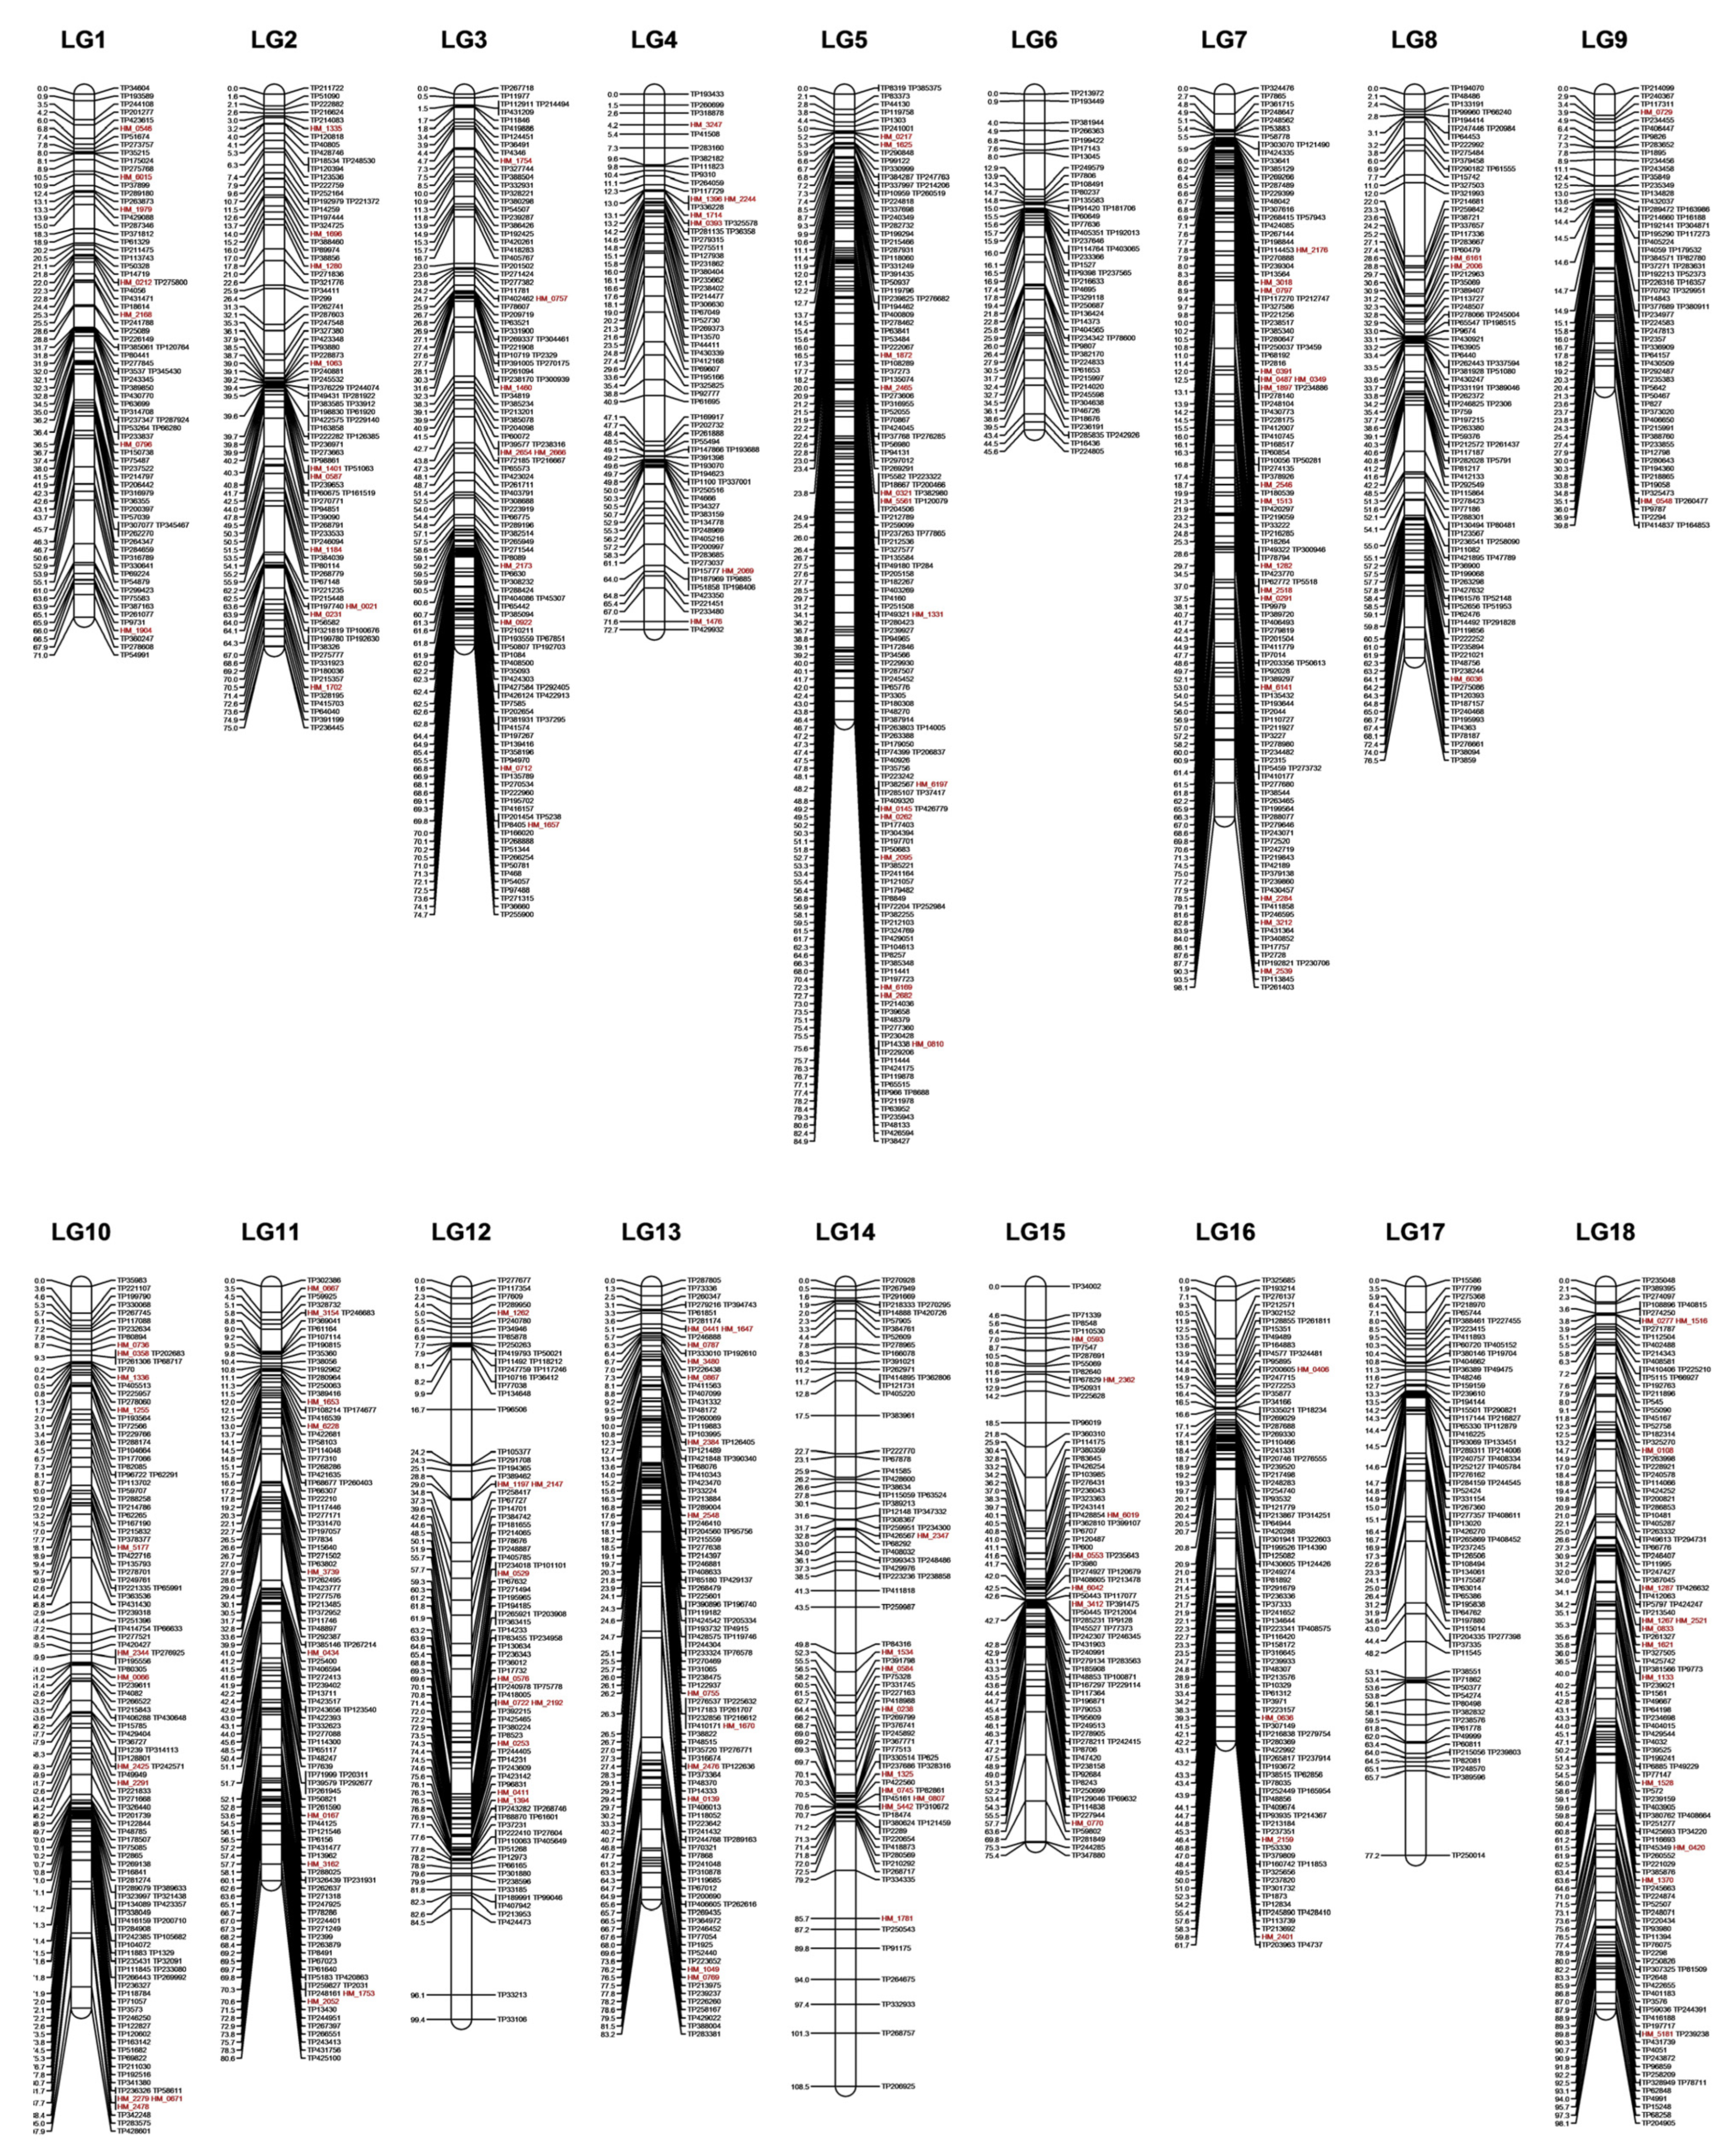
| Linkage Group (LG) | Marker Count (#) | SNP Count (#) | SSR Count (#) | Length (cM) | Average Marker Interval (cM) | Largest Gap (cM) |
|---|---|---|---|---|---|---|
| 1 | 77 | 70 | 7 | 71.0 | 0.9 | 5.9 |
| 2 | 93 | 83 | 10 | 75.0 | 0.8 | 6.3 |
| 3 | 120 | 111 | 9 | 74.7 | 0.6 | 6.4 |
| 4 | 72 | 65 | 7 | 72.7 | 1.0 | 6.2 |
| 5 | 152 | 138 | 14 | 84.9 | 0.6 | 3.0 |
| 6 | 49 | 49 | 0 | 45.6 | 0.9 | 4.9 |
| 7 | 125 | 109 | 16 | 98.1 | 0.8 | 4.8 |
| 8 | 101 | 98 | 3 | 76.5 | 0.8 | 10.0 |
| 9 | 68 | 66 | 2 | 39.8 | 0.6 | 3.0 |
| 10 | 126 | 114 | 12 | 97.9 | 0.8 | 6.6 |
| 11 | 108 | 98 | 10 | 80.6 | 0.7 | 6.3 |
| 12 | 92 | 82 | 10 | 99.4 | 1.1 | 11.5 |
| 13 | 114 | 101 | 13 | 83.2 | 0.7 | 13.5 |
| 14 | 86 | 77 | 9 | 108.5 | 1.3 | 7.2 |
| 15 | 83 | 76 | 7 | 75.4 | 0.9 | 6.1 |
| 16 | 101 | 97 | 4 | 61.7 | 0.6 | 5.2 |
| 17 | 78 | 78 | 0 | 77.2 | 1.0 | 11.5 |
| 18 | 122 | 109 | 13 | 61.3 | 0.5 | 6.4 |
| Total | 1767 | 1621 | 146 | 1383.4 | 0.8 | 13.5 |
Publisher’s Note: MDPI stays neutral with regard to jurisdictional claims in published maps and institutional affiliations. |
© 2021 by the authors. Licensee MDPI, Basel, Switzerland. This article is an open access article distributed under the terms and conditions of the Creative Commons Attribution (CC BY) license (http://creativecommons.org/licenses/by/4.0/).
Share and Cite
Wu, X.; Hulse-Kemp, A.M.; Wadl, P.A.; Smith, Z.; Mockaitis, K.; Staton, M.E.; Rinehart, T.A.; Alexander, L.W. Genomic Resource Development for Hydrangea (Hydrangea macrophylla (Thunb.) Ser.)—A Transcriptome Assembly and a High-Density Genetic Linkage Map. Horticulturae 2021, 7, 25. https://0-doi-org.brum.beds.ac.uk/10.3390/horticulturae7020025
Wu X, Hulse-Kemp AM, Wadl PA, Smith Z, Mockaitis K, Staton ME, Rinehart TA, Alexander LW. Genomic Resource Development for Hydrangea (Hydrangea macrophylla (Thunb.) Ser.)—A Transcriptome Assembly and a High-Density Genetic Linkage Map. Horticulturae. 2021; 7(2):25. https://0-doi-org.brum.beds.ac.uk/10.3390/horticulturae7020025
Chicago/Turabian StyleWu, Xingbo, Amanda M. Hulse-Kemp, Phillip A. Wadl, Zach Smith, Keithanne Mockaitis, Margaret E. Staton, Timothy A. Rinehart, and Lisa W. Alexander. 2021. "Genomic Resource Development for Hydrangea (Hydrangea macrophylla (Thunb.) Ser.)—A Transcriptome Assembly and a High-Density Genetic Linkage Map" Horticulturae 7, no. 2: 25. https://0-doi-org.brum.beds.ac.uk/10.3390/horticulturae7020025