Article

Comparative Transcriptome Analysis Reveals Different Low-Nitrogen-Responsive Genes in Pepper Cultivars

1
Chongqing Key Laboratory of Adversity Agriculture, Biotechnology Research Institute, Chongqing Academy of Agricultural Sciences, Chongqing 401329, China
2
Vegetable and Flower Research Institute, Chongqing Academy of Agricultural Sciences, Chongqing 401329, China
*
Authors to whom correspondence should be addressed.
Chunping Wang and Yifei Li contributed equally to this article.
Submission received: 1 April 2021 / Revised: 10 May 2021 / Accepted: 11 May 2021 / Published: 13 May 2021
(This article belongs to the Special Issue Advances in Molecular Breeding of Vegetable Crops)

Abstract

:
The molecular mechanisms underlying the variation in N-use efficiency (NUE) in pepper (Capsicum annuum L.) genotypes are poorly understood. In this work, two genotypes (750-1, low-N tolerant; ZCFB, low-N sensitive) with contrasting low-N tolerance were selected from 100 pepper cultivars on the basis of their relative leaf areas, shoot dry weights, root dry weights, and plant dry weights at the seedling stage. Subsequently, using RNA-Seq, the transcriptome of these two pepper genotypes under N starvation for 28 days was analyzed. We detected 2621/2470 and 3936/4218 different expressed genes (DEGs) in the leaves/roots of 750-1 and ZCFB, respectively. The changes in the expression of basic N metabolism genes were similar between 750-1 and ZCFB. However, different DEGs not directly involved in N metabolism were identified between the 750-1 and ZCFB cultivars. In 750-1, 110 unique DEGs were detected in the leaves, of which 103 were down-regulated, including genes associated with protein metabolism, photosynthesis, secondary metabolism, cell wall metabolism, stress response, and disease resistance. In ZCFB, 142 unique DEGs were detected in the roots, of which 117 were up-regulated, resulting in enhancement of processes such as protein degradation, secondary metabolites synthesis, lipid metabolism, endocytosis, the tricarboxylic acid cycle (TCA), transcriptional regulation, stress response, and disease resistance. Our results not only facilitate an understanding of the different regulatory process in low-N-tolerant and low-N-sensitive pepper cultivars, but also provide abundant candidate genes for improving the low-N tolerance of pepper cultivars.

1. Introduction

Nitrogen (N) is one of the most important macronutrients for plants, and it can be absorbed and assimilated by the roots in various forms, including nitrate, ammonium, and amino acids. Nitrate and ammonium are the most common forms used by plants, with nitrate being the dominant form [1]. N metabolism can be divided into three processes: uptake, assimilation, and remobilization. In the uptake stage, at least six transporters participate in nitrate uptake in Arabidopsis (NPF6.3/NRT1.1, NPF4.6/NRT1.2, NRT2.1, NRT2.2, NRT2.4, and NRT2.5) [2,3]. In the assimilation process, nitrate is reduced to ammonium by nitrate and nitrite reductases, and then the ammonium is assimilated into amino acids by glutamine synthetase (GS), glutamine antinotransferase (GOGAT), and asparagine synthetase (AS) [4]. The N remobilization process comprises protein degradation and amino acid transport. Several genes involved in the ubiquitin-26S proteasome pathway [5] and encoding amino acid transporters [6,7] have also been shown to be associated with these processes. These studies have provided important clues for understanding the mechanism of N metabolism. However, present knowledge about the complicated N regulatory network remains incomplete, and the molecular basis governing the genetic variation of N-use efficiency (NUE) among crop cultivars remains unclear.
Pepper (Capsicum annuum L.) is one of the most important vegetable crops of the Solanaceae family and is grown worldwide as a food, medicine source and ornamental plant [8]. It is well documented that, within a certain range, there is a positive correlation between the relative growth rate of pepper and the N concentration in the soil. However, inappropriate N utilization can lead to undesirable growth, yield, and quality [9,10]. In recent years, in areas with fertile soil, farmers have been using a higher amount of N fertilizer than is required, which has resulted in low NUE and serious environmental pollution [11]. By contrast, in some areas where the soil quality is poor, the need for a high input of N fertilizer represents a great economic burden on pepper growers [12]. Therefore, improving NUE is urgently needed for the development of sustainable pepper production. Genetic variation in NUE has been reported for different crops such as rice [13], barley [14], wheat [15], rapeseed [16], maize [17], and cotton [18], but molecular knowledge about the genetic variation of NUE is still very poor. Several genes responsible for improved NUE have been identified in rice, including DEP1 [19], OsNRT1.1B [20], OsNRT2.3b [21], ARE1 [22], OsNRT1.1A [23], and OsNPF6.1 [24]. Unfortunately, studies on the molecular regulation mechanism of N metabolism in pepper are scarce, let alone those studies focusing on NUE variation.
The next-generation high-throughput RNA sequencing technology (RNA-Seq) is a powerful tool for revealing genome-wide changes under biotic/abiotic stresses and can provide system level information regarding the N metabolism network. RNA-Seq analysis has been applied to the transcriptome analysis of low-N response of a single plant genotype, such as those of cucumber [25], maize [26], wheat [27], physic nut [28], and rice [29]. A large number of candidate genes involved in low-N response were detected [25,27,28,29]. Furthermore, the potential regulatory roles of IncRNAs in response to N stress have also been investigated [26]. However, it is difficult to reveal variations in NUE using only one genotype. Therefore, comparative transcriptome analysis of genotypes with different low N tolerances has become more recognized as a tool for understanding NUE [30,31,32,33,34,35]. A high abundance of transcripts related to high affinity nitrate transporters (NRT2.2, NRT2.3, NRT2.5, and NRT2.6) in the N-stress tolerant sorghum genotypes [31] and an energy-saving assimilation pattern in N-stress tolerant Tibetan wild barley genotype have been revealed [32].
The focus of this study was to identify low-N-responsive genes that were differentially expressed between low-N-tolerant and low-N-sensitive genotypes after long-term low-N stress, with the aim of providing more information on NUE variation. First, we examined the low-N tolerance of 100 pepper cultivars. Subsequently, we analyzed the genome-wide gene expression changes of two pepper cultivars with contrasting low-N tolerance under low-N stress. Lastly, the different low-N-responsive genes between the two cultivars were intensively analyzed using RNA-Seq and various bioinformatics methods, revealing potential new candidate genes for improving the low-N tolerance of pepper cultivars.

2. Materials and Methods

2.1. Screening of Pepper Cultivars with Different Low-N Tolerance

The low-N tolerance of 100 pepper cultivars was analyzed hydroponically in a greenhouse at the Chongqing Key Laboratory of Adversity Agriculture. Yamazaki nutrient solution for pepper was used as a sufficient-N solution containing 1.50 mM Ca(NO3)2·4H2O, 6.00 mM KNO3, 0.83 mM NH4H2PO4, 0.75 mM MgSO4·7H2O, 0.10 mM FeSO4·7H2O, 0.10 mM Na2EDTA, 0.05 mM H3BO3, 0.0008 mM ZnSO4·7H2O, 0.01 mM MnSO4·4H2O, 0.0003 mM CuSO4·5H2O, and 0.00002 mM (NH4)6Mo7O24·4H2O. Pepper seeds were soaked in warm water (55 °C) for 30 min, and then germinated in the dark on moist filter papers at 25–28 °C. Small buds were then transferred to foam boards floating in black plastic boxes filled with distilled water. The foam boards consisted of 15 uniform holes in which 15 plants grew. After seven days, the distilled water was changed to one-half-strength sufficient-N solution. A week later, the solution of half of the seedlings was changed to low-N solution, in which the concentrations of Ca(NO3)2·4H2O, KNO3, and NH4H2PO4 were 20% that of the sufficient-N solution, and the other nutrients were the same as the sufficient-N solution. Furthermore, K2SO4, KH2PO4, and CaCl2 were added in moderation to the low-N solution to avoid K, P, and Ca deficiency. The rest of the seedlings grew under N-sufficient condition as controls. Each cultivar had three replicates (15 plants/replicate) for each N condition (sufficient-N or low-N). The culture solution was refreshed every seven days at pH 6.2–6.4. All plants were grown in a greenhouse at 28 °C (day) and 25 °C (night) with a relative humidity of 70–80% and a photoperiod of 14/10 h, 300 μmol m−2 s−1. The leaf areas, shoot dry weights, root dry weights, and plant dry weights were evaluated 28 days later.

2.2. RNA Preparation and Sequencing

Seeds from the 750-1 (low-N-tolerant) and ZCFB (low-N-sensitive) pepper cultivars were germinated, and the seedlings were cultured under two different N conditions (sufficient-N and low-N) as described above. Four weeks later, the youngest fully expanded leaves and roots of the seedlings grown in sufficient-N solution and low-N solution were collected separately at 10:00–11:00 A.M., flash frozen in liquid N, and then stored at −80 °C. Samples were collected from 45 independent plants from three replicates (15 plants/replicates). Total RNA was extracted using an RNA Plant Kit (Aidlab Biotech, Beijing, China). The quantity and quality of total RNA was examined on a NanoDrop 2000 spectrophotometer (Thermo Fisher Scientific, Madison, WI, USA) and an Agilent 2100 Bioanalyzer (Waldbronn, Germany), respectively. cDNA libraries were constructed and sequenced on a BGISEQ-500 platform at BGI (Shenzhen, China).

2.3. Transcriptome De Novo Assembly, Gene Functional Annotation, and Differentially Expressed Genes (DEGs) Analyses

The raw reads of transcriptome sequencing were filtered using SOAPnuke v.15.2 (BIG, Shenzhen, China), and a set of clean reads was obtained. After de novo assembling, the clean reads were mapped to the pepper reference genome [36]. Genes were functionally annotated based on the NCBI non-redundant (Nr) [37], Gene Ontology (GO) [38], and the Kyoto Encyclopedia of Genes and Genomes (KEGG) databases [39]. For gene expression analysis, the numbers of matched reads were calculated and then normalized to RPKM by RSEM v.1.2.12. Significant differential expression genes (DEGs) were identified as those with a fold-change ≥ 2.0 and an FDR ≤ 0.001. DEGs were clustered using GO-Term Finder software, and pathway enrichment analysis was performed based on terms from the KEGG database.

2.4. Quantitative Real-Time PCR (qRT-PCR) Analysis

To verify the reliability of RNA-Seq data, total RNA was extracted from the leaves and roots of biological triplicates from the two sequenced genotypes, and the template cDNA samples were prepared using an iScrip First Strand Synthesis System Kit (Bio-Rad Laboratories, Hercules, CA, USA). Primers for each PCR reaction were designed to have a melting temperature of 58–62 °C and to produce a PCR product between 100 and 200 bp (Table S1). The pepper actin gene (AY572427) was used as an internal control. qRT-PCR reactions were performed using a CFX96TMReal-Time System (Bio-Rad Laboratories, Hercules, CA, USA). The reaction conditions were as follows: 95 °C for 30 s, 40 cycles of 95 °C for 5 s, and 60 °C for 30 s. The 2−∆∆Ct method was used to calculate the expression levels of genes.

3. Results

3.1. Screening for Pepper Cultivars with Contrasting Low-N Tolerance

To identify pepper cultivars with contrasting low-N tolerance, 100 pepper cultivars were screened based on various metrics. To avoid the effects of natural variation in individual embryos and/or endosperm size on initial growth from different genotypes, the relative value (low-N treated sample/control) of each character was used in the following analyses. Our results showed that peppers from these 100 cultivars had a wide range of relative values of leaf areas, shoots, roots, and plant dry weights, and the coefficient of variation (CV) of all of the relative values was above 15%, demonstrating the high variation in tolerance to low-N among cultivars (Table 1 and Table S2).
Cluster analysis was then carried out based on the relative values of leaf areas, shoot dry weights, root dry weights, and plant dry weights. The 100 pepper cultivars could be grouped into three clusters, consisting of five (Group I), six (Group II), and 89 (Group III) cultivars (Figure 1). There were significant differences in each characteristic between the three groups (Table 2). The mean relative values of each characteristic in Group I were significantly higher than those of Group II, and the mean relative values of each characteristic in Group III were between those of Groups I and II, indicating that Group I was a low-N-tolerant group, while Group II was a low-N-sensitive group.
750-1 had the highest values for the relative leaf area as well as shoot and plant dry weights (Table S2) and was classified into Group I. Thus, it was considered low-N tolerant. ZCFB had the lowest relative values of shoot, root and plant dry weights (Table S2) and was classified into Group II. This cultivar was therefore considered low-N sensitive.

3.2. RNA-Seq Analysis of Two Pepper Cultivars with Contrasting Low-N Tolerances

To better understand the molecular mechanism governing the genetic variation of N-use efficiency (NUE) in pepper cultivars, the global gene expression profile of two pepper genotypes (750-1 and ZCFB) with contrasting low-N tolerance was next analyzed using RNA-Seq. Samples were taken 28 days after low-N treatment, and the following samples were used for sequencing: TCL1 (750-1-leaf control), TCR2 (750-1-root control), TTL3 (750-1-leaf low-N treatment), TTR4 (750-1-root low-N treatment), SCL5 (ZCFB-leaf control), SCR6 (ZCFB-root control), STL7 (ZCFB-leaf low-N treatment), and STR8 (ZCFB-root low-N treatment). Sequence data are available from the NCBI SRA database with accession number PRJNA700470. Over 65 million clean reads were generated from each library. A total of 91.75–93.55% of these clean reads could be well aligned to the pepper reference genome, at least 69% could be uniquely mapped to the reference genome (71.88% on average). The number of genes with at least one mapped transcript were 29,167, 29,817, 28,970, 29,981, 29,330, 29,814, 29,078, and 30,335 for libraries TCL1, TCR2, TTL3, TTR4, SCL5, SCR6, STL7, and STR8, respectively (Table 3).

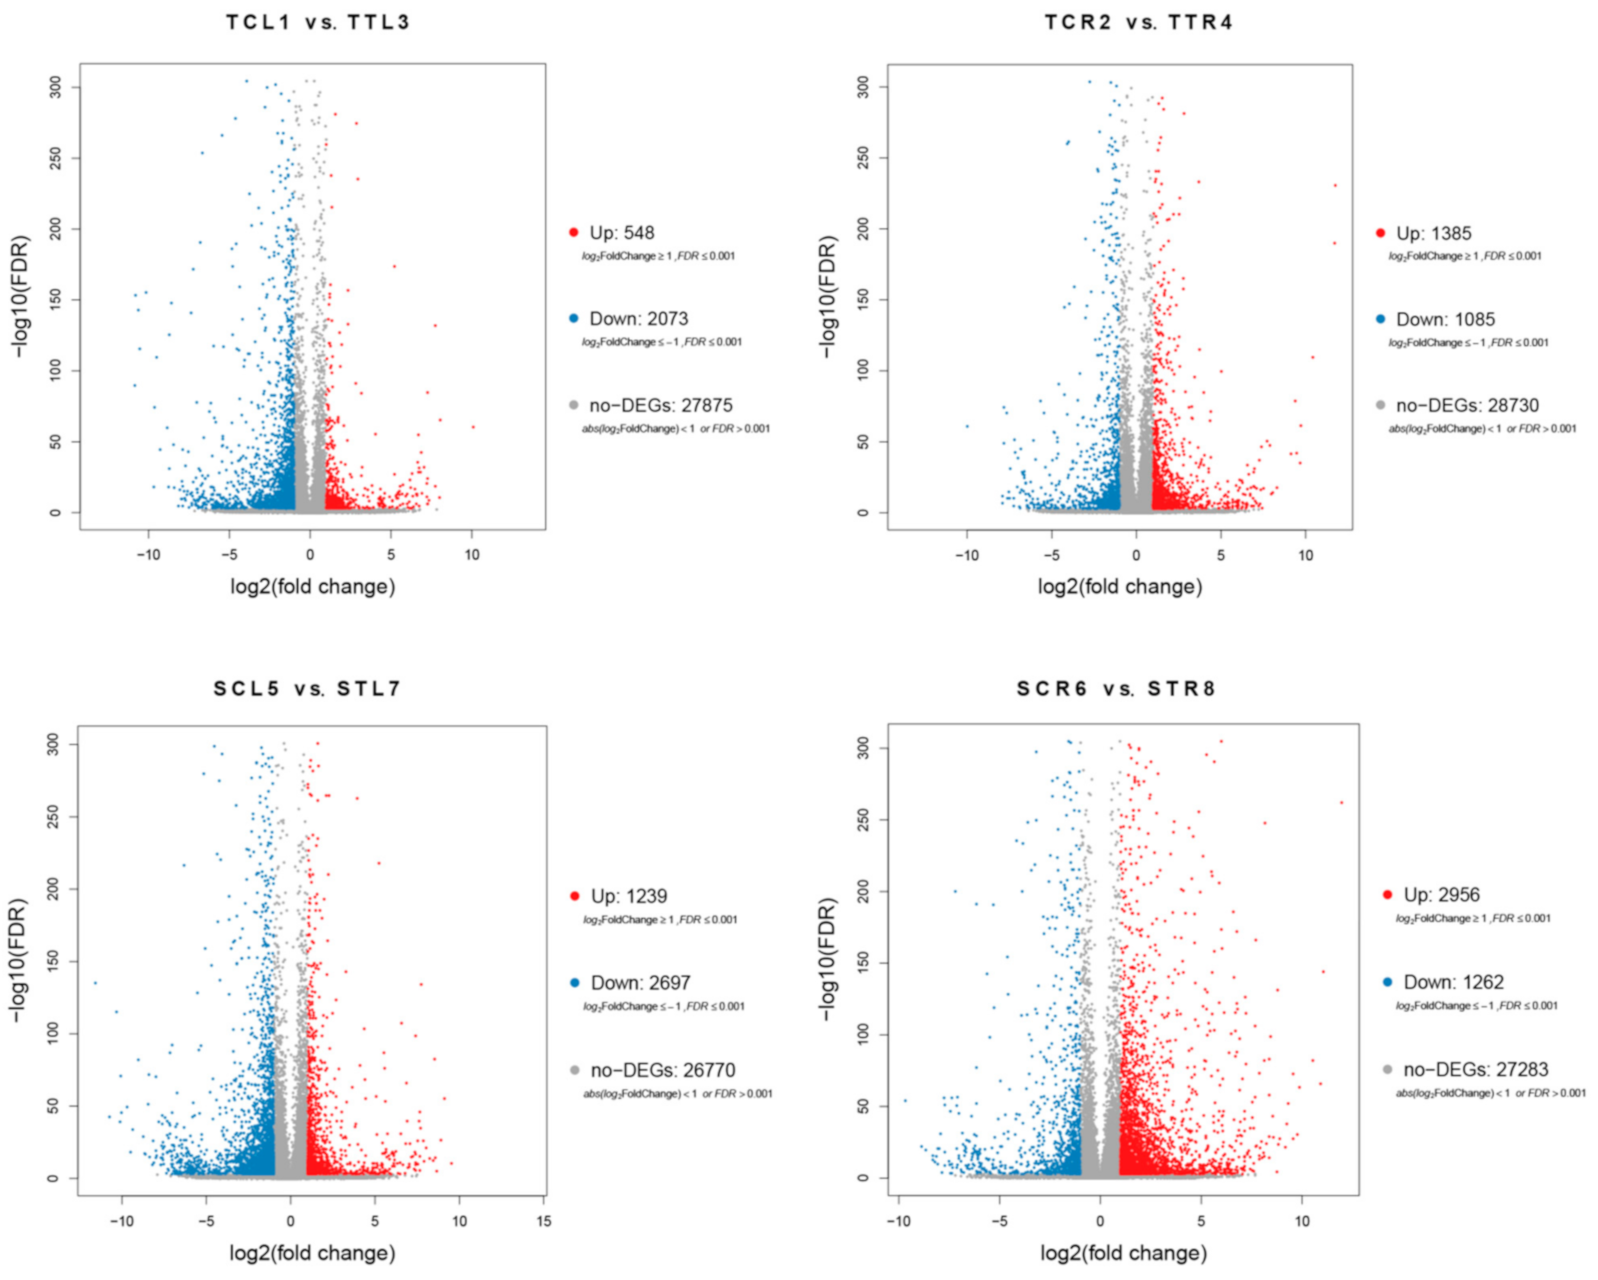
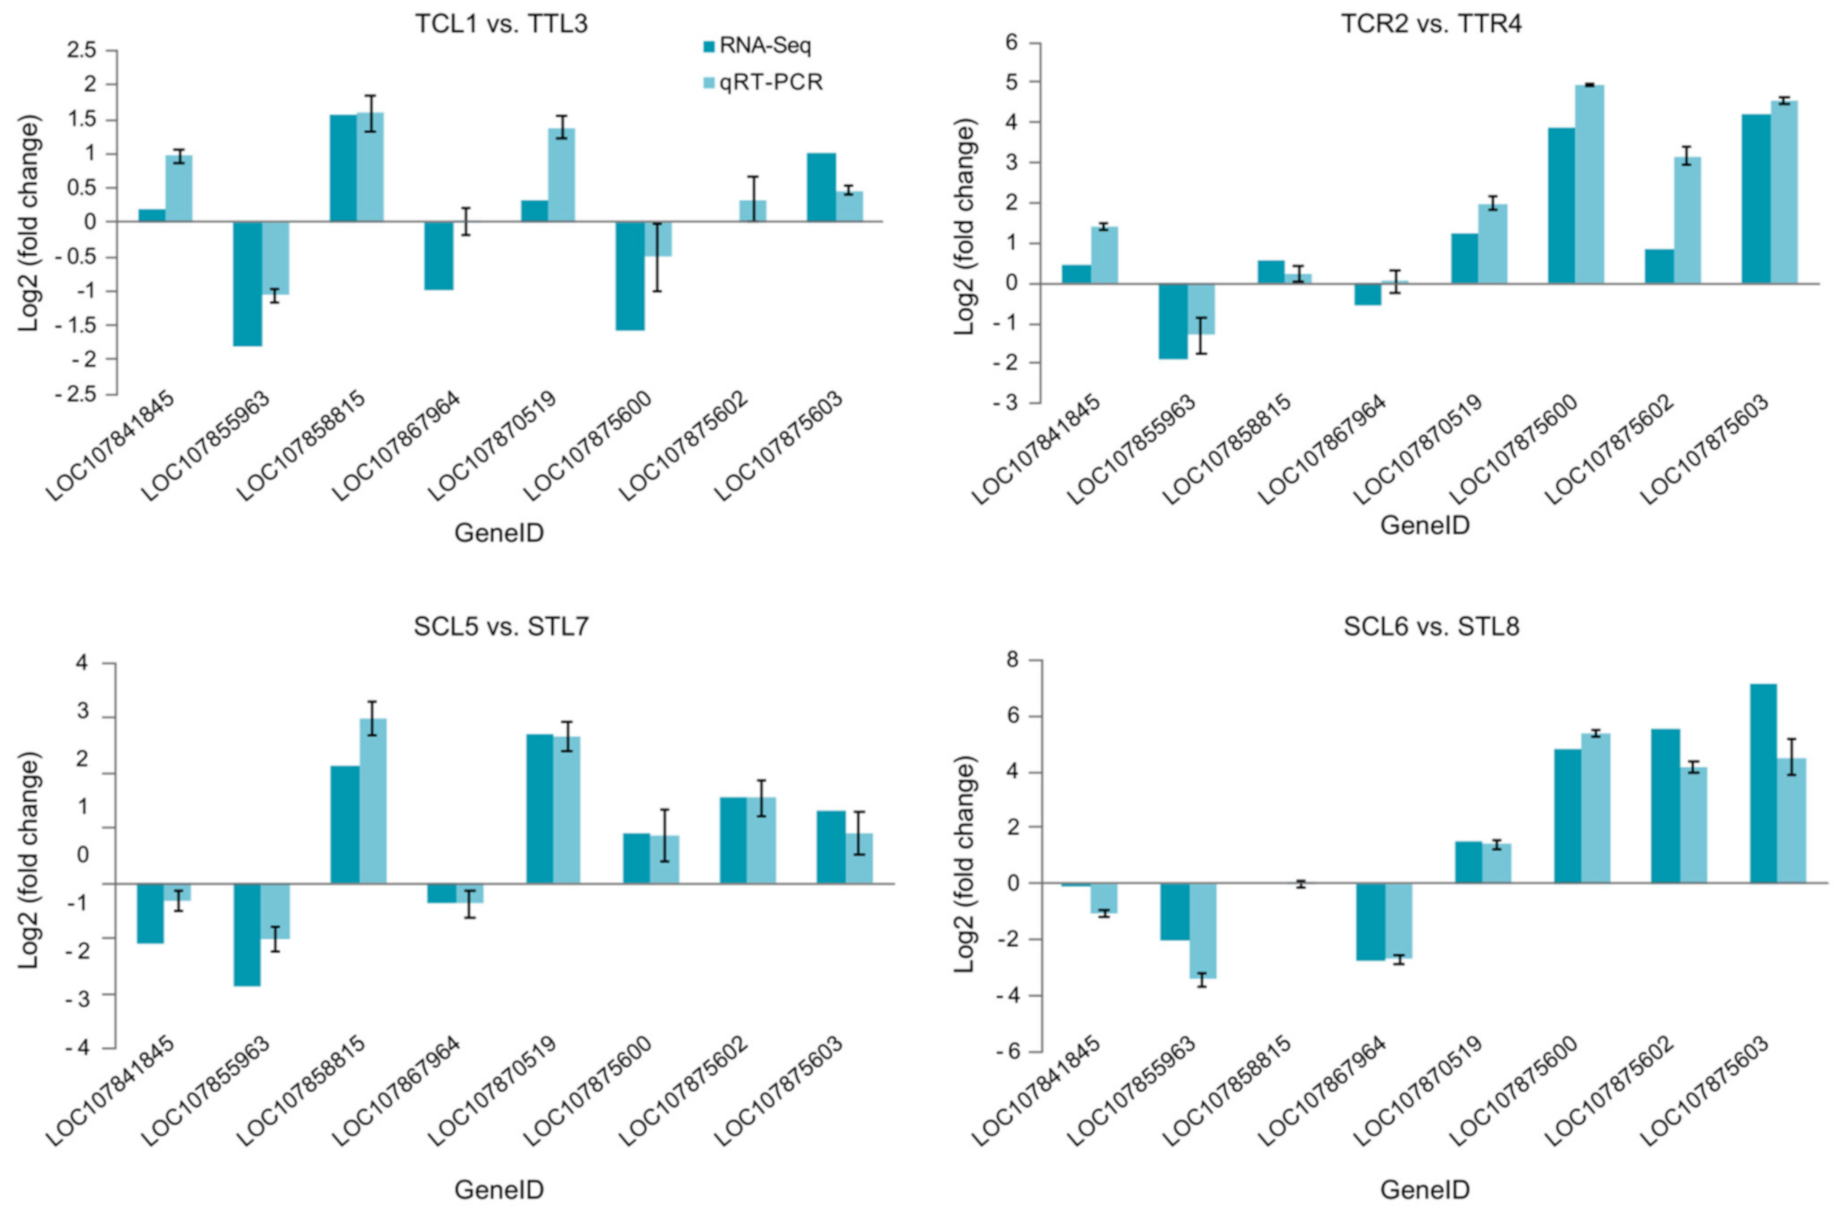
3.3. Identification of DEGs and Validation of RNA-Seq by qRT-PCR

To identify low-N-responsive genes, comparisons were made between the low-N treated samples and controls (Figure 2; Tables S3–S6). We found that 548/2073 differentially expressed genes (DEGs) (TCL1 vs. TTL3) were up/down-regulated in leaves, while 1385/1085 DEGs (TCR2 vs. TTR4) were up/down-regulated in the roots of 750-1. Additionally, 1239/2697 DEGs (TCL5 vs. TTL7) were up/down-regulated in leaves, and 2956/1262 DEGs (TCR6 vs. TTR8) were up/down-regulated in the roots of ZCFB.
To validate our RNA-Seq data, the expression levels of eight genes (LOC107841845, LOC107855963, LOC107858815, LOC107867964, LOC107870519, LOC107875600, LOC107875602, and LOC107875603) in the leaves and roots of 750-1 and ZCFB were next confirmed by qRT-PCR. The expression trends of the eight genes were consistent with our results from RNA-Seq in the eight libraries (Figure 3).

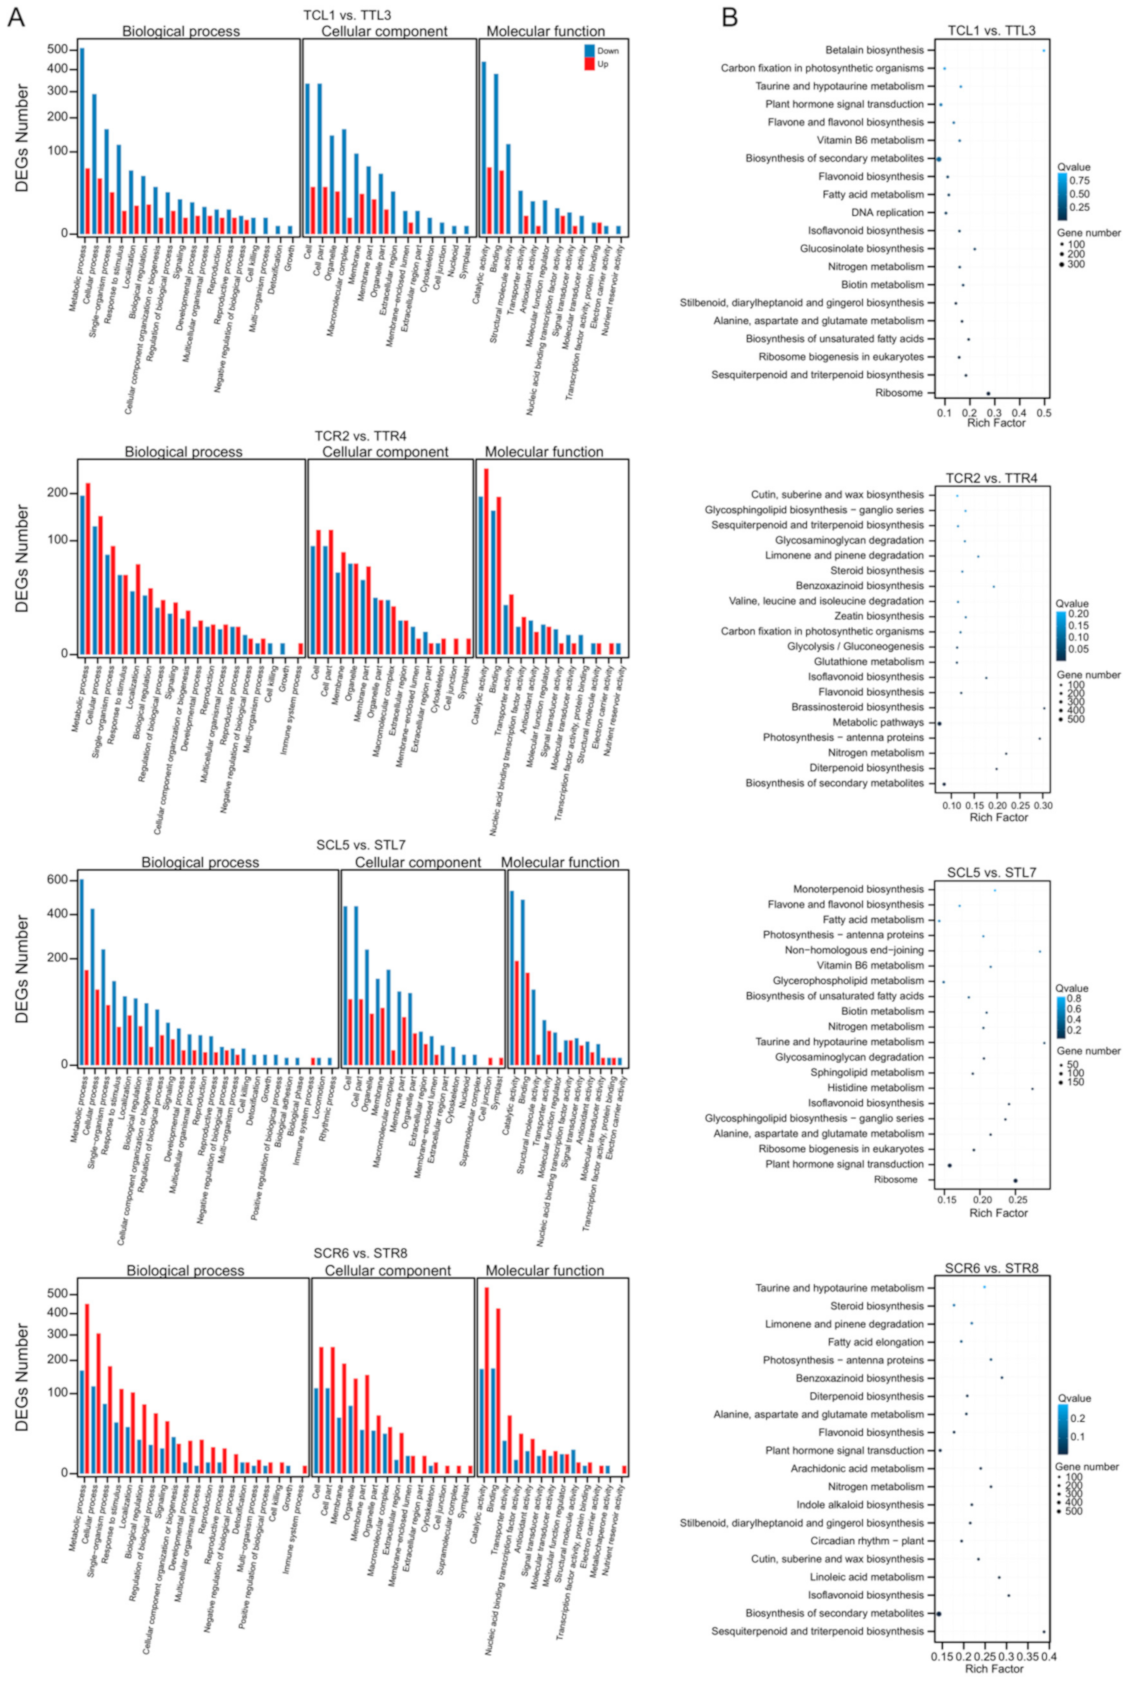
3.4. GO and KEGG Enrichment Analysis of DEGs

Next, GO analysis was carried out using the identified DEGs in the three main GO categories: biological process, cellular component, and molecular function (Figure 4A). KEGG pathway analysis showed that the DEGs involved in N metabolism were enriched in all of the four libraries (Figure 4B). The DEGs involved in nitrogen metabolism were then intensively analyzed. The DEGs associated with nitrate transportation, assimilation, and remobilization processes were detected in each genotype (Figure 5 and Figure S1A–D). The genes of the nitrate transporter family were up-regulated, especially in the roots, while N assimilation systems were suppressed. The genes participating in N remobilization were also enhanced. Overall, the expression patterns of the DEGs involved in N metabolism were similar in both genotypes. Thus, further analysis is needed to find clues governing different NUEs between the two genotypes examined.

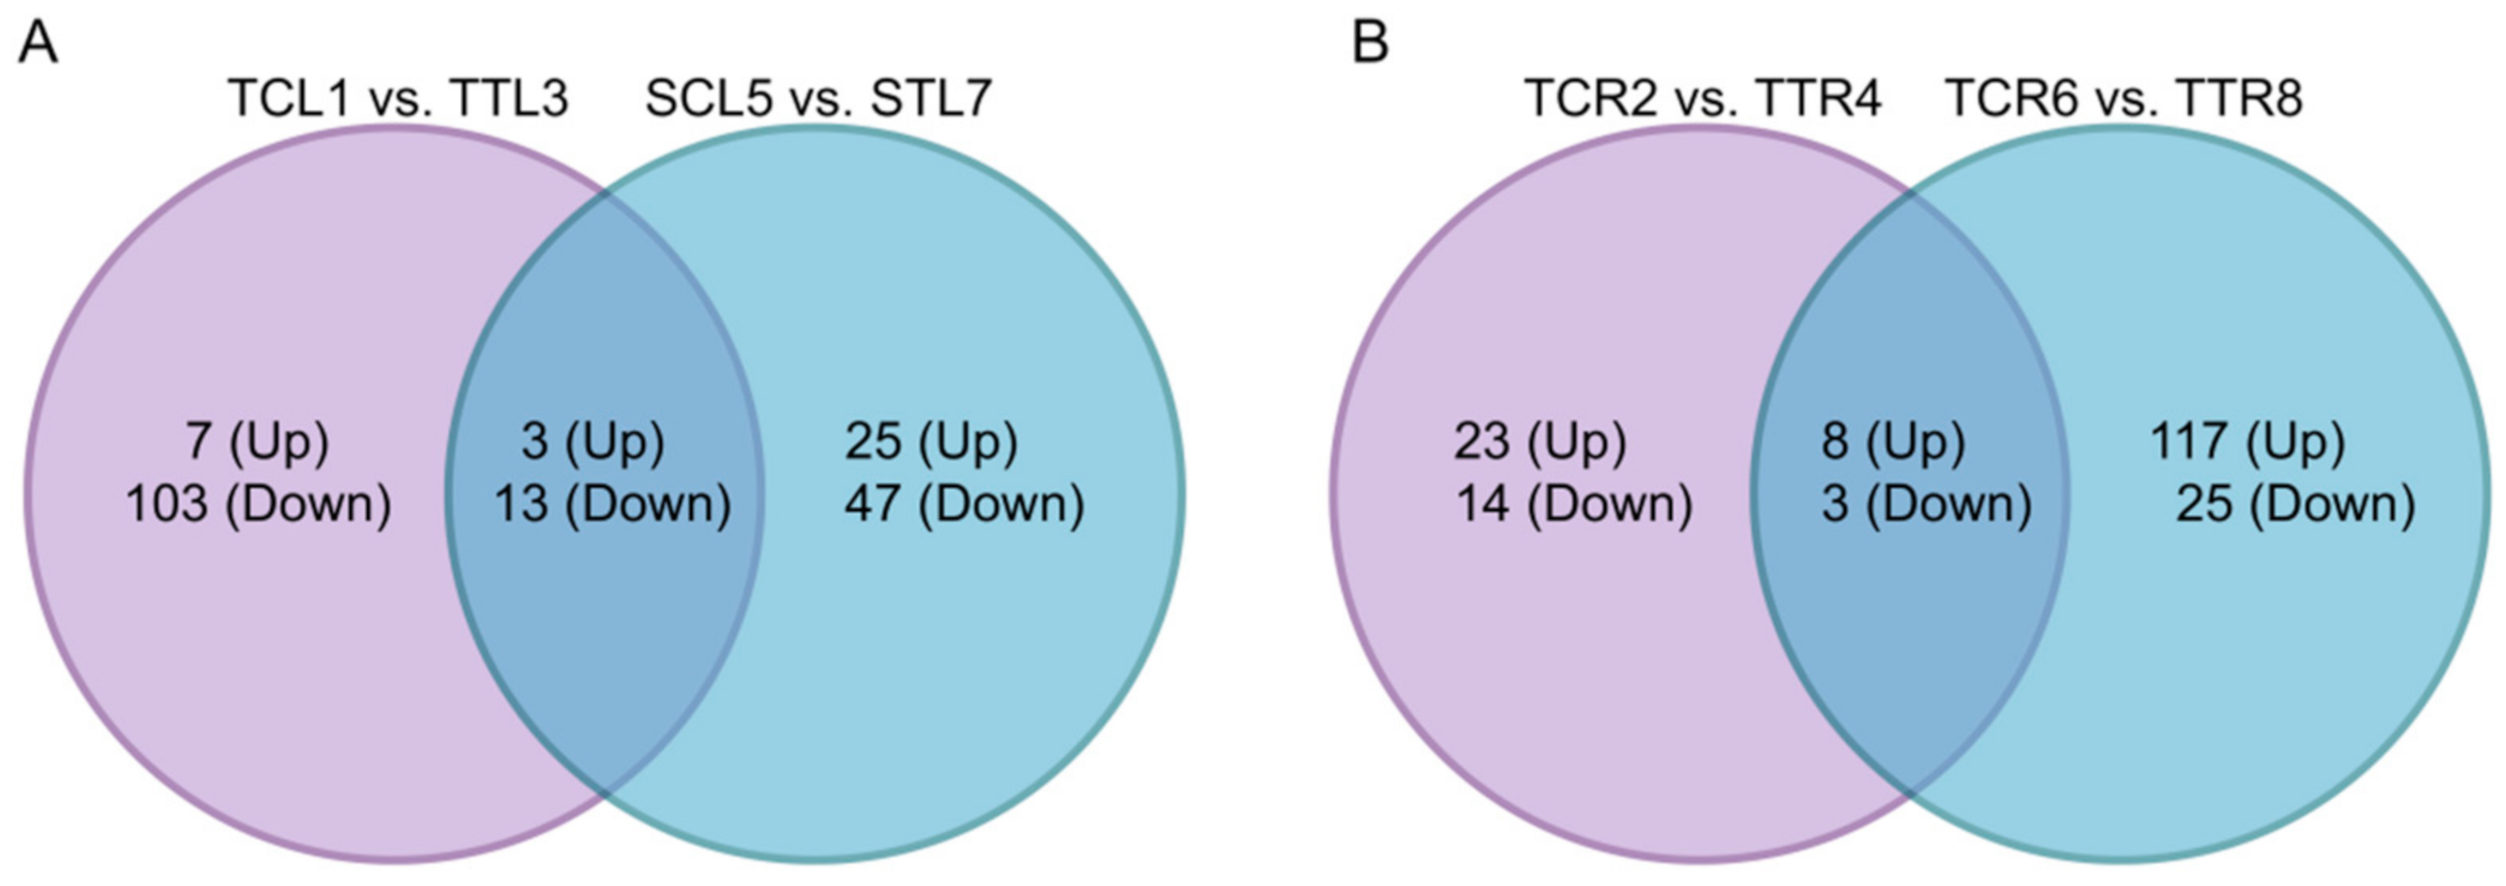
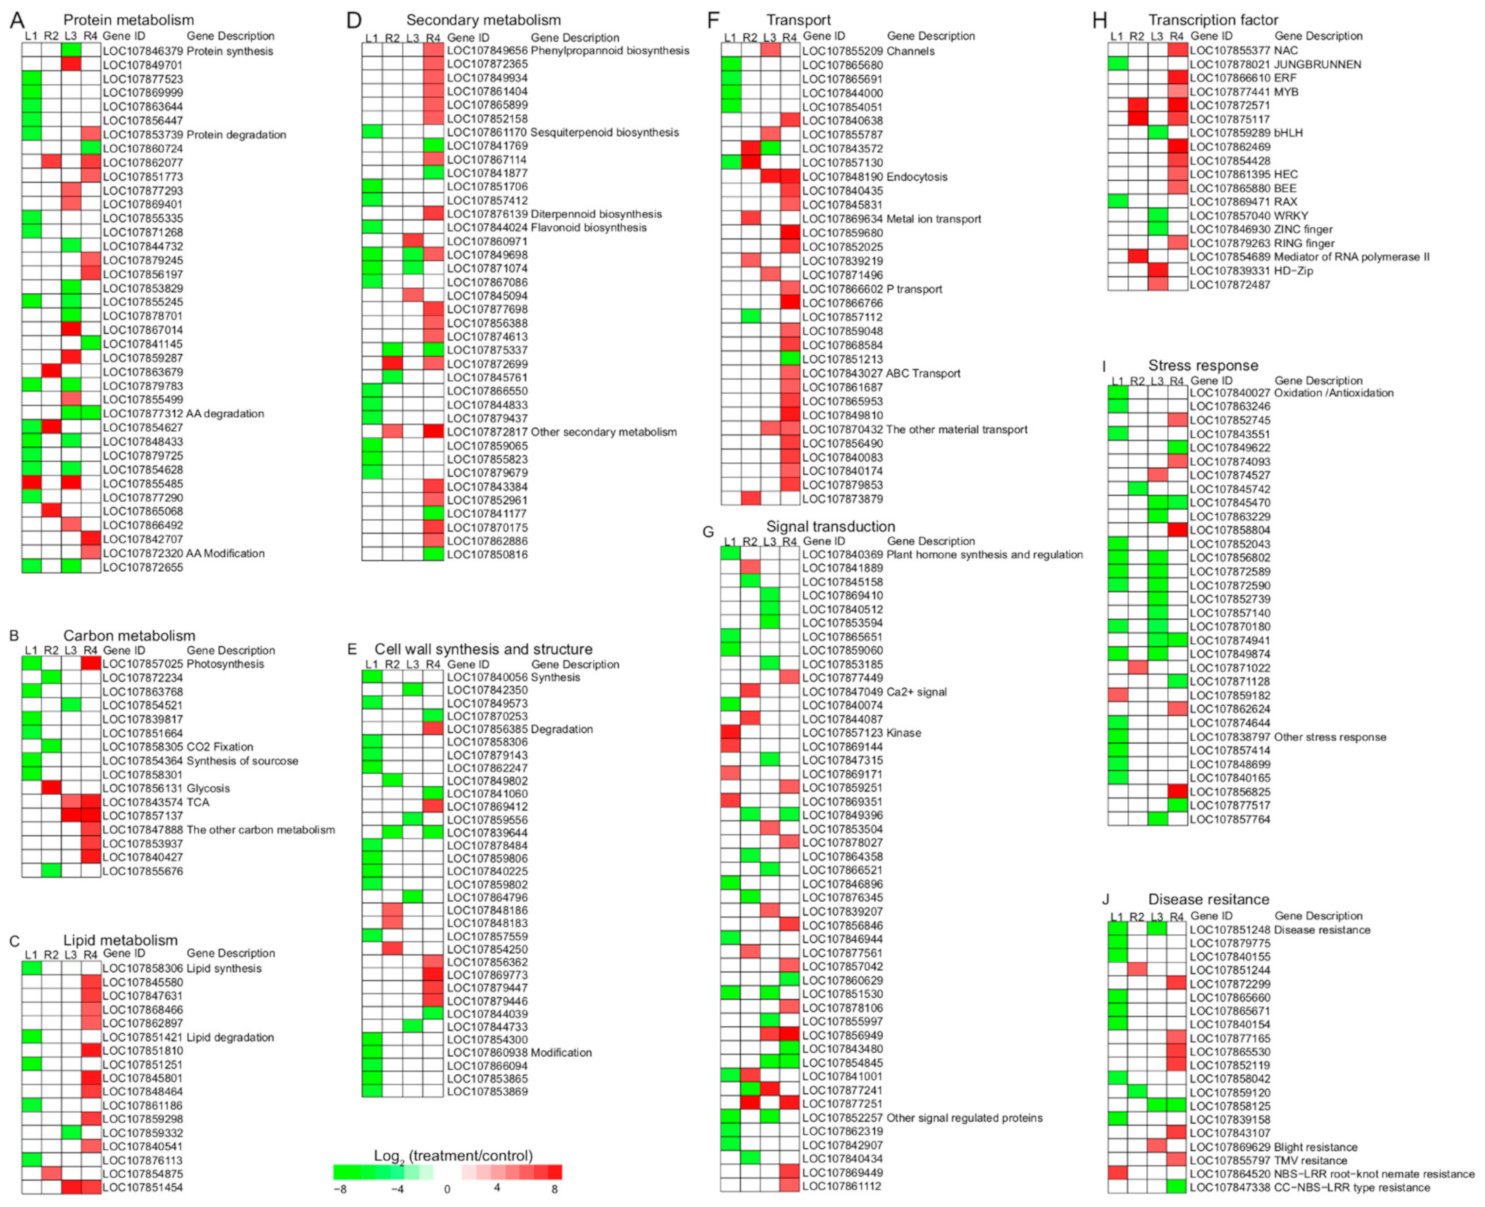
3.5. Different DEGs between Two Cultivars

To examine the different DEGs between the two cultivars, comparisons were made between the DEGs of 750-1 and ZCFB (Figure 6A,B). The absolute values of log2 fold-changes were set as equal to or greater than five. Furthermore, the DEGs involved in N metabolism, which were analyzed previously, were excluded from these analyses. The results indicated that 110 unique DEGs from 750-1 could be detected in leaves, and most were down-regulated (Figure 6A), while 142 unique DEGs from ZCFB were detected in roots, and most were up-regulated (Figure 6B). Most of the unique DEGs are described in the following section (Figure 7A–J).

3.5.1. Protein Metabolism

In 750-1, other than S-adenosylmethionine decarboxylase proenzyme (LOC107855485), all the unique DEGs required for protein metabolism were downregulated in the leaves (Figure 7A). In ZCFB, more than half of the genes associated with protein degradation were up-regulated, especially the members of ubiquitin-proteosome pathway (LOC107853739, LOC107862077, LOC107851773, LOC107877293, LOC107869401, LOC10789245, and LOC107856197).

3.5.2. Carbon and Lipid Metabolism

In the carbon metabolism process, genes associated with photosynthesis were down-regulated in the leaves of 750-1 (Figure 7B). Two genes (LOC107843574 and LOC107857137) of the tricarboxylic acid cycle (TCA) were upregulated in the leaves and roots of ZCFB. In the lipid metabolism process, DEGs involved in lipid synthesis and degradation were inhibited in the leaves of 750-1, while those in the roots of ZCFB were significantly enhanced, including members of the 3-ketoacyl-CoA synthase (LOC107845580, LOC107847631, and LOC107868466), fatty acid desaturase (LOC107851810), and phospholipase (LOC107859298) families (Figure 7C).

3.5.3. Secondary Metabolism

The genes responsible for the biosynthesis of phenylpropanoid, sesquiterpenoid, diterpenoid, flavonoid, anthocyanin, and other secondary metabolites showed altered expression under N starvation in both genotypes, including members of the cytochrome P450 family (LOC107844024, LOC107860971, LOC107849698, LOC107871074, LOC107867086, LOC107845094, LOC107877698, LOC107856388, and LOC107874613) and anthocyanin biosynthesis (LOC107845761 and LOC107866550) (Figure 7D). The flavonoid biosynthesis process consists of the largest number of DEGs followed by the phenylpropannoid biosynthesis process. All the unique DEGs in the leaves of 750-1 were repressed, while most of the unique DEGs in the roots of ZCFB were up-regulated.

3.5.4. Cell Wall Synthesis and Structure

In the leaves, all of the unique DEGs in this category were repressed in both of the genotypes, including xyloglucan 6-xylosyltransferase 2 (LOC107842350), which is responsible for cell wall synthesis in ZCFB, as well as Glucan edo-1,3-beta-glucosidase (LOC107879143) and beta-D-xylosidase (LOC107854300), which functions in cell wall degradation in 750-1 (Figure 7E). Most of these genes in the roots of the two genotypes were up-regulated, including probable pectate lyase 5 (LOC107848186 and LOC107848183) in 750-1 and putative pectinesterase 11 (LOC107869412) and polygalacturonase-like (LOC107856362 and LOC107869773) in ZCFB.

3.5.5. Transport

In 750-1, all of the unique DEGs engaged in transport were down-regulated in the leaves, including genes associated with osmosis (LOC107865680) and stoma movement (LOC107844000), while in the roots, except for the gene encoding sodium-dependent phosphate transporter protein 1 (LOC107857112), all of the genes were up-regulated, including metal (LOC107869634) and sugar transport (LOC107873879) (Figure 7F). In ZCFB, most of the genes were up-regulated in both of the leaves and roots, including genes associated with channel (LOC107855209), endocytosis (LOC107848190), sodium/metabolite and urea transport (LOC107871496 and LOC107870432) in the leaves, and gene encoding channel proteins (LOC107840638) and proteins involved in endocytosis (LOC107848190, LOC107840435, and LOC107845831) in the roots.

3.5.6. Signal Transduction and Transcription Factor

For hormone synthesis and regulation, all of the genes were inhibited in the leaves of both genotypes (Figure 7G), including those involved in ethylene synthesis (LOC107840369) and response (LOC107865651) in 750-1 and those associated with the auxin response (LOC107840512 and LOC107853594) in ZCFB. In 750-1, the genes of the LRR receptor-like serine/threonine-protein kinase family (LOC107869144, LOC107869171, and LOC107869351) and those involved in Ca2+ signaling (LOC107847049 and LOC107844087) were up-regulated in the leaves and roots, respectively. The genes of transcription factors (TFs) that showed changes in expression mainly fell into the MYB, bHLH, NAC, WRKY, BEE, and ERF families (Figure 7H).

3.5.7. Stress Response and Disease Resistance

In 750-1, most of the unique DEGs related to stress response and disease resistance were observable in the leaves, and except for protein SRG1-like (LOC107859182) and NBS-LRR root-knot nematode resistance protein (LOC107864520), all the DEGs of the two pathways were down-regulated (Figure 7I,J). Meanwhile, in ZCFB, DEGs involved in stress response and disease resistance were detected in both the leaves and roots, and most of the genes in the leaves were down-regulated, in contrast to in the roots.

4. Discussion

In this study, a large number of low-N-responsive genes were identified from low-N-tolerant (750-1) and low-N-sensitive (ZCFB) pepper genotypes after long-term N deficiency, and the number of low-N-responsive genes in ZCFB was far greater than those in 750-1 (Figure 2). The expression profiles of the genes associated with nitrate transport, assimilation, and remobilization were similar between the 750-1 and ZCFB (Figure 5). However, many unique DEGs were detected between the two pepper genotypes after long-term N deficiency, implying different molecular mechanisms of resistance to N deficiency in these two genotypes.

4.1. Unique DEGs in the Low-N-Tolerant Genotype

In 750-1, the unique DEGs involved in primary metabolism, secondary metabolism, stress response, and disease resistances were down-regulated in the leaves after long-term N deficiency. However, the relative biomass of 750-1 was significantly higher than that of the other cultivars (Table S2), indicating that the growth of 750-1 was repressed less than other cultivars under N starvation. The relative values of root dry weights and leaf areas of 750-1 were much higher than those of other cultivars (Table S2), implying a larger absorption area of N and stronger photosynthesis in 750-1. Interestingly, genes of somatic embryogenesis receptor kinase 2 (SERK2)-like (LOC107857123) and LRR receptor-like serine/threonine-protein kinase (LOC107869144 and LOC107869171) were up-regulated in the leaves of 750-1 (Figure 7G). Both SERK2 and LRR receptor-like serine/threonine-protein kinase belong to the receptor-like kinase (RLK) family. SERK2 is essential for male microsporogenesis in Arabidopsis [40]. It has been postulated that at an early low-N stress stage, processes such as absorption, transportation, and assimilation of N might be highly enhanced in 750-1 under low-N conditions, as well as primary metabolism, which could result in improved biomass accumulation in 750-1 relative to other cultivars. After long-term N limitation, 750-1 might slowly decrease vegetative growth and enter reproductive stage earlier to accelerate its life cycle and seed handing down.

4.2. Unique DEGs in the Low-N Sensitive Genotype

Lipids are a major subcellular component, the biosynthesis and composition of which are influenced by N [41,42]. As essential components of the membrane, lipids play an important role in endocytosis, in which plasma membrane lipids and associated proteins are internalized in vesicles that fuse with the endosomal system [43]. In our study, a number of DEGs involved in lipid metabolism were up-regulated in the roots of ZCFB (Figure 7C). Meanwhile, several genes associated with endocytosis were also enhanced (Figure 7F). In plants, endocytosis plays an important role not only in transporting membrane proteins, lipids, and extracellular molecules into the cell but also in nutrient delivery, toxin avoidance, and pathogen defense [44,45]. To our knowledge, few studies have detected the involvement of endocytosis in N starvation. Here, the detection of endocytosis-related genes being involved in N starvation could provide new insights into N metabolism in plants.
Secondary metabolites have no direct role in plant growth, but their roles in stress defense have garnered much interest in recent years [46,47]. In the present study, genes involved in the synthesis of secondary metabolites, such as phenylpropanoid and flavonoid, were significantly up-regulated after low-N stress in ZCFB, as well as those encoding ATP-binding cassette (ABC) transporters that are involved in the transport of plant secondary metabolites (Figure 7F) [48,49]. We also found that genes involved in the oxidation/antioxidation response (Figure 7H) and disease resistance (Figure 7I) were up-regulated in ZCFB, as well as the expression of genes belonging to the NAC, ERF, MYB, and bHLH families (Figure 7H), which play essential roles in stress response. Considering the low relative biomass of ZCFB (Table S2), enhanced secondary metabolism and stress response could suggest that there was a diversion of materials from primary metabolism to the defense system under N deficiency. Indeed, previous studies have shown that N limitation results in the reduction of plant growth; however, some secondary metabolites were also shown to accumulate [25,50]. Moreover, genes involved in the tricarboxylic acid cycle (TCA) were up-regulated in ZCFB (Figure 7B), implying that to survive N deficiency, ZCFB may require more energy to support enhanced biological processes, such as endocytosis, secondary metabolism, and transcriptional regulation.

4.3. P and N Crosstalk

Phosphorus (P) is acquired by plants primarily in the form of inorganic phosphate (Pi) by Pi transporters (PHT). The Nitrogen limitation adaptation (NLA) gene is involved in adaptive responses to low-N stress in Arabidopsis [51] and is an important regulator of PHTs under N deficiency [52,53,54,55]. Over-expression of the rice Pi transporter gene OsPT2 enhances tolerance to Pi deficiency, as well as N2 fixation and ammonium assimilation [56,57]. These studies indicate the intimate crosstalk between the N limitation and P deficiency response pathways. In the present study, Sodium-dependent phosphate transport protein 1 (LOC107857112) was repressed in the roots of 750-1, and PHT1;2 (LOC107866602) and PHT1;9 (LOC107866766) were up-regulated in the roots of ZCFB under low-N stress (Figure 7F), providing new information regarding the low-N induced crosstalk between N and P.

5. Conclusions

Improving NUE is urgently needed for the development of sustainable pepper production. However, present knowledge about the molecular basis governing the genetic variation of N-use efficiency (NUE) among pepper cultivars remains unclear. In this study, transcriptome of two pepper genotypes with contrary low-N tolerance (750-1, tolerant; ZCFB, sensitive) were compared using RNA-Seq and various bioinformatics methods after N starvation for 28 days. The results showed that the transcriptomic responses to low-N stress differed considerably between 750-1 and ZCFB, especially in genes that were not directly involved in N metabolism. The unique low-N-responsive genes between the two genotypes provide new insights for a comprehensive understanding of genotypic variation in NUE.

Supplementary Materials

The following are available online at https://0-www-mdpi-com.brum.beds.ac.uk/article/10.3390/horticulturae7050110/s1, Figure S1: DEGs involved in nitrogen metabolism. Table S1: Primers for qRT-PCR. Table S2: Relative values of each character. Table S3: DEGs of TCL1vs.TTL3. Table S4: DEGs of TCR2 vs. TTR4. Table S5: DEGs of SCL5 vs. STL7. Table S6: DEGs of SCR vs. STR8.

Author Contributions

Data curation, C.W., Y.L. and W.B.; formal analysis, C.W., K.L., R.H., Q.H. and Q.L.; investigation, C.W., S.Z., W.B., X.Y., H.W., Y.L.; methodology, C.W., Q.H. and Q.L.; project administration, R.H., S.Z., Q.H. and Q.L.; resources, S.Z., X.Y., R.H. and Q.H.; software, C.W. and W.B.; writing—original draft, C.W. and Y.L.; writing—review & editing, C.W., Y.L., K.L., R.H., Q.H. and Q.L. All authors have read and agreed to the published version of the manuscript.

Funding

This work was supported by grants from the China Agriculture Research System (CARS-24-A-04) and the Chongqing Science and Technology Bureau of China (cstc2019jscx-gksbX0123; cstc2020jscx-msxmX0054).

Institutional Review Board Statement

Not applicable.

Informed Consent Statement

Not applicable.

Data Availability Statement

The data supporting the findings of this study are available from the corresponding author upon reasonable request.

Conflicts of Interest

The authors declare no competing interest.

References

  1. Liu, Q.; Chen, X.; Wu, K.; Fu, X. Nitrogen signaling and use efficiency in plants: What’s new? Curr. Opin. Plant Biol. 2015, 27, 192–198. [Google Scholar] [CrossRef] [PubMed]
  2. Krapp, A.; David, L.C.; Chardin, C.; Girin, T.; Marmagne, A.; Leprince, A.S.; Chaillou, S.; Ferrario-Méry, S.; Meyer, C.; Daniel-Vedele, F. Nitrate transport and signalling in Arabidopsis. J. Exp. Bot. 2014, 65, 789–798. [Google Scholar] [CrossRef] [PubMed]
  3. Tegeder, M.; Masclaux-Daubresse, C. Source and sink mechanisms of nitrogen transport and use. New Phytol. 2018, 217, 35–53. [Google Scholar] [CrossRef] [PubMed] [Green Version]
  4. Xu, G.; Fan, X.; Miller, A.J. Plant nitrogen assimilation and use efficiency. Annu. Rev. Plant Biol. 2012, 63, 153–182. [Google Scholar] [CrossRef] [PubMed] [Green Version]
  5. Peng, M.; Bi, Y.M.; Zhu, T.; Rothstein, S.J. Genome-wide analysis of Arabidopsis responsive transcriptome to nitrogen limitation and its regulation by the ubiquitin ligase gene NLA. Plant Mol. Biol. 2007, 65, 775–797. [Google Scholar] [CrossRef] [PubMed]
  6. Feng, L.; Yang, T.; Zhang, Z.; Li, F.; Chen, Q.; Sun, J.; Shi, C.; Deng, W.; Tao, M.; Tai, Y.; et al. Identification and characterization of cationic amino acid transporters (CATs) in tea plant (Camellia sinensis). Plant Growth Regul. 2018, 84, 57–69. [Google Scholar] [CrossRef]
  7. Liu, S.; Wang, D.; Mei, Y.; Xia, T.; Xu, W.; Zhang, Y.; You, X.; Zhang, X.; Li, L.; Wang, N.N. Overexpression of GmAAP6a enhances tolerance to low nitrogen and improves seed nitrogen status by optimizing amino acid partitioning in soybean. Plant Biotechnol. J. 2020, 18, 1749–1762. [Google Scholar] [CrossRef] [PubMed] [Green Version]
  8. Qin, C.; Yu, C.; Shen, Y.; Fang, X.; Chen, L.; Min, J.; Zhang, Z. Whole-genome sequencing of cultivated and wild peppers provides insights into Capsicum domestication and specialization. Proc. Natl. Acad. Sci. USA 2014, 111, 5135–5140. [Google Scholar] [CrossRef] [PubMed] [Green Version]
  9. Ayodele, O.J.; Alabi, E.O.; Aluko, M. Nitrogen fertilizer effects on growth, yield and chemical composition of hot pepper (rodo). Int. J. Agric. Sci. 2015, 8, 666–673. [Google Scholar]
  10. Wahocho, N.A.; Zeshan Ahmed, S.; Jogi, Q.; Talpur, K.H.; Leghari, S.J. Growth and productivity of chilli (Capsicum annuum L.) under various nitrogen levels. Sci. Int. Lahore 2016, 28, 1321–1326. [Google Scholar]
  11. Zhu, J.H.; Li, X.L.; Christie, P.; Li, J.L. Environmental implications of low nitrogen use efficiency in excessively fertilized hot pepper (Capsicum frutescens L.) cropping systems. Agric. Ecosyst. Environ. 2005, 111, 70–80. [Google Scholar] [CrossRef] [Green Version]
  12. Amare, T.; Nigussie, D.; Kebede, W.T. Performance of hot pepper (Capsicum annuum) varieties as influenced by nitrogen and phosphorus fertilizers at Bure, Upper Watershed of the Blue Nile in Northwestern Ethiopia. Int. J. Agric. Sci. 2013, 3, 599–608. [Google Scholar]
  13. Sachiko, N.; Toriyama, K.; Yoshimichi, F. Genetic variations in dry matter production and physiological nitrogen use efficiency in rice (Oryza sativa L.) varieties. Breed. Sci. 2009, 59, 269–276. [Google Scholar]
  14. Anbessa, Y.; Juskiw, P.; Good, A.; Nyachiro, J.; Helm, J. Genetic variability in nitrogen use efficiency of spring barley. Crop Sci. 2009, 49, 1259–1269. [Google Scholar] [CrossRef]
  15. Górny, A.G.; Banaszak, Z.; Ługowska, B.; Ratajczak, D. Inheritance of the efficiency of nitrogen uptake and utilization in winter wheat (Triticum aestivum L.) under diverse nutrition levels. Euphytica 2010, 177, 191–206. [Google Scholar] [CrossRef] [Green Version]
  16. Bouchet, A.-S.; Laperche, A.; Bissuel-Belaygue, C.; Snowdon, R.; Nesi, N.; Stahl, A. Nitrogen use efficiency in rapeseed. Agron. Sustain. Dev. 2016, 36, 38. [Google Scholar] [CrossRef]
  17. Rodrigues, M.C.; Rezende, W.M.; Silva, M.E.J.; Faria, S.V.; Zuffo, L.T.; Galvão, J.C.C.; DeLima, R.O. Genotypic variation and relationships among nitrogen-use efficiency and agronomic traits in tropical maize inbred lines. Genet. Mol. Res. 2017, 16, gmr16039757. [Google Scholar] [CrossRef] [Green Version]
  18. Zhang, H.; Fu, X.; Wang, X.; Gui, H.; Dong, Q.; Pang, N.; Wang, Z.; Zhang, X.; Song, M. Identification and screening of nitrogen-efficient cotton genotypes under low and normal nitrogen environments at the seedling stage. J. Cotton. Res. 2018, 1, 6. [Google Scholar] [CrossRef] [Green Version]
  19. Sun, H.; Qian, Q.; Wu, K.; Luo, J.; Wang, S.; Zhang, C.; Fu, X. Heterotrimeric G proteins regulate nitrogen-use efficiency in rice. Nat. Genet. 2014, 46, 652–656. [Google Scholar] [CrossRef]
  20. Hu, B.; Wang, W.; Ou, S.; Tang, J.; Li, H.; Che, R.; Chu, C. Variation in NRT1.1B contributes to nitrate-use divergence between rice subspecies. Nat. Genet. 2015, 47, 834–838. [Google Scholar] [CrossRef]
  21. Fan, X.; Tang, Z.; Tan, Y.; Zhang, Y.; Luo, B.; Yang, M.; Lian, X.; Shen, Q.; Miller, A.; Xu, G. Overexpression of a pH-sensitive nitrate transporter in rice increases crop yields. Proc. Natl. Acad. Sci. USA 2016, 113, 7118–7123. [Google Scholar] [CrossRef] [Green Version]
  22. Wang, Q.; Nian, J.; Xie, X.; Yu, H.; Zhang, J.; Bai, J.; Zuo, J. Genetic variations in ARE1 mediate grain yield by modulating nitrogen utilization in rice. Nat. Commun. 2018, 9, 735. [Google Scholar] [CrossRef] [Green Version]
  23. Wang, W.; Hu, B.; Yuan, D.; Liu, Y.; Che, R.; Hu, Y.; Chu, C. Expression of the nitrate transporter gene OsNRT1.1A/OsNPF6.3 confers high yield and early maturation in rice. Plant Cell 2018, 30, 638–651. [Google Scholar] [CrossRef] [Green Version]
  24. Tang, W.; Ye, J.; Yao, X.; Zhao, P.; Xuan, W.; Tian, Y.; Wan, J. Genome-wide associated study identifies NAC42-activated nitrate transporter conferring high nitrogen use efficiency in rice. Nat. Commun. 2019, 10, 5279. [Google Scholar] [CrossRef] [Green Version]
  25. Zhao, W.; Yang, X.; Yu, H.; Jiang, W.; Sun, N.; Liu, X.; Gu, X. RNA-Seq-based transcriptome profiling of early nitrogen deficiency response in cucumber seedlings provides new insight into the putative nitrogen regulatory network. Plant Cell Physiol. 2015, 56, 455–467. [Google Scholar] [CrossRef] [Green Version]
  26. Lv, Y.; Liang, Z.; Ge, M.; Qi, W.; Zhang, T.; Lin, F.; Peng, Z.; Zhao, H. Genome-wide identification and functional prediction of nitrogen-responsive intergenic and intronic long non-coding RNAs in maize (Zea mays L.). BMC Genom. 2016, 17, 350. [Google Scholar] [CrossRef] [Green Version]
  27. Curci, P.L.; Cigliano, R.A.; Zuluaga, D.L.; Janni, M.; Sanseverino, W.; Sonnante, G. Transcriptomic response of durum wheat to nitrogen starvation. Sci. Rep. 2017, 7, 1176. [Google Scholar] [CrossRef]
  28. Kuang, Q.; Zhang, S.; Wu, P.; Chen, Y.; Li, M.; Jiang, H.; Wu, G. Global gene expression analysis of the response of physic nut (Jatropha curcas L.) to medium- and long-term nitrogen deficiency. PLoS ONE 2017, 12, e0182700. [Google Scholar]
  29. Xin, W.; Zhang, L.; Zhang, W.; Gao, J.; Yi, J.; Zhen, X.; Li, Z.; Zhao, Y.; Peng, C.; Zhao, C. An integrated analysis of the rice transcriptome and metabolome reveals differential regulation of carbon and nitrogen metabolism in response to nitrogen availability. Int. J. Mol. Sci. 2019, 20, 2349. [Google Scholar] [CrossRef] [Green Version]
  30. Hao, Q.N.; Zhou, X.A.; Sha, A.H.; Wang, C.; Zhou, R.; Chen, S.L. Identification of genes associated with nitrogen use efficiency by genome-wide transcriptional analysis of two soybean genotypes. BMC Genom. 2011, 12, 525. [Google Scholar] [CrossRef] [Green Version]
  31. Gelli, M.; Duo, Y.D.; Konda, A.R.; Zhang, C.; Holding, D.; Dweikat, I. Identification of differentially expressed genes between sorghum genotypes with contrasting nitrogen stress tolerance by genome-wide transcriptional profiling. BMC Genom. 2014, 15, 179–194. [Google Scholar] [CrossRef] [PubMed] [Green Version]
  32. Quan, X.; Zeng, J.; Ye, L.; Chen, G.; Han, Z.; Shah, J.; Zhang, G. Transcriptome profiling analysis for two Tibetan wild barley genotypes in responses to low nitrogen. BMC Plant Biol. 2016, 16, 30. [Google Scholar] [CrossRef] [PubMed] [Green Version]
  33. Li, W.; Xiang, F.; Zhong, M.; Zhou, L.; Liu, H.; Li, S.; Wang, X. Transcriptome and metabolite analysis identifies nitrogen utilization genes in tea plant (Camellia sinensis). Sci. Rep. 2017, 7, 1693. [Google Scholar]
  34. Sinha, S.K.; Sevanthi, V.A.M.; Chaudhary, S.; Tyagi, P.; Venkadesan, S.; Rani, M.; Mandal, P.K. Transcriptome analysis of two rice varieties contrasting for nitrogen use efficiency under chronic N starvation reveals differences in chloroplast and starch metabolism-related genes. Genes 2018, 9, 206. [Google Scholar] [CrossRef] [Green Version]
  35. Iqbal, A.; Dong, Q.; Wang, X.R.; Gui, H.P.; Zhang, H.H.; Zhang, X.L.; Song, M.Z. Transcriptome analysis reveals differences in key genes and pathways regulating carbon and nitrogen metabolism in cotton genotypes under N starvation and resupply. Int. J. Mol. Sci. 2020, 21, 1500. [Google Scholar]
  36. Available online: https://0-www-ncbi-nlm-nih-gov.brum.beds.ac.uk/genome/10896?genome_assembly_id=227510 (accessed on 3 August 2017).
  37. Available online: ftp://ftp.ncbi.nih.gov/blast/db (accessed on 3 August 2017).
  38. Available online: http://www.geneontology.org/ (accessed on 3 August 2017).
  39. Available online: http://www.genome.jp/kegg/ (accessed on 3 August 2017).
  40. Albrech, C.; Russinova, E.; Kemmerling, B.; Kwaaitaal, M.; de Vries, S.C. Arabidopsis somatic embryogenesis receptor kinase proteins serve brassinosteroid-dependent and -independent signaling pathways. Plant Physiol. 2008, 148, 611–619. [Google Scholar] [CrossRef] [Green Version]
  41. Yang, Y.; Yu, X.; Song, L.; An, C. ABI4 activates DGAT1 expression in Arabidopsis seedlings during nitrogen deficiency. Plant Physiol. 2011, 156, 873–883. [Google Scholar] [CrossRef] [Green Version]
  42. Liu, M.Y.; Burgos, A.; Ma, L.; Zhang, Q.; Tang, D.; Ruan, J. Lipidomics analysis unravels the effect of nitrogen fertilization on lipid metabolism in tea plant (Camellia sinensis L.). BMC Plant Biol. 2017, 17, 165. [Google Scholar] [CrossRef] [Green Version]
  43. D’Hondt, K.; Heese-Peck, A.; Riezman, H. Protein and lipid requirements for endocytosis. Annu. Rev. Genet. 2000, 34, 255–295. [Google Scholar] [CrossRef]
  44. Chen, X.; Irani, N.G.; Friml, J. Clathrin-mediated endocytosis: The gateway into plant cells. Curr. Opin. Plant Biol. 2011, 14, 674–682. [Google Scholar] [CrossRef]
  45. Fan, L.; Li, R.; Pan, J.; Ding, Z.; Lin, J. Endocytosis and its regulation in plants. Trends Plant Sci. 2015, 20, 388–397. [Google Scholar] [CrossRef]
  46. Isah, T. Stress and defense responses in plant secondary metabolites production. Biol. Res. 2019, 52, 39. [Google Scholar] [CrossRef] [Green Version]
  47. Khare, S.; Singh, N.B.; Singh, A.; Hussain, I.; Niharika, K.; Yadav, V.; Bano, C.; Yadav, R.K.; Amist, N. Plant secondary metabolites synthesis and their regulations under biotic and abiotic constraints. J. Plant Biol. 2020, 63, 203–216. [Google Scholar] [CrossRef]
  48. Yazaki, K. ABC transporters involved in the transport of plant secondary metabolites. FEBS Lett. 2006, 580, 1183–1191. [Google Scholar] [CrossRef] [Green Version]
  49. Lv, H.; Li, J.; Wu, Y.; Garyali, S.; Wang, Y. Transporter and its engineering for secondary metabolites. Appl. Microbiol. Biotechnol. 2016, 100, 6119–6130. [Google Scholar] [CrossRef]
  50. Larbat, R.; Robin, C.; Lillo, C.; Drengstig, T.; Ruoff, P. Modeling the diversion of primary carbon flux into secondary metabolism under variable nitrate and light/dark conditions. J. Theor. Biol. 2016, 402, 144–157. [Google Scholar] [CrossRef]
  51. Peng, M.; Hannam, C.; Gu, H.; Bi, Y.M.; Bothstein, S.J. A mutation in NLA, wich encodes a RING-type ubiquitin ligase, disrupts the adaptability of Arabidopsis to nitrogen limitation. Plant J. 2007, 50, 320–337. [Google Scholar] [CrossRef]
  52. Kant, S.; Peng, M.; Rothstein, S.J. Genetic regulation by NLA and microRNA827 for maintaining nitrate-dependent phosphate homeostasis in Arabidopsis. PLoS Genet. 2011, 7, e1002021. [Google Scholar] [CrossRef] [Green Version]
  53. Lin, W.Y.; Huang, T.K.; Chiou, T.J. Nitrogen limitation adaptation, a target of microRNA827, mediates degradation of plasma membrane-localized phosphate transporters to maintain phosphate homeostasis in Arabidopsis. Plant Cell 2013, 25, 4061–4074. [Google Scholar] [CrossRef] [Green Version]
  54. Park, B.S.; Seo, J.S.; Chua, N.H. Nitrogen limitation adaptation recruits phosphate2 to target the phosphate transporter PT2 for degradation during the regulation of Arabidopsis phosphate homeostasis. Plant Cell 2014, 26, 454–464. [Google Scholar] [CrossRef] [Green Version]
  55. Yue, W.; Ying, Y.; Wang, C.; Zhao, Y.; Dong, C.; Whelan, J.; Shou, H. OsNLA1, a RING-type ubiquitin ligase, maintains phosphate homeostasis in Oryza sativa via degradation of phosphate transporters. Plant J. 2017, 90, 1040–1051. [Google Scholar] [CrossRef] [Green Version]
  56. Chen, G.H.; Yan, W.; Yang, S.P.; Wang, A.; Gai, J.Y.; Zhu, Y.L. Overexpression of rice phosphate transporter gene OsPT2 enhances tolerance to low phosphorus stress in soybean. J. Agric. Sci. Technol. 2015, 17, 469–482. [Google Scholar]
  57. Zhu, W.; Yang, L.; Yang, S.; Gai, J.; Zhu, Y. Overexpression of rice phosphate transporter gene OsPT2 enhances nitrogen fixation and ammonium assimilation in transgenic soybean under phosphorus deficiency. J. Plant Biol. 2016, 59, 172–181. [Google Scholar] [CrossRef]
Figure 1. Cluster analysis of the low-nitrogen tolerance from 100 pepper cultivars.Cluster analysis was carried out based on the relative values of leaf area and shoot, root, and plant dry weights. Agglomerative hierarchical clustering was performed using the hclust algorithm in R, with dst = dist (dat1, method = “euclidean”) and hclust (dst, method = “average”). Group I, low-N-tolerant group; Group II, low-N-sensitive group; the low-nitrogen tolerance of Group III was between that of Groups I and II.
Horticulturae 07 00110 g001
Figure 2. Volcano plot of DEGs. The X-axis represents the value of the difference multiple after log2 conversion, and the Y-axis indicates the significance value after log10 conversation. The three colors red, blue, and gray, represent up-regulated DEGs, down-regulated DEGs, and unchanged genes, respectively.
Horticulturae 07 00110 g002
Figure 3. RNA-Seq results confirmed by qRT-PCR. A total of eight genes (LOC107841845, LOC107855963, LOC107858815, LOC107867964, LOC107870519, LOC107875600, LOC107875602, and LOC107875603) were examined by qRT-PCR. The pepper actin gene (AY572427) was used as an internal control.
Horticulturae 07 00110 g003
Figure 4. Function classifications of DEGs. (A): GO functional enrichment analysis of DEGs. The X-axis represents GO functional classification, and the Y-axis represents the number of up-regulated and down-regulated genes in each corresponding GO term. (B): Pathway enrichment analysis of DEGs. The X-axis represents enrichment factor values, and Y-axis represents pathway names.
Horticulturae 07 00110 g004
Figure 5. Heatmap of the DEGs involved in N metabolism. L1, TCL1 vs. TTL3; R2, TCR2 vs. TTR4; L3, TCL5 vs. TTL7; R4, TCR6 vs. TTR8.
Horticulturae 07 00110 g005
Figure 6. Venn diagram of unique DGEs in each genotype. (A): Unique DEGs in leaves. (B): Unique DEGs in roots. The absolute value of log2 fold change was equal to or greater than 5.
Horticulturae 07 00110 g006
Figure 7. Classification of unique DEGs. (A): Protein metabolism. (B): Carbon metabolism. (C): Lipid metabolism. (D): Secondary metabolism. (E): Cell wall synthesis and structure. (F): Transport. (G): Signal transduction. (H): Transcription factor. (I): Stress response. (J): Disease resistance. L1, TCL1 vs. TTL3; R2, TCR2 vs. TTR4; L3, SCL5 vs. SCL7; R4, SCR6 vs. STR8.
Horticulturae 07 00110 g007
Table 1. Range of relative values of growth characteristics in pepper seedlings.
IndexMeanRangeCV (%)
Relative value of leaf area0.630.38–0.9518.9
Relative value of shoot dry weight0.680.41–0.9916.8
Relative value of root dry weight1.080.66–1.6115.6
Relative value of plant dry weight0.730.44–1.0315.4
Table 2. The low-nitrogen tolerance of each cluster group.
ClusterRelative Value of Leaf AreaRelative Value of Shoot Dry WeightRelative Value of Root Dry WeightRelative Value of Plant Dry Weight
MeanRangeMeanRangeMeanRangeMeanRange
Group I0.86a0.75–0.950.90a0.81–0.991.46a1.31–1.610.97a0.89–1.03
Group II0.44c0.38–0.480.47c0.41–0.520.85c0.66–1.030.52c0.44–0.57
Group III0.63b0.41–0.910.68b0.52–0.941.08b0.67–1.440.73b0.57–0.99
Note: Values followed by different letters within the same column are significantly different at the 0.05 level.
Table 3. Summary of genome mapping.
SampleTotal Clean ReadsTotal Mapping RatioUniquely Mapping RatioTotal Gene Number
TCL166,496,25092.38%70.18%29,167
TCR266,186,55692.03%72.58%29,817
TTL365,608,34492.54%69.65%28,970
TTR465,388,72892.26%73.41%29,981
SCL565,498,81691.75%69.00%29,330
SCR665,052,66491.53%72.37%29,814
STL766,211,02693.55%72.20%29,078
STR866,062,77493.09%75.68%30,335
Publisher’s Note: MDPI stays neutral with regard to jurisdictional claims in published maps and institutional affiliations.

