Article

Phytochemical Profile and Antioxidant Properties of Italian Green Tea, a New High Quality Niche Product

Department of Agricultural, Forest and Food Sciences, University of Torino, Largo Paolo Braccini 2, 10095 Grugliasco, TO, Italy
*
Author to whom correspondence should be addressed.
Submission received: 15 March 2021 / Revised: 21 April 2021 / Accepted: 23 April 2021 / Published: 27 April 2021
(This article belongs to the Special Issue Nutritional and Antioxidant Value of Horticulturae Products)

Abstract

:
The hot beverage commonly known as tea results from the infusion of dried leaves of the plant Camellia sinensis (L.) O. Kuntze. Ranking second only to water for its consumption worldwide, it has always been appreciated since antiquity for its aroma, taste characteristics, and beneficial effects on human health. There are many different processed tea types, including green tea, a non-fermented tea which, due to oxidation prevention maintains the structure of the bioactive compounds, especially polyphenols; these bioactive compounds show a number of benefits for the human health. The main producers of tea are China and India, followed by Kenya, Sri Lanka, Turkey, and Vietnam, however recently new countries are entering the market, with quality niche productions, among which also Italy. The present research aimed to assess the bioactive compounds (polyphenols) and the antioxidant activity of two green teas (the “Camellia d’Oro” tea—TCO, and the “Compagnia del Lago” tea—TCL) produced in Italy, in the Lake Maggiore district, where nurserymen have recently started to cultivate C. sinensis. In this area the cultivation of acidophilic plants as ornamentals has been known since around 1820. Due to the crisis of the floricultural sector, producers have been trying to diversify their product in order to increase their competitiveness, starting to cultivate Italian tea. Their antioxidant activity was assessed, finding a similar or higher antioxidant capacity than in other green teas, as reported in literature. TCO showed a higher antioxidant activity (42,758.86 mmol Fe2+ kg−1; 532.37 µmol TE g−1 DW; 881.08 µmol TE g−1 DW) and phenolic content (14,918.91 mg GAE 100 g−1 DW) than TCL (25,796.61 mmol Fe2+ kg−1; 302.35 µmol TE g−1 DW; 623.44 µmol TE g−1 DW; 8540.42 mg GAE 100 g−1 DW). Through HPLC, a total of thirteen phenolic compounds were identified quantitatively, including catechins, benzoic acids, cinnamic acids, and flavonols, in TCO while only 9 in TCL, and mainly in lower amounts. Albeit with differences, both teas were found to be of quality proving that Italy could have the possibility to grow profitably C. sinensis.

1. Introduction

The hot beverage resulting from the infusion of dried leaves of the plant Camellia sinensis (L.) O. Kuntze is commonly known as tea [1,2]. Tea is one of the most popular nonalcoholic beverages consumed across the world, second only to water [3,4,5,6,7,8,9], so much appreciated since antiquity for its aroma, taste characteristics, and beneficial health effects [1], thus consumed as an herbal infuse and for its medicinal properties [5,6]. World tea consumption increased to 5.5 million tons by 2016, mostly due to a rapid growth in per capita income levels in China, India, and other emerging economies [10]. The World Bank foresees an increase in average tea auction price from USD 2.80 in 2017 to USD 2.84 in 2020, expecting an extension of the global tea market [11]. World tea production reached 5.73 million tons in 2016 [10], with China constituting of 42.6% of world tea production [10], accounting for USD 4 billion [12]. India, the second largest producer, recorded a production of 1.27 million tons in 2016.
There are many different types of teas, and most of them are prepared with the buds of two botanical varieties, C. sinensis var. sinensis and C. sinensis var. assamica (Masters) Wight [9,13]; their characteristics (i.e., appearance, organoleptic taste, chemical contents, and flavor) vary according to the fermentation level: tea can be categorized in nonfermented tea (i.e., green tea, and white tea), semifermented tea (i.e., oolong tea), and fermented tea (i.e., black tea and red tea) [5,6,9,14,15,16,17]. The 78% of the tea worldwide production is black tea, especially consumed in Western countries, 20% consists of green tea, which is usually consumed in Asian countries, and 2% regards Oolong tea, commonly consumed in southern China [14]. Globally, the production of green tea increased annually by 5.4% over the past decade, also due to green tea’s perceived health benefits [10].
Actually, fresh tea leaves contain chemical components such as polyphenols (catechins, flavonoids), alkaloids (caffeine, theobromine, etc.), volatile oils, polysaccharides, amino acids, lipids, vitamins (e.g., vitamin C), etc. [6,9,18]. Green teas are produced through steaming or roasting, thus inactivating the activity of polyphenol oxidase, preventing oxidation and so maintaining the structure of the phenolic compounds [1,5,18]. The resulting green teas show a polyphenol content varying from 30% to 42% of dry matter weight [14].
Due to its chemical constituents, tea shows many beneficial properties, such as antioxidant, anti-inflammatory, antiallergic, anticarcinogenic, antidiabetic, and antimicrobial effects [6,7,9,14,15,19,20,21]. A regular, daily consumption of green tea has been associated with many health benefits [7,22], which are mainly attributed to polyphenols, especially catechins [3,9,23].
Khan and Mukhtar (2007) reported that a balanced diet and the consumption of green tea can protect from oxidative stress and reduce reactive oxygen species damages to lipid membranes, proteins, and nucleic acids.
Moreover, many epidemiological studies investigated how tea consumption affected the incidence of cancer in humans, finding a protective and preventive effect of tea against various types of cancer (oral, pharyngeal, and laryngeal cancer) [14], but also healthy effects on many other pathologies involving oxidative stress.
Today, more than 50 countries produce different types of tea worldwide, not only as an herbal infuse pleasant to consume, but also for its well-known benefits on human health [2,5].
Tea evergreen plant (C. sinensis) [3,4] is native to South and Southwest China, the Indian Subcontinent, and Southeast Asia [2,24,25], then it became popular in India and Japan, and later in Europe and Russia [5,6]. The first plant specimens arrived in Europe were those studied by Linnaeus in 1763 [26], although the tea beverage had already reached Europe in the XVII century. However, tea cultivation has remained a prerogative of Asian countries, while in Europe the cultivation of the congeneric species Camellia japonica has spread for ornamental purposes only. The first camellia (C. japonica) was introduced in Italy at the end of the XVII century, in Caserta (Campania, South Italy) [27,28]. Since then its cultivation gradually became popular, reaching central and northern Italy, especially Tuscany, Piedmont, and Lombardy [27].
The critical period of the floricultural sector caused by globalization [27,29], since the end of the past decade forced Italian producers of the Lake Maggiore district (Piedmont region) to diversify their final products in order to increase their competitiveness, starting to cultivate C. sinensis in order to produce Italian green tea.
Currently there are no studies related to the quality of tea produced in Italy, thus, the aim of the present research was to assess the main bioactive compounds (polyphenols), and beneficial properties (antioxidant activity) of two green teas produced in this new productive context.

2. Materials and Methods

2.1. Plant Material and Site Characteristics

Camellia sinensis var. sinensis dried leaves were kindly provided by “La Compagnia del Lago” and “La Camelia d’Oro” plantations, both located in the Lake Maggiore area, in Piedmont—North Italy. Seedlings of camellia derived from acclimatization specimen from parks and botanical gardens located in the Lake Maggiore area (i.e., Villa Taranto, Isola Madre and Villa Anelli, Verbania municipality, Piedmont region), and were grown differently in the two nurseries. The “Compagnia del Lago” plantation is located in the municipality of Premosello Chiovenda (VB) (45°55′57.6″ N 8°27′16.1″ E), where the annual average maximum temperature was 19.8 °C (July showed the highest monthly average temperature, with 30.6 °C), the annual average minimum temperature was 7.8 °C (January showed the lowest monthly average temperature, with −3.6 °C), and the annual average rainfall was 122.8 mm (March showed the highest monthly average rainfall, with 279.0 mm, while October showed the lowest monthly average rainfall, with 0.0 mm) for the investigation year 2017 (Figure 1). The seedlings were planted in the ground at a distance of 2.20 m in the row, in a stony sloping terrain, managed as a meadow for more than a century. Irrigation was made by drip-wing system when occurred. The plants were not fertilized.
The “Camelia d’Oro” plantation is located in Pallanza (VB) (45°56′47.9″ N 8°35′12.6″ E), where the annual average maximum temperature was 19.2 °C, the annual average minimum temperature was 9.2 °C, and the annual average rainfall was 135.6 mm for the investigation year 2017 (Figure 1). Here, before planting the seedlings, the soil was tilled with a milling cutter and a bottom fertilization with organic manure burial powder (Humus Vita, Fomet Spa, San Pietro di Morubio (VR), Italy) (25 kg per 100 m2. N, P, and K were all present as 3–4% of the total amount, accounting on average for 8.75 g of each per m2. Organic matter accounted for 38–45%, thus on average 103.75 g per m2 of it were added.) was made. The plants were transferred to the ground, at a distance of 0.8 m in a row and 1.2 m in the inter-row, resulting in 1 plant per m2. The hole in the ground was made with a drill and 2.5 L of Blond peat were added to each plant as a soil improver. The plants were tamped down and mulched with an organic mulching consisting in a mix of wood chips and leaves. In May, a cover fertilization with an organic ox-blood fertilizer (10 cc per plant) (Biostan, Aifar Agrochimica Srl, Ronco Scrivia (GE), Italy) was performed. Plants were irrigated with drip-wing irrigation with about 1.6 L of water per plant per day.

2.2. Tea Harvest and Preparation

In both plantations, fresh tea shoots with one (late spring or September harvest) or two (spring harvest between late April and early May) tender leaves and a bud were harvested.
After harvesting, tea leaves were steamed for about 1–2 min; once dried, the leaves were roasted and rolled on a hot pan at about 80 °C for about 10–15 min to stop the fermentation. They were then left in a dryer at 40 °C for 18 h, and finally stored in plastic containers at room temperature.
Thus, green teas were obtained from dried leaves received from: “La Camelia d’Oro” plantation (TCO—Tea Camellia d’Oro), providing us with samples of one shoot with one leaf (first harvest), and “La Compagnia del Lago” plantation (TCL—Tea Compagnia del Lago), providing us with a mixture of the two harvests.

2.3. Tea Extract Preparation

The dried leaves were ground with a mortar and pestle into a fine powder. Two hundred milliliter of deionized water was heated to 100 °C. One gram of dried tea leaves powder was added to the cooling water and left to infuse for 10 min, being stirred every two minutes. The infusion was filtered with paper filters (Whatman filter papers No. 1, Whatman, Maidstone, UK), and then with polytetrafluoroethylene (PTFE, VWR International, Milano, Italy) filters, with a 25 mm diameter and 0.45 µm pore size.
Both infusions were diluted with deionized water to obtain the working solution and maintained at −20 °C for the following analysis.

2.4. Bioactive Compounds

2.4.1. Total Polyphenols

The total phenolic content of diluted TCL (dilution 1:1 = 1 mL deionized water: 1 mL infusion) and TCO (dilution 1:2 = 1.2 mL deionized water: 600 µL infusion) was determined following the Folin-Ciocalteu method, as indicated by Singleton et al. [30]. The analysis was performed as follows: 1000 µL of diluted 1:10 Folin reagent were mixed with 200 µL of infusion in each plastic tube. The samples were left in the dark at room temperature for 10 min, then 800 µL of Na2CO3 (7.5%) were added to each tube. Samples were left in the dark at room temperature for 30 min. Absorbance was then measured at 765 nm by means of a spectrophotometer (Cary 60 UV-Vis, Agilent Technologies, Santa Clara, CA, USA), and the results were expressed in milligrams of gallic acid equivalents per 100 g of dry weight (mg GAE 100 g−1 DW). Analysis was performed in six replicates per infusion type.

2.4.2. Antioxidant Activity

FRAP Assay

The first procedure adopted to evaluate the antioxidant activity of diluted TCL (1:2 = 1.2 mL deionized water: 600 µL infusion) and TCO (1:3 = 1.5 mL deionized water: 500 µL infusion) was the ferric ion reducing antioxidant power (FRAP) method [31].
The FRAP solution was obtained by mixing a buffer solution at pH 3.6 (C2H3NaO2*3H2O + C2H4O2 in water), 2,4,6-tripyridyltriazine (TPTZ, 10 mM in HCl 40 mM), and FeCl3*6H2O (20 mM).
The antioxidant activity was determined mixing 30 µL of diluted infusion with 90 µL of deionized water and 900 µL of FRAP reagent. The samples were then placed at 37 °C for 30 min. Absorbance was measured at 595 nm by means of a spectrophotometer (Cary 60 UV-Vis, Agilent Technologies, Santa Clara, CA, USA). The antioxidant activity was plotted against a FeSO4*7H2O calibration curve. Extraction solution (water) without infusion was used as a control sample. Results were expressed as millimoles of ferrous iron equivalents per kilogram (mmol Fe2+ kg−1 DW). Analysis was performed in six replicates per infusion type.

DPPH Assay

The second procedure was the 2,2-diphenyl-1-picrylhydrazyl (DPPH) radical scavenging method [32].
The working solution of DPPH radical cation (DPPH˙, 100 µM) was obtained by dissolving 2 mg of DPPH in 50 mL of MeOH. The solution must have an absorbance of 1000 (±0.05) at 515 nm. To prepare the samples, 40 µL of diluted infusion were mixed with 3 mL of DPPH˙. Samples were then left in the dark at room temperature for 30 min. Absorbance was measured at 515 nm by means of a spectrophotometer (Cary 60 UV-Vis, Agilent Technologies, Santa Clara, CA, USA). The DPPH radical-scavenging activity was calculated as:
[(Abs0 − Abs1)/Abs0] × 100
where Abs0 is the absorbance of the control (extraction solution without infusion) and Abs1 is the absorbance of the sample. The antioxidant capacity was plotted against a Trolox calibration curve and results were expressed as µmol of Trolox equivalents per gram of dry weight (µmol TE g-1 DW). Analysis was performed in six replicates per infusion type.

ABTS Assay

The third procedure was the 2,20-azino-bis-(3-ethylbenzothiazoline-6-sulphonic acid) (ABTS) method [33].
The working solution of ABTS radical cation (ABTS˙) was obtained by the reaction of 7.0 mM ABTS stock solution with 2.45 mM potassium persulfate (K2S2O8) solution. After incubating for 12–16 h in the dark at room temperature, the working solution was diluted with distilled water to obtain an absorbance of 0.7 (±0.02) at 734 nm. The antioxidant activities of the diluted TCL (1:2) and TCO (1:3) infusions were assessed mixing 30 µL of infusion with 2 mL of diluted ABTS˙. The samples were left in the dark for 10 min. Absorbance was then measured at 734 nm by means of a spectrophotometer (Cary 60 UV-Vis, Agilent Technologies, Santa Clara, CA, USA). The ABTS radical-scavenging activity was calculated as:
[(Abs0 − Abs1)/Abs0] × 100
where Abs0 is the absorbance of the control (extraction solution without infusion) and Abs1 is the absorbance of the sample. The antioxidant capacity was plotted against a Trolox calibration curve and results were expressed as µmol of Trolox equivalents per gram of dry weight (µmol TE g-1 DW). Analysis was performed in six replicates per infusion type.

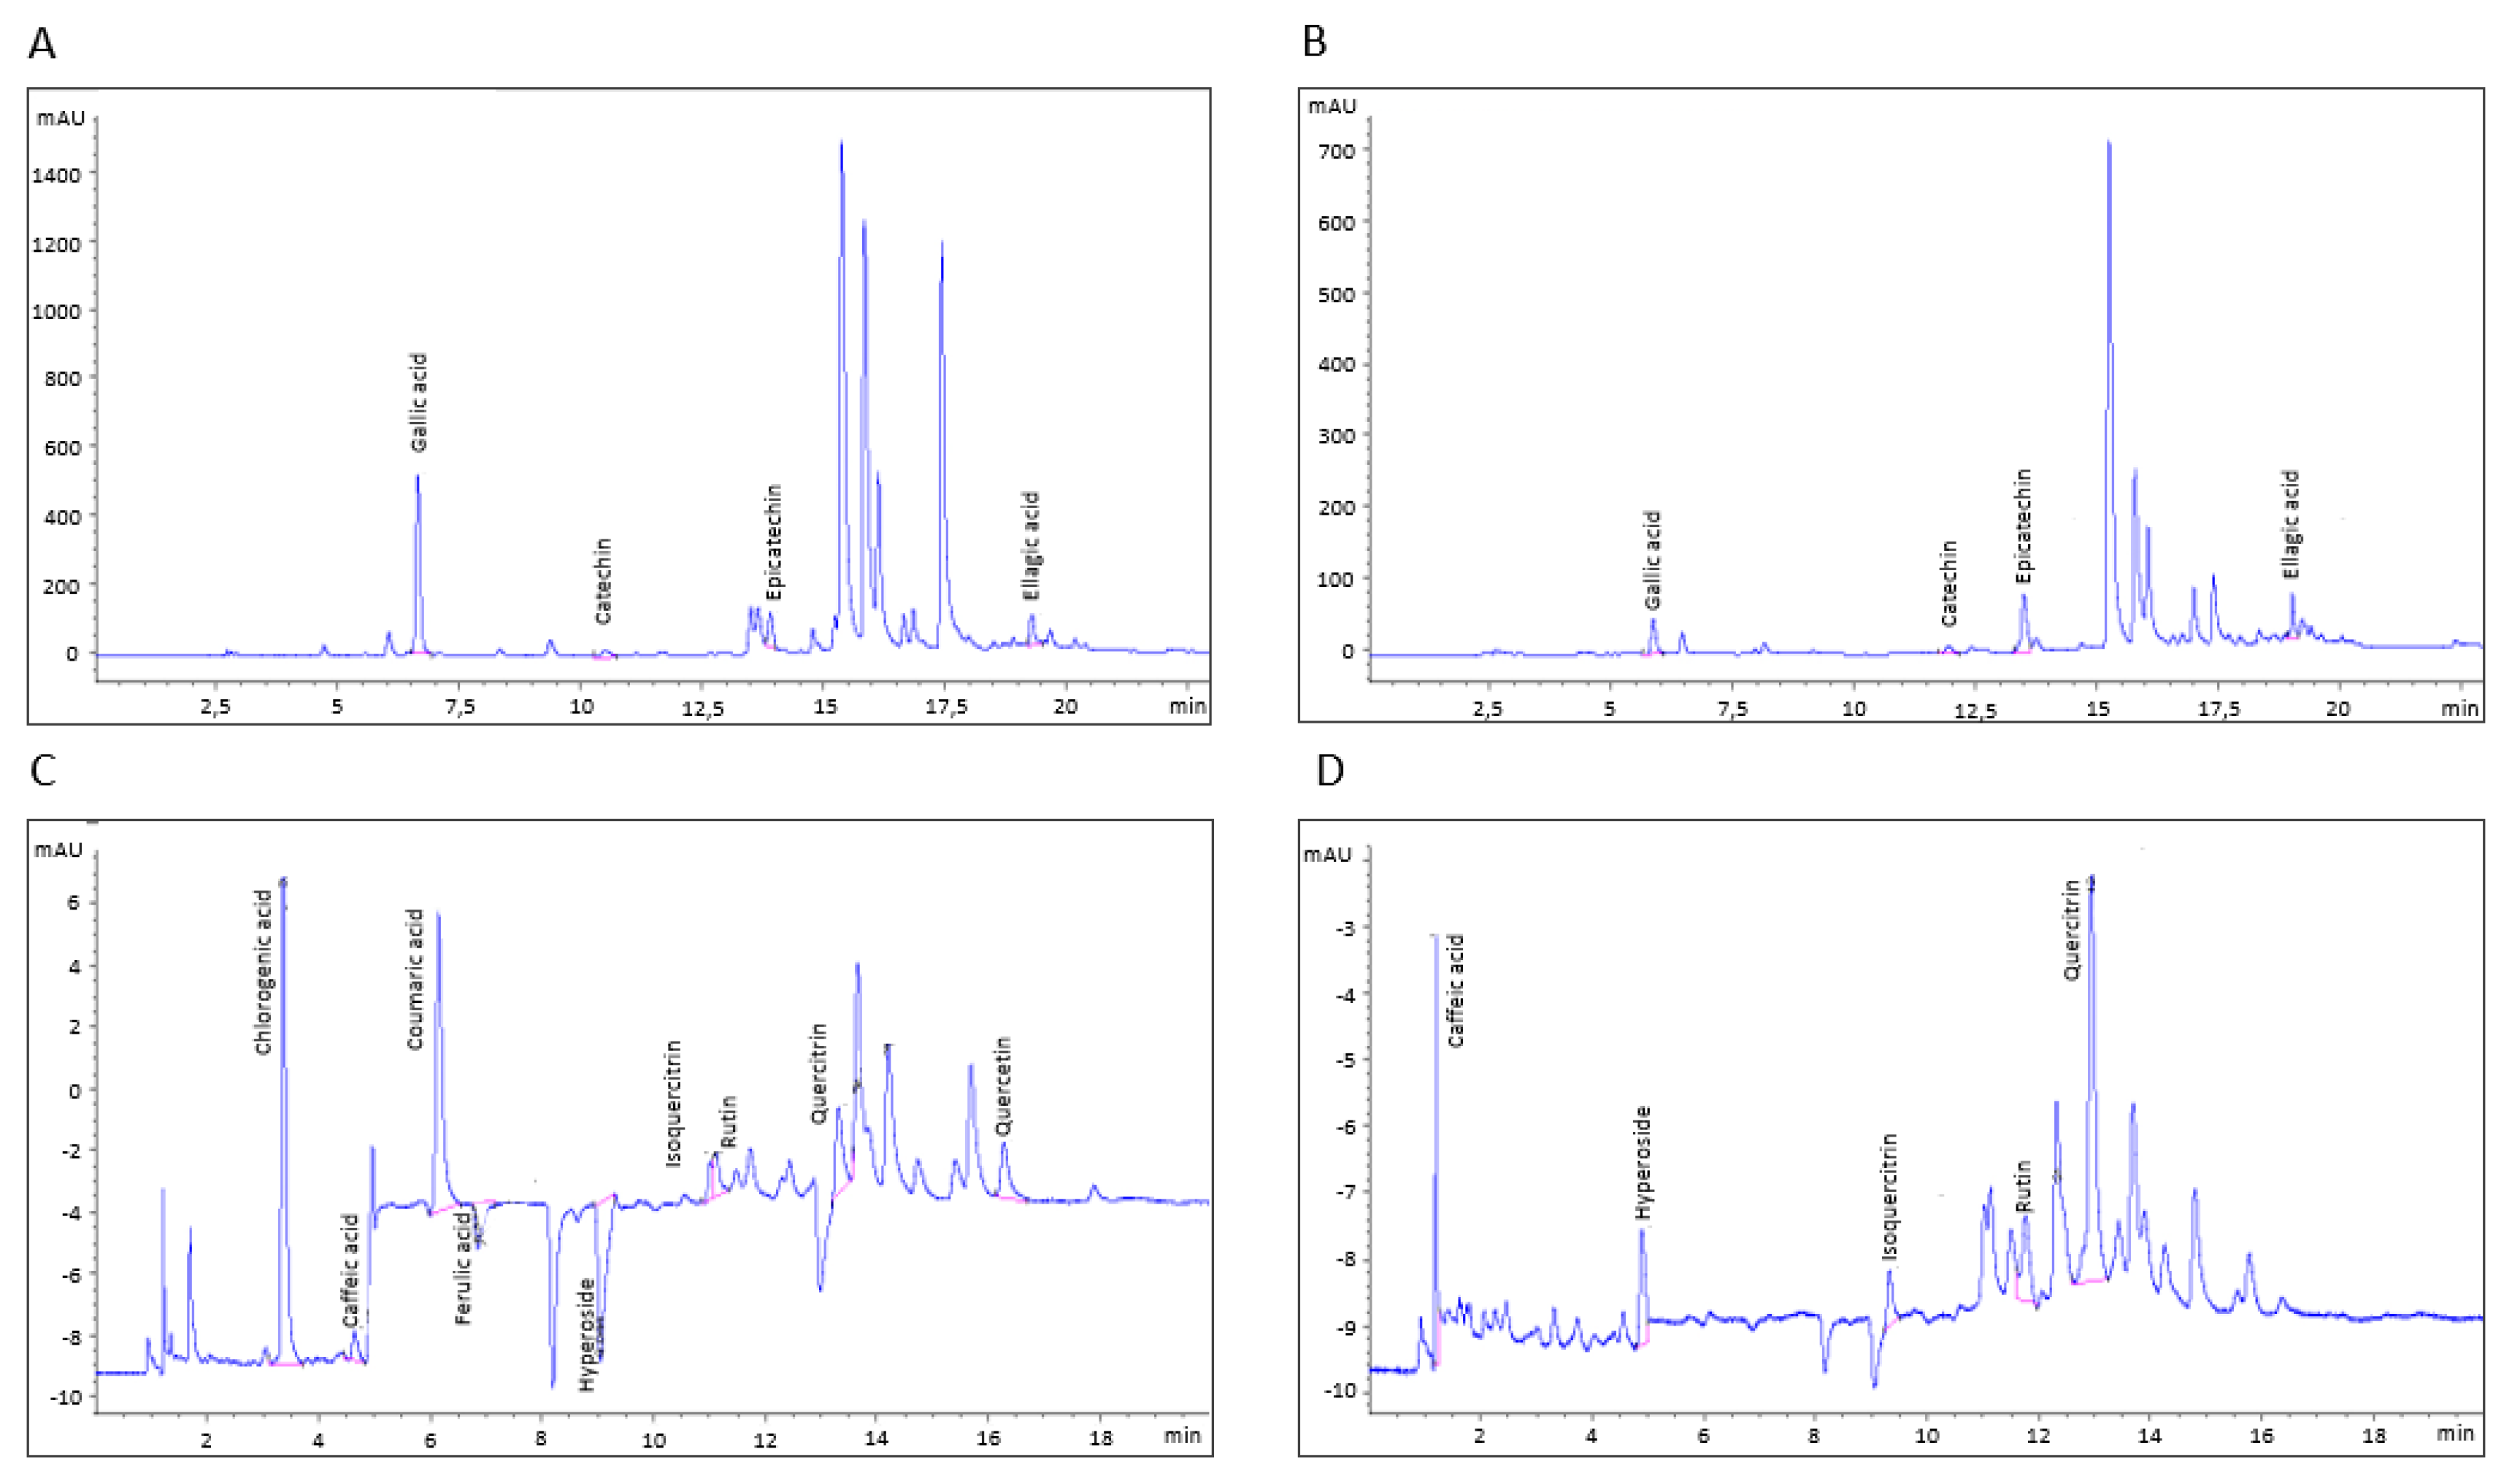
2.4.3. Identification and Quantification of Bioactive Compounds by HPLC

The bioactive compounds contained in the infusions were determined by means of two high performance liquid chromatography-diode array detection (HPLC–DAD) method [34], using an Agilent 1200 High-Performance Liquid Chromatograph coupled to an Agilent UV-Vis diode array detector (Agilent Technologies, Santa Clara, CA, USA). Detailed chromatographic methods are reported in Table 1. Phytochemical separation was performed with a Kinetex C18 column (4.6 × 150 mm, 5 µm, Phenomenex, Torrance, CA, USA), using different mobile phases for compound identification and recording of UV spectra at different wavelengths, based on HPLC methods, as previously tested and validated [35,36] with some modifications. UV spectra were recorded at 330 nm and 280 nm. The following bioactive compounds were determined: cinnamic acids (caffeic acid, chlorogenic acid, coumaric acid, ferulic acid), flavonols (hyperoside, isoquercitrin, quercetin, quercitrin, rutin), benzoic acids (ellagic acid, gallic acid), catechins (catechin, epicatechin). All single compounds were identified by a comparison and combination of their retention times and UV spectra with those of authentic standards under the same chromatographic conditions. Results were expressed as mg 100 g−1 of dry weight (DW).

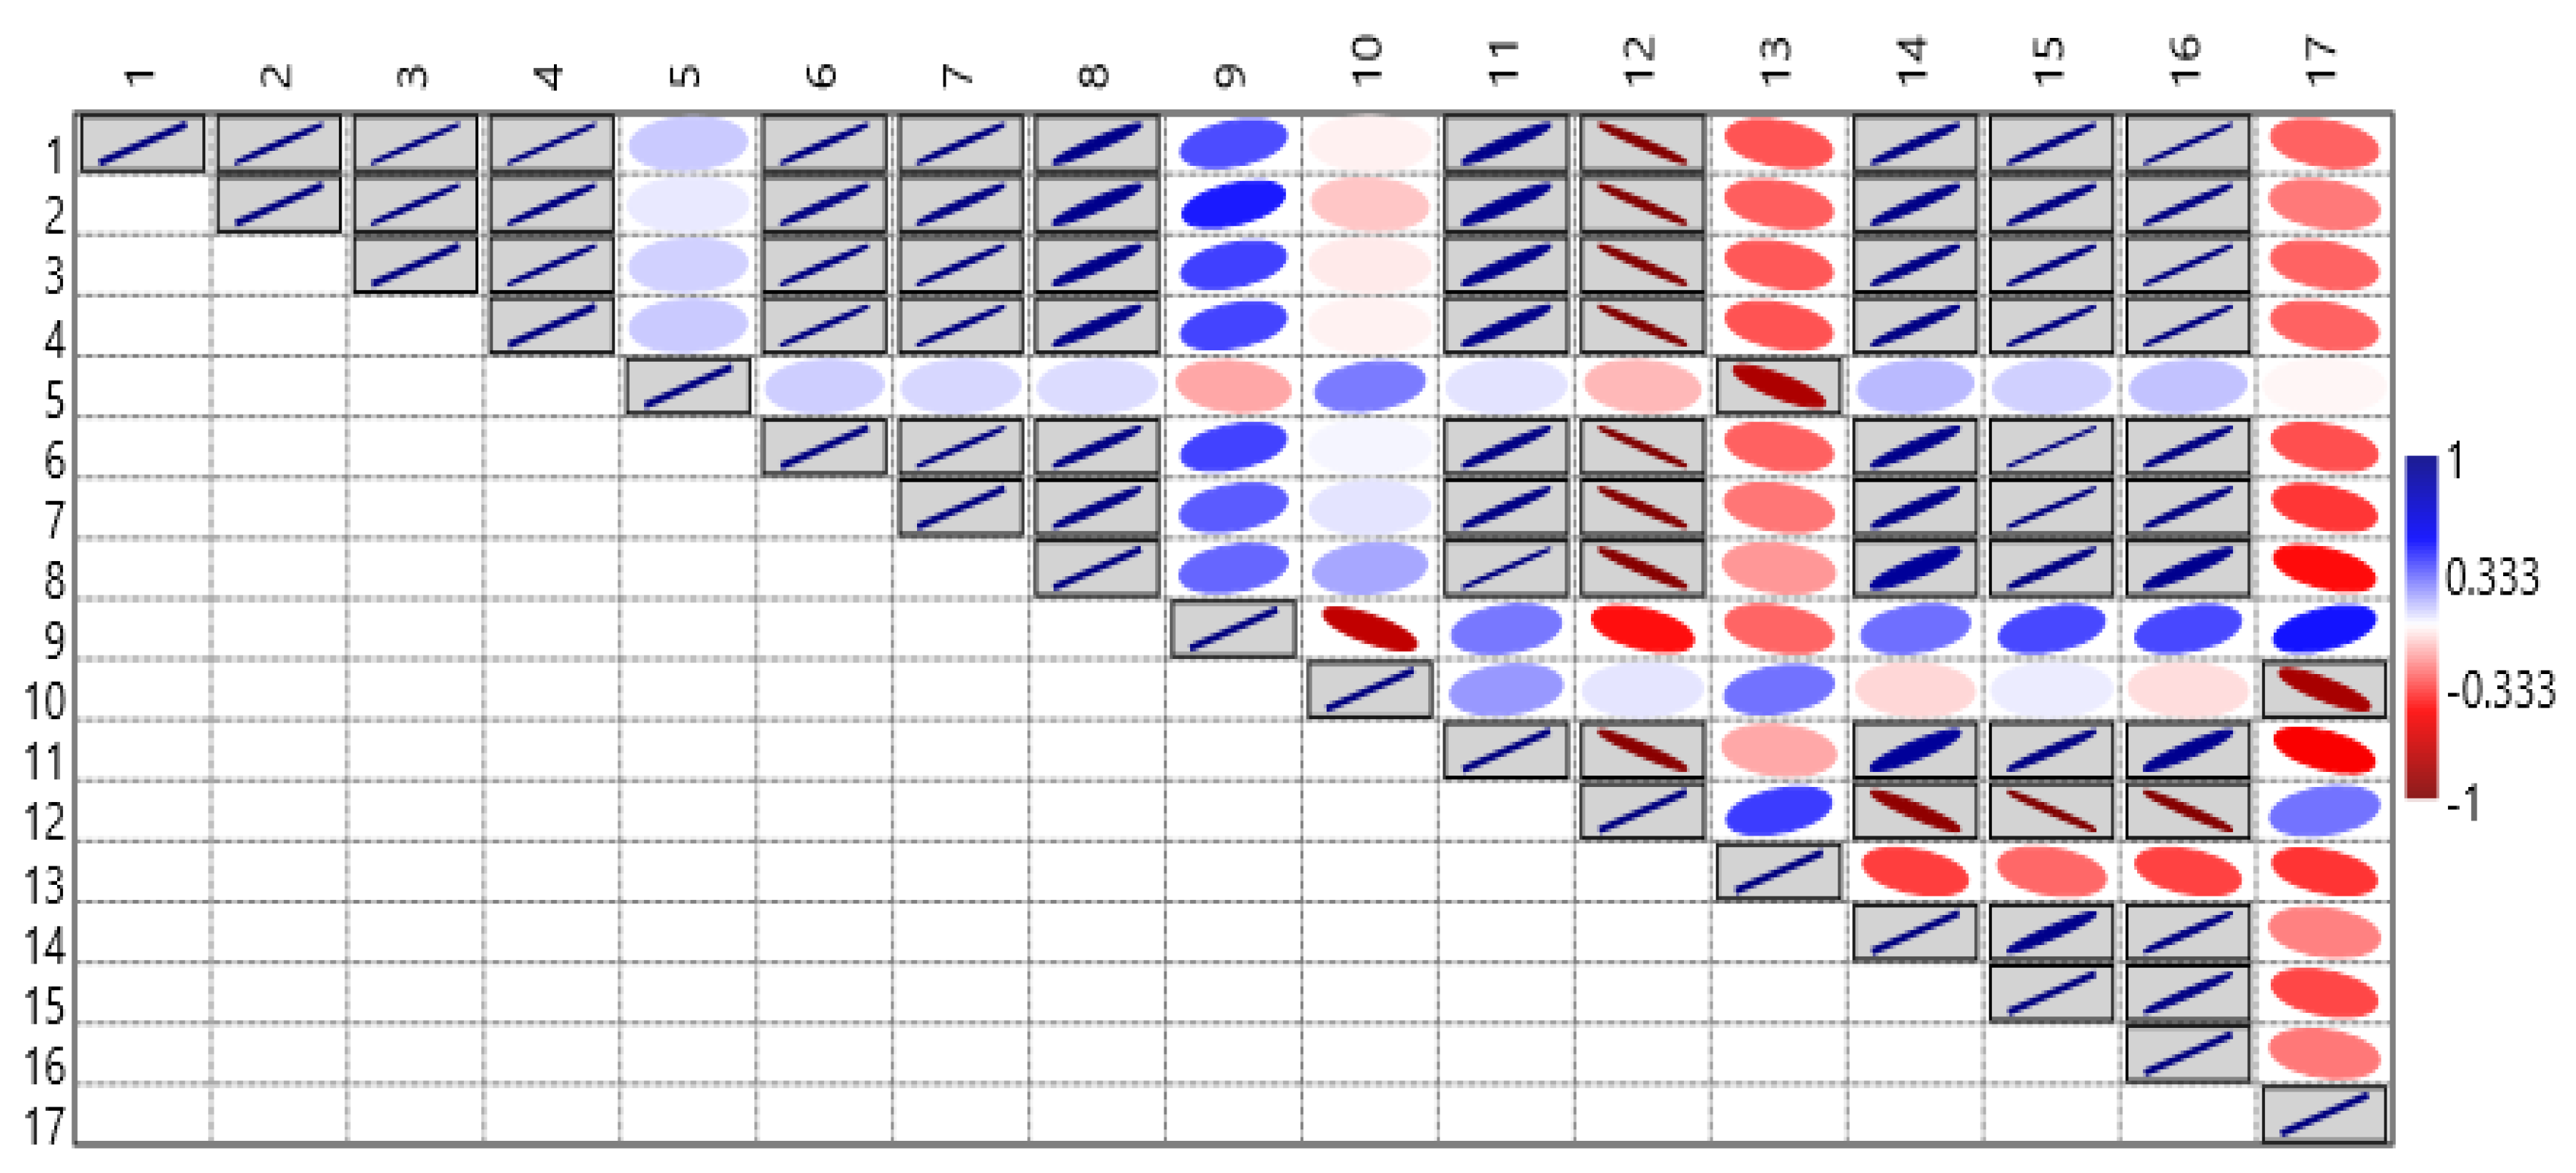
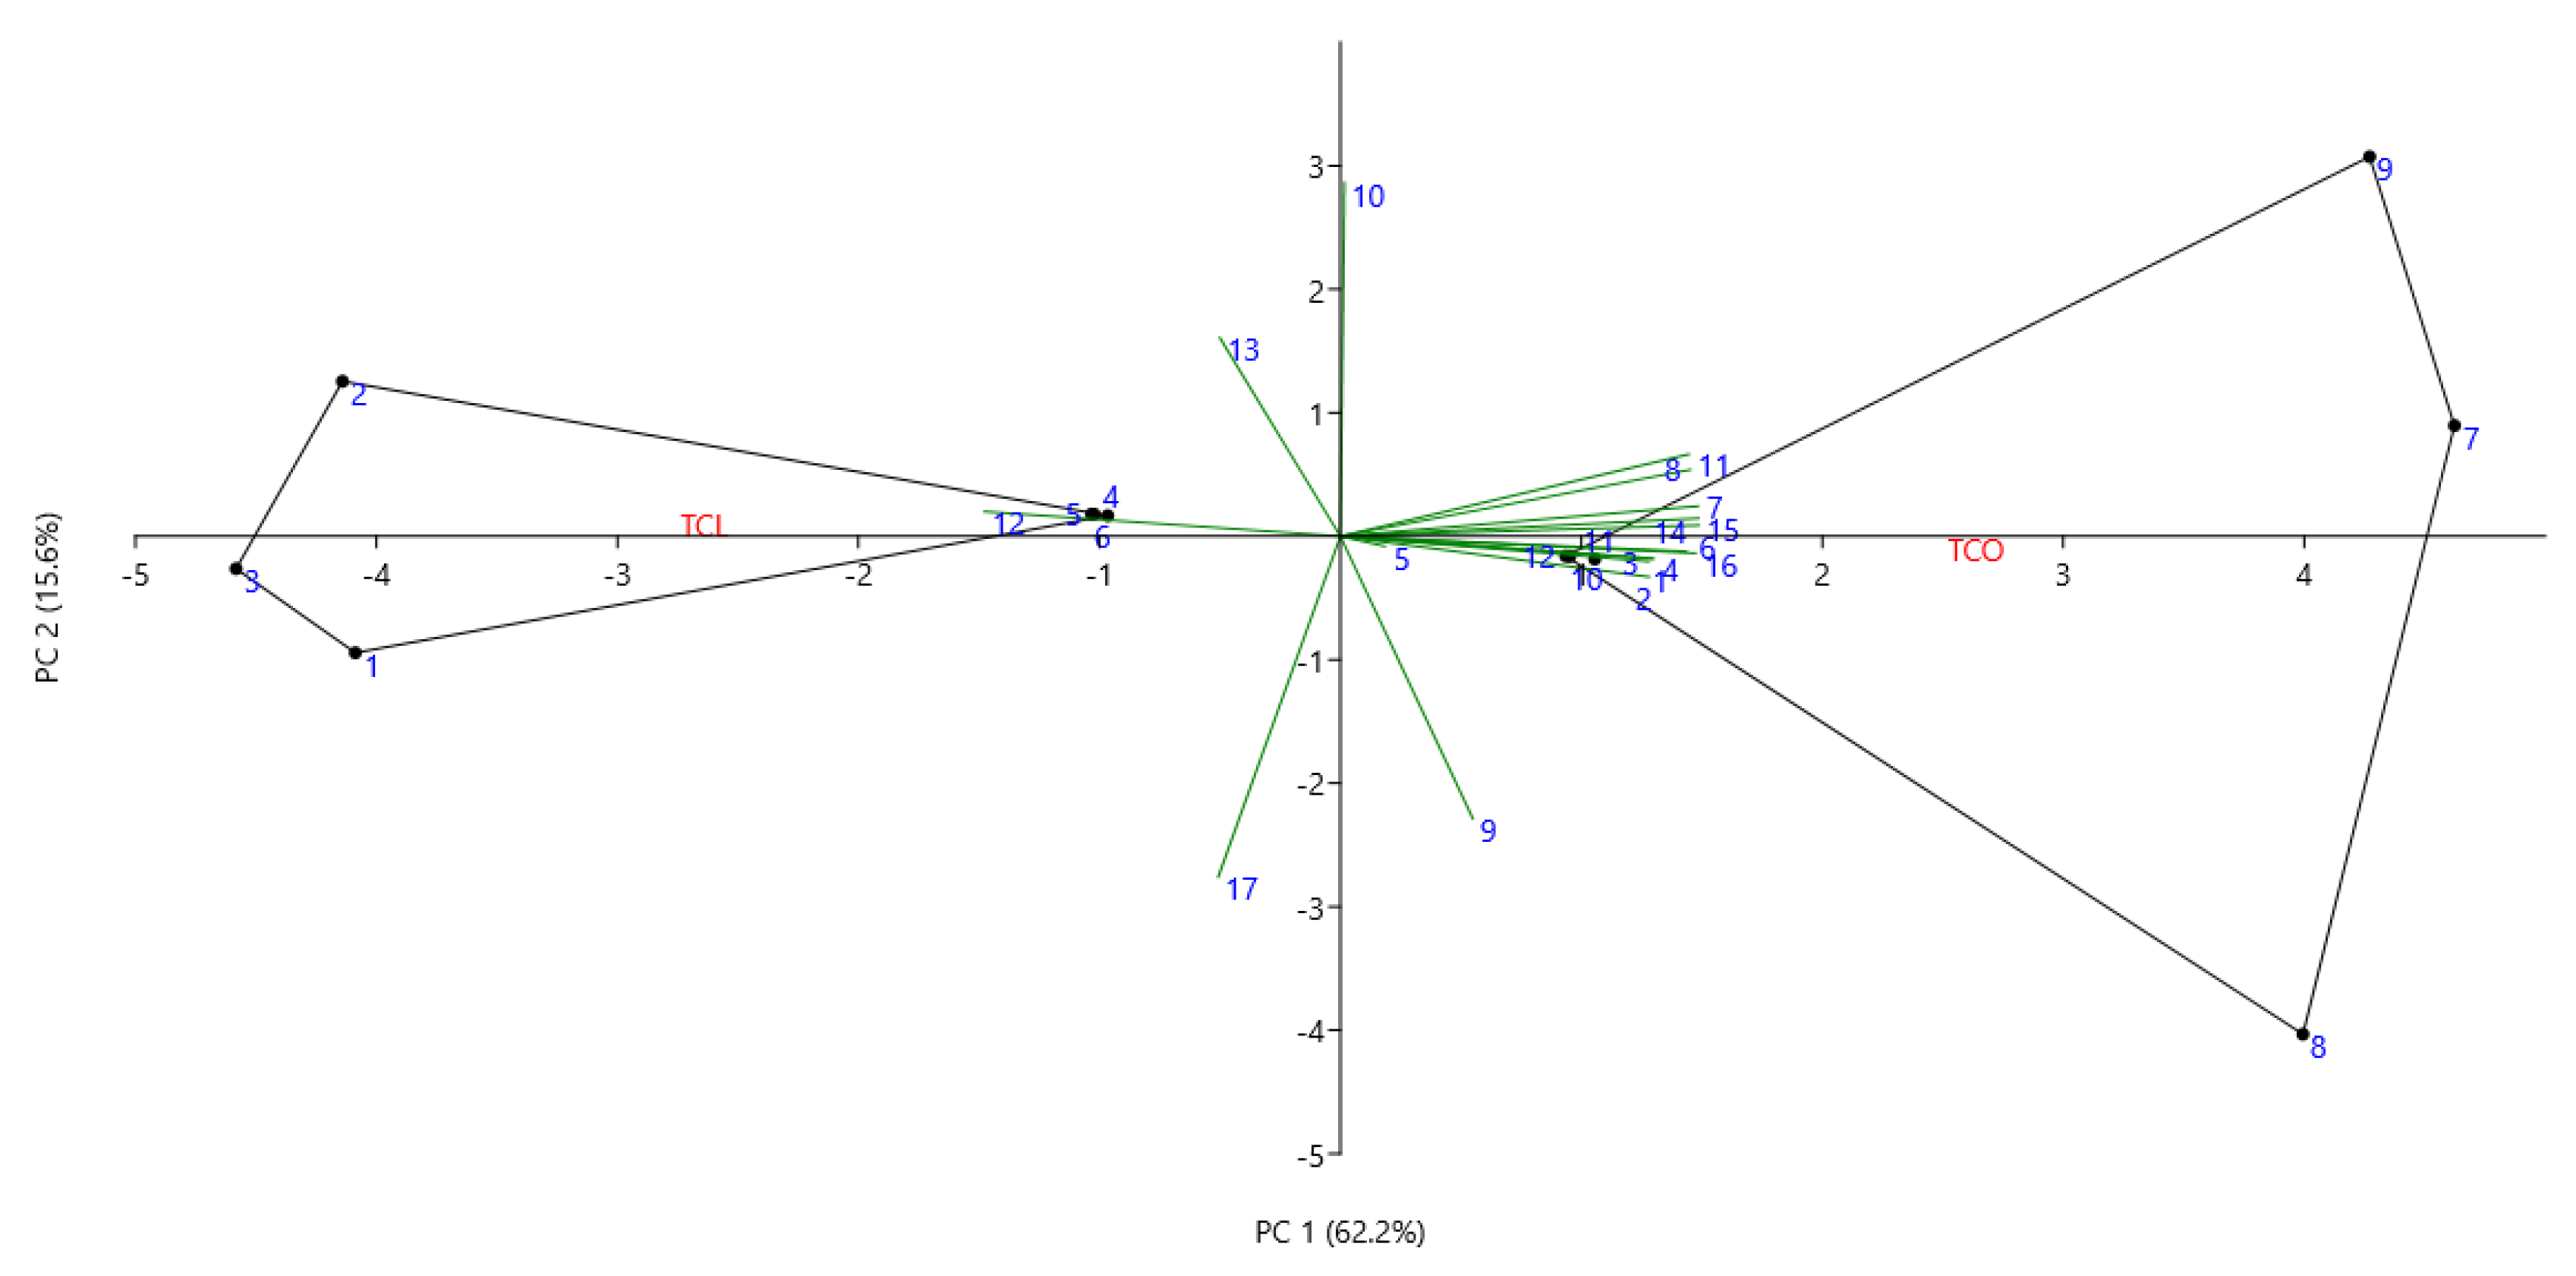
2.5. Statistical Analysis

All data were subjected to the statistical analysis for the normality and homoscedasticity through Saphiro-Wilk’s test (p > 0.05) and Levene’s test (p < 0.05), respectively. Mean comparisons were computed using the SPSS 25 software (version 25.0; SPSS Inc., Chicago, IL, USA). Correlations among the bioactive compounds of the two teas were calculated by Pearson’s correlation coefficient test by means of PAST 4.03 software. Principal coordinate analysis (PCA)—Biplot was performed using the same software. Eigenvalues were calculated using a covariance matrix among 30 traits as input, and the two-dimensional PCA biplot was constructed.

3. Results

The total polyphenol content and the antioxidant activity (FRAP, DPPH, and ABTS assays) of both examined teas are reported in Table 2.
The total phenolic content varied from 8540.42 to 14918.91 mg GAE 100 g−1 being significantly higher in TCO. The antioxidant activity resulted higher for TCO rather than for TCL (42758.86 and 25796.61 mmol Fe2+ kg−1 for the FRAP assay, respectively; 532.37 and 302.35 µmol TE g−1 DW for the DPPH assay, respectively; 881.08 and 623.44 µmol TE g−1 DW for the ABTS assay, respectively).
In the TCO infusion, 13 compounds out of 13 were found by means of HPLC analysis, namely caffeic acid, chlorogenic acid, coumaric acid, ferulic acid, hyperoside, isoquercitrin, quercetin, quercitrin, rutin, ellagic acid, gallic acid, catechin, and epicatechin, while in TCL infusion, only 9 compounds out of 13 were found (chlorogenic acid, coumaric acid, ferulic acid, and quercetin were not detected) (Figure 2, Table 3).
The two teas showed significant different contents in quercitrin (242.38 mg 100 g−1 DW in TCL and 113.11 mg 100 g−1 DW in TCO). TCO and TCL showed significant different contents in cinnamic acids, with TCO being richer in these compounds than TCL. Benzoic acids and catechins were significantly higher in TCO than in TCL (except for epicatechin, which showed no significant differences in the two infusions).
The phenolic content in both teas proved to be significantly correlated to their antioxidant activity (Figure 3), for the three methods used (FRAP, DPPH, ABTS). The phenolic content was also positively correlated (p < 0.05) to chlorogenic acid, coumaric acid, ferulic acid, quercetin, ellagic acid, gallic acid, and catechin content. Interestingly, chlorogenic acid was found to be negatively correlated (p < 0.05) to the quercitrin content, and this latter was negatively correlated to gallic acid too.
The relationship between the studied parameters were evaluated through a PCA and represented in a two-dimensional PCA scatterplot (based on the first two principal components (PCs)) (Figure 4). As depicted, the first two PCs explained 77.8% of total variation. The first PC accounted for 62.2% and was positively correlated with polyphenols, antioxidant activity (FRAP, DPPH, and ABTS), caffeic acid, chlorogenic acid, coumaric acid, ferulic acid, hyperoside, isoquercitrin, quercetin, ellagic acid, gallic acid, and catechin; conversely, it was negatively correlated with quercitrin, rutin, and epicatechin. The second PC accounted for 15.6% and was positively correlated with chlorogenic acid, coumaric acid, ferulic acid, isoquercitrin, quercetin, quercitrin, rutin, gallic acid; conversely, it was negatively correlated with polyphenols, antioxidant activity (FRAP, DPPH, and ABTS), caffeic acid, hyperoside, ellagic acid, catechin, and epicatechin. The scatterplot showed that the two teas are clearly distinguished, confirming that TCO is mainly linked to almost all the detected bioactive compounds. In the opposite, TCL was correlated only to quercitrin, rutin, and epicatechin.

4. Discussion

The Italian tea “Camelia d’Oro” (TCO) showed a total phenolic content (14918.91 mg GAE 100 g−1 DW) higher than the other green teas analyzed in similar studies. Cai et al. [37] purchased the green tea sample in a Chinese trade market, finding a total phenolic content of 13,600 mg GAE 100 g−1 DW. Mildner-Szkudlarz et al. [38] obtained Yunan green tea leaves in a special tea store, then ground leaves were extracted for 24 h using a 95% ethanol solution; the analysis showed a total phenolic content of 13,654 mg GAE 100 g−1 DW. TCO even showed a higher phenolic content than the white tea analyzed by Zielinski et al. [39], which obtained a wide range: 3800–11,400 mg GAE 100 g−1 DW. Conversely, the “Compagnia del Lago” tea (TCL) showed a total phenolic content of 8540.42 ± 105.38 mg GAE 100 g−1 DW, lower than the previous studies’ results. These data therefore might indicate that the cultivation and processing methods adopted by “La Camelia d’Oro” plantation promoted the accumulation of phenolic substances. However, Pérez-Burillo et al. [8] found a higher polyphenols content in commercial green tea in Spain, brewed in water for 7 min at 98 °C, obtaining a value of 1043 ± 5 mg GAE L−1 (TCO = 745.95 mg GAE L−1).
The antioxidant activity of the two teas, assessed with the DPPH, ABTS, and FRAP methods, confirmed the phenolic trend, being higher in TCO than in TCL. Regarding to the DPPH assay, TCO and TCL showed values of 532.37 µmol TE g−1 DW and 302.35 µmol TE g−1 DW respectively, with an average inhibition percentage of 46.9% and 61.2% respectively. These results are higher than those published by Sirichaiwetchakoon et al. [3], who found an inhibition percentage of 41.46% for commercial green tea, purchased in a supermarket in the United Kingdom and prepared by boiling ground tea leaves in 80 °C 1x phosphate buffered saline (PBS) for 5 min. Conversely, Lv et al. [40] found a higher inhibition percentage in three black teas, ranging from 82.3% to 87.6%. This is unusual, as many researchers suggest that green tea has more antioxidant activity than black tea [38], as green tea has no fermentation processing [41]. However, the same authors [40] found a lower inhibition percentage through the ABTS assay, ranging from 12.08 to 18.08%, according to the black tea type. Conversely, in this study the ABTS assay confirmed the DPPH high values for both tea samples, ranging from 94.3% in TCL to 99.8% in TCO, thus confirming the highest antioxidant activity of green tea.
A few works also evaluated the antioxidant activity by means of FRAP test, however, using different units of measurement, making it complex to compare the different values [8,9].
The “Camelia d’Oro” tea (TCO) resulted to contain all the 13 bioactive compounds investigated, while the “Compagnia del Lago” tea (TCL) showed only 9. The major components identified in both Italian teas were quercetin, catechin, and epicatechin; in TCO also chlorogenic acid and gallic acid. Although not giving the single related values, Cai et al. [37] also found that catechin, epicatechin, and quercetin were the major types of phenolic compounds found in tea leaves.
The “Camelia d’Oro” tea (TCO) showed catechins (478.98 mg 100 g−1 DW) and epicatechins (735.84 mg 100 g−1 DW) values (Table 3) similar or higher than other green teas. Li et al. [9] found in the green Longjing tea values of 0.36 mg 100 mg−1 DW for catechins and 0.90 mg 100 mg−1 DW for epicatechins. Hyun et al. [25] found lower catechin values (ranging from 3.14 to 4.76 mg g−1 FW), but higher epicatechin values (ranging from 8.12 to 10.40 mg g−1 FW) than TCO. Conversely, the “Compagnia del Lago” tea (TCL) showed catechins (122.06 mg 100 g−1 DW) and epicatechins (770.39 mg 100 g−1 DW) values lower than the previous studies results.
It is noteworthy that the catechin content is highly correlated to the antioxidant activity measured with the three assays (FRAP, DPPH, and ABTS) (Table 3), as already found by Pérez-Burillo et al. [8], when comparing white and green teas. Catechins are known to have important human health benefits, due to their antioxidative, anti-inflammatory, anticarcinogenic, antidiabetic, and antimicrobial properties [34,41], and they may also help reduce the body mass index [42]. Quercetin shows antihypertensive effects, improving endothelial function, gene expression, and modulating cell signals [43], while coumaric acid has protective effects against carcinogenesis, atherosclerosis, oxidative cardiac damages and has anti-inflammatory effects [44].
Gallic acid of TCO (803.88 mg 100 g−1 DW) was higher than the Longjing tea values (0.07 mg 100 mg−1 DW) [9], conversely TCL (42.39 mg 100 g−1 DW) values were lower.
Although not showing the single related values, Gorjanović et al. [45] showed the presence of ferulic and caffeic acids in green tea infusions, as they were detected in this study (Table 3).
Flavonols (hyperoside, isoquercitrin, quercitrin, rutin), chlorogenic acid, and ellagic acid were not frequently reported individually in other studies, but more as a single category of flavonols, cinnamic acids, and benzoic acids; they were almost all found in both the Italian teas.
Flavonols are health-promoted compounds [42] which can be largely found in green tea leaves [46], and chlorogenic acid has antioxidant, anti-inflammatory, anticancer, antilipidemic, antidiabetic, antihypertensive, and antineurodegenerative activities [47], thus these teas are a rich source of bioactive compounds.
As already observed by Li et al., Lv et al., and Tenore et al. [9,21,40], antioxidant activity was positively correlated with polyphenol content and, thus, with catechins content. The methods for the antioxidant activity analysis were also positively correlated with each other, as Zielinski et al. [39] observed.

5. Conclusions

This work investigated the content in bioactive compounds of two Italian teas, both cultivated in the Lake Maggiore District, in Piedmont. The results indicated that the two teas have different phenolic compositions, probably due to the different cultivation substrates or techniques.
The “Camelia d’Oro” tea (TCO) showed in general, higher bioactive compounds levels than the “Compagnia del Lago” tea (TCL).
However, both teas showed values in accordance with other studies’ results, or even higher, confirming that they would be suitable to diversify the Italian growers’ production with the C. sinensis cultivation.

Author Contributions

Conceptualization, V.S.; methodology, M.C.; investigation, N.M.F., S.D., M.C.; data curation, N.M.F., M.C.; writing—original draft preparation, N.M.F.; writing—review and editing, M.C., S.D., V.S.; supervision, V.S.; project administration, V.S.; funding acquisition, V.S. All authors have read and agreed to the published version of the manuscript.

Funding

This research received no external funding.

Institutional Review Board Statement

Not applicable.

Informed Consent Statement

Not applicable.

Data Availability Statement

Not applicable.

Acknowledgments

Authors acknowledge Dario Donno for HPLC analysis, and the two nurseries, “La Camellia d’Oro” and “La Compagnia del Lago” for providing the two tea leaves.

Conflicts of Interest

The authors declare no conflict of interest.

References

  1. Komes, D.; Horžić, D.; Belščak, A.; Ganić, K.K.; Vulić, I. Green tea preparation and its influence on the content of bioactive compounds. Food Res. Int. 2010, 43, 167–176. [Google Scholar] [CrossRef]
  2. Ori, F.; Ma, J.; Gori, M.; Lenzi, A.; Chen, L.; Giordani, E. DNA-based diversity of tea plants grown in Italy. Genet. Resour. Crop Evol. 2017, 64, 1905–1915. [Google Scholar] [CrossRef]
  3. Sirichaiwetchakoon, K.; Lowe, G.M.; Eumkeb, G. The Free Radical Scavenging and Anti-Isolated Human LDL Oxidation Activities of Pluchea indica (L.) Less. Tea Compared to Green Tea (Camellia sinensis). Biomed. Res. Int. 2020, 2020, 1–12. [Google Scholar] [CrossRef]
  4. Koo, S.I.; Noh, S.K. Green tea as inhibitor of the intestinal absorption of lipids: Potential mechanism for its lipid-lowering effect. J. Nutr. Biochem. 2007, 18, 179–183. [Google Scholar] [CrossRef] [PubMed] [Green Version]
  5. Xing, L.; Zhang, H.; Qi, R.; Tsao, R.; Mine, Y. Recent Advances in the Understanding of the Health Benefits and Molecular Mechanisms Associated with Green Tea Polyphenols. J. Agric. Food Chem. 2019, 67, 1029–1043. [Google Scholar] [CrossRef] [PubMed]
  6. Sharangi, A.B. Medicinal and therapeutic potentialities of tea (Camellia sinensis L.)—A review. Food Res. Int. 2009, 42, 529–535. [Google Scholar] [CrossRef]
  7. Jiang, X.; Liu, Y.; Li, W.; Zhao, L.; Meng, F.; Wang, Y.; Tan, H.; Yang, H.; Wei, C.; Wan, X.; et al. Tissue-Specific, Development-Dependent Phenolic Compounds Accumulation Profile and Gene Expression Pattern in Tea Plant [Camellia sinensis]. PLoS ONE 2013, 8, e62315. [Google Scholar] [CrossRef] [PubMed]
  8. Pérez-burillo, S.; Giménez, R.; Ru, J.A.; Pastoriza, S. Effect of brewing time and temperature on antioxidant capacity and phenols of white tea: Relationship with sensory properties. Food Chem. 2018, 248, 111–118. [Google Scholar] [CrossRef]
  9. Li, K.; Shi, X.; Yang, X.; Wang, Y.; Ye, C.; Yang, Z. Antioxidative activities and the chemical constituents of two Chinese teas, Camellia kucha and C. ptilophylla. Int. J. Food Sci. Technol. 2012, 47, 1063–1071. [Google Scholar] [CrossRef]
  10. Food and Agriculture Organization of the United Nations. Current Market Situation and Medium Term Outlook. In Proceedings of the Twenty-Third Session of the Intergovernmental Group on Tea, Hangzhou, China, 17–20 May 2018; pp. 13–16. [Google Scholar]
  11. FAO. Emerging Trends in Tea Consumption: Informing a Generic Promotion Process. In Proceedings of the Twenty-Third Session of the Intergovernmental Group on Tea, Hangzhou, China, 17–20 May 2018; pp. 1–9. [Google Scholar]
  12. Food and Agriculture Organization of the United Nations. Developing futures and swap markets for tea. In Proceedings of the Twenty-Third Session of the Intergovernmental Group on Tea, Hangzhou, China, 17–20 May 2018; pp. 1–6. [Google Scholar]
  13. Bhardwaj, P.; Kumar, R.; Sharma, H.; Tewari, R.; Ahuja, P.S.; Sharma, R.K. Development and utilization of genomic and genic microsatellite markers in Assam tea (Camellia assamica ssp. assamica) and related Camellia species. Plant Breed. 2013, 132, 748–763. [Google Scholar] [CrossRef]
  14. Khan, N.; Mukhtar, H. Tea polyphenols for health promotion. Life Sci. 2007, 81, 519–533. [Google Scholar] [CrossRef] [PubMed] [Green Version]
  15. Zheng, Q.; Li, W.; Zhang, H.; Gao, X.; Tan, S. Optimizing synchronous extraction and antioxidant activity evaluation of polyphenols and polysaccharides from Ya’an Tibetan tea (Camellia sinensis). Food Sci. Nutr. 2019, 8, 489–499. [Google Scholar] [CrossRef] [PubMed] [Green Version]
  16. Heber, D.; Zhang, Y.; Yang, J.; Ma, J.E.; Henning, S.M.; Li, Z. Green tea, black tea, and oolong tea polyphenols reduce visceral fat and inflammation in mice fed high-fat, high-sucrose obesogenic diets. J. Nutr. 2014, 144, 1385–1393. [Google Scholar] [CrossRef] [Green Version]
  17. Senanayake, S.P.J.N. Green tea extract: Chemistry, antioxidant properties and food applications—A review. J. Funct. Foods 2013, 5, 1529–1541. [Google Scholar] [CrossRef]
  18. Karori, S.M.; Wachira, F.N.; Wanyoko, J.K.; Ngure, R.M. Antioxidant capacity of different types of tea products. African J. Biotechnol. 2007, 6, 2287–2296. [Google Scholar] [CrossRef] [Green Version]
  19. Afzal, M.; Safer, A.M.; Menon, M. Green tea polyphenols and their potential role in health and disease. Inflammopharmacology 2015, 23, 151–161. [Google Scholar] [CrossRef]
  20. Hayakawa, S.; Ohishi, T.; Miyoshi, N.; Oishi, Y.; Nakamura, Y.; Isemura, M. Anti-Cancer Effects of Green Tea Epigallocatchin-3-Gallate and Coffee Chlorogenic Acid. Molecules 2020, 25, 4553. [Google Scholar] [CrossRef]
  21. Tenore, G.C.; Daglia, M.; Ciampaglia, R.; Novellino, E. Exploring the Nutraceutical Potential of Polyphenols from Black, Green and Exploring the Nutraceutical Potential of Polyphenols from Black, Green and White Tea Infusions—An Overview. Curr. Pharm. Biotechnol. 2015, 16, 265–271. [Google Scholar] [CrossRef] [PubMed] [Green Version]
  22. Huo, C.; Dou, Q.P.; Chan, T.H. Synthesis of phosphates and phosphates-acetates hybrids of green tea polyphenol (-)-epigallocatechine-3-gallate (EGCG) and its G ring deoxy analogs as potential anticancer prodrugs. Tetrahedron Lett. 2011, 52, 5478–5483. [Google Scholar] [CrossRef]
  23. Kellogg, J.J.; Graf, T.N.; Paine, M.F.; McCune, J.S.; Kvalheim, O.M.; Oberlies, N.H.; Cech, N.B. Comparison of Metabolomics Approaches for Evaluating the Variability of Complex Botanical Preparations: Green Tea (Camellia sinensis) as a Case Study. J. Nat. Prod. 2017, 80, 1457–1466. [Google Scholar] [CrossRef] [Green Version]
  24. Bramel, P.J.; Chen, L. A Global Strategy for the Conservation and Use of Tea Genetic Resources; Crop Trust: Bonn, Germany, 2019. [Google Scholar]
  25. Hyun, D.Y.; Gi, G.Y.; Sebastin, R.; Cho, G.T.; Kim, S.H.; Yoo, E.; Lee, S.; Son, D.M.; Lee, K.J. Utilization of phytochemical and molecular diversity to develop a target-oriented core collection in tea germplasm. Agronomy 2020, 10, 1667. [Google Scholar] [CrossRef]
  26. Camangi, F.; Stefani, A.; Bracci, T.; Minnocci, A.; Sebastiani, L.; Lippi, A.; Cattolica, G.; Santoro, A.M. Antiche Camelie Della Lucchesia; Sant’Anna, S.S., Ed.; ETS: Pisa, Italy, 2012; ISBN 978884673128-9. [Google Scholar]
  27. Caser, M.; Berruti, A.; National, I.; Bianciotto, V.; National, I.; Devecchi, M. Floriculture and territory—The protection of the traditional Italian tipicity: The case of “La Camelia del Lago Maggiore (PGI)”. Acta Hortic. 2018. [Google Scholar] [CrossRef]
  28. Corneo, A.; Remotti, D. Camelie Dell’ottocento Nel Verbano; Regione Piemonte: Torino, Italy, 2000. [Google Scholar]
  29. Freda, R.; Borrello, M.; Cembalo, L. Innovation in Floriculture When Environmental and Economics criteria are conflicting. Calitatea 2015, 16, 110–118. [Google Scholar]
  30. Singleton, V.L.; Orthofer, R.; Lamuela-Raventós, R.M. Analysis of total phenols and other oxidation substrates and antioxidants by means of Folin- Ciocalteu reagent. Methods Enzymol. 1999, 299, 152–178. [Google Scholar]
  31. Benzie, I.F.F.; Strain, J.J. The ferric reducing ability of plasma (FRAP) as a measure of “antioxidant power”: The FRAP assay. Anal. Biochem. 1996, 239, 70–76. [Google Scholar] [CrossRef] [Green Version]
  32. Wong, S.P.; Leong, L.P.; William Koh, J.H. Antioxidant activities of aqueous extracts of selected plants. Food Chem. 2006, 99, 775–783. [Google Scholar] [CrossRef]
  33. Urbani, E.; Blasi, F.; Stella, M.; Claudia, S.; Cossignani, L. Investigation on secondary metabolite content and antioxidant activity of commercial saffron powder. Eur. Food Res. Technol. 2016, 242, 987–993. [Google Scholar] [CrossRef]
  34. Caser, M.; Demasi, S.; Stelluti, S.; Donno, D.; Scariot, V.; Crocus sativus, L. Cultivation in Alpine Environments: Stigmas and Tepals as Source of Bioactive Compounds. Agronomy 2020, 10, 1473. [Google Scholar] [CrossRef]
  35. Caser, M.; Demasi, S.; Victorino, M.M.I.; Donno, D.; Faccio, A.; Lumini, E.; Bianciotto, V.; Scariot, V. Arbuscular Mycorrhizal Fungi Modulate the Crop Performance and Metabolic Profile of Saffron in Soilless Cultivation. Agronomy 2019, 9, 232. [Google Scholar] [CrossRef] [Green Version]
  36. Donno, D.; Mellano, M.G.; Riondato, I.; De Biaggi, M.; Andriamaniraka, H.; Gamba, G.; Beccaro, G.L. Traditional and Unconventional Dried Fruit Snacks as a Source of Health-Promoting Compounds. Antioxidants 2019, 8, 396. [Google Scholar] [CrossRef] [PubMed] [Green Version]
  37. Cai, Y.; Luo, Q.; Sun, M.; Corke, H. Antioxidant activity and phenolic compounds of 112 traditional Chinese medicinal plants associated with anticancer. Life Sci. 2004, 74, 2157–2184. [Google Scholar] [CrossRef] [PubMed]
  38. Mildner-Szkudlarz, S.; Zawirska-Wojtasiak, R.; Obuchowskij, W.; Goslinski, M. Evaluation of Antioxidant Activity of Green Tea Extract and Its Effect on the Biscuits Lipid Fraction Oxidative Stability. Sens. Food Qual. 2009, 74, 362–370. [Google Scholar] [CrossRef]
  39. Zielinski, A.A.F.; Haminiuk, C.W.I.; Beta, T. Multi-response optimization of phenolic antioxidants from white tea (Camellia sinensis L. Kuntze) and their identification by LC-DAD-Q-TOF-MS/MS. LWT Food Sci. Technol. 2016, 65, 897–907. [Google Scholar] [CrossRef] [Green Version]
  40. Lv, H.; Zhang, Y.; Shi, J.; Lin, Z. Phytochemical profiles and antioxidant activities of Chinese dark teas obtained by different processing technologies. Food Res. Int. 2017, 100, 486–493. [Google Scholar] [CrossRef]
  41. Ananingsih, V.K.; Sharma, A.; Zhou, W. Green tea catechins during food processing and storage: A review on stability and detection. FRIN 2013, 50, 469–479. [Google Scholar] [CrossRef]
  42. Demasi, S.; Caser, M.; Donno, D.; Enri, S.R.; Lonati, M.; Scariot, V. Exploring wild edible flowers as a source of bioactive compounds: New perspectives in horticulture. Folia Hortic. 2021, 33, 1–22. [Google Scholar] [CrossRef]
  43. Xue, Z.; Wang, J.; Chen, Z.; Ma, Q.; Guo, Q.; Gao, X.; Chen, H. Antioxidant, antihypertensive, and anticancer activities of the flavonoid fractions from green, oolong, and black tea infusion waste. J. Food Biochem. 2018, 42. [Google Scholar] [CrossRef]
  44. Cui, P.; Zhong, W.; Qin, Y.; Tao, F.; Wang, W.; Zhan, J. Characterization of two new aromatic amino acid lyases from actinomycetes for highly efficient production of p—Coumaric acid. Bioprocess Biosyst. Eng. 2020, 43, 1287–1298. [Google Scholar] [CrossRef]
  45. Gorjanović, S.; Komes, D.; Pastor, F.T.; Belşçak-Cvitanović, A.; Pezo, L.; Heçimović, I.; Suz̧njević, D. Antioxidant capacity of teas and herbal infusions: Polarographic assessment. J. Agric. Food Chem. 2012, 60, 9573–9580. [Google Scholar] [CrossRef] [PubMed]
  46. Lee, M.K.; Kim, H.-W.; Lee, S.-H.; Kim, Y.J.; Asamenew, G.; Choi, J.; Lee, J.-W.; Jung, H.-A.; Yoo, S.M.; Kim, J.-B. Characterization of catechins, theaflavins, and flavonols by leaf processing step in green and black teas (Camellia sinensis) using UPLC-DAD-QToF/MS. Eur. Food Res. Technol. 2019, 245, 997–1010. [Google Scholar] [CrossRef] [Green Version]
  47. Santana-Gálvez, J.; Cisneros-Zevallos, L.; Jacobo-Velázquez, D.A. Chlorogenic Acid: Recent advances on its dual role as a food additive and a nutraceutical against metabolic syndrome. Molecules 2017, 22, 358. [Google Scholar] [CrossRef] [PubMed] [Green Version]
Figure 1. Monthly average temperatures (maximum and minimum— °C), and monthly average rainfall (mm) for the investigation year 2017 in: (A). the “Compagnia del Lago” site of cultivation. (B). the “Camelia d’Oro” site of cultivation.
Horticulturae 07 00091 g001
Figure 2. Chromatographic profile of benzoic acids and catechins (A), and cinnamic acids and flavonols (C) in TCO. Chromatographic profile of benzoic acids and catechins (B) and cinnamic acids and flavonols (D) in TCL. TCO = Tea Camellia d’Oro. TCL = Tea Compagnia del Lago.
Horticulturae 07 00091 g002
Figure 3. Pearson correlation among the bioactive compounds of Tea “Compagnia del Lago” (TCL) and Tea “Camelia d’Oro” (TCO). Boxed ellipses are significantly correlated (p < 0.05). Blue indicates positive correlation and red indicates negative correlation. The more the ellipse is compressed, the stronger the correlation. 1. Polyphenols; 2. FRAP; 3. DPPH; 4. ABTS; 5. caffeic acid; 6. chlorogenic acid; 7. coumaric acid; 8. ferulic acid; 9. hyperoside; 10. isoquercitrin; 11. quercetin; 12. quercitrin; 13. rutin; 14. ellagic acid; 15. gallic acid; 16. catechin; 17. epicatechin.
Horticulturae 07 00091 g003
Figure 4. Principal component analysis (PCA)-biplot of Tea Compagnia del Lago (TCL) and Tea Camelia d’Oro (TCO), by means of the PAST 4.03 software. 1. Polyphenols; 2. FRAP; 3. DPPH; 4. ABTS; 5. caffeic acid; 6. chlorogenic acid; 7. coumaric acid; 8. ferulic acid; 9. hyperoside; 10. isoquercitrin; 11. quercetin; 12. quercitrin; 13. rutin; 14. ellagic acid; 15. gallic acid; 16. catechin; 17. epicatechin.
Horticulturae 07 00091 g004
Table 1. HPLC methods and relative chromatographic conditions.
MethodClasses of InterestStationary PhaseMobile PhaseWavelength (nm)
ACinnamic acids
Flavonols
KINETEX-C18 column
(4.6 × 150 mm, 5 µm)
A: 10 mM KH2PO4/H3PO4
pH = 2.8
B: CH3CN
330
BBenzoic acids
Catechins
KINETEX-C18 column
(4.6 × 150 mm, 5 µm)
A: H2O/CH3OH/HCOOH
(5:95:0.1 v/v/v), pH = 2.5
B: CH3OH/HCOOH
(100:0.1 v/v)
280
Elution conditions. Method A, gradient analysis: 5% B to 21% B in 17 min + 21% B in 3 min (2 min conditioning time); flow: 1.5 mL min−1; Method B, gradient analysis: 3% B to 85% B in 22 min + 85% B in 1 min (2 min conditioning time); flow: 0.6 mL min−1.
Table 2. Total polyphenols, and antioxidant activity of Tea Compagnia del Lago (TCL) and Tea Camellia d’Oro (TCO). Data are presented as mean value ± standard deviation.
Tea TypeTotal Polyphenols
(mg GAE/100 g DW)
Antioxidant Activity
FRAP
(mmol Fe2+/kg)
DPPHABTS
(µmol TE/g DW)Inhibition %(µmol TE/g DW)Inhibition %
TCL8540.42 ± 105.3825796.61 ± 951.83302.35 ± 10.446.9623.44 ± 4.6494.3
TCO14918.91 ± 222.3142758.86 ± 933.85532.37 ± 5.9561.2881.08 ± 1.8199.8
p******** ***
The statistical relevance is provided (** = p < 0.01; *** = p < 0.001).
Table 3. Bioactive compounds in Tea Compagnia del Lago (TCL) and Tea Camellia d’Oro (TCO). Data are presented as mean value ± standard deviation. The values are given in mg 100 g−1 DW.
Tea typeFlavonols
HyperosideIsoquercitrinQuercetinQuercitrinRutin
TCL25.37 ± 4.3935.46 ± 2.60-242.38 ± 10.1144.66 ± 3.93
TCO28.24 ± 4.3035.31 ± 4.38388.28 ± 95.47113.11 ± 14.7542.32 ± 4.19
pnsns ***ns
Tea typeCinnamic acids
Caffeic acidChlorogenic acidCoumaric acidFerulic acid
TCL42.57 ± 6.67---
TCO43.36 ± 1.72612.25 ± 37.58204.62 ± 16.4757.85 ± 13.32
pns
Tea typeBenzoic acidsCatechins
Ellagic acidGallic acidCatechinEpicatechin
TCL59.06 ± 2.3342.39 ± 2.37122.06 ± 10.86770.39 ± 21.06
TCO86.85 ± 5.17803.88 ± 56.99478.98 ± 27.53735.84 ± 89.76
p********ns
The statistical relevance is provided (ns = non-significant; ** = p < 0.01; *** = p < 0.001). -: compound not detected.
Publisher’s Note: MDPI stays neutral with regard to jurisdictional claims in published maps and institutional affiliations.

