Article

Rootstock–Scion Hydraulic Balance Influenced Scion Vigor and Yield Efficiency of Malus domestica cv. Honeycrisp on Eight Rootstocks

Summerland Research and Development Centre, Agriculture and Agri-Food Canada, Summerland, BC V0H 1Z0, Canada
*
Author to whom correspondence should be addressed.
Submission received: 7 April 2021 / Revised: 24 April 2021 / Accepted: 26 April 2021 / Published: 3 May 2021
(This article belongs to the Special Issue Rootstocks: History, Physiology, Management and Breeding)

Abstract

:
Rootstocks with internal hydraulic limitations can effectively restrict scion growth, influence crop load, and improve yield efficiency in apple production. The characteristics of xylem vessels in rootstock and scion play essential roles in determining the hydraulic properties of the grafted tree; however, much remains unknown for commonly available rootstocks. In this study, we extracted secondary xylem using an increment borer from living Honeycrisp scion (Malus domestica cv. ‘Honeycrisp’), and two Malling rootstocks, one Budagovsky rootstock, and five Geneva rootstocks. The size and density of xylem vessels in rootstocks and scions were analyzed in relation to trunk cross-section area (TCSA), tree–water relations, and fruit dry matter of 2019, as well as with cumulative yield efficiency during 2014–2019. Honeycrisp scion exceeded most of the rootstocks in cross-section size and density of vessel elements. Scion vigor and cumulative yield were positively correlated with TCSA and total vessel cross-section area (VCSA) of the rootstock, with G.202 being the highest, and B.9 being the lowest with small xylem vessels in high density. In the rootstocks with the highest cumulative yield efficiency, the rootstock/scion ratio in VCSA was equal to or slightly higher than 1. Lower scion vessel density in G.214 was associated with lower fruit dry matter weight, more restricted water relations, and worsened leaf chlorosis. G.935 with larger rootstock vessels led to both high yield and high yield efficiency. This suggested that higher scion vessel density and larger rootstock vessel size can be advantageous characteristics for early-stage evaluation.

1. Introduction

In tree fruit horticulture, rootstocks of different vigor are selectively used to regulate scion growth and yield efficiency. Many semi-dwarfing and dwarfing rootstocks can effectively restrict scion growth and improve yield efficiency in apple production [1]. The hydraulic limitation of rootstock is commonly considered as one dwarfing mechanism. Less vigorous rootstocks are thought to have more limited water transporting capacity due to lower root mass, smaller amount of feeder roots, smaller xylem vessels, thicker root bark, and lower root hydraulic conductance [2,3,4]. By changing water availability to the scion, rootstock alters root-to-shoot hydraulic signals, which influences scion xylem development and growth. Recent studies on the genetic mechanism have identified a number of quantitative loci that are responsible for conferring the dwarfing effect, such as dw1 and dw2 [5], and dw3 [3]. At least one of these loci is found in most semi-dwarfing and dwarfing rootstocks. Rootstocks that possess more than one locus tend to render more stunted growth. More evidences are suggesting that the expression of these genetic traits of rootstocks may alter scion development and fruit production by interfering with the systemic communication via chemicals such as endogenous growth regulators, nutrients, RNAs, and proteins [6,7,8], in addition to hydraulic signals.
In a number of apple cultivars, different rootstocks resulted in variations in scion stomatal characteristics and xylem conductivity. These scion hydraulic properties were associated with different scion vigor, with higher hydraulic conductivity concurring with higher scion vigor [4,5,8,9,10,11]. In angiosperm plants, stem hydraulic conductivity is related to three key features of water-transporting vessel elements in secondary xylem, i.e., length, diameter, and cell wall thickness, which are confluently determined by genetic traits, stem size, and environmental conditions such as water availability, nutrient status, and light [12]. It is commonly thought that in tree species, lower water availability often leads to smaller vessels, and xylem with smaller vessels and higher vessel density is more resilient to embolism. The same hydraulic principle would apply to fruit trees. For example, Bauerle et al. [13] reported that the increased vessel density and decreased xylem ring width in high-vigor apple scion under water deficit led to more tolerance to such stress. However, it remains debatable whether there exists a significant correlation between scion xylem vessel characteristics, and water availability variation that is rendered by rootstocks with different water transport capacity in grafted fruit trees [14,15].
Suitable rootstocks can substantially alter tree vigor, improve yield efficiency, reduce biennial bearing, as well as alleviate leaf chlorosis, fruit oversizing, and physiological disorders for horticulturally challenging scions such as Malus domestica cv. ‘Honeycrisp’ (Honeycrisp) [4]. The identification of a suitable rootstock typically takes years of evaluation. Understanding the hydraulic mechanism by which the rootstocks of different vigor determine scion growth and yield efficiency can facilitate early assessment and accelerate the evaluation of rootstock performance. In this study, total vessel cross-section area (VCSA) of the secondary xylem was estimated and assessed as an important hydraulic indicator to represent water transport capacity of rootstock and scion, and the balance between rootstock VCSA and scion VCSA was evaluated as a critical factor in determining rootstock–scion hydraulic balance and in predicting cumulative yield efficiency.
Xylem cross-sections were visualized following a less destructive sampling and stain-free protocol to estimate VCSA in conjunction with trunk cross-section area (TCSA) of both scion and rootstock of the Honeycrisp on eight rootstocks in a 10-year-old NC-140 rootstock trial (nc140.org), including semi-dwarfing Geneva 202 Nursery (G.202) and Geneva 3001 (G.3001), large dwarfing Malling 26EMLA (M.26), Geneva 214 (G.214), Geneva 41 Nursery (G.41), and Geneva 935 Nursery (G.935), moderate dwarfing Malling 9 NAKBT337 (M.9), and small dwarfing Budagovsky 9 (B.9) [1]. Cumulative yield efficiency from 2014 to 2019 and plant–water relations, nutrient status, and fruit dry matter in the growing season of 2019 were analyzed for each rootstock. The objective was to test the hypotheses that (1) scion xylem vessel properties and water relations of Honeycrisp were influenced by rootstock xylem vessel properties, and (2) cumulative yield efficiency was related to the balance between rootstock VCSA and scion VCSA. The findings would improve the understanding about hydraulic balances and dwarfing mechanism in the scion–rootstock system of Honeycrisp and other apple cultivars of similar growing habits, and they would facilitate the selection of rootstocks with desirable vessel traits for preferable yield efficiency, water-use strategies, and stress resilience.

2. Materials and Methods

2.1. Planting Materials and Trial Conditions

Ten-year-old Honeycrisp trees grafted on M.9, M.26, B.9, G.41, G.202, G.214, G.935, and G.3001 were grown in randomized blocks in silt-loam soil on the experimental farm at Summerland Research and Development Centre, BC, Canada (49°33′45” N, 119°38′55” W, elevation 454 m). The site was under the influence of the typical temperate semi-arid climate, with July and August being the hottest and driest months (daily maximum temperature at 28.4 °C in July and 28 °C in August, Environment Canada; historical average moisture deficit at 157 mm in July and 133 mm in August, www.farmwest.com, accessed on 2 May 2021, BC-Okanagan South-Summerland EC; data acquired on 11 January 2021). In 2019, precipitation and average moisture deficit were 39 and 134 mm in July, and 37 and 126 mm in August, respectively. Irrigation was applied through drip line during 8–10 a.m. every three days from May to October. Overhead irrigation was turned on for 5 min at 10 a.m. and 1 p.m. daily in July and August for canopy cooling and sunburn prevention. Trees were trained to Tall Spindle Axes structure in high-density planting in 1.2 m × 3.7 m spacing. Crop load management was conducted by chemical thinning on blossoms in May and hand-thinning of fruitlets after June drop.

2.2. Tree Growth, Yield, and Nutrient Status

Trunk cross-section diameter was measured at 30 cm above the grafted union in the north–south direction and east–west direction, using a digital caliper (Digimatic 8 ABS caliper with DP-1VA Digimatic data logger; Mitutoyo America Corporation). The trunk cross-section area (TCSA) was calculated in an approximation of a round disc to classify the vigor of scion growth (n = 6 for M.26, n = 5 for G.202, n = 3 for G.3001, and n = 9 for other rootstocks). Crop load was calculated as the number of fruits at harvest per cm2 of TCSA. Yield efficiency was calculated as the kilogram of fruits at harvest per cm2 of TCSA. Cumulative yield efficiency was the sum of annual yield efficiency from 2014 to 2019.
Leaf chlorophyll concentration was assessed in the absolute unit of µmol of chlorophyll per m2 of leaf area, using MC-100 Chlorophyll Meter in apple mode (Apogee Instruments Inc., Logan, UT, USA) [16], on the same days of leaf gas exchange measurements. Five healthy, fully developed, and sunlit leaves per tree were randomly sampled non-destructively, to represent the average leaf chlorophyll concentration for each tree (n as described for TCSA measurement).
For mineral nutrient analysis, sunlit, healthy, and fully developed leaves were sampled in August (n = 3, each sample consisted of 5 leaves per tree, 3 trees per rootstock); mature fruits without any disorders were sampled at harvest (n = 3; each sample consisted of 2 slices per fruit, 6 fruits per rootstock). Samples were completely dehydrated at 80 °C in an oven for a week and sent to A&L Canada Laboratories Inc. (London, ON, Canada) for the complete mineral nutrient analysis.

2.3. Fruit Skin Chlorophyll Content, Dry Matter, and Tissue Water Potential

The delta absorbance (DA) meter was used to determine the chlorophyll content of fruit skins for fruit maturity estimation (Sinteleia, Bologna, Italy). Fruit samples were harvested to target the optimal maturity on average, indicated by the mean absorbance difference index/coefficient (IAD) at 0.45 ± 0.10 across the trial [17]. Fruit samples from different rootstocks were harvested on the same day. At harvest, IAD was measured at the blush/background transition zone on 30 fruits per rootstock (6 fruits per tree, n = 5 trees for G.202; 10 fruits per tree, n = 3 trees for G.3001; 5 fruits per tree, n = 6 trees for other rootstocks). Fresh weight and dry matter content percent (DM%) were measured for each fruit using a compact bench scale (Ohaus R71MHD35 Ranger 7000) and Felix-750 Produce Quality Meter (Felix Instruments Inc., Camas, DC, USA), respectively. Fruit fresh weight was multiplied by DM% to estimate dry matter weight per fruit in gram (dry matter weight per fruit). Fruit moisture content (%) was estimated as 100—DM%.
The tissue water potential of fruit hypanthium (Ψfruit) at harvest was measured using a WP4C potentiometer (Meter Environment, Pullman, WA, USA) (n = 15 fruits per rootstock) [18].

2.4. Tree–Water Relations

Leaf photosynthetic rate (Pn), transpiration rate (Tr), and stomatal conductance (gs) were measured on sunlit, fully expanded and healthy leaves using the infrared gas analyzer of an LICOR-6800 portable photosynthesis system (LICOR, Lincoln, NE, USA), under photosynthetically active radiation level PAR = 1600 µmol photon m−2 s−1. Instantaneous water-use efficiency (WUEi) [19] was calculated as Pn divided by Tr. All the measurements were scheduled between 8 a.m. and 1 p.m. on the last days of the irrigation cycles in August 2019 when the daily maximum air temperature was above 30 °C. Midday stem water potential (Ψstem) was measured between 12:30 a.m. and 2 p.m. using a Scholander pressure chamber (PMS 1505D; PMS Instrument Company, Albany, OR, USA) [20], on the same day of leaf gas exchange measurements; on each sample tree, one representative, short vegetative branch with sunlit, fully expanded, and healthy leaves was enclosed in an equilibration bag for 10 min prior to the measurement. The sequence of the measurements was randomized amongst rootstocks (n = 5 for G.202, n = 3 for G.3001, and n = 6 for other rootstocks).

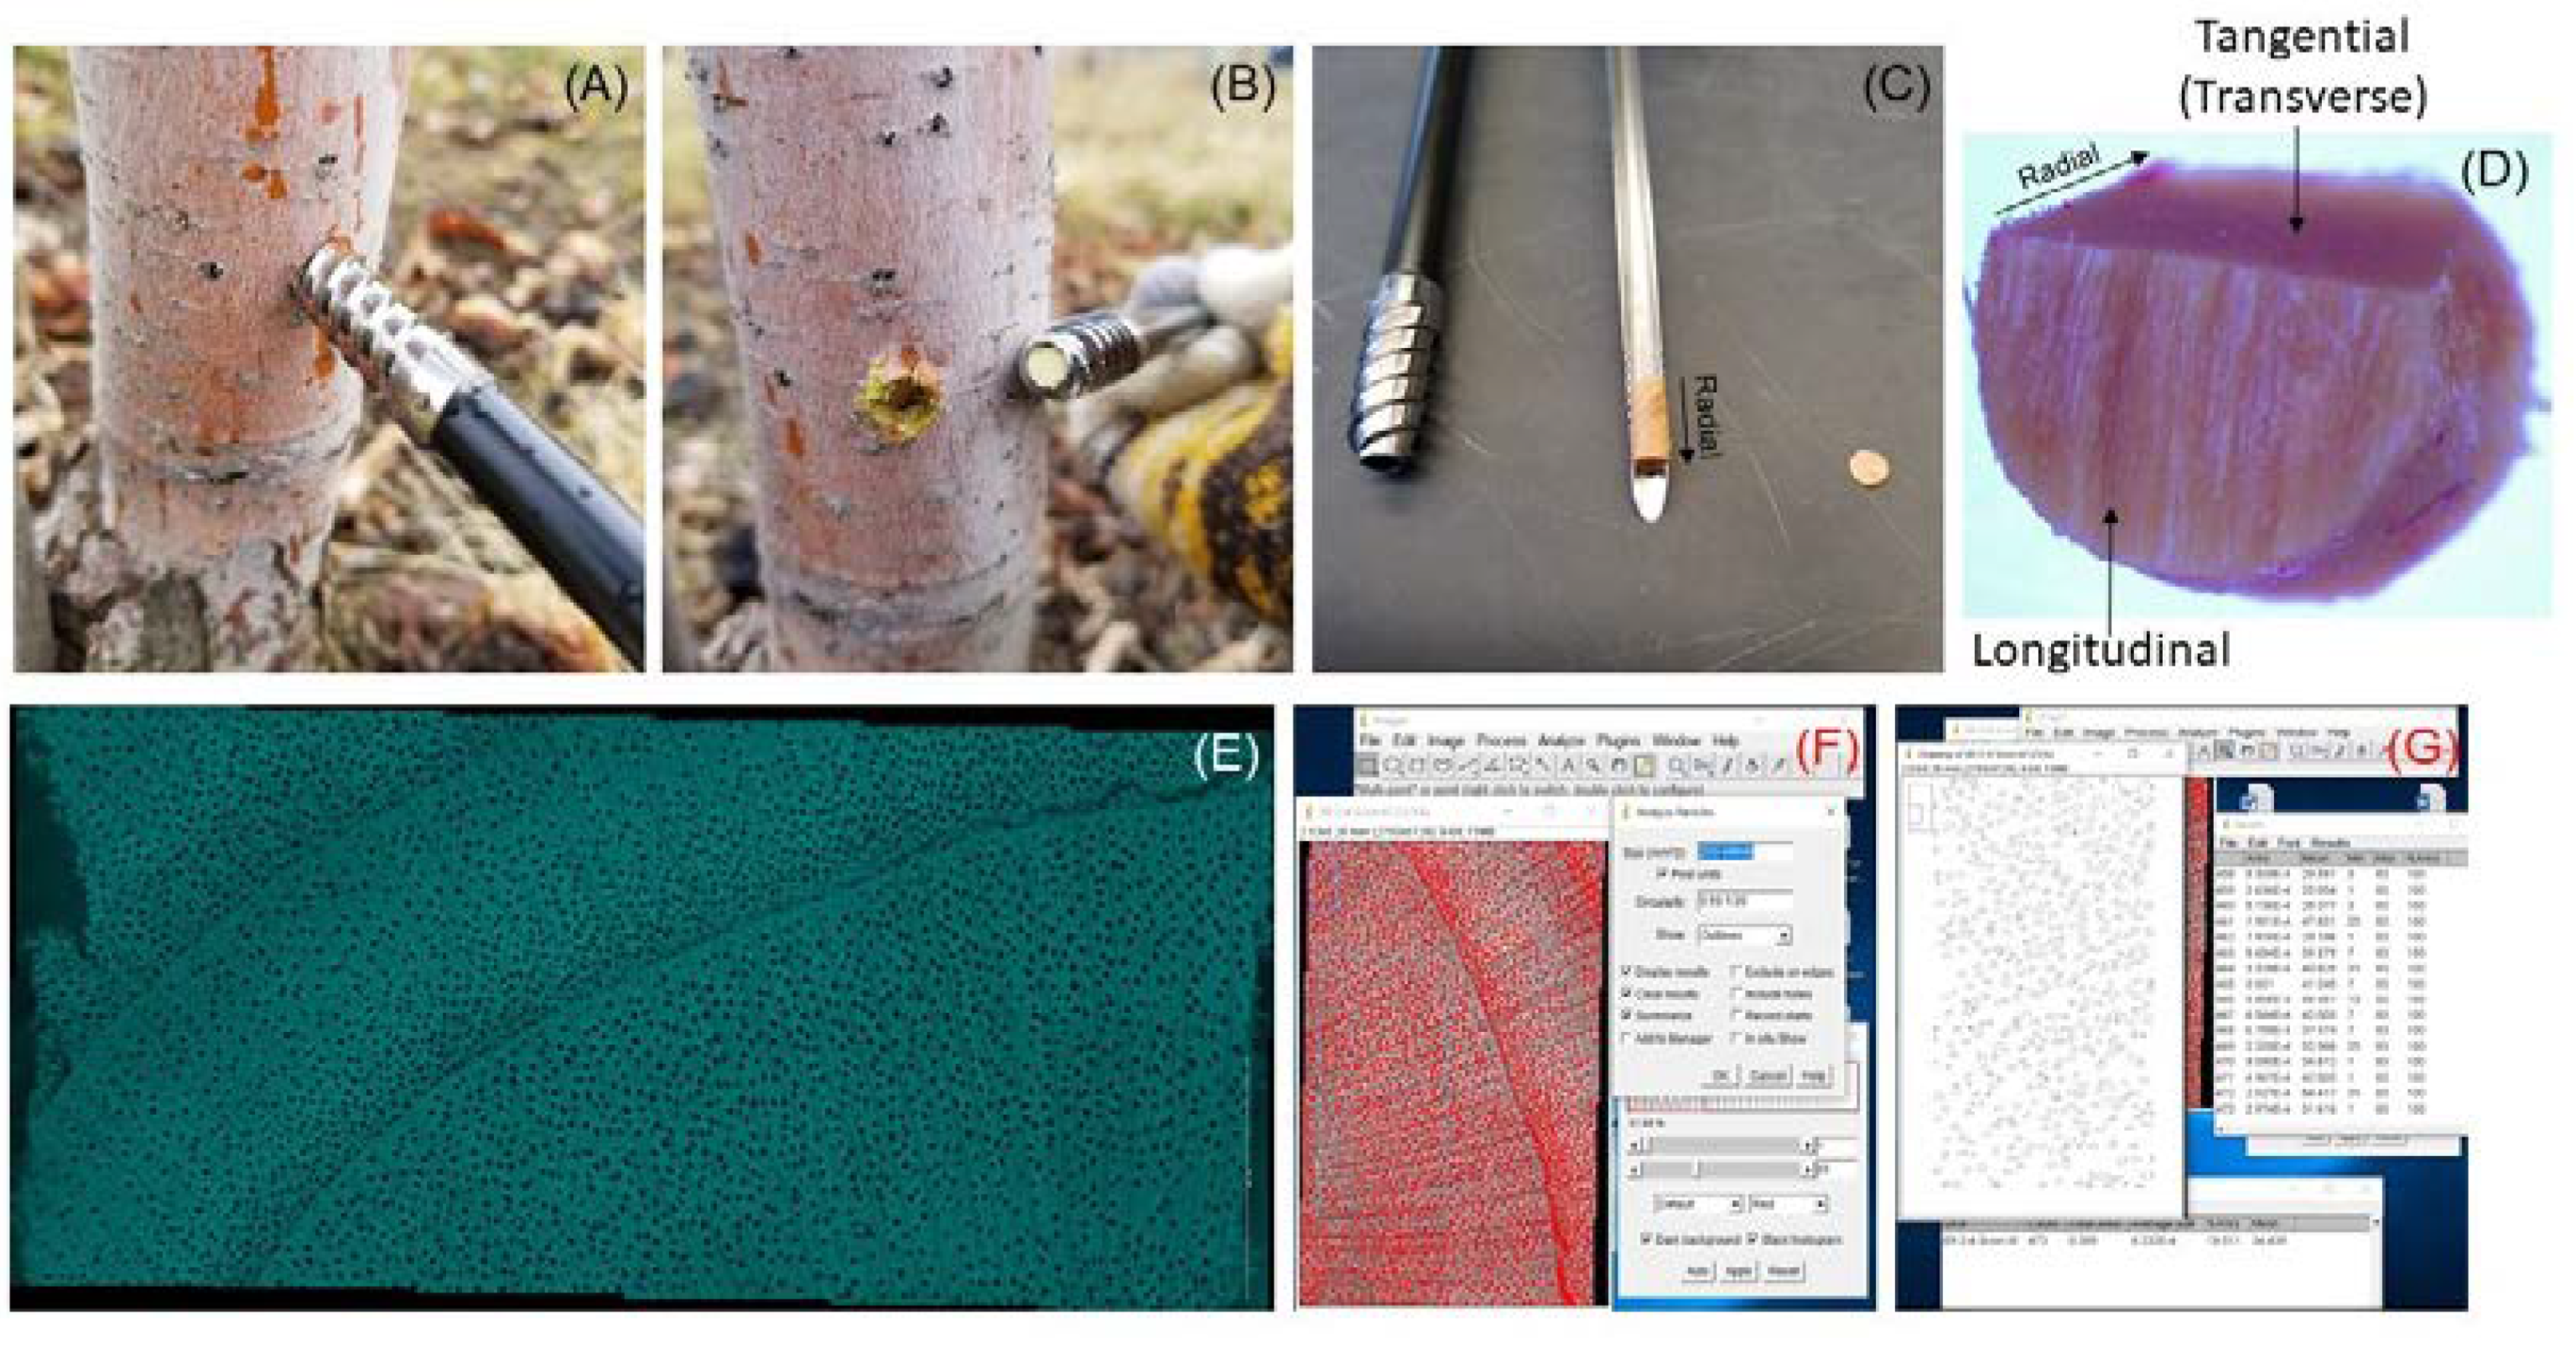
2.5. Xylem Vessel Elements

An increment borer (Haglöf 6” Complete Increment Borer, 3-Thread, 5.15 mm; Haglöf Inc., Madison, MS, USA) was used to acquire the secondary xylem samples of about 2 cm in length from the sap wood of living trees by the end of the growing season of 2019 (n = 3) (Figure 1). The scion wood and rootstock wood were cored out radially, i.e., perpendicularly to the trunk, from 2.5 cm above and 2.5 cm below the graft union, respectively (Figure 1A,B). The cored wood cylinders were stored in Formaldehyde Alcohol Acetic Acid fixative (FAA; 50% ethanol, 5% (v/v) acetic acid, 3.7% (v/v) formaldehyde) at 4 °C for preservation. A small disc of about 0.5 cm thick was cut out of the wood cylinder at 0.5 cm inward from the outer edge of the samples to exclude bark, phloem, and cambium (Figure 1C). Under a dissecting microscope, using a fine razor blade, a new sectioning was made parallel to the diameter of the circle of the disc, to cut a 1/3 arc off the circle and reveal the tangential view of the stem (Figure 1D). This new rectangular section represented the transverse side of the stem, and it was placed facing the cover slip for observation.
The autofluorescence of the unstained wood samples were visualized above a 10× inverted objective lens of Leica SP8X white-light laser confocal microscope (DAPI filter, UV fluorescence mode, excitation wavelength at 325–375 nm) (Leica Microsystems) (Figure 1E). Images of the transverse section of secondary xylem were acquired by X-Y tiling and Z-stacking. Stacking was processed using Helicon Focus software (Helicon Soft Ltd.) to generate clearly focused images. The stacked images were converted to 8 bit and analyzed for vessel element size, density, and total cross-section area, in ImageJ (National Institutes of Health, V.1.53) [21]. A clear section of about 1 mm2 in area between growth rings was selected. The threshold function was used to determine the total area of the selected rectangle. Then, the threshold was adjusted to detect the cross-section of xylem vessel elements (Figure 1F). For the scion images, the pixel size was set as 400-infinity, and the circularity as 0.5–1; the threshold ranged from 97 to 115. For the rootstock images, the pixel size ranged from 130–200 to infinity, the circularity was set as 0.5–1 or 0.55–1, depending on the specific rootstocks; the threshold ranged from 55 to 135. The count and average size of the cross-section of vessel elements, and the percentage of vessel cross-section area on the selected transverse section of the wood sample (VCSA%), were calculated in ImageJ (Figure 1G). The total vessel cross-section area (VCSA) was estimated by multiplying VCSA% with TCSA of the stem where xylem tissues were sampled, for rootstock and scion, respectively.

2.6. Data Analysis

Significant difference was analyzed using ANOVA, Tukey–Kramer Pairwise Comparisons (p ≤ 0.05) in OriginPro 8.0 (OriginLab, Northampton, MA, USA). Significant differences were indicated using different letters in Table 1 and in the sub-panels of the figures. In Table 1 and bar graphs, ns and the absence of letters indicated no significant difference. The number of replications was noted in each method described above. Figures 1–7 were graphed in Sigma Plot (V.13.0, Systat Software Inc., San Jose, CA, USA), and Figure 8 was graphed in JMP 15 (Statistical Discovery, SAS, Cary, NC, USA). Lines in box plots from bottom to top showed the minimum, first quartile, median, third quartile, and maximum values. Bars or round discs with error bars were the mean ± the standard error.

3. Results

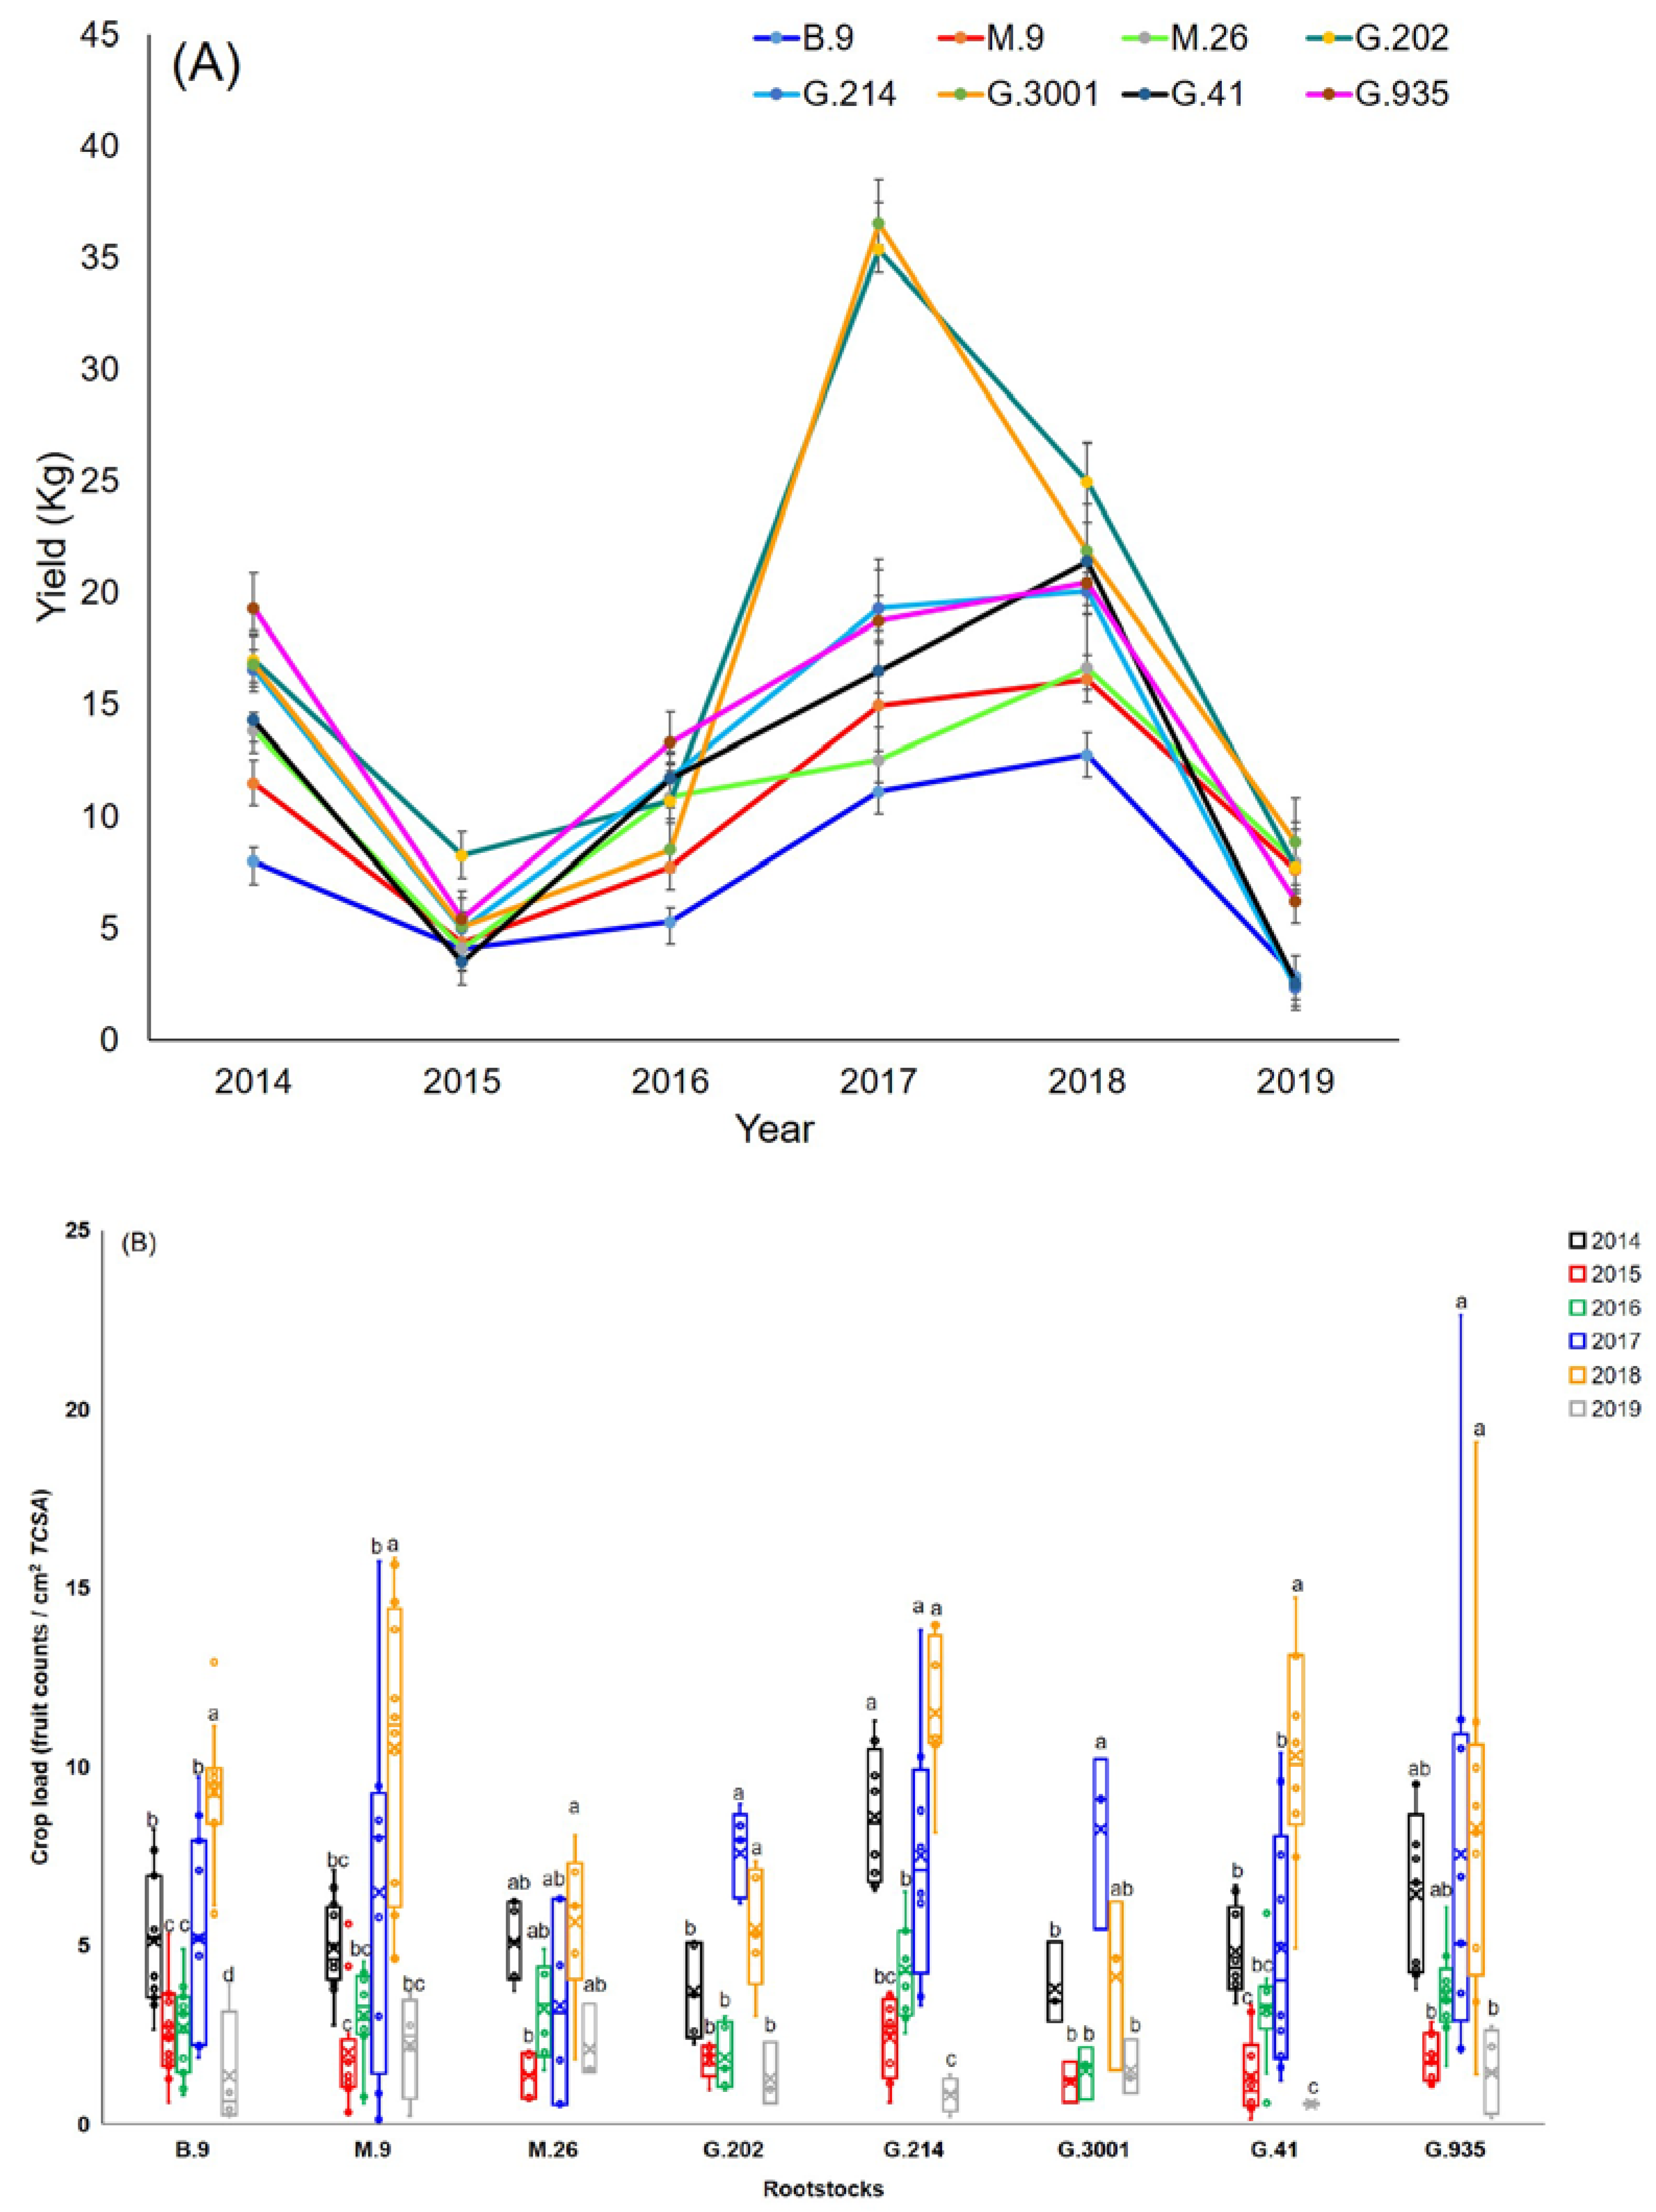
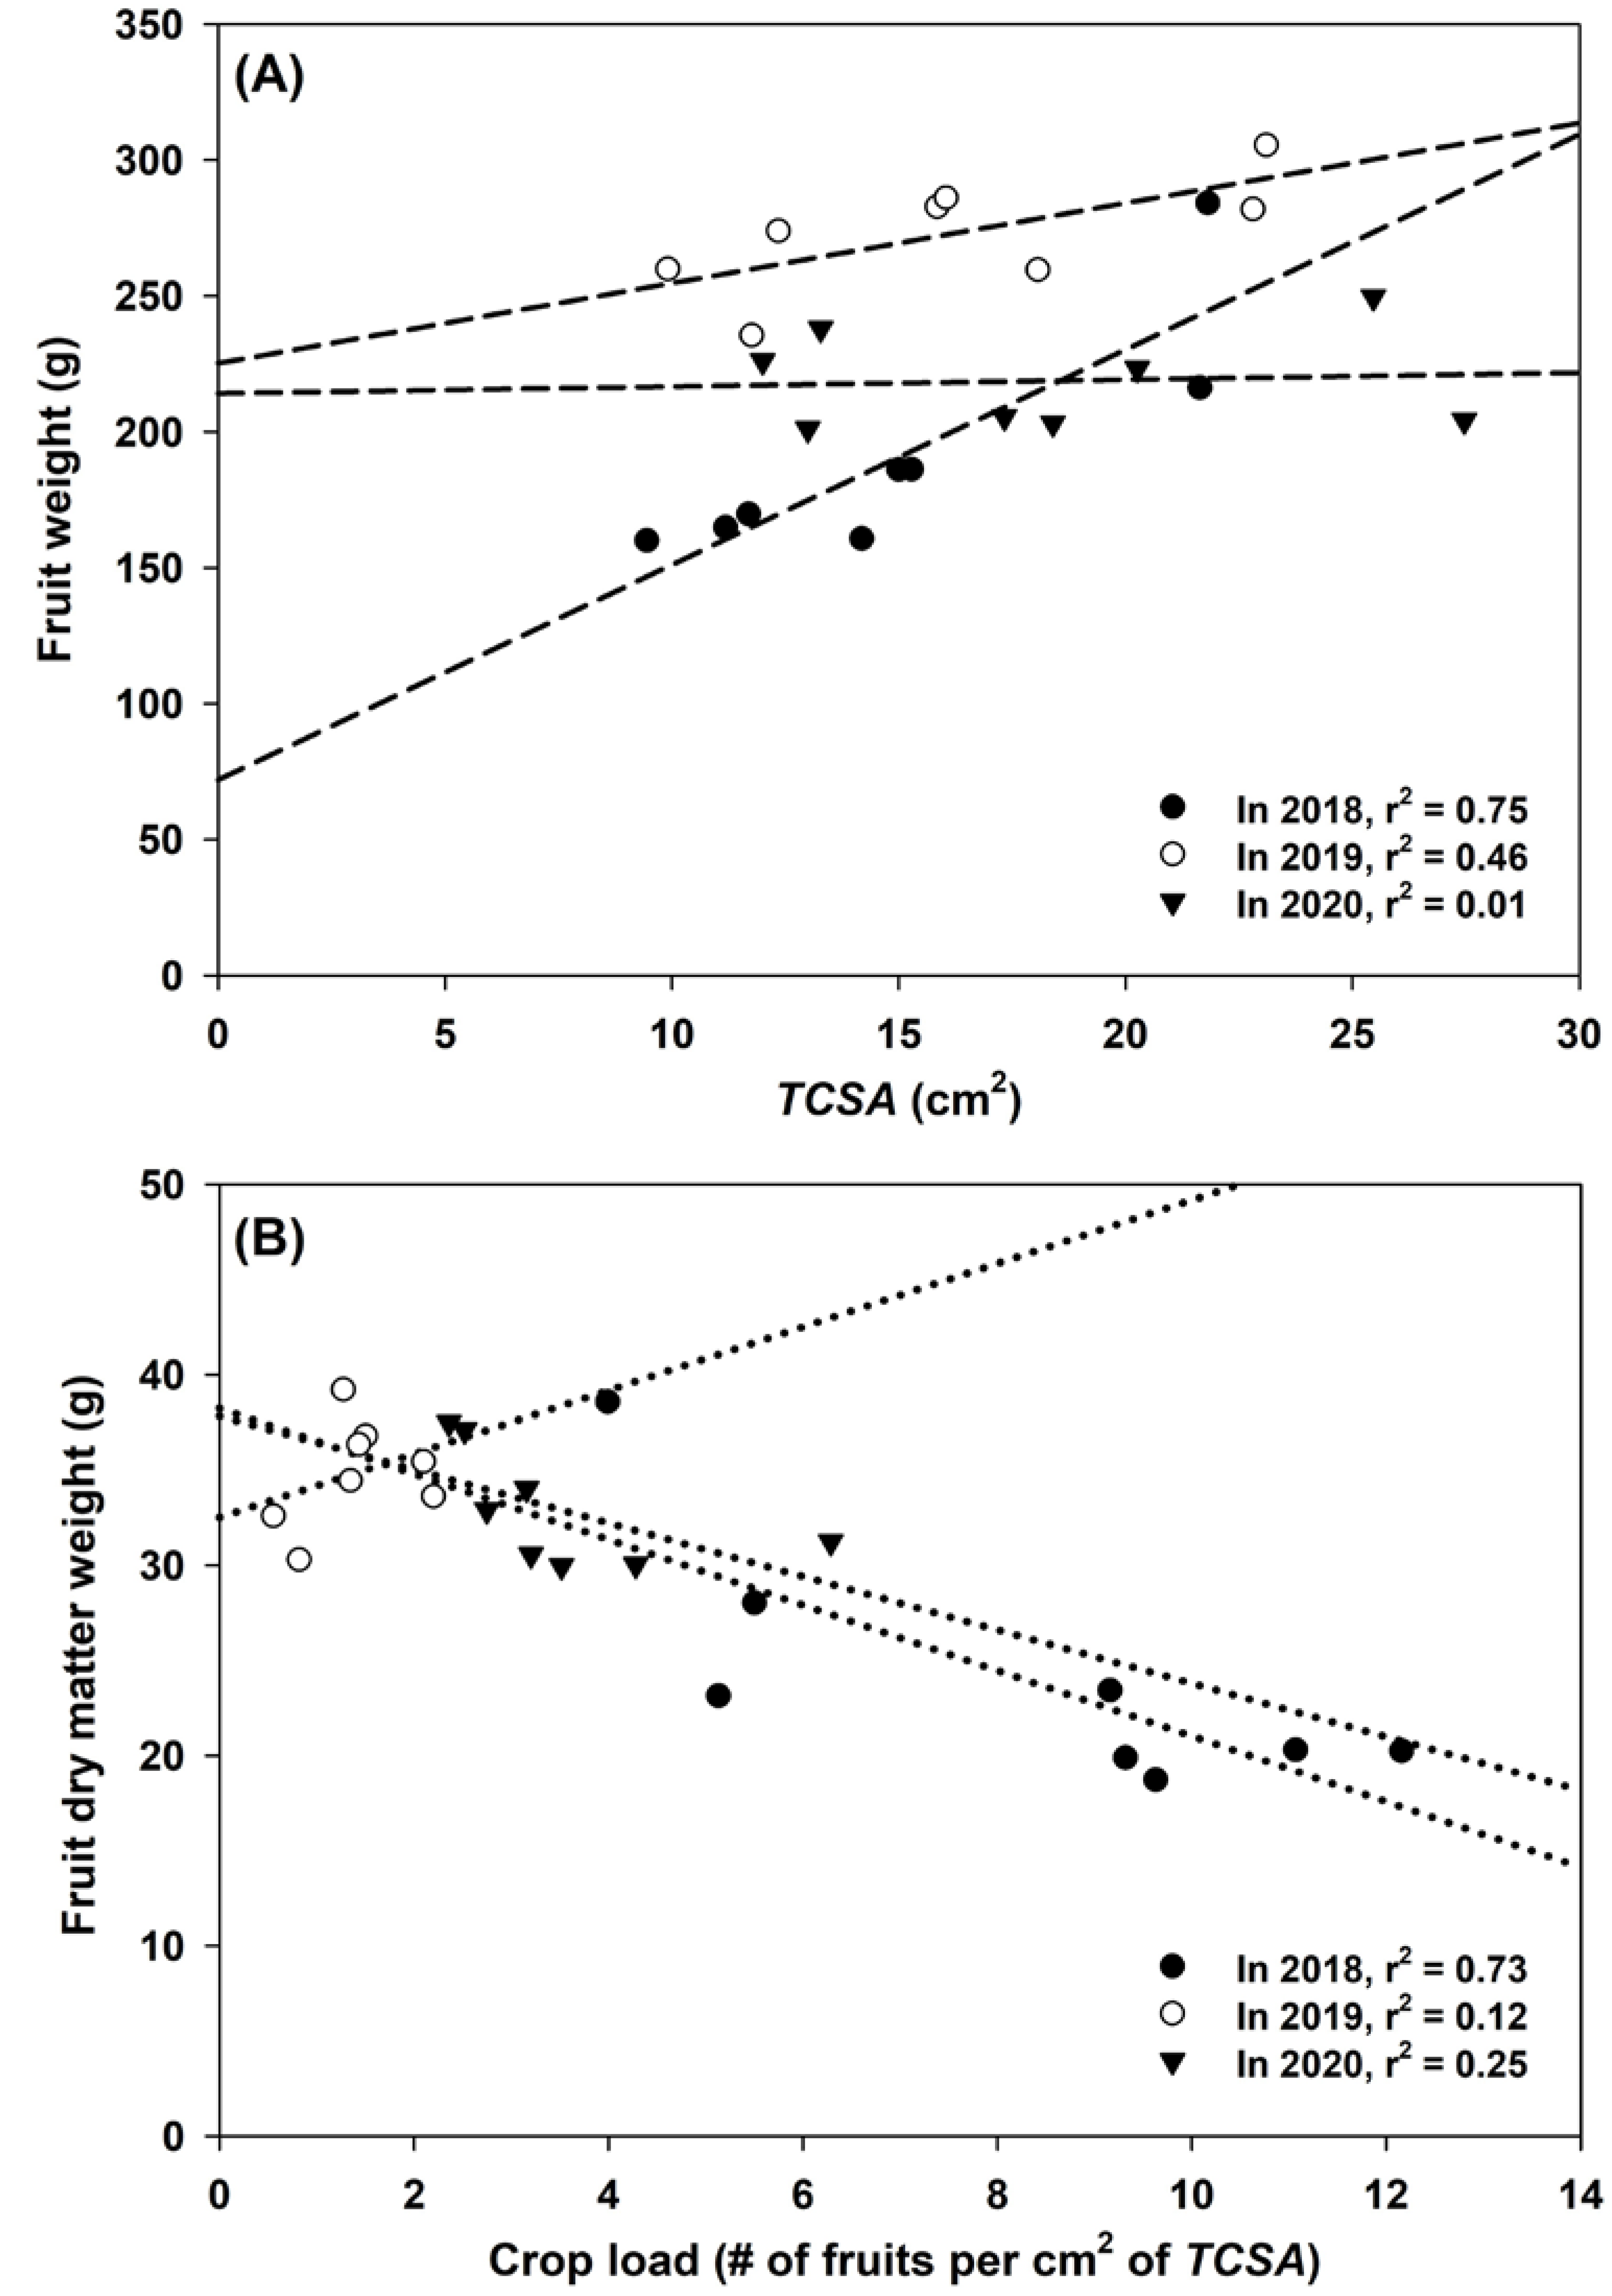
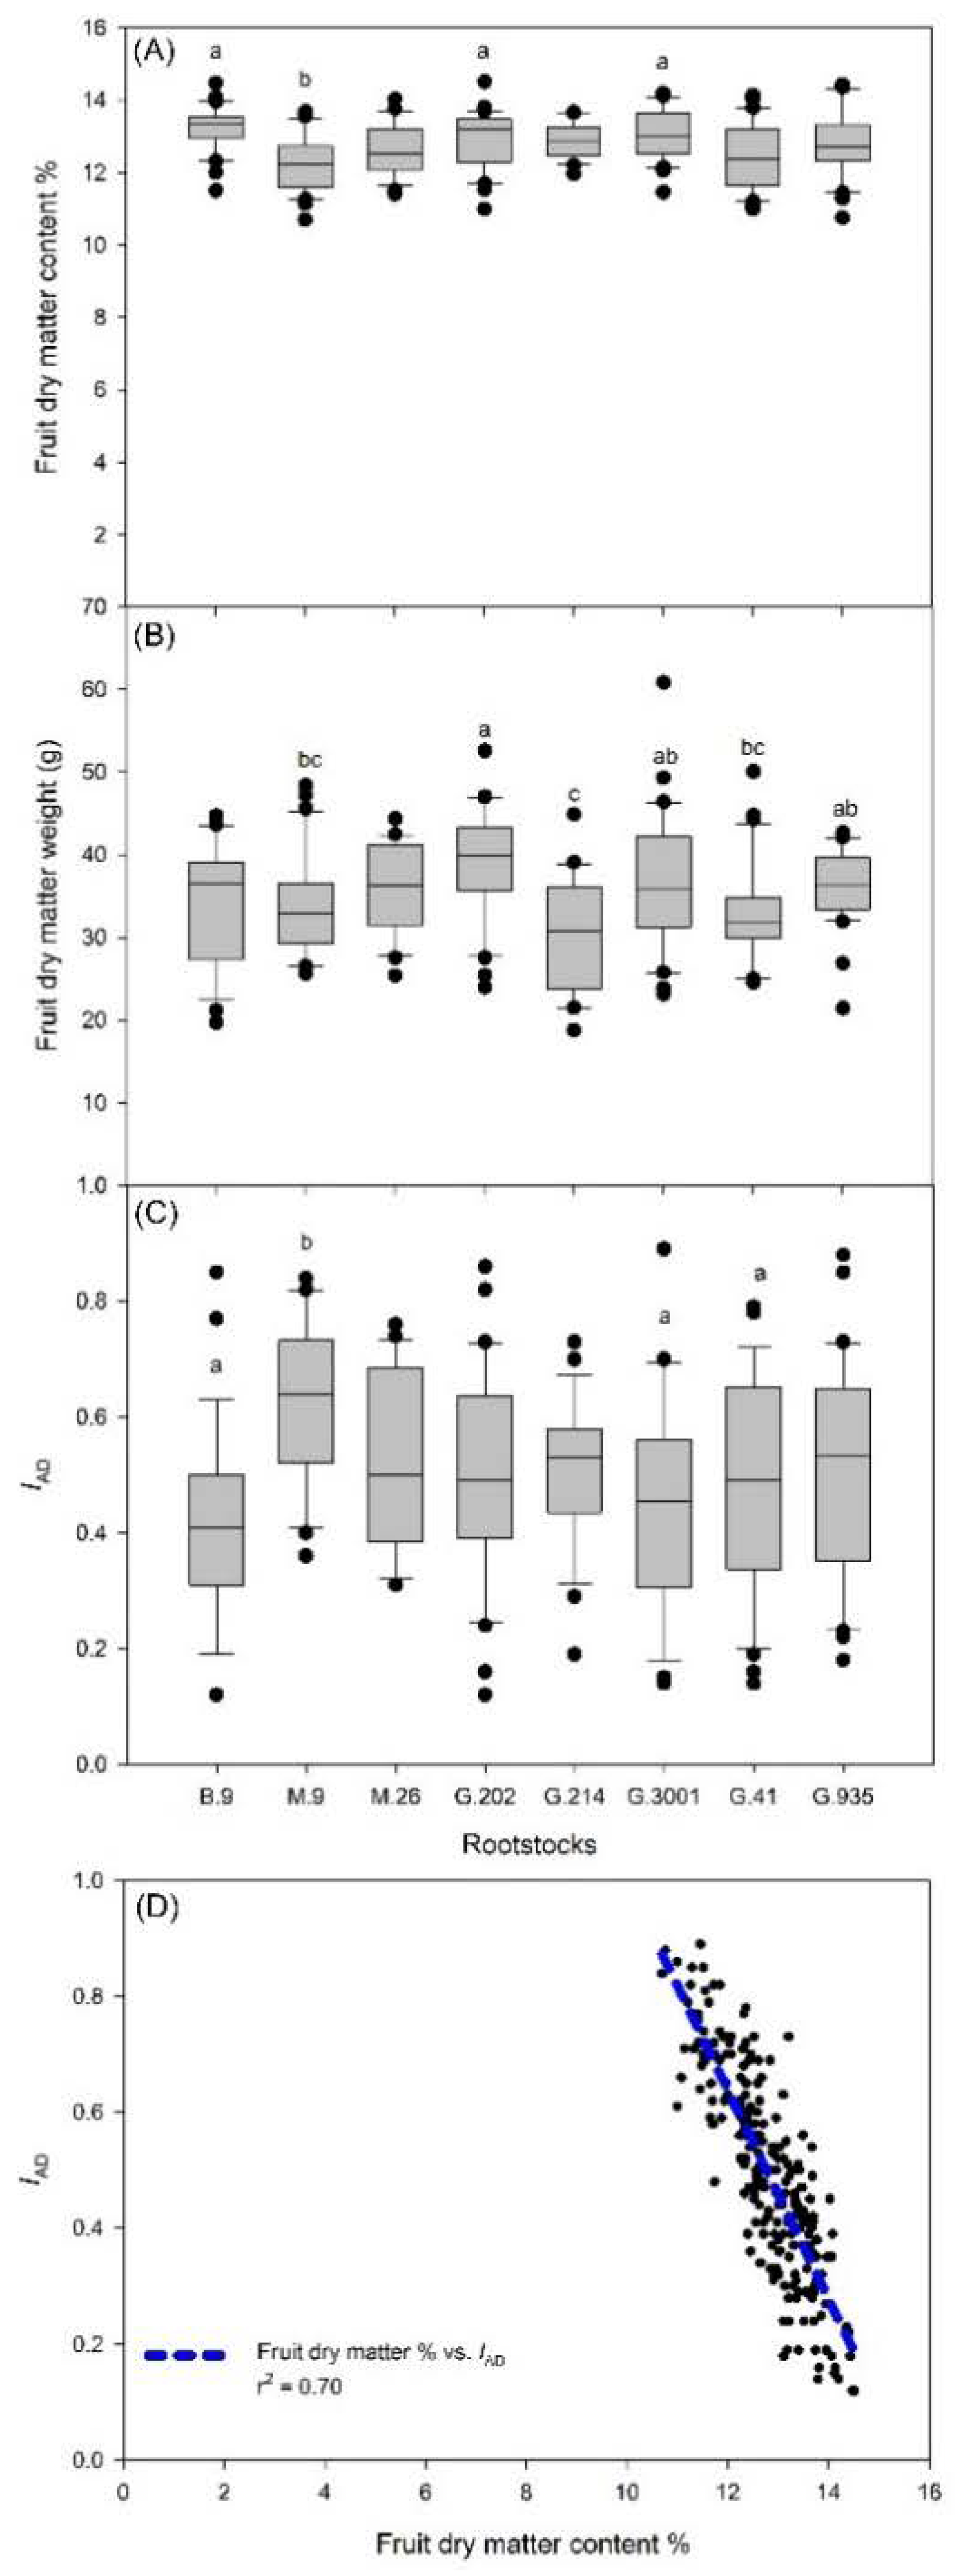
3.1. Yield, Crop Load, and Fruit Dry Matter

Honeycrisp cultivar showed strong year-to-year variations in yield (Figure 2A) and crop load (Figure 2B), in all the rootstocks. The pattern of variation was consistent across the rootstocks: both yield and crop load were moderate in 2014, followed by very low production in 2015, an insignificant recovery in 2016, high production in 2017 and 2018, and very low production in 2019. The two most vigorous rootstocks, G.202 and G.3001, had the highest cumulative yield and low yield efficiency in 2014–2019 (Table 1), and they showed the largest yield variation between 2017 and 2018 (Figure 2A). Less vigorous rootstocks B.9, M.9, and G.41 showed significant fluctuations in crop load in 2017, 2018, and 2019, as well as large tree-to-tree variations in each year (Figure 2B). In the two smallest rootstocks, B.9 showed the lowest cumulative yield, and G.214 had the highest yield efficiency (Table 1).
In 2018, crop load ranged from 4 to 12 fruits per cm2 TCSA, with the median at 8.5 fruits cm−2 across the 8 rootstocks. Fruit weight at harvest was positively correlated with TCSA (r2 = 0.75, Figure 3A); a strong negative correlation was observed between crop load and fruit dry matter weight (r2 = 0.73, Figure 3B). In contrast, in 2019 (0.5 to 4 fruits cm−2, with the median at 1.1 fruits cm−2) and 2020 (1 to 8.5 fruits cm−2, with the median at 3 fruits cm−2; Figure 3B), the median crop load was significantly lower than in 2018; the correlation between crop load and fruit dry matter weight was not pronounced in these two years of low and medium crop load (r2 = 0.12 in 2019 and r2 = 0.25 in 2020, Figure 3B). The correlation between fruit weight and TCSA in 2019 and 2020 was also less significant than that in 2018 (Figure 3A).
In 2019, a year when crop load variation had minimal impact on fruit dry matter, fruits produced by B.9, G.202, and G.214 had higher DM% than M.9 (Figure 4A). Fruits produced by G.202 also had significantly higher dry matter weight than M.9, G.214, and G.41 (Figure 4B). G.214 had the lowest fruit dry matter weight, which was attributed to its smaller fruits (Table 1). Fruits on M.9 showed significantly higher IAD than B.9, G.3001, and G.41 (p ≤ 0.05), suggesting a delay in fruit maturation in M.9 (Figure 4C). Across the rootstocks, fruit DM% negatively correlated with IAD (Figure 4D), showing that during fruit maturation, DM% increased along with the decline in IAD which reflected the chlorophyll loss in fruit skin.

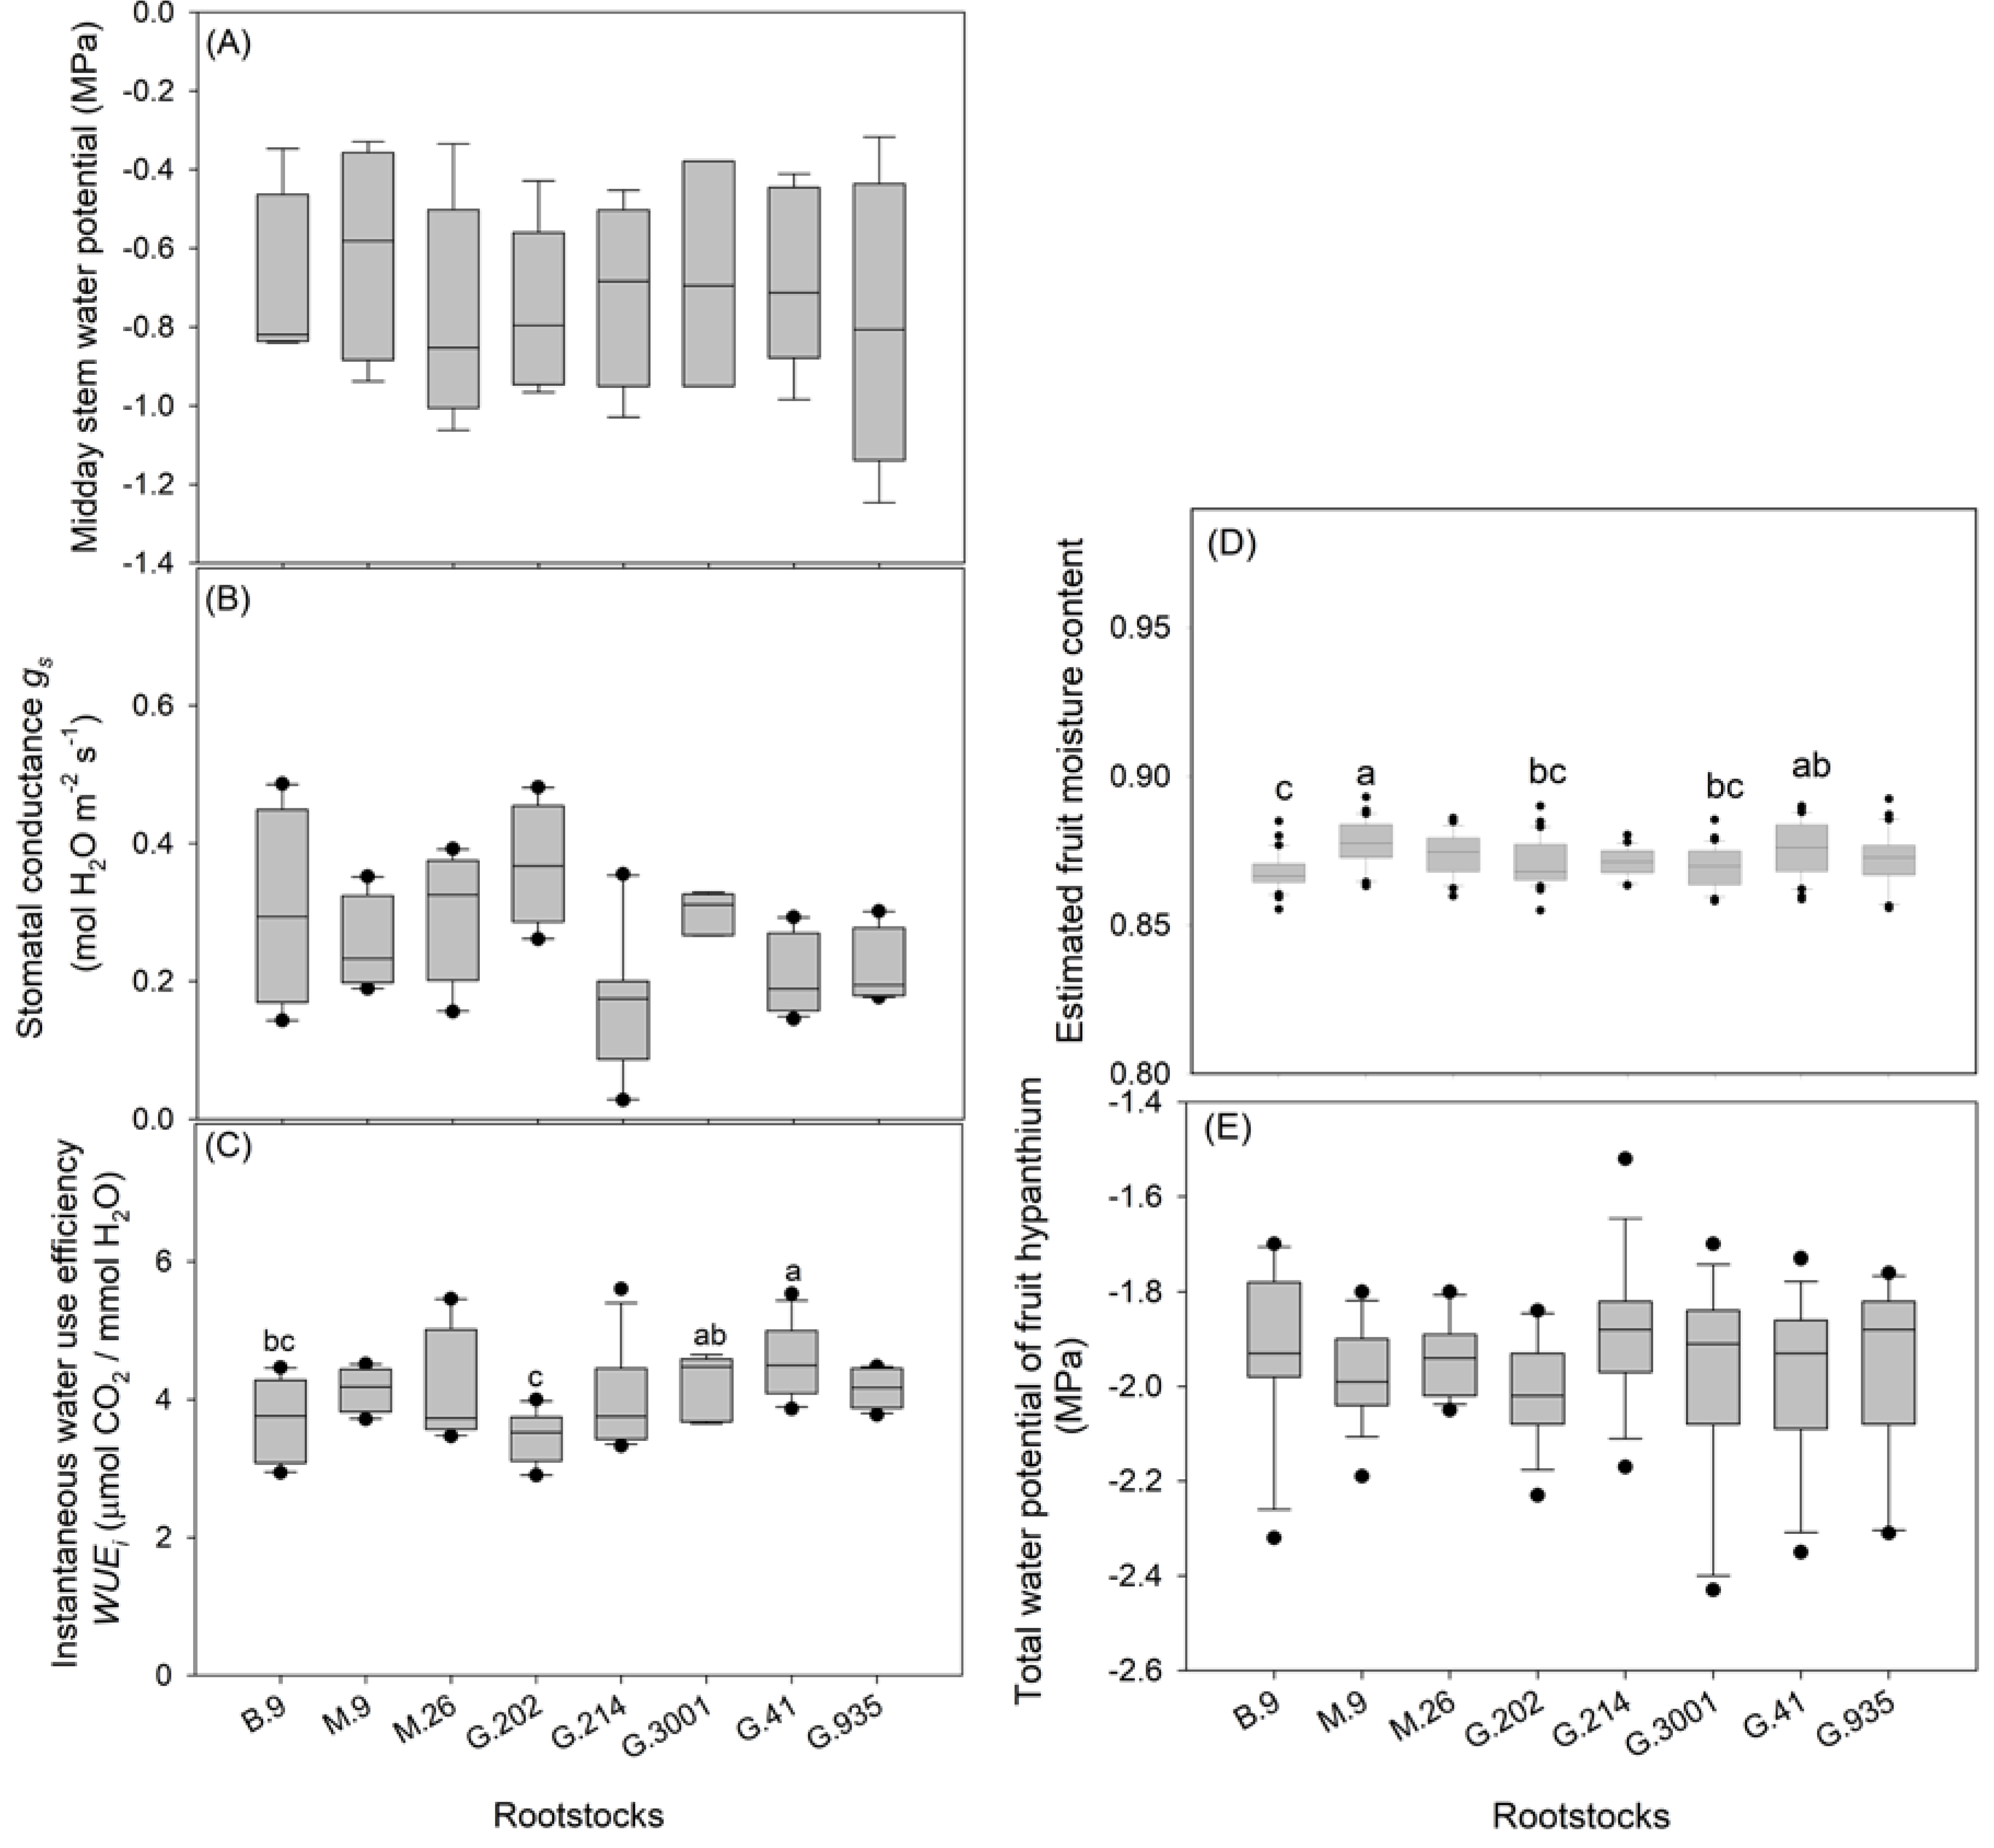
3.2. Tree Water and Nutrient Status

Scions on different rootstocks were similar in midday Ψstem during 12:30 a.m.–2 p.m. (Figure 5A) and in morning leaf gs (Figure 5B) on sunny days with maximum daily temperature above 30 °C in August, about 46–52 h after irrigation. Despite no significant difference (p ≤ 0.05, ANOVA, Tukey–Kramer), trees on B.9 had slightly higher Ψstem than other rootstocks, whereas G.214 had the lowest median in gs. G.41 and G.3001 had higher WUEi values than B.9 and G.202 (Figure 5C). At harvest, M.9 led to higher fruit moisture content than G.202, G.3001, and B.9 (Figure 5D). Fruits from different rootstocks demonstrated similar total Ψfruit (Figure 5E).
Rootstocks rendered more variations in leaf nutrients than in fruit nutrients (Table 1). B.9 and G.202 did not demonstrate deficiency in the analyzed macronutrients or micronutrients; theyhad higher leaf iron level than other rootstocks. G.214 was low in leaf nitrogen, magnesium, manganese, iron, and chlorophyll concentration, but its fruit mineral nutrient levels were similar to other rootstocks (Table 1).

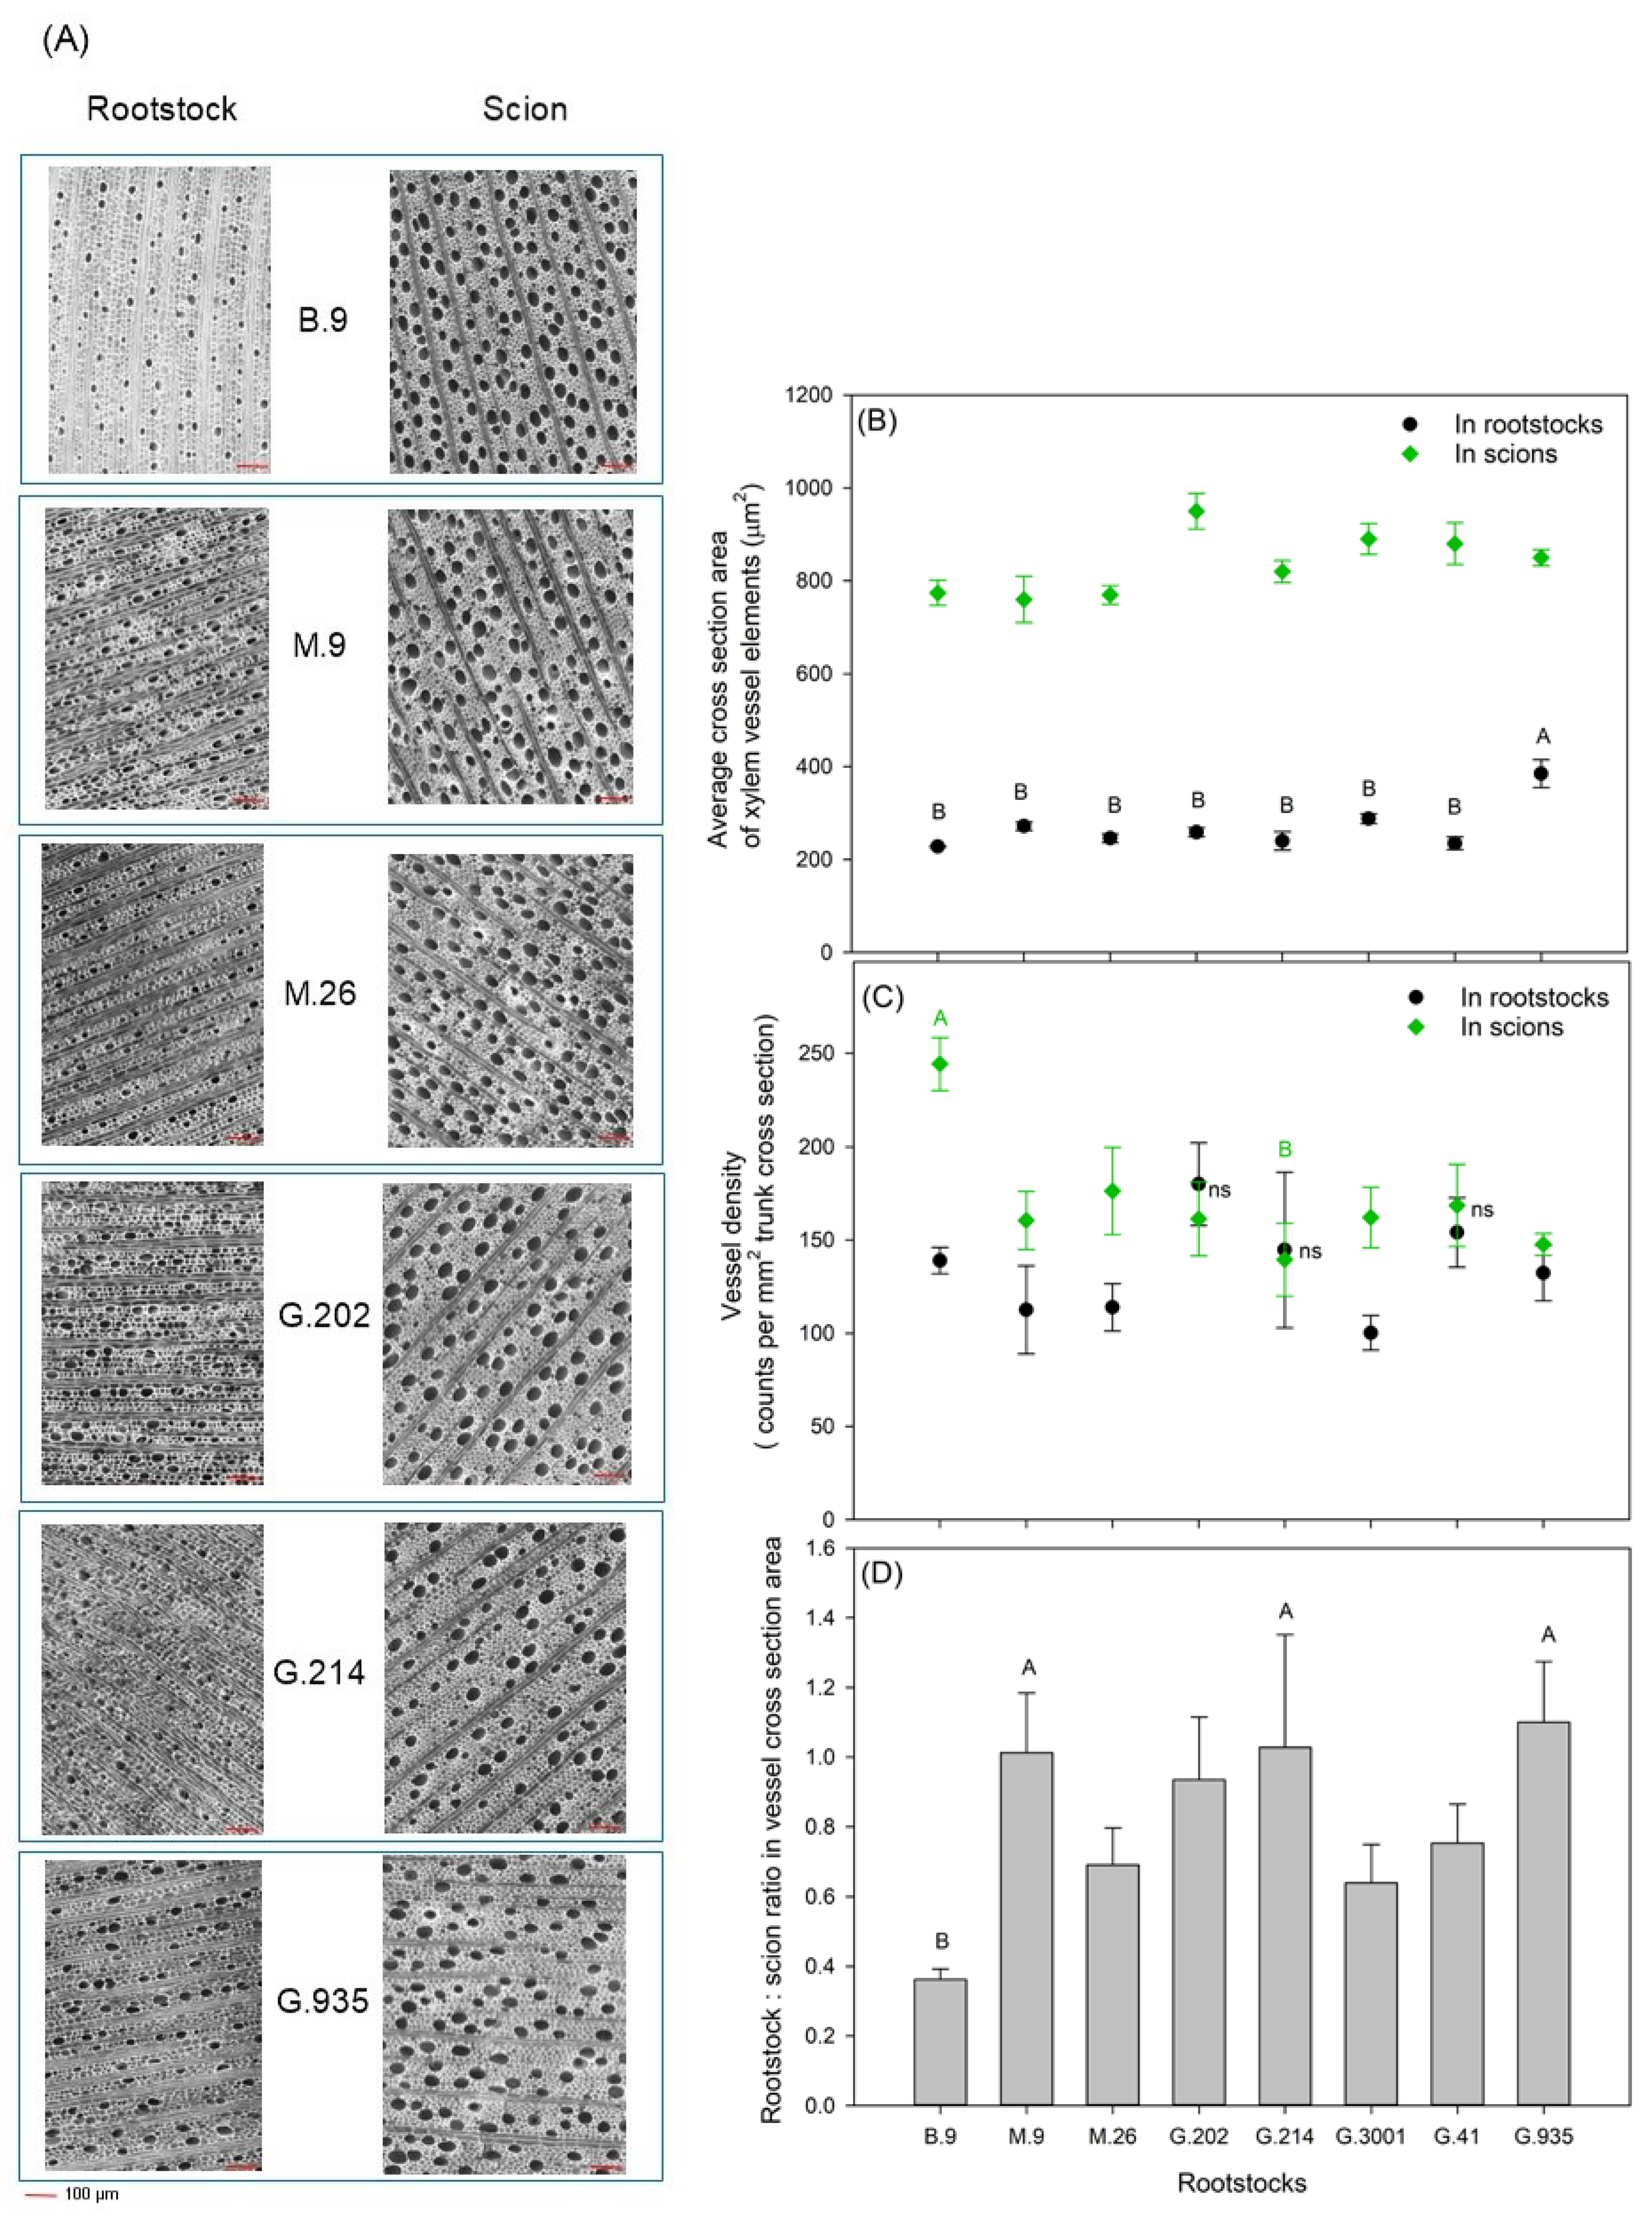
3.3. Xylem Vessel Elements in Relation to Tree Vigor and Yield Efficiency

In general, scion xylem had much wider vessel elements and much larger size of vessel cross-section on the stem transverse plane, compared to rootstock xylem (Figure 6A,B). Scion xylem also had higher vessel element density than rootstock xylem, except for G.202, G.214, and G.41 where there was no significant difference (ns, Figure 6C). In rootstock xylem, G.935 had significantly wider vessel elements compared to the other rootstocks (Figure 6B); vessel element density was similar amongst the rootstocks (Figure 6C). Rootstocks did not render significant difference in the size of vessel elements in scion xylem, except for G.202 being slightly larger (Figure 6B). B.9 led to the highest scion vessel element density, whereas G.214 had the lowest (Figure 6C). In M.9, G.214, and G.935, rootstock VCSA: scion VCSA ratio (VCSArootstock:VCSAscion) was close to 1, and the lowest ratio was observed in B.9 (Figure 6D).
Scion TCSA was positively correlated with rootstock TCSA in 2019 (Figure 7A, r2 = 0.83) and with 2014–2019 cumulative yield (Figure 7B, r2 = 0.69, round discs and dot line). Positive correlations were also observed between scion TCSA and yield (r2 ≈ 0.5), tree height (r2 ≈ 0.6), and canopy spread (r2 ≈ 0.5) in 2017 (Figure 8). Cumulative yield efficiency tended to decline along with the increase in scion TCSA; however, the tendency was not significant (Figure 7B, r2 = 0.32, circles and dash line). Scion VCSA was positively correlated with rootstock VCSA (r2 = 0.56, graph not shown), and with leaf Tr (Figure 7C, r2 = 0.54, round discs and dot line), but it was negatively correlated with fruit Ψfruit (Figure 7C, r2 = 0.50, circles and dash line). G.214 had the lowest scion VCSA and leaf Tr, but the highest Ψfruit, whereas G.202 showed exactly the opposite trend.
Rootstock VCSA was strongly positively correlated with cumulative yield of 2014–2019 (Figure 7D, r2 = 0.74). G.202 demonstrated the highest values in rootstock TCSA and VCSA, scion TCSA and VCSA, and cumulative yield, whereas B.9 was the lowest in rootstock TCSA and VCSA, and scion TCSA (Figure 7).

4. Discussion

4.1. Tree Vigor, Yield, and Water Use Strategies

Rootstocks can be categorized into different vigor classes according to the final tree size compared to a standard seeded apple tree. Semi-dwarfing and dwarfing rootstocks usually produce trees with TCSA being about 60% and 30–60% of that of a standard tree, respectively. Both classes can be further divided into large, moderate, and small sub-classes. In this study, most rootstocks conferred tree vigor as anticipated; TCSA in 2019 from large to small was G.202 ≈ G3001 > G.41 > G.935 ≈ M.26 > M.9 > G.214 > B.9 (Table 1), which was consistent with the reported scion vigor in trunk circumference, tree height, and canopy width in 2017 [1]. Across the rootstocks, the positive correlation between scion TCSA and yield as well as canopy dimension (determined by tree height and canopy width) in 2017 (Figure 8) suggested that larger scion TCSA was associated with higher potential in both yield and vegetative growth, which is consistent with the 2019 data (Figure 7). The correlation between TCSA and yield (r2 ≈ 0.5) was higher than that between canopy dimension and yield (r2 < 0.4), which made TCSA a more accurate indicator for yield potential prediction. None of the evaluated rootstock could efficiently suppress the biennial bearing. The higher yield the rootstocks had, the stronger their year-to-year yield variation tended to be (Figure 3A). In the least vigorous rootstocks, crop load tended to vary more significantly annually (Figure 3B). Stronger correlations between TCSA and fruit weight, and between crop load and fruit dry matter, were observed in 2018, a year of heavy crop load. The trees with larger TCSA produced the fruits with higher weight (Figure 3A), suggesting that the fruit growth on the less vigorous trees could be more sensitive to heavy crop load. Higher crop load led to lower fruit dry matter weight across the rootstocks (Figure 3B). A previous study also showed the increase in crop load led to decreased fruit dry matter content (%), soluble solids content, and firmness in Honeycrisp on M.9NIC29 [11]. This is expected; as the number of photosynthate sinks increases, each sink receives less carbohydrates, and meanwhile, the leaf–fruit and fruit–fruit competitions for water and mineral nutrients become more intense, which restricts fruit development and growth [22,23]. This finding pointed out the importance of managing crop load for the improvement of fruit dry matter accumulation and fruit quality, particularly for the highly productive rootstocks and the least vigorous rootstocks, in years with higher yield potential.
Xylem VCSA of the tree depends on the size and density of vessel elements as well as TCSA. In this study, rootstock vessels did not directly correlate with scion vessels in either size or density in Honeycrisp apple, similarly to what was reported in peach [15]. However, rootstock TCSA and VCSA were shown to be indicative for scion growth and yield, with lower VCSA concurring with less scion growth. Interestingly, this was similar to the study by Harrison et al. [3] in which thicker root bark and consequently less root vessel transporting area led to a more pronounced dwarfing effect. G.202, a moderate semi-dwarfing rootstock [1], produced the largest TCSA of rootstock and scion in this study (Table 1, Figure 7A,B). Its rootstock VCSA was higher than others, which was attributed to its larger TCSA (Table 1) and higher vessel density in its rootstock xylem (Figure 6C). Its scion VCSA was also the highest (Figure 7C), which was associated with the larger size of the vessel cross-section in scion xylem (Figure 6A,B). The scion VCSA indicated higher water use, which was consistent with its higher gs (Figure 5B) and leaf Tr (Figure 7C) in August. Higher leaf gas exchanges may have resulted in more photosynthate assimilation, which is shown as higher fruit dry matter weight (Figure 4B); meanwhile, more transpirational water loss could lead to more leaf–fruit water competition and a higher percentage of osmolytes in fruits, which is shown as lower fruit moisture content (Figure 5D). Both mechanisms could contribute to a lower Ψfruit in G.202 observed at harvest (Figure 5E and Figure 7C). Unsurprisingly, this most vigorous rootstock led to the highest cumulative yield over 6 years, likely at a cost of high water use as indicated by its above-mentioned xylem vessel characteristics and water relations, and by its lower WUEi (Figure 5C).
Small semi-dwarfing G.3001 produced the second largest tree in this study, followed by large dwarfing M.26, G.41, and G.935. G.41 demonstrated the highest WUEi (Figure 5C) but the lowest cumulative yield efficiency (Table 1, Figure 7B). This concurs with Blum‘s statement [2] that there does not necessarily exist a positive correlation between WUEi and yield potential, and therefore, when yield potential is the goal, WUEi as a selection criterion has its limitations and should be used with caution. The relatively low gs (Figure 5B) and Tr (Figure 7C) of G.41 indicated low water use, at a cost of compromised carbohydrate assimilation shown as moderate yield (Table 1) and low fruit dry matter weight (Figure 4B). Since a tree has the finite amount of net photosynthetic gain to distribute amongst reproductive and vegetative sinks, low yield efficiency and low fruit dry matter weight could also imply that more carbohydrates were allocated to non-reproductive growth [24,25]. G.41 is known to develop brittle grafted union with Honeycrisp scion [26]; the roles that such grafted union plays in restricting water use and altering carbohydrate allocation would require further investigation.
Compared to M.26 and G.41, G.935 had lower vigor (Figure 7A) but higher cumulative yield and yield efficiency (Figure 7B, Table 1). It also rendered lower scion VCSA (Figure 7C), but showed higher rootstock VCSA (Figure 7D) that was associated with its larger vessel size in rootstock xylem (Figure 6A,B). G.935 was the only rootstock that was ranked in the top 3 in both cumulative yield and yield efficiency, suggesting a high level of carbohydrate allocation to fruits rather than non-reproductive growth. It also demonstrated the moderate tree water status. These features could make it a suitable rootstock to attain high yield in high density planting when water is limited to some extent.
G.214 was supposed to be another large dwarfing rootstock; however, it rendered relatively low vigor in Honeycrisp in this study, implying rootstock–scion incompatibility. Its rootstock TCSA was smaller than the moderate dwarfing M.9, and its scion TCSA was comparable to both M.9 and the small dwarfing B.9 (Table 1, Figure 6A). G.214 led to the lowest vessel density (Figure 6B) and the smallest VCSA (Figure 7C) in scion, concurring with low gs (Figure 5B). These hydraulic limitations may have incurred lower mineral nutrient transport and consequently affected the leaf nutrient availability and the chlorophyll content (Table 1). Limited leaf gas exchanges led to low carbohydrate assimilation, which may have caused its lower fruit dry matter weight (Figure 4B), lower fruit weight and slower trunk increment (Table 1). The trunk increment may also be slowed down by the development of sap wood in low vessel density and less porosity. Additionally, Autio et al. [1] reported that this rootstock produced significantly more root suckers (22.3 ± 2.6 suckers per tree) than the other seven rootstocks by the fall of 2017 (3.9 ± 1.1 on average), providing another indication for the inefficient resource distribution from this rootstock to the Honeycrisp scion. Attributed to its low vigor, G.214 demonstrated the highest yield efficiency amongst the eight rootstocks (Table 1). Foliar nutrient application and more frequent irrigation may help to improve the nutrition and water status of such rootstock, in an effort to enhance fruit quality while sustaining high yield efficiency.
B.9 was the smallest rootstock in this study. As expected, it had the lowest TCSA and VCSA in rootstock, and it led to the lowest TCSA in scion. Its small rootstock vessel size (Figure 6B) could be the primary hydraulic cause for the stunted growth and low yield. Although its rootstock VCSA and scion VCSA were largely unproportioned (Figure 6D), B.9 was capable of maintaining the moderate water status (Figure 5A,E and Figure 7C) and yield efficiency (Table 1), which was probably attributed to its relatively small vessels in an exceptionally high density in scion xylem (Figure 6A–C). Such traits may also contribute to its enhanced cold hardiness, which awaits further study. Being a small dwarfing rootstock with a moderate cumulative yield efficiency, B.9 would be suitable to achieve high yield per acreage in very high planting density.

4.2. Influence of Rootstock–Scion Hydraulic Balance on Scion Vigor and Yield Efficiency

The water relations analysis suggested that scion VCSA influenced leaf gas exchange rates, gs, and water-use strategies. This was consistent with previous fruit tree studies that showed the correlation between lower scion hydraulic conductivity and stunted scion growth in apple and peach [10,15]. In this study, larger scion VCSA was associated with higher leaf gas exchanges; consequently, such scions would cause more water loss via leaf transpiration and meanwhile assimilate more carbohydrates, which could make less water but more carbohydrates available to fruits. The result is often observed as increased fruit dry matter weight, decreased fruit moisture content, and decreased Ψfruit. Higher water use is often associated with higher tree vigor and leads to higher cumulative yield, at a cost of lower WUEi. Therefore, the rootstocks with stronger vigor and larger scion VCSA, such as G.202, would be a good option if cumulative yield is prioritized while production is not limited by either water availability or planting density.
The VCSArootstock:VCSAscion ratio played a role in determining the final tree size and yield efficiency. This ratio was equaled to or slightly higher than 1 in M.9, G.214, and G.935 (Figure 6D), implying a balance between rootstock water supply and scion water demand. These three rootstocks demonstrated moderate scion vigor but the highest cumulative yield efficiency, which could suggest leveled biomass partitioning amongst roots, shoots, and fruits. As previously discussed, the lowest ratio was observed in B.9 (Figure 6D), suggesting a drastically unproportioned hydraulic relation between rootstock and scion. One of the dwarfing inducing quantitative locus dw1 [5] may contribute to the stunted scion; despite the absence of the second locus dw2 [5], B.9 rendered the most restricted scion growth in this study, which indicated that the hydraulic restriction by the rootstock itself played a significant role in stunting the tree. In contrast, in the four largest rootstocks, i.e., G.202, G.3001, M.26, and G.41, VCSArootstock: VCSAscion was lower than 1 but higher than 0.5. In summary, the range of this ratio appeared to be associated with scion vigor and yield efficiency. More combinations and replications are necessary to elucidate whether the ratio > 1 is consistently associated with high cumulative yield efficiency, and what specific ranges correspond to low scion vigor and yield, and high vigor and yield, respectively.

5. Conclusions

This study compared the Honeycrisp scion performance on eight rootstocks in a 10-year-old trial, and it investigated the impacts of rootstock vigor and xylem vessel characteristics on scion growth, water relations and yield efficiency. A novel method was introduced to sample xylem tissues from sap wood of living trees using an increment borer, and to visualize unstained transverse sections of secondary xylem by autofluorescence under confocal microscope. The main findings and their implications are summarized below:
(1)
The rootstocks with higher vigor demonstrated stronger annual fluctuations in yield. The least vigorous rootstocks showed significant fluctuations in crop load in 2017, 2018, and 2019, as well as more tree-to-tree variations in crop load each year. Therefore, in the most productive rootstocks and the least vigorous ones, managing crop load was particularly important for alleviating biennial bearing and sustaining fruit quality.
(2)
The size of the vessel cross-section in Honeycrisp scion was larger than that in each rootstock. Vessel density in scion was either higher than or close to that in rootstocks. This represented an imbalance between rootstock water supply and scion water demand. However, the size of vessel cross-section and the vessel density in semi-dwarfing rootstocks was not significantly different from dwarfing rootstocks of less vigor, which indicated that the intensity of the dwarfing effect was not solely determined by the vessel size and density. These findings were consistent with previous statements on the hydraulic restriction being one but not the only important mechanism for conferring dwarfing effects.
(3)
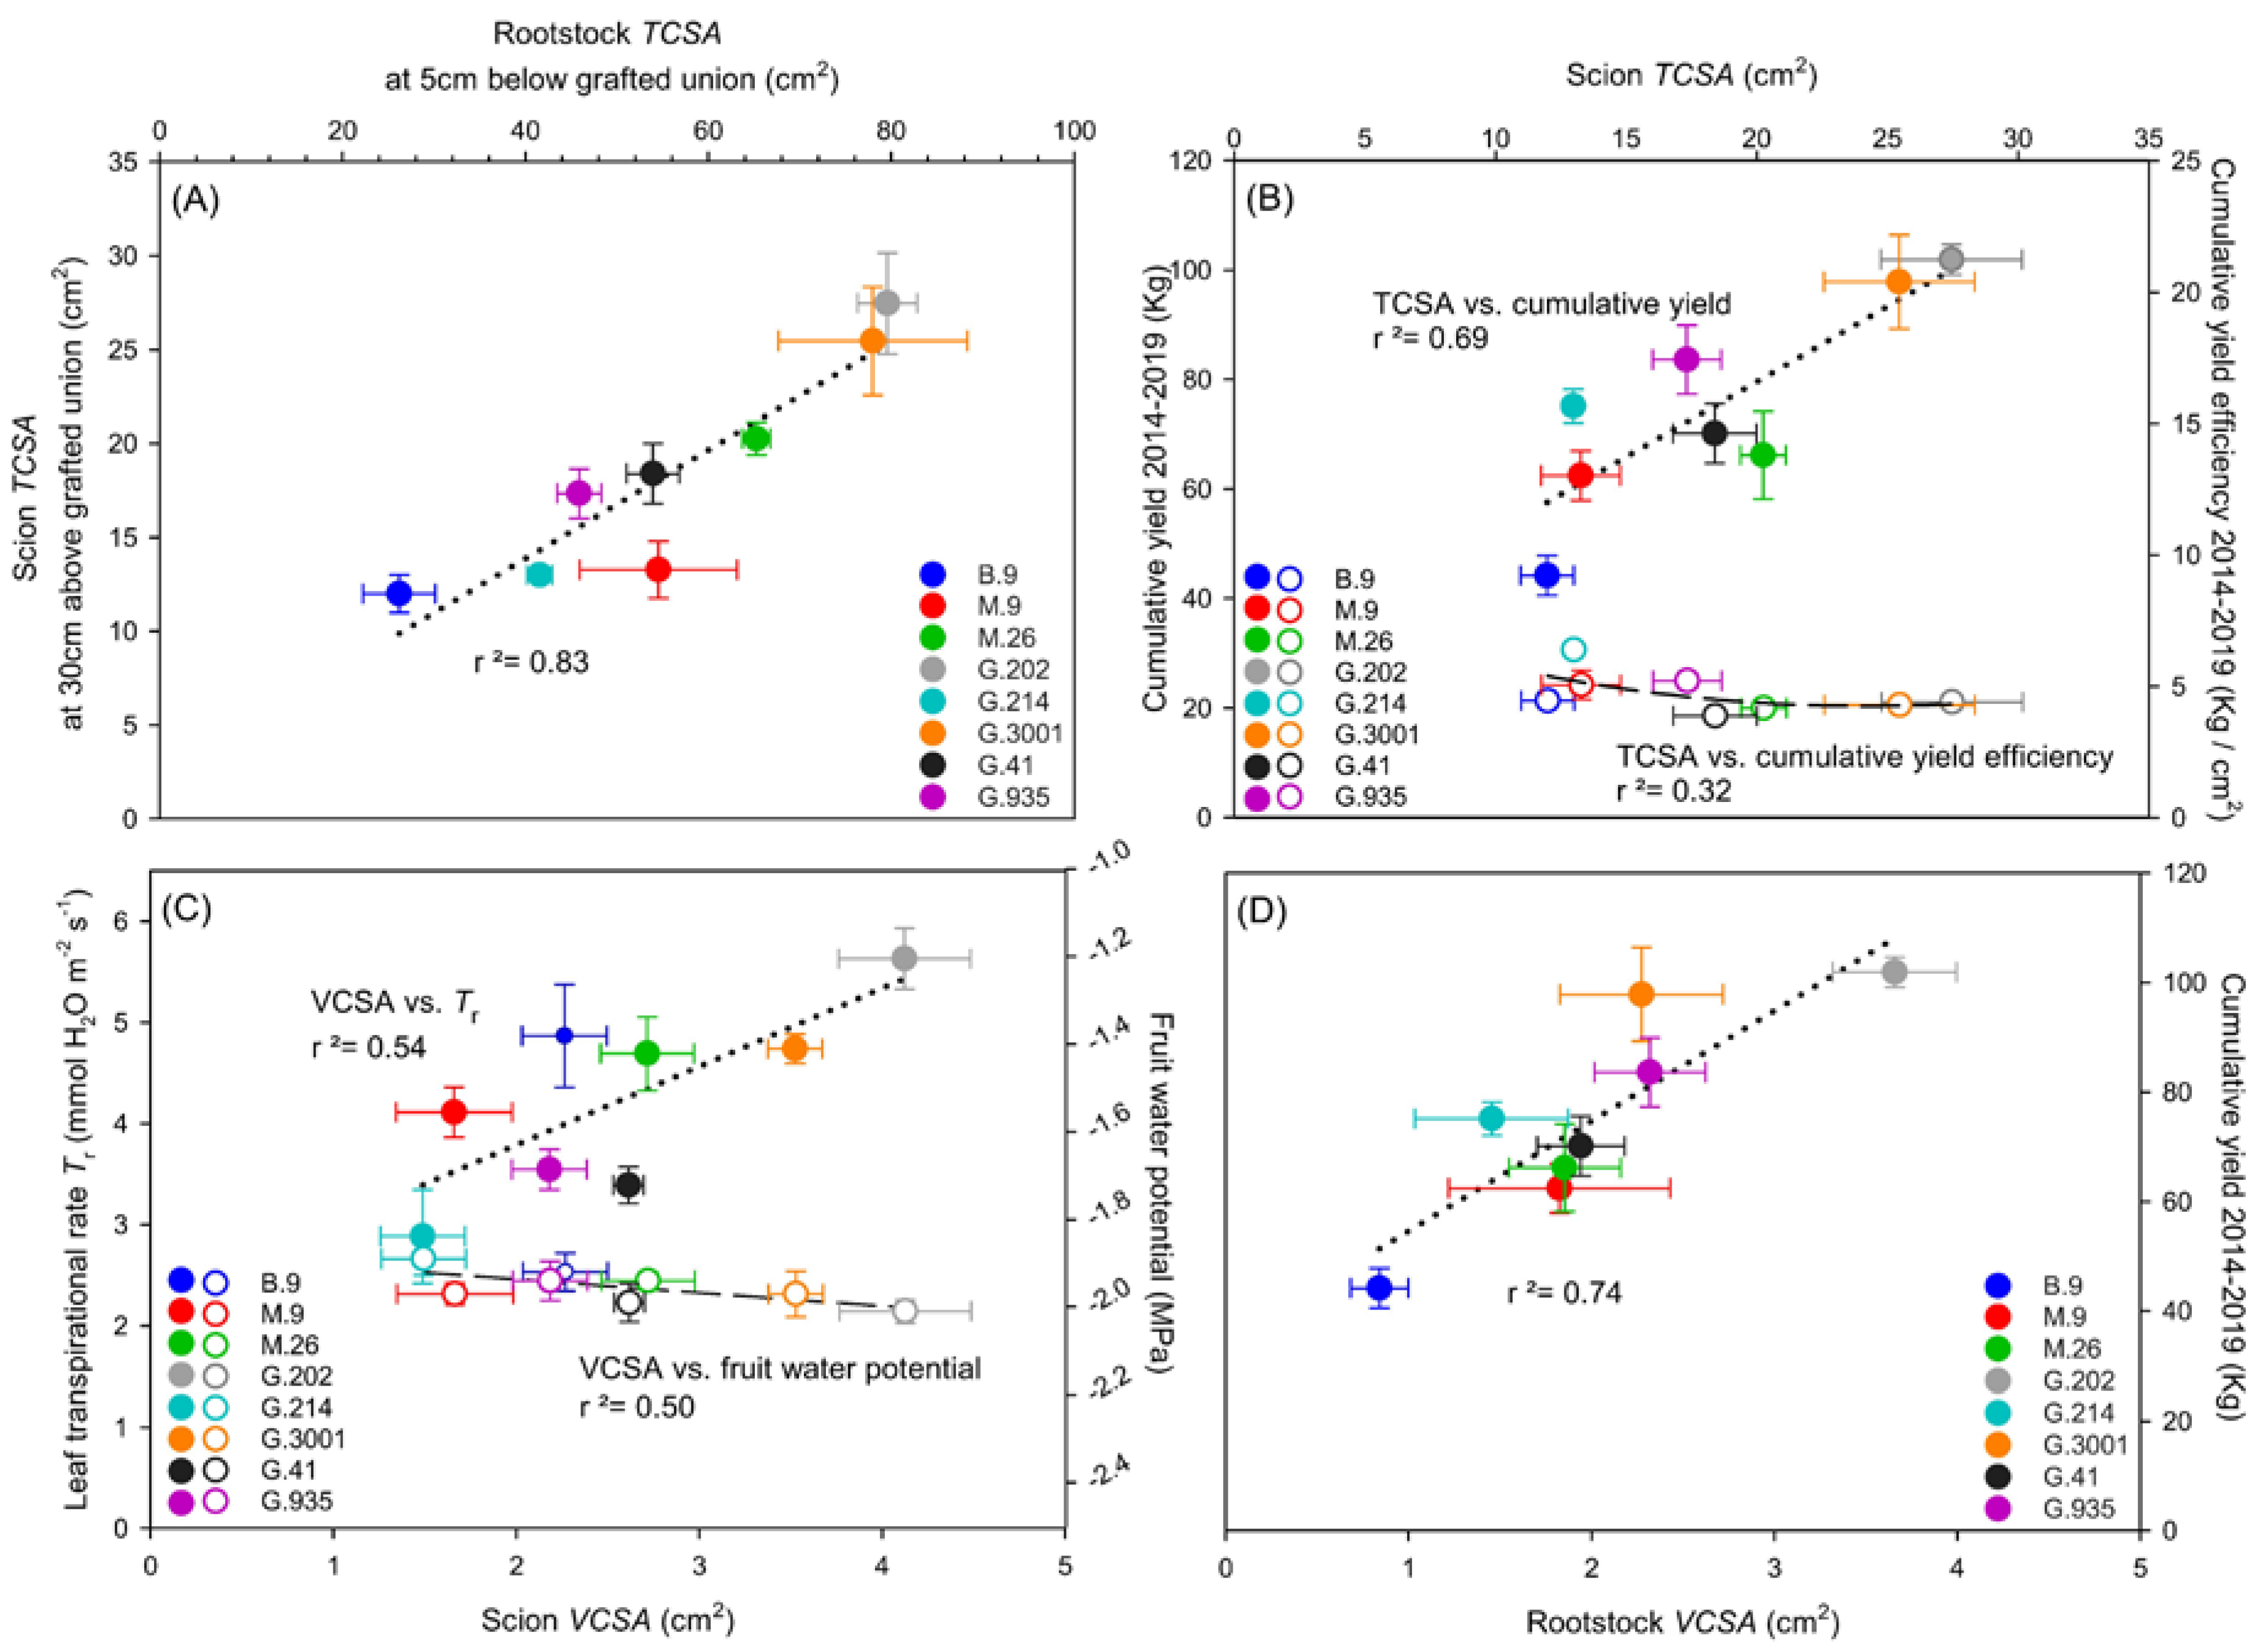
Scion vigor and cumulative yield were positively correlated with rootstock TCSA and VCSA, with G.202 being the highest and B.9 being the lowest. Vessel size and density in rootstock xylem could be important indicative traits for predicting yield and yield efficiency, as G.202 had higher vessel density, and G.935 with both high yield and high yield efficiency had larger vessel size in rootstock xylem.
(4)
Scion VCSA was dependent on the size and density of vessel elements in scion xylem, and scion TCSA. In turn, it could influence scion water and nutrient use.
  • Higher scion VCSA in G.202 was associated with higher production at a cost of higher water use and lower WUEi. In contrast, low water use in G.41 led to high WUEi but low yield efficiency.
  • In G.214, leaf chlorosis, low values in leaf gas exchange, leaf nutrients, and fruit dry matter weight, and the previously reported high number of root suckers, were associated with low vessel density and small VCSA of its scion. These disadvantages compromised its high yield efficiency. It suggests the necessity of taking multiple tradeoff traits into consideration while evaluating a rootstock with high yield efficiency.
  • B.9 produced the smallest scion TCSA with small xylem vessels in very high density; it demonstrated moderate tree–water status and earlier fruit maturation; such characteristics are worthy of further investigation in relation to its cold hardiness and resilience to water deficits.
(5)
In the three rootstocks with the highest cumulative yield efficiency and the moderate tree vigor, i.e., M.9, G.214, and G.935, the VCSArootstock/VCSAscion ratio was equal to or slightly higher than 1, suggesting the importance of this ratio in determining rootstock–scion hydraulic balance and vegetative-reproductive biomass partitioning, and consequently influencing tree size and cumulative yield efficiency.
(6)
G.935 was ranked in the top three in both yield and yield efficiency, and it demonstrated moderate water and nutrient status. These traits indicated its great potential as a substitute for standard dwarfing rootstocks in high-density planting of Honeycrisp.
The power of statistical significance presented in this paper was constrained by the inconsistent number of replications for each rootstock due to the lack of sufficient materials for G.202 and G.3001. In addition, the study was conducted at limited time points for transient water relations, in a limited number of xylem vessel samples, and on only one apple cultivar. The calculation of VCSA was upon the assumption that the characteristics of vessel elements and the TCSA were similar at different heights of the trunk, for the scion and the rootstock, respectively, which underestimated the variations within the tree. The study can be improved by xylem sampling with more refined spatial and temporal resolutions. The progression of xylem vessel development in rootstock and scion should be tracked in younger trees to test whether the hydraulic traits reported in this study are consistent at different tree ages.
More comprehensive xylem vessel characteristics, such as length, cell wall thickness, and shape of the perforation plate, are worthy of investigation in the context of root apoplastic and symplastic transport capacities, rootstock and scion hydraulic conductance, strength of grafted union, and stomatal characteristics. A comparative study on hydraulics of more rootstock–scion combinations, in conjunction of a better understanding of dwarfing-inducing quantitative loci, can facilitate early assessment on water use strategies, tree vigor, yield, and yield efficiency of different rootstocks.

Author Contributions

Research design and data analysis, H.X., D.E., A.S. and C.P.; conducted the physiological experiments, D.E. and H.X.; wrote the manuscript, H.X. contributed to the revision, H.X., D.E., A.S. and C.P. All authors have read and agreed to the published version of the manuscript.

Funding

This study was part of the research projects “Identifying the cause(s) of two emerging Fruit Tree Decline Diseases in Canada” (J-002199) and “Effect of rootstock genotype on the efficacy of clean technologies for combatting apple replant disease”, funded by Agriculture and Agri-Food Canada.

Institutional Review Board Statement

Not applicable.

Informed Consent Statement

Not applicable.

Data Availability Statement

Data are archived in H. Xu’s lab and available upon request.

Acknowledgments

The planting materials were coordinated through NC-140 Regional Rootstock Research Project “Improving economic and environmental sustainability in tree fruit production through changes in rootstock”. The authors are grateful to Cheryl Hampson, Darrell-Lee McKenzie and Melanda Danenhower of Tree Fruit Breeding Program, to Brian Fodey and Field Service, and to Kenna McKenzie, for managing the long-term trial and assisting with data collection, and, to Michael Weis for his generous guidance and tremendous help with the microscopy work.

Conflicts of Interest

The authors declare no conflict of interest.

References

  1. Autio, W.; Robinson, T.; Blatt, S.; Cochran, D.; Francescato, P.; Hoover, E.; Kushad, M.; Lang, G.; Lordan, J.; Miller, D.; et al. Pillnitz and Malling apple rootstocks affect ’Honeycrisp’ performance over eight years in the 2010 NC-140’Honeycrisp’ apple rootstock trial. J. Am. Pomol. Soc. 2020, 74, 182–195. [Google Scholar]
  2. Blum, A. Drought resistance, water-use efficiency, and yield potential—are they compatible, dissonant, or mutually exclusive? Aust. J. Agric. Res. 2005, 56, 1159–1168. [Google Scholar] [CrossRef]
  3. Harrison, N.; Harrison, R.J.; Barber-Perez, N.; Cascant-Lopez, E.; Cobo-Medina, M.; Lipska, M.; Conde-Ruíz, R.; Brain, P.; Gregory, P.J.; Fernández-Fernández, F. A new three-locus model for rootstock-induced dwarfing in apple revealed by genetic mapping of root bark percentage. J. Exp. Bot. 2016, 67, 1871–1881. [Google Scholar] [CrossRef] [Green Version]
  4. Fazio, G.; Lordan, J.; Francescatto, P.; Robinson, T.L. Breeding apple rootstocks to match cultural and nutrient requirements of scion varieties. FRUIT Q. 2018, 26, 25–30. [Google Scholar]
  5. Foster, T.M.; Celton, J.-M.; Chagné, D.; Tustin, D.S.; Gardiner, S.E. Two quantitative trait loci, dw1 and dw2, are primarily responsible for rootstock-induced dwarfing in apple. J. Hort. Res. 2015, 2, 15001. [Google Scholar] [CrossRef] [PubMed] [Green Version]
  6. Olien, W.; Lakso, A.N. Effect of rootstock on apple (Malus domestica) tree water relations. Physiol. Plant. 1986, 67, 421–430. [Google Scholar] [CrossRef]
  7. Atkinson, C.J.; Webster, A.D.; Vaughan, S.; Lucas, A.S. Effects of root restriction on the physiology of apple tree growth. Acta Hortic. 1997, 451, 587–598. [Google Scholar] [CrossRef]
  8. Robinson, T.; Fazio, G.; Hoying, S.; Miranda, M.; Iungerman, K. Geneva® rootstocks for weak growing scion cultivars like ‘Honeycrisp.’. N.Y. Fruit. Q. 2011, 19, 10–16. [Google Scholar]
  9. Jones, H.G. How do rootstocks control shoot water relations? New. Phytol. Found. 2012, 194, 301–303. [Google Scholar] [CrossRef]
  10. Tworkoski, T.; Fazio, G. Effects of size-controlling apple rootstocks on growth, abscisic acid, and hydraulic conductivity of scion of different vigor. Int. J. Fruit Sci. 2015, 15, 369–381. [Google Scholar] [CrossRef]
  11. Serra, S.; Leisso, R.; Giordani, L.; Kalcsits, L.; Musacchi, S. Crop load influences fruit quality, nutritional balance, and return bloom in ‘Honeycrisp’ apple. HortScience 2016, 51, 236–244. [Google Scholar] [CrossRef]
  12. Sperry, J.S.; Hacke, U.G.; Pittermann, J. Size and Function in conifer tracheids and angiosperm vessels. Am. J. Bot. 2006, 93, 1490–1500. [Google Scholar] [CrossRef] [Green Version]
  13. Bauerle, T.L.; Centinari, M.; Bauerle, W.L. Shifts in xylem vessel diameter and embolisms in grafted apple trees of differing rootstock growth potential in response to drought. Planta 2011, 234, 1045–1054. [Google Scholar] [CrossRef]
  14. Webster, A.D. Vigour mechanisms in dwarfing rootstocks for temperate fruit trees. Acta Hortic. 2004, 658, 29–41. [Google Scholar] [CrossRef]
  15. Tombesi, S.; Johnson, R.S.; Day, K.R.; DeJong, T.M. Interactions between rootstock, inter-stem and scion xylem vessel characteristics of peach trees growing on rootstocks with contrasting size-controlling characteristics. AoB Plants 2010, 2010, plq013. [Google Scholar] [CrossRef]
  16. Parry, C.; Blonquist Jr, J.M.; Bugbee, B. In situ measurement of leaf chlorophyll concentration: Analysis of the optical/absolute relationship. Plant Cell Environ. 2014, 37, 2508–2520. [Google Scholar] [CrossRef]
  17. DeLong, J.; Prange, R.; Harrison, P.; Nichols, D.; Wright, H. Determination of optimal harvest boundaries for Honeycrisp™ fruit using a new chlorophyll meter. Can. J. Plant Sci. 2014, 94, 361–369. [Google Scholar] [CrossRef]
  18. Xu, H.; Ediger, D. Rootstocks with different vigor influenced scion–water relations and stress responses in AmbrosiaTM apple trees (Malus domestica var. Ambrosia). Plants 2021, 10, 614. [Google Scholar] [CrossRef]
  19. Medrano, H.; Tomás, M.; Martorell, S.; Flexas, J.; Hernández, E.; Rosselló, J.; Pou, A.; Escalona, J.-M.; Bota, J. From leaf to whole-plant water use efficiency (WUE) in complex canopies: Limitations of leaf WUE as a selection target. Crop J. 2015, 3, 220–228. [Google Scholar] [CrossRef] [Green Version]
  20. Scholander, P.F.; Bradstreet, E.D.; Hemmingsen, E.A.; Hammel, H.T. Sap pressure in vascular plants: Negative hydrostatic pressure can be measured in plants. Science 1965, 148, 339–346. [Google Scholar] [CrossRef]
  21. Schneider, C.A.; Rasband, W.S.; Eliceiri, K.W. NIH Image to ImageJ: 25 years of image analysis. Nat Meth. 2012, 9, 671–675. [Google Scholar] [CrossRef]
  22. Ding, N.; Chen, Q.; Zhu, Z.; Peng, L.; Ge, S.; Jiang, Y. Effects of crop load on distribution and utilization of 13C and 15N and fruit quality for dwarf apple trees. Sci. Rep. 2017, 7, 1–9. [Google Scholar] [CrossRef] [PubMed] [Green Version]
  23. Ryan, M.G.; Oren, R.; Waring, R.H. Fruiting and sink competition. Tree Physiol. 2018, 38, 1261–1266. [Google Scholar] [CrossRef] [PubMed]
  24. Lenz, F. Fruit effects on the dry matter-and carbohydrate distribution in apple trees. Acta Hortic. 2009, 835, 21–38. [Google Scholar] [CrossRef]
  25. Forshey, C.G.; Elfving, D.C. The relationship between vegetative growth and fruiting in apple trees. Hort. Rev. 1989, 11, 229–287. [Google Scholar]
  26. Adams, S.W. The Effects of Rootstock, Scion, Grafting Method and Plant Growth Regulators on Flexural Strength and Hydraulic Resistance of Apple. Master′s Thesis, Utah State University, Logan, UT, USA, 2016. [Google Scholar]
Figure 1. Xylem sample preparation and vessel element analysis. (A,B) Secondary xylem sample was collected from a living tree using an increment borer; (C,D) Transverse section of xylem sample was prepared in the laboratory and under a stereo microscope; (E) Autofluorescence of the section was visualized through a confocal microscope; and, (F,G) The acquired image was analyzed in ImageJ for the calculation of size, density, and the percentage of total cross-section area of vessel elements.
Horticulturae 07 00099 g001
Figure 2. Annual variations in (A) yield and (B) crop load of Honeycrisp apple on eight rootstocks, from 2014 to 2019. For each rootstock, different letters indicate significant difference amongst the years (p ≤ 0.05, ANOVA, Tukey–Kramer Pairwise Comparisons; n = 6 for M.26, n = 5 for G.202, n = 3 for G.3001, and n = 9 for other rootstocks).
Horticulturae 07 00099 g002
Figure 3. Correlations between trunk cross-section area and fruit weight (A), and between crop load and fruit dry matter weight (B), of Honeycrisp apples across rootstocks in 2018, 2019, and 2020. Each dot stands for the mean of three trees of a rootstock. Regression analysis was conducted to compute the coefficient of determination r2 for the pair of parameters in every year (linear model).
Horticulturae 07 00099 g003
Figure 4. Fruit dry matter content percent DM% (A), fruit dry matter weight (B), absorbance difference index IAD of fruit skin (C), and, the DM%—IAD relation (D) of Honeycrisp apples on eight rootstocks in 2019. In (AC), different letters indicate significant difference amongst the rootstocks (p ≤ 0.05, ANOVA, Tukey–Kramer Pairwise Comparisons; n = 30; G.202: 6 apples per tree, n = 5; G.3001: 10 apples per tree, n = 3; other rootstocks: 5 apples per tree, n = 6). In (D), the blue dash line stands for linear regression between DM% and IAD of 240 fruits from eight rootstocks.
Horticulturae 07 00099 g004
Figure 5. Tree–water relations of Honeycrisp apple on eight rootstocks. (A) Midday stem water potential Ψstem, (B) stomatal conductance gs, and (C) instantaneous water-use efficiency WUEi were measured 46–52 h after irrigation in August 2019; and (D) fruit moisture content (weight ratio) and (E) fruit total water potential Ψfruit were assessed at harvest in mid-September 2019. Different letters in each sub-panel stand for significant difference amongst rootstocks (p ≤ 0.05, ANOVA, Tukey–Kramer Pairwise Comparisons; (AC): n = 6; (D): n = 30; (E): n = 15).
Horticulturae 07 00099 g005
Figure 6. Characteristics of xylem vessel elements in 10-year-old Honeycrisp trees in the combination with eight rootstocks. (A) Cross-section of xylem vessel elements in rootstocks and scions, with autofluorescence visualized under 100× magnification of a confocal microscope; (B) Average size of cross-section of individual xylem vessel elements in scions and rootstocks; (C) Xylem vessel density in scions and rootstocks; and, (D) Rootstock: scion ratio in total xylem vessel cross-section area (VCSArootstock: VCSAscion). Different letters stand for significant difference between rootstocks, whereas ns indicates no significant difference between the rootstock and its scion (p ≤ 0.05, ANOVA; Tukey–Kramer Pairwise Comparisons for (A) and (B), and Fisher LSD Pairwise Comparisons for (C); n = 3 trees, approximately 500 vessels of each type were analyzed for each rootstock–scion combination).
Horticulturae 07 00099 g006
Figure 7. Vigor and xylem vessel cross-section area (VCSA) of rootstock and scion in relation to water status and yield efficiency of Honeycrisp scion on eight rootstocks. (A) Relation between rootstock trunk cross-section area (TCSA) and scion TCSA; (B) Scion TCSA in relation to cumulative yield and cumulative yield efficiency; (C) Scion VCSA in relation to leaf transpirational rate Tr and fruit water potential Ψfruit; (D) Relation between rootstock VCSA and cumulative yield. Data are shown as mean ± standard error. Regression analysis was conducted to compute the coefficient of determination r2 for each pair of parameters (scion TCSA vs. cumulative yield efficiency: polynomial model; other relations: linear model).
Horticulturae 07 00099 g007
Figure 8. Correlations amongst yield, fruit counts per tree, trunk cross-section area (TCSA), tree height, and canopy spread of Honeycrisp on eight rootstocks in the fall of 2017. Linear regression is shown as the red line; the shadowed area indicates 95% confidence; regression graphs and values of correlation coefficient r are shown for each pair of parameters where they cross.
Horticulturae 07 00099 g008
Table 1. Leaf mineral nutrient levels, chlorophyll content, fruit weight, and mineral nutrient levels, trunk increment, and yield efficiency of Honeycrisp scions on eight rootstocks.
Rootstocks
B.9M.9M.26G.202G.214G.3001G.41G.935
Leaves 2019N %1.51 ± 0.03 bc1.55 ± 0.17 b1.45 ± 0.02 c1.62 ± 0.12 b1.40 ± 0.02 c1.82 ± 0.02 a1.55 ± 0.05 b1.43 ± 0.02 c
P %0.110.110.10 ± 0.010.120.100.100.110.11
K %1.1 ab1.2 ± 0.1 ab1.1 ± 0.1 ab1.2 ± 0.1 a1.2 ± 0.1 a0.9 b1.2 ± 0.1 a1.1 ± 0.1 ab
Mg %0.17 ab0.17 ± 0.01 ab0.16 ab0.18 ± 0.01 ab0.14 ± 0.01 b0.24 ± 0.01 a0.17 ab0.15 ± 0.01 ab
Ca %0.77 ± 0.03 bc0.89 ± 0.0 6ab0.67 c0.92 ± 0.11 ab0.79 ± 0.05 b1.09 ± 0.02 a0.76 ± 0.04 bc0.79 ± 0.10 b
B ppm24.4 ± 0.9 b25.1 ± 1.3 b26.1 ± 0.3 b27.8 ± 2.1 b26.6 ± 0.1 b21.9 ± 0.4 c34.6 ± 1.6 a27.8 ± 1.5 b
Zn ppm17.5 ± 6.79.010.0 ± 0.79.0 ± 1.48.0 ± 0.77.09.08.5 ± 0.4
Mn ppm17.0 ± 0.7 a15.5 ± 3.2 ab18.5 ± 1.8 a12.0 ± 1.4 b7.5 ± 0.4 c14.5 ± 0.4 ab8.0 c7 ± 0.7 c
Fe ppm70.5 ± 22.3 a27.5 ± 1.8 b34 ± 4.9 b67.5 ± 26.5 a20 ± 8.5 b30 ± 1.4 b26 ± 4.2 b17.5 ± 2.5 b
Chlorophyll µmol cm−2371.8 ± 14.0 ab368.1 ± 16.8 ab371.7 ± 18.1 ab403.9 ± 14.2 a304.4 ± 20.1 b385.4 ± 30.0 ab328.3 ± 24.7 ab349.9 ± 16.0 ab
Fruits 2019N %0.410.470.360.440.43 ± 0.010.50 ± 0.040.430.50 ± 0.02
P %0.050.050.050.050.040.06 ± 0.010.060.075
K %0.710.680.720.740.72 ± 0.020.77 ± 0.090.80.85 ± 0.02
Mg %0.040.050.040.050.050.0550.040.05
Ca %0.060.070.060.070.070.08 ± 0.010.070.065
B ppm15.7217.0720.2121.4722.15 ± 0.6918.35 ± 1.8025.3628.09 ± 2.09
Zn ppm21211.50 ± 0.351.50 ± 0.3521
Fruit weight g259.9 ± 9.2 b274.0 ± 7.2 ab282.8 ± 9.9 ab305.5 ± 9.9 a235.5 ± 11.2 c282.0 ± 10.6 ab259.6 ± 6.3 b286.2 ± 7.9 ab
TreeCumulative yield 2014–2019 Kg44.21 ± 3.63 e62.47 ± 4.52 d66.17 ± 7.99 cd101.89 ± 2.76 a75.15 ± 3.08 bc97.86 ± 8.56 a70.14 ± 5.45 c83.63 ± 6.28 b
Yield efficiency 2014–2019 Kg cm−2 TCSA4.46 ± 0.16 bc5.06 ± 0.55 b4.18 ± 0.19 c4.41 ± 0.27 c6.39 ± 0.22 a4.29 ± 0.28 c3.88 ± 0.16 c5.21 ± 0.28 b
TCSA 2019 cm29.9 ± 0.9 d12.4 ± 1.0 c15.9 ± 1.2 b23.1 ± 1.3 a11.8 ± 0.5 cd22.8 ± 2.3 a18.1 ± 0.9 ab16.1 ± 0.9 b
Note: Data are shown as mean ± standard error. Different letters in the same row stand for significant difference amongst rootstocks (p ≤ 0.05, ANOVA, Tukey–Kramer Pairwise Comparisons) (Mineral nutrient analysis: n = 3; chlorophyll measurement: n = 6; yield and trunk cross-section: n = 9, except n = 6 for M.26, n = 5 for G.202 and n = 3 for G.3001).
Publisher’s Note: MDPI stays neutral with regard to jurisdictional claims in published maps and institutional affiliations.

