
Use of Thermal Imaging to Assess Water Status in Citrus Plants in Greenhouses


1
Federal Institute of Espírito Santo, Campus Santa Teresa, Rod. ES 080 km 93, São João de Petrópolis, Santa Teresa 29600-000, ES, Brazil
2
Indian River Research and Education Center, University of Florida, 2199 S Rock Road, Fort Pierce, FL 34945, USA
3
Department of Horticulture, University of Georgia, 1111 Plant Sciences Bldg, Athens, GA 30602, USA
*
Author to whom correspondence should be addressed.
Horticulturae 2021, 7(8), 249; https://0-doi-org.brum.beds.ac.uk/10.3390/horticulturae7080249
Submission received: 16 June 2021
/
Revised: 12 August 2021
/
Accepted: 13 August 2021
/
Published: 16 August 2021
(This article belongs to the Special Issue Irrigation and Water Management in Horticulture)
Abstract
:The direct examination of plant canopy temperature can assist in optimizing citrus irrigation management in greenhouses. This study aimed to develop a method to measure canopy temperature using thermal imaging in one-year-old citrus plants in a greenhouse to identify plants with water stress and verify its potential to be used as a tool to assess citrus water status. The experiment was conducted for 48 days (27 November 2019 to 13 January 2020). We evaluated the influence of five levels of irrigation on two citrus species (‘Red Ruby’ grapefruit (Citrus paradisi) and ‘Valencia’ sweet orange (Citrus sinensis (L.) Osbeck)). Images were taken using a portable thermal camera and analyzed using open-source software. We determined canopy temperature, leaf photosynthesis and transpiration, and plant biomass. The results indicated a positive relationship between the amount of water applied and the temperature response of plants exposed to different water levels. Grapefruit and sweet orange plants that received less water and were submitted to water restrictions showed higher canopy temperatures than the air (up to 6 °C). The thermal images easily identified water-stressed plants. Our proof-of-concept study allowed quickly obtaining the canopy temperature using readily available equipment and can be used as a tool to assess citrus water status in one-year-old citrus plants in greenhouses and perhaps in commercial operations with mature trees in the field after specific experimentation. This technique, coupled with an automated system, can be used for irrigation scheduling. Thus, setting up a limit temperature is necessary to start the irrigation system and set the irrigation time based on the soil water content. To use this process on a large scale, it is necessary to apply an automation routine to process the thermal images in real time and remove the weeds from the background to determine the canopy temperature.
1. Introduction
Irrigators usually use weather-, plant-, and soil-based irrigation management methods. However, the direct examination of some plant physiological factors is paramount for optimizing irrigation rather than focusing on soil or weather factors [1]. Stomatal conductance and stem water potential are standard parameters to monitor the plant water status relative to the soil water content, although these measurements are time consuming and cannot be automated [2,3]. Therefore, a reliable indicator for detecting water stress related to plant transpiration is needed. The water availability in the soil can be easily correlated to canopy temperature using infrared thermometry as a proxy for plant water status, as the canopy represents the aboveground portion of a plant [4,5]. The technique creates a thermal index that allows assessing the water availability in the canopy and determining the amount of water needed by irrigation. Under water stress, plants tend to present a higher leaf temperature when compared to those under adequate water availability [6]. One of the first studies in the field developed the concept of stress degree-days, based on the relationship between canopy and air temperature with yield and the need to water the crop [7]. Studies showed that the temperature difference between sugarcane leaves and the air is closely associated with the transpiration process [8]. As transpiration increases, there is a reduction in leaf temperature due to the dissipation of energy in the form of latent heat. Thus, the leaf temperature becomes lower than the air temperature when plants are well-watered.
The canopy temperature usually increases with a decrease in soil moisture [6,9,10]. The use of well-watered control plants as a reference to assess the plant water status was proposed by Fuchs et al. [11], as the temperature difference between plants under different soil water availability and control plants can be used to establish a stress index. Lobo et al. [12] studied the performance of irrigated common beans subjected to five levels of water stress and determined the time to irrigate the crop when the temperature difference between control plants and treatments reached values ranging from 1 to 5 °C, with measurements taken with infrared thermometers. Researchers concluded the best time to irrigate the crop was when temperatures were 3–4 °C higher than the control (well-watered plants).
Water stress is a serious concern in citrus plants due to its effects on plant growth [13]. With early detection of water stress, effective control measures and management decisions can be implemented to reduce its known adverse effects in plants. Ideally, water stress should be detected before the appearance of visible symptoms in the plant. Currently available techniques are not sufficiently sensitive to detect water stress at early stages [14]. A sensor for early detection will allow rapid control measures and management decisions to reduce any environmental effects.
Currently, digital cameras that measure the whole canopy temperature are more precise than using infrared thermometers. Several studies about irrigation management have used thermal cameras to monitor canopy temperature, identify water stress, and estimate stomatal conductance. Knowing that leaf temperature is a physiological trait that can monitor the plant water status, Jimenez-Bello et al. [15] developed a methodology to automate the analysis of frontal images obtained by a thermal camera in the Mediterranean climate. The methodology facilitated the use of thermal cameras for the detection of crop water stress, obtaining valuable information for irrigation management of ‘Lane Late’ navel orange (Citrus sinensis (L.) Osbeck), ‘Clementina de Nules’ (Citrus clementina, Hort ex Tan), and persimmon (Diospyros kaki (L.) f.). It is vital to automate the data retrieval process at a commercial scale to actuate on irrigation controllers. Experiments to investigate the use of thermal images for maize phenotyping in Mexico were performed to compare irrigated versus water-deficient plants [16]. The authors highlighted that thermal imaging could be applied to screen maize varieties tolerant to water stress and allows the creation of a new phenotyping platform to accelerate selecting candidates in breeding programs. The potential to combine thermal images with simulation models to assess water stress effects on potato crops was evaluated in Tunisia [17]. The treated thermal images can be considered a powerful tool for irrigation scheduling. Several authors [18,19,20,21,22,23] evaluated thermal images as an indicator of water stress in different crops in different parts of the world, such as Spain, China, and the USA. Other studies included thermal imaging for the detection of citrus fruit on trees [24,25].
The angle of view and the spatial resolution of thermal images with different water statuses were mapped by [26] to represent leaf water potential, as thermography in estimating water status in vines depends on the variety and its stomatal control [27]. Machine learning algorithms can support thermal imaging using fast, reliable estimation of a vineyard water status, suppressing the necessity of supervised acquisition of reference temperatures [28]. The thermal images acquired were valuable tools for water and irrigation management in precision agriculture. On the other hand, images obtained by aerial flights can cover a large area, depending on the camera field of view and the flight altitude. However, these images need to be calibrated, georeferenced, and are subjected to atmospheric corrections. When hand-operated cameras are used for the same purpose, the process is more precise because the images can be taken from an individual or small groups of plants, even in different parts of the trees (shaded or sunlit), achieving high spatial resolution. The images also do not need to be georeferenced ([15]).
We hypothesize that it is possible to assess the water status of young citrus plants by measuring individual canopy temperature with hand-operated thermal cameras as a tool for irrigation scheduling. The objectives of this study are to (1) develop a method to measure canopy temperature using thermal imaging in one-year-old citrus plants in the greenhouse, (2) establish a correlation between temperature and physiological response of plants exposed to different water levels, and (3) test the method using an independent data set to identify plants with water stress and verify its potential to be used as a tool to assess citrus water status.
2. Materials and Methods
2.1. Location and Plant Material
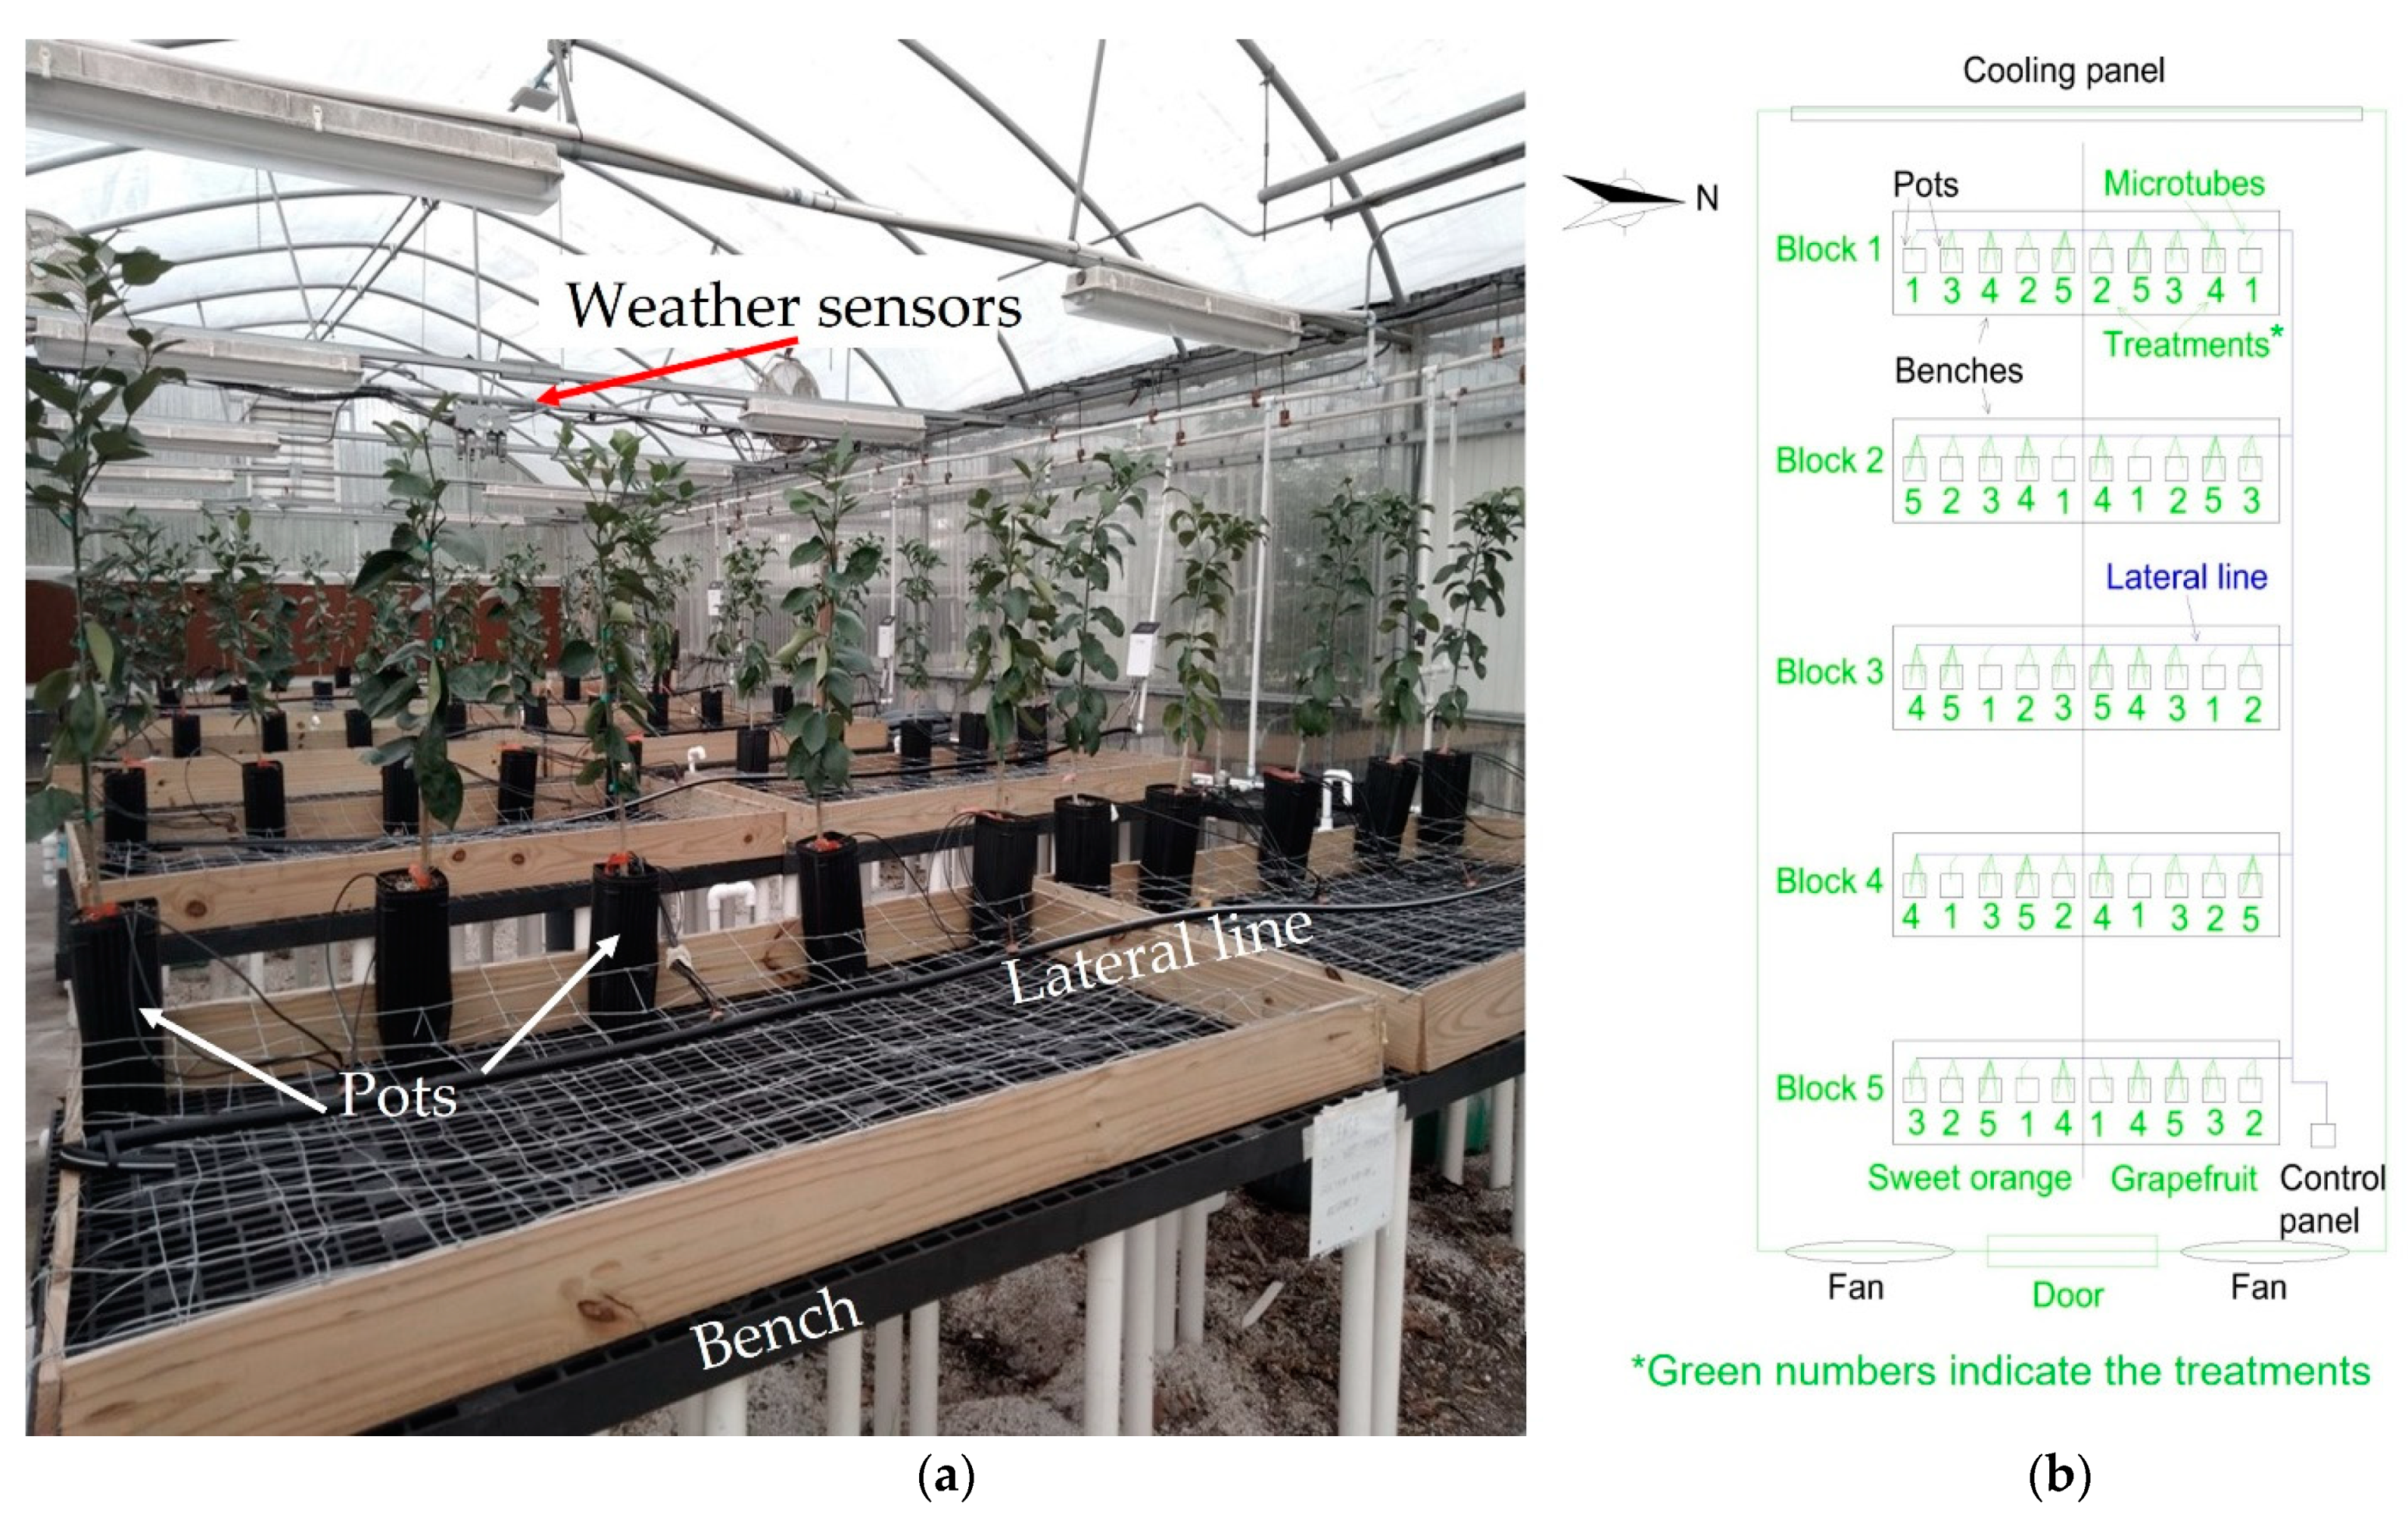
The experiment was conducted for 48 days (27 November 2019, to 13 January 2020) at the University of Florida’s Indian River Research and Education Center in Fort Pierce, USA (27°25′35″ N and 80°24′31″ W). We installed the experiment inside a greenhouse with an insulated double-layer plastic cover (no shading cloth) and a forced ventilation system using a cooling panel and two fans (Figure 1a).
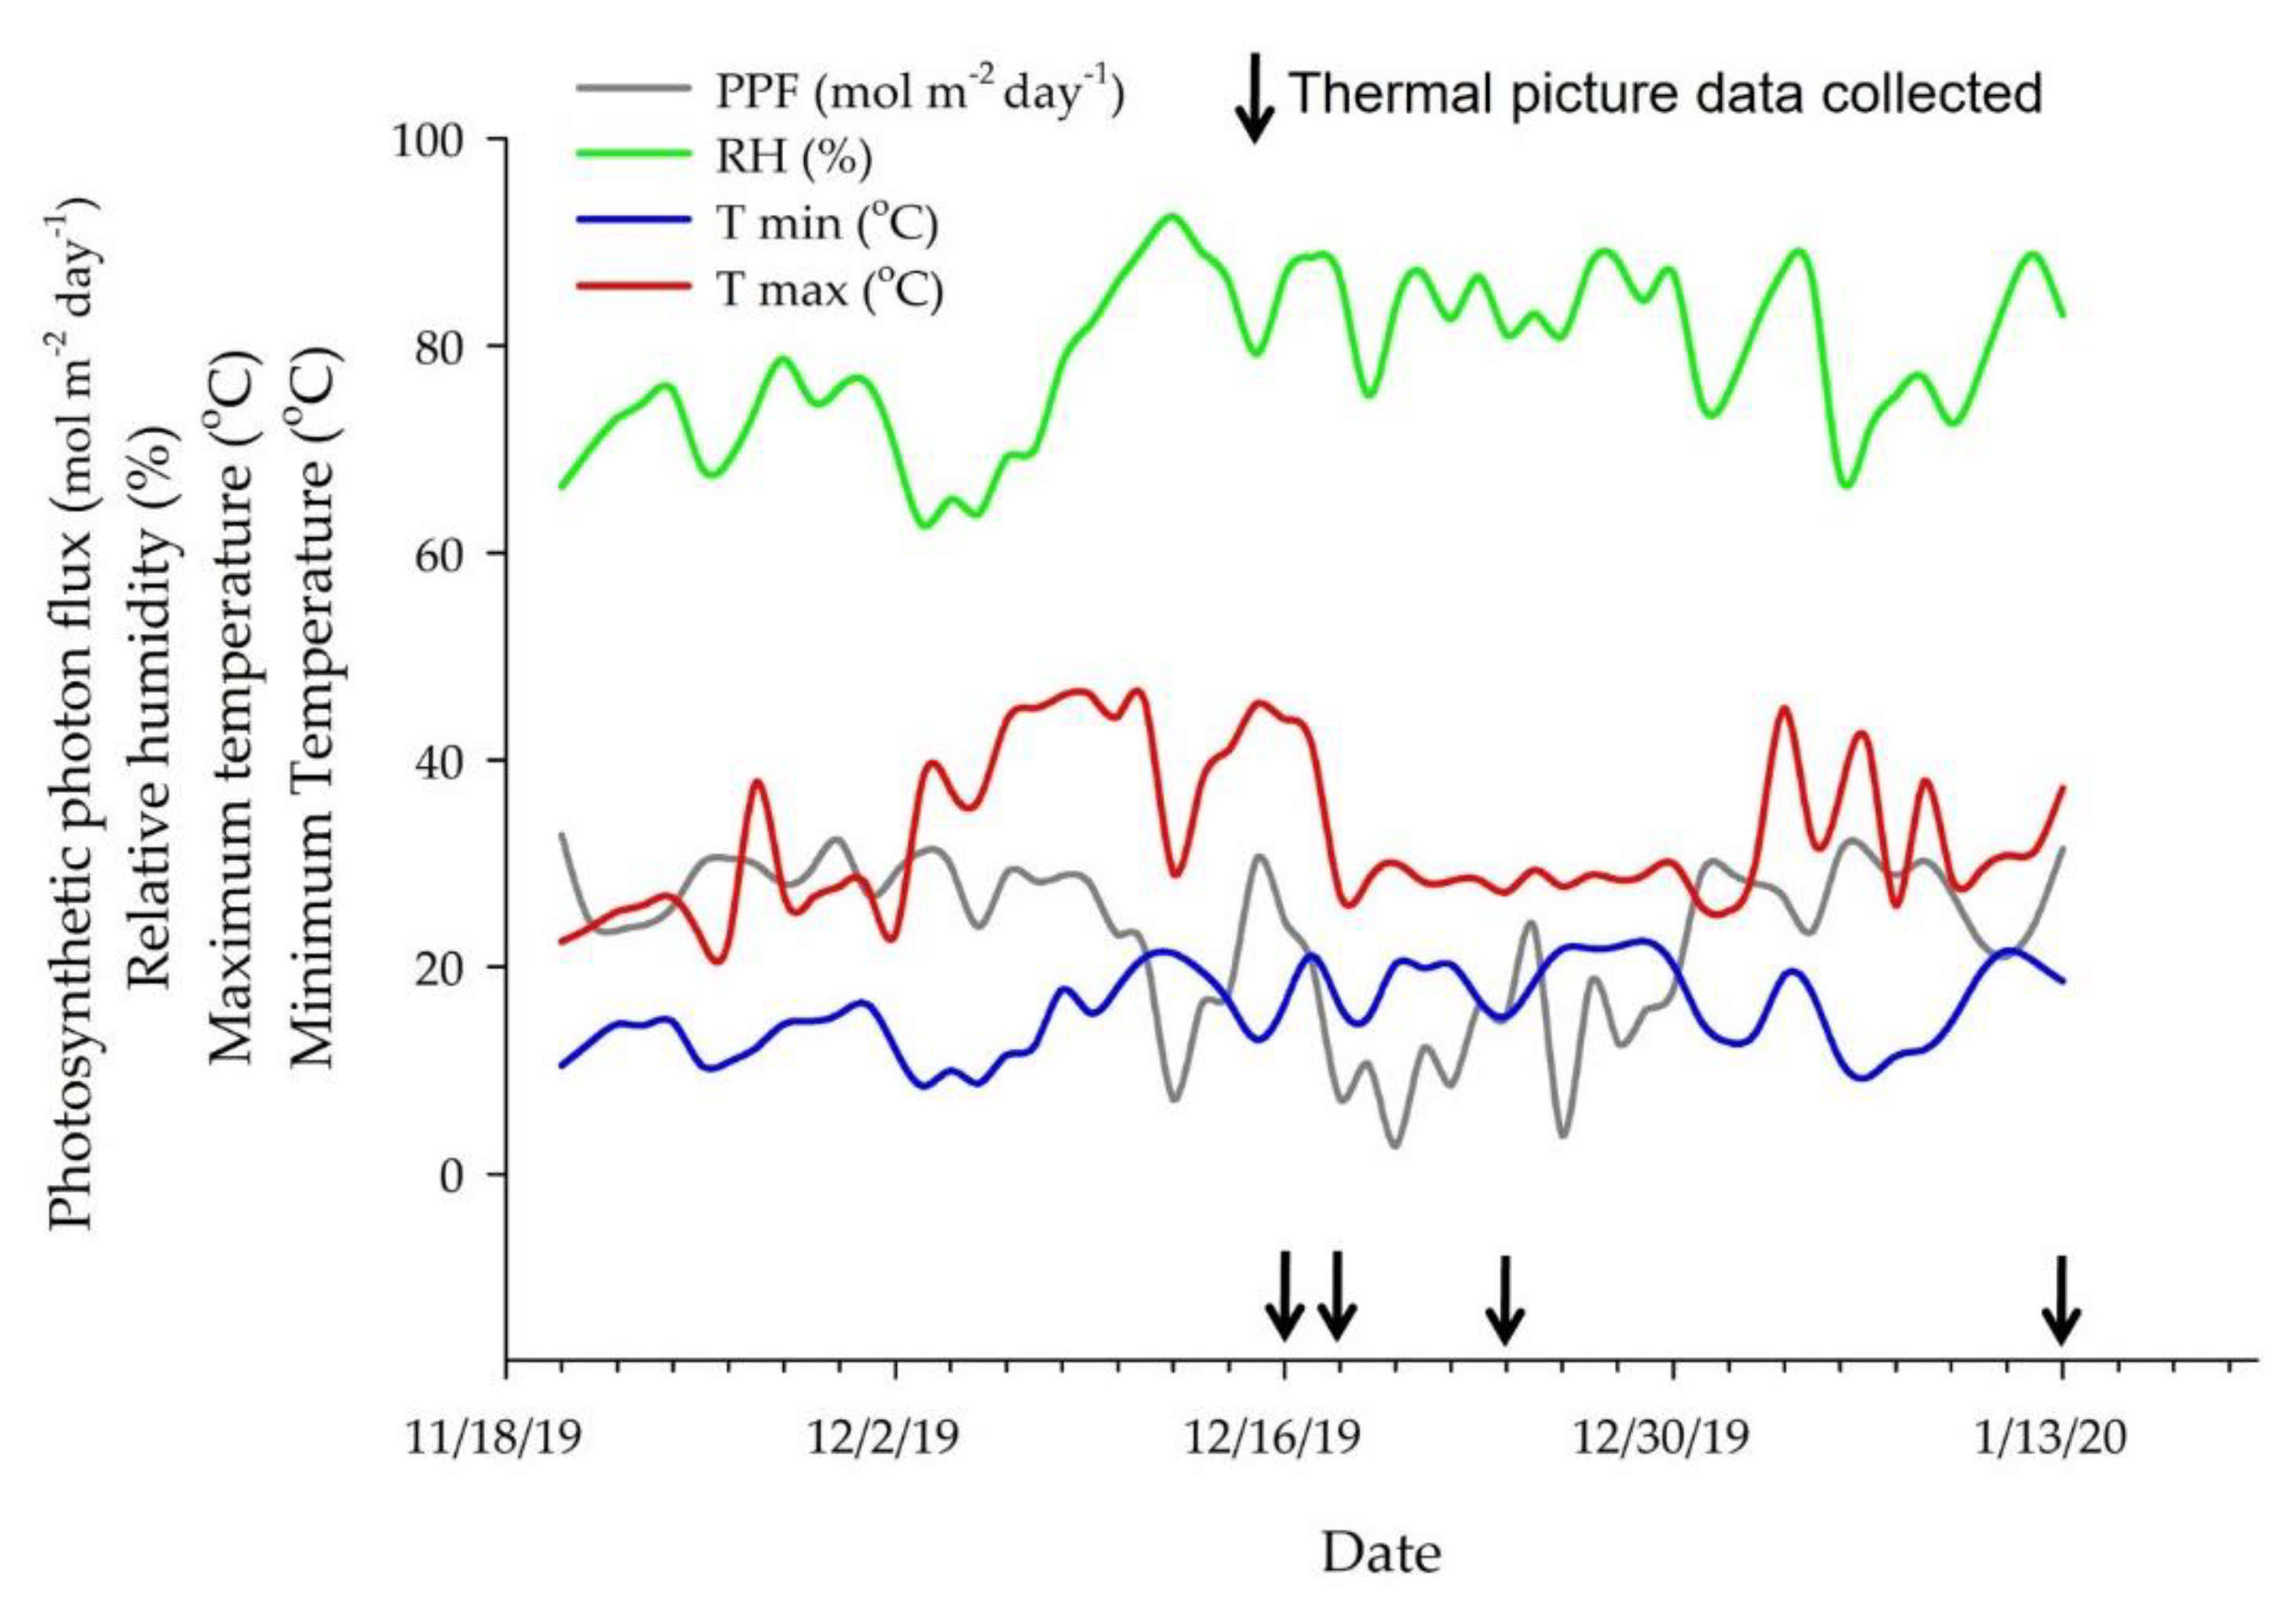
Environmental conditions were monitored inside the greenhouse during the experiment using sensors to measure air temperature and relative humidity (HMP 60; Vaisala, Helsinki, Finland) and photosynthetic photon flux density (#3886i; Spectrum Technologies, Aurora, IL, USA) (Figure 2). These sensors were connected to a datalogger (CR1000 Series, Campbell Scientific, Logan, UT, USA), and the measurements were taken every 15 min. A separate datalogger with a temperature sensor (UX100-023A; Onset Hobo, Bourne, MA, USA) was installed to collect data every minute during the plants’ temperature measurements. All sensors were installed above the plants.
We used ‘Ruby Red’ grapefruit (Citrus paradisi) plants grafted on US-942 rootstock (Citrus reticulata × Poncirus trifoliata) budded on 4 April 2019 and ‘Valencia’ sweet orange (Citrus sinensis (L.) Osbeck) plants grafted on Sour Orange (Citrus aurantium) rootstock budded on 02/27/2019. The one-year-old plants were purchased from a commercial nursery (Brite Leaf, Lake Panasoffkee, FL, USA) on 10.15 × 10.15 × 30 cm (W × D × H) pots.
Before starting treatment applications, plants were transplanted into larger pots (12.7 × 12.7 × 28 cm) using a commercial substrate with Canadian sphagnum peat moss, perlite, and vermiculite with a density of 0.16 g cm−3 (Fafard Citrus Mix RSI; Sungro Horticulture, Agawam, MA, USA). We performed laboratory tests to determine the physical media properties by the gravimetric method [29] and obtained the total water retention of the substrate at the field capacity (0.41 cm3 cm−3), permanent wilting point (0.082 cm3 cm−3), and maximum allowable water depletion (0.287 cm3 cm−3).
Plants were grown on 5 m long × 1.22 m width benches. Wireframes were placed on the benches to keep the plants upright (Figure 3a).
2.2. Irrigation and Treatments
We installed a drip irrigation system to water the plants using a 5 m long and 16 mm diameter poly hose line per bench, adding a total of six drip emitters (PC-LCNL; Netafim, Hatzerim, Israel) in each lateral line (Figure 1b). According to the manufacturer catalog, the emitters had a nominal flow rate of 8.5 L h−1 at a pressure of 100 kPa. We connected five microtubes and an arrow dripper (Netafim, Hatzerim, Israel) to each emitter at the end with a nominal discharge of 2.3 L h−1. The actual discharge was measured, and the average values for each treatment are shown in Table 1.
We evaluated the influence of five water levels (25%, 50%, 75%, 100%, and 125%) based on the ETc replacement in two citrus species (‘Ruby Red’ grapefruit and ‘Valencia’ sweet orange). To determine the irrigation requirements for the treatment 100%, we estimated the water loss from pots by calculating the difference of soil moisture between the day before and the day of the measurement. We irrigated the pots when the soil moisture was close to the maximum allowable water depletion, keeping the soil moisture between the field capacity and maximum allowable depletion. We installed a different number of arrow drippers per pot in each treatment to apply the different irrigation depths to the treatments described in Table 1. For example, we installed one stake for the treatment that applied 25% ETc and added extra drip emitters according to the increasing ETc treatments. The treatments started on 27 November 2019.
2.3. Soil Moisture
We estimated the evapotranspiration by calculating the difference in soil moisture on the day before and when measurements were taken. We used soil moisture sensors (Theros 12; Meter Group, Pullman, WA, USA) connected to dataloggers (ZL6; Meter Group, Pullman, WA, USA) scheduled to take measurements every 15 min. The soil moisture was measured continuously, in three replications per treatment, using sensors installed at 12 cm from the pot surface using the potting mix standard calibration in the dataloggers, as indicated in Equation (1).
where is the volumetric soil moisture (cm3 cm−3), and RAW is the raw sensor output.
2.4. Measurements
2.4.1. Thermal Imaging
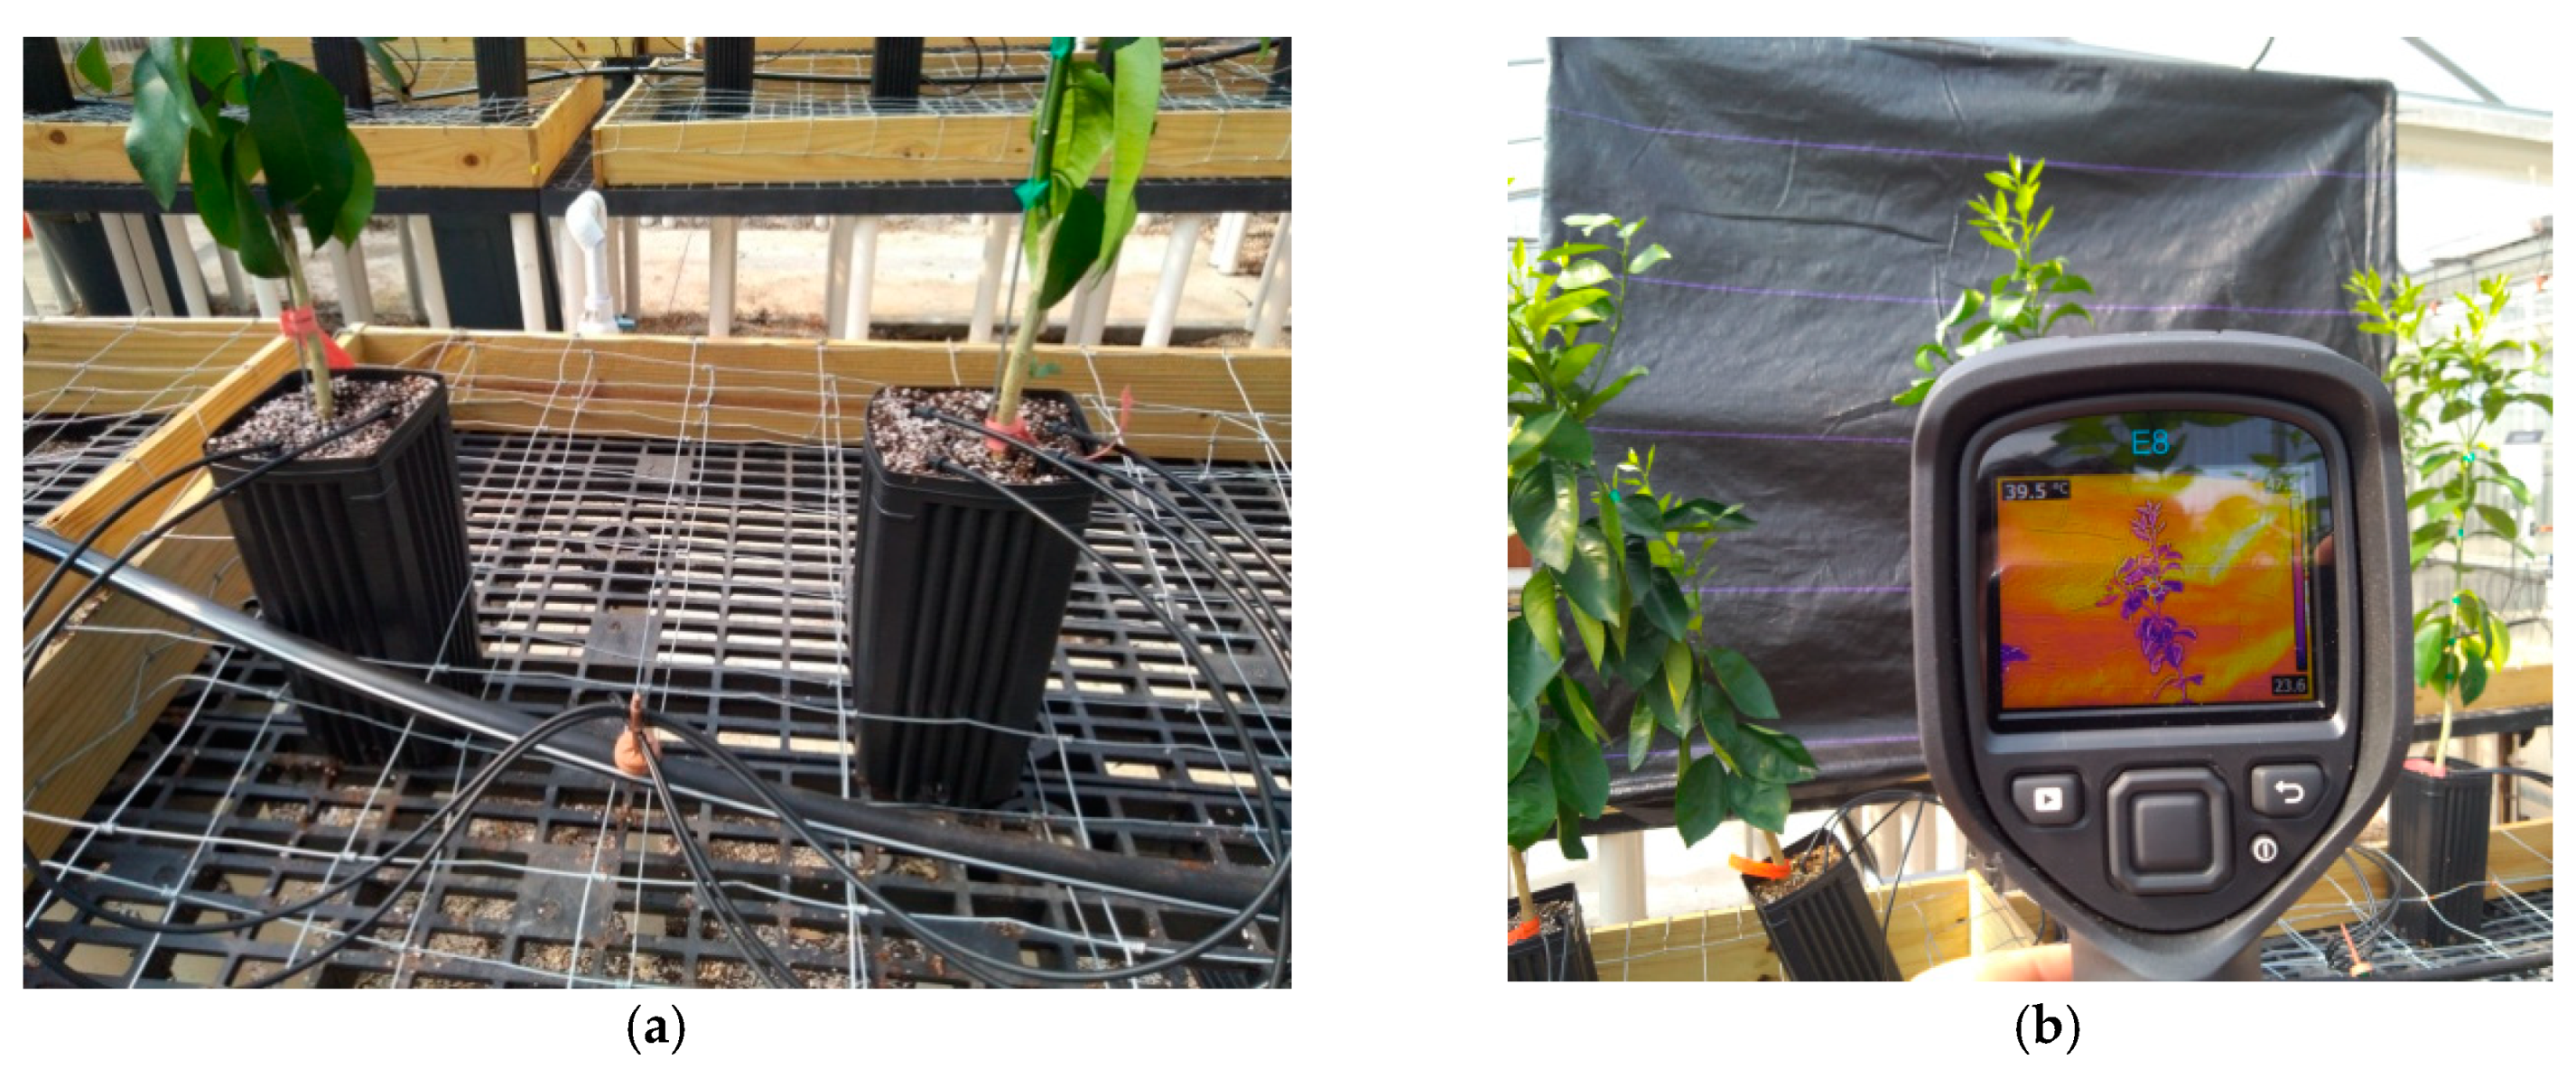
The images were taken using a commercial thermal camera (Flir E8 series; FLIR Systems, Wilsonville, OR, USA) with a precision of ±2 °C ± 2% for ambient temperature ranging from 10 to 35 °C and object temperature ranging from −20 to 250 °C. The camera had a resolution of 320 × 240 pixels, thermal sensitivity lower than 0.06 °C, and used an uncooled microbolometer detector and a lens with an angular field of view of 55° × 43°. Emissivity used was 0.95, as indicated by the manufacturer for healthy plants. Images were registered in the Thermal MSX® mode (FLIR Systems, Wilsonville, OR, USA), and files were saved in standard 14-bit JPG format.
Pictures were taken at noon for all plants on days with clear sky conditions. This time was chosen because many studies have demonstrated that the best time of the day to take robust and physiologically meaningful temperature readings is at midday [20,32,33,34]. Images were taken 1 m away from plants on four different days (16, 17 and 20 December 2019 and 13 January 2020) and in all experimental units for a total of 400 images (four sampling days × 50 plants).
A 1.7 m tall × 1.5 m wide black panel made of heavy-duty polypropylene woven ground cover weed barrier (Vigoro, Lake Forest, IL, USA) was placed behind the plants as a background to create a thermal contrast from the plants (Figure 3b). This allowed separating the plants’ data from the environment’s noise around them.
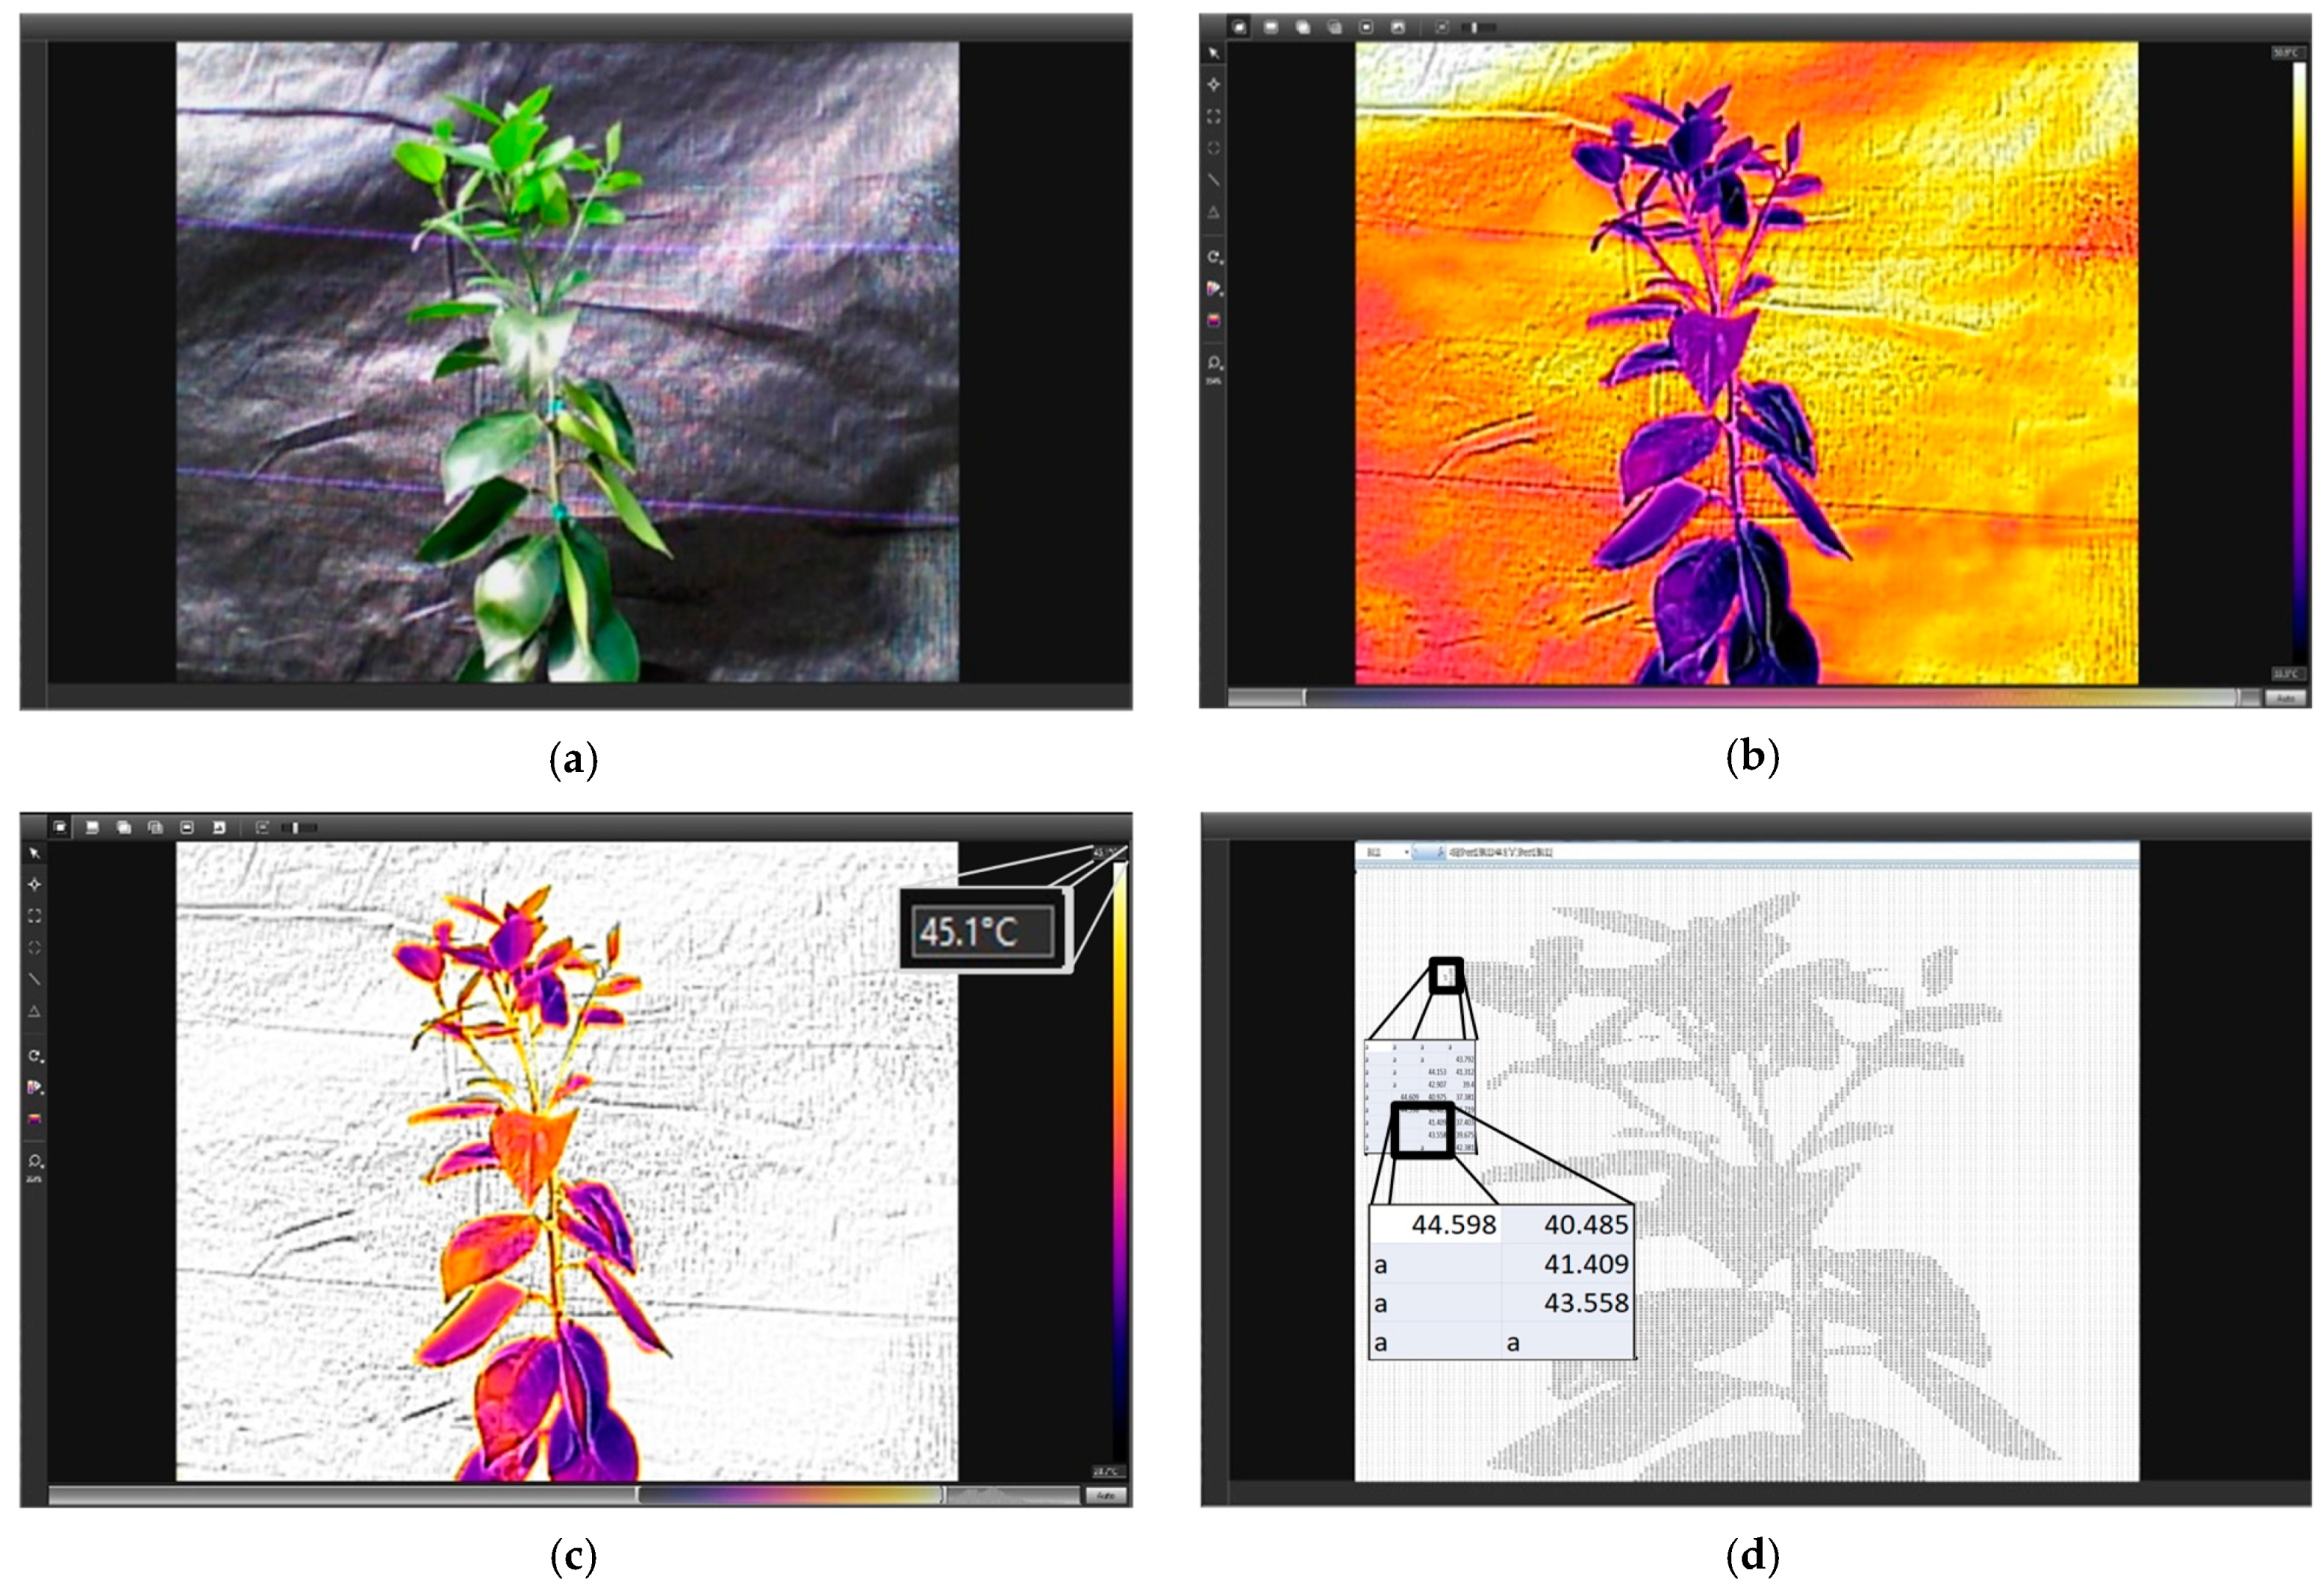
The images were analyzed using open-source software (FLIR Tools version 5.13; FLIR Systems, Wilsonville, OR, USA) by the following steps: (1) Images were cataloged and stored with their respective identification with the timestamp, treatment, replication, and position in the bench. (2) The color palette used was the “Iron”, which is the same shown on the camera screen while taking the images (Figure 4b). (3) The software has a feature that allows changing the temperature range shown by clicking and moving a bar on the bottom of the image (Figure 4b). (4) The images were adjusted to separate the plant from the background positioned behind it by leaving the plants colored and the screen whitened (Figure 4b,c). (5) An upper threshold temperature, which could separate the plant from the black screen, was established for each image by clicking and sliding the adjustment bar until the background was turned into white color (Figure 4c). (6) The limit temperature value was visible on the upper left corner of Figure 4c, and we were able to export the data as a *.csv file. Each file contained 76,800 temperature points (320 × 240 pixels), with each pixel representing the temperature (Figure 4d).
We opened the files in an electronic spreadsheet (Microsoft Excel®; Microsoft Office, Redmond, WA, USA) and used an equation to eliminate values under the temperature threshold established previously. We converted values higher than the threshold into a letter (a) to not be considered in the average calculation. We calculated the average of the canopy temperature using the equation “=IF(Sheet1!Cell>temp; “a”;Sheet1!Cell)”, where “IF” is the conditional formula, “Sheet1” is the name of the worksheet in which contains all data collected from the thermal camera, “Cell” is the worksheet cell with the temperature value, and “temp” is the upper threshold temperature.
The air temperature data were used to calculate the temperature difference between the plant and the surrounding air, following the same method used by [34]. The surrounding air temperature was collected every minute; thus, both values (Tplant and Tair) were obtained simultaneously.
where ΔT is the difference between the plant and the air temperatures (°C), Tplant is the temperature of the plant (°C), and Tair is the temperature of the surrounding air (°C).
2.4.2. Photosynthesis and Transpiration
We determined the leaf photosynthesis and transpiration using a portable gas analyzer system (Li-Cor LI-6400XT equipped with the 6400-02B LED light source chamber and firmware version 6.3.4; Li-Cor Biosciences, Lincoln, NE, USA). On 13 January 2020, samples were taken from 10:30 a.m. to 12:30 p.m. in fully developed and healthy leaves without visible damage signals from the middle third of the plants. The equipment settings used were average air temperature of 35.3 °C, the CO2 concentration of 420 µmol mol−1, active photosynthetic radiation of 1000 µmol m−2 s−1, and average humidity of 70.4%.
2.4.3. Biomass
To determine the biomass, we made biomass measurements on 14 January 2021. We cut the plants at the graft union, and the new shoots were separated from the rest of the plant. We considered new shoots and branches with a light green color different from the old tissue with dark green color. These materials were put on paper bags and taken to a drying room for 72 h at 65 °C. The plant water content (PWC) was calculated by subtracting the dry weight from the fresh weight of whole plants (PWC = fresh weight − dry weight).
2.4.4. Experimental Design and Statistical Analysis
The experiment was arranged in a randomized block design, with five treatments (irrigation depths related to the ETc) and five replications. We analyzed the results separately for two citrus species (‘Ruby Red’ grapefruit and ‘Valencia’ sweet orange). A single plant formed each replication. The analysis of variance (ANOVA) was used to determine statistical significance using commercial software (SigmaPlot 11; Systat Software Inc., San Jose, CA, USA). We analyzed the data by linear and polynomial regression and ANOVA to determine the equations, coefficient of determination (R2), and probability (P) value at a 5% significance level.
3. Results
3.1. Thermal Imaging
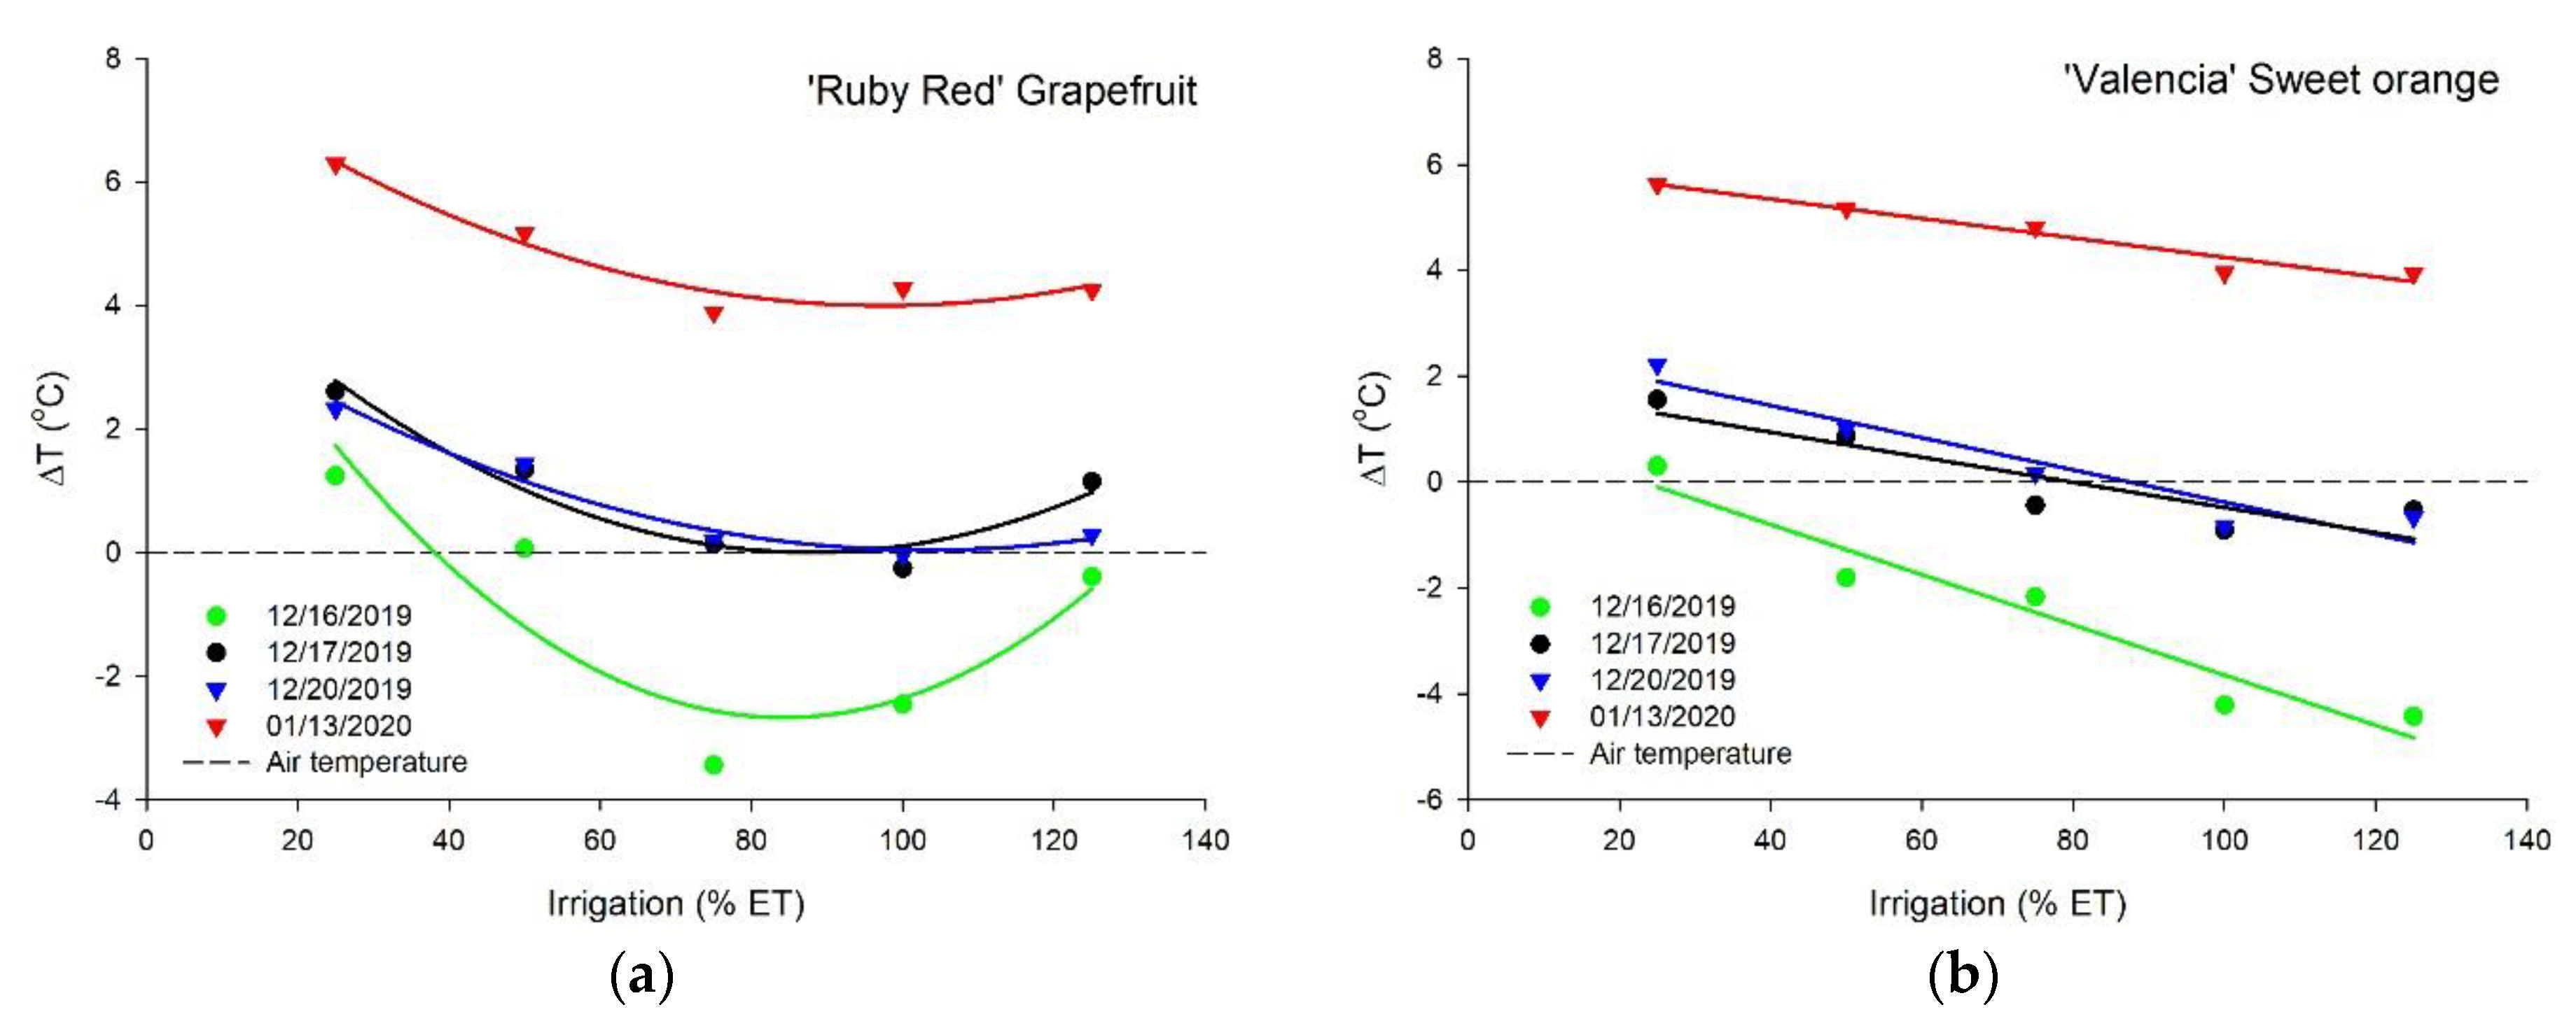
The canopy temperature decreased with an increase in irrigation depths related to the ETc for ‘Ruby Red’ grapefruit and ‘Valencia’ sweet orange, with a better fit of the polynomial model for grapefruit and linear for sweet orange (Figure 5). The two species presented different performances. We did not see the same trend as for sweet orange on the first measurement for grapefruit. Plants that received water to keep the soil moisture close to the field capacity showed temperatures close to the air. The highest temperature difference values (up to 6 °C higher than the air) were observed in the last measurement for both species. Measurements during the image collection resulted in average air temperatures at midday of 42.9, 38.0, 33.2, and 34.2 °C, respectively, for 12/16, 12/17, 12/20, and 01/13 (data not shown). For the treatments with replacement of 100% and 125% ETc, we did not see a temperature difference for both species in the last measurement. The adjustment equations, coefficients of determination, and probability values of the regressions for the temperature difference data are shown in Table 2.
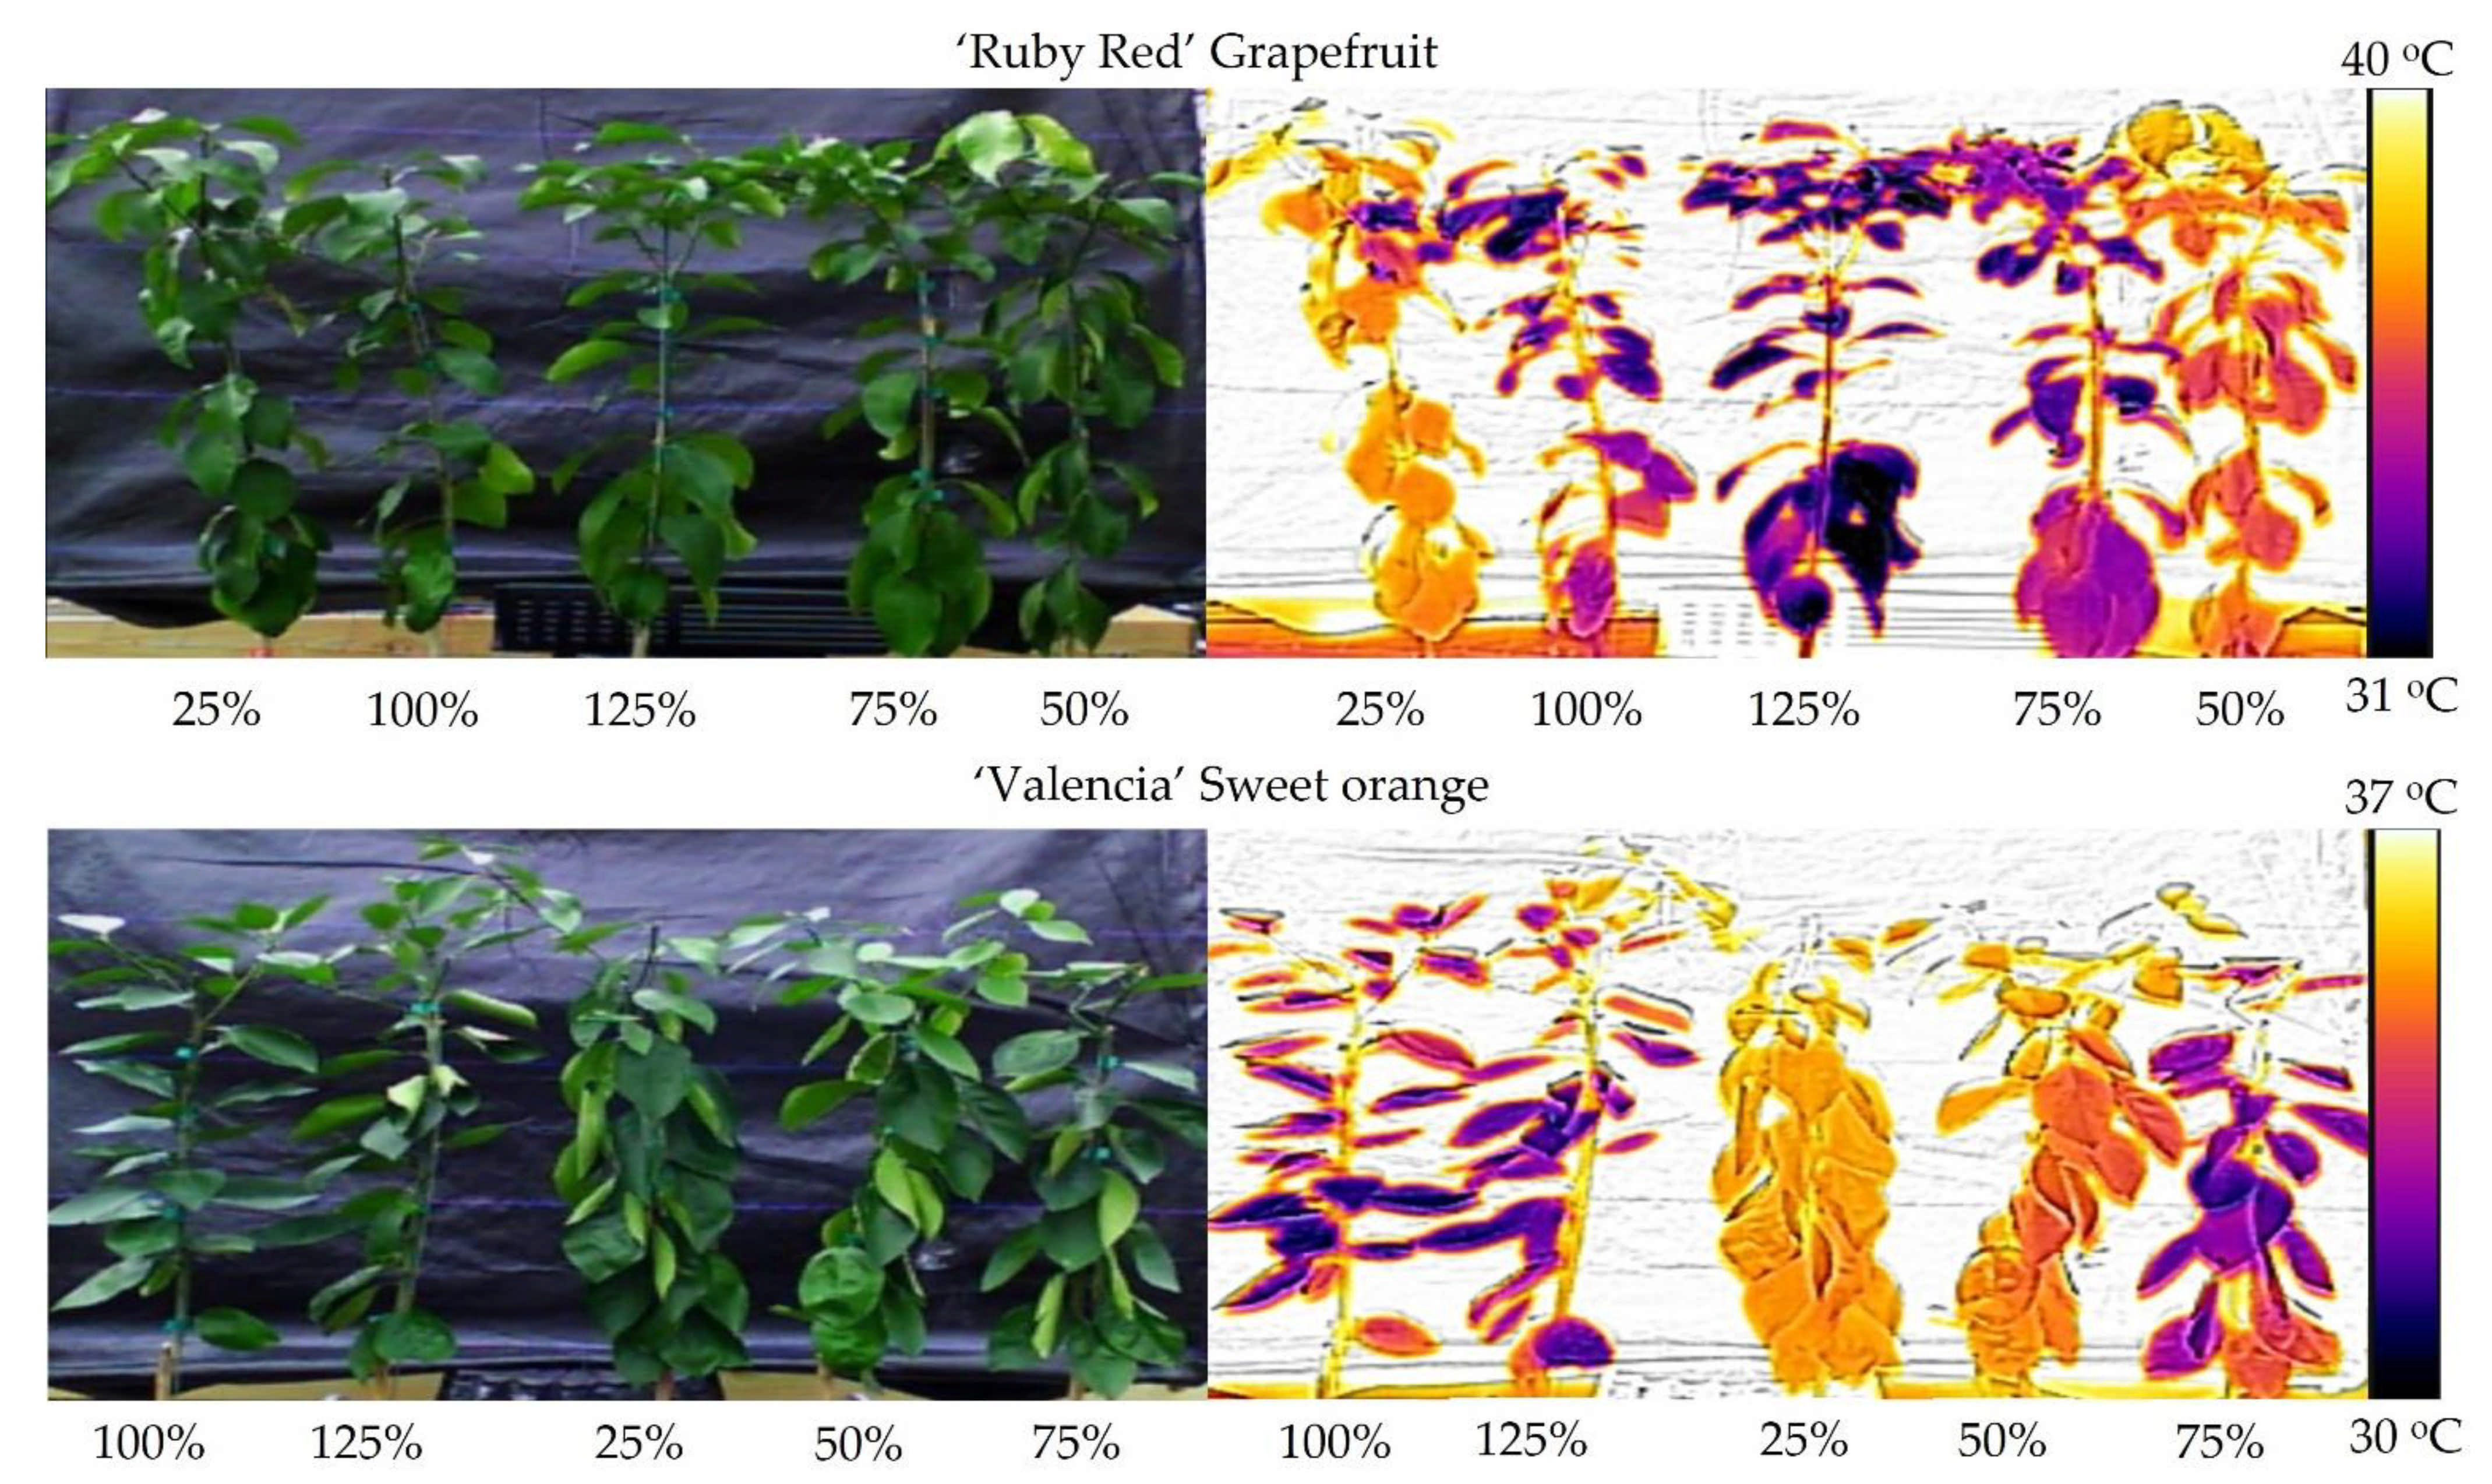
A comparison of the temperature differences is available in Figure 6. On the left side, we present the digital images without thermal processing. There are no visual differences for the ‘Ruby Red’ grapefruit, but for ‘Valencia’ sweet orange, plants show a wilting aspect in the 25% and 50% treatments, even presenting a lower temperature value on the scale when compared to the grapefruit. On the right side, it is easy to visualize the temperature differences. Dark-colored plants are colder than orange/yellow-colored plants. This real-time technique identifies when the water stress occurs and when it would be the best time to irrigate the plants.
3.2. Soil Moisture Monitoring
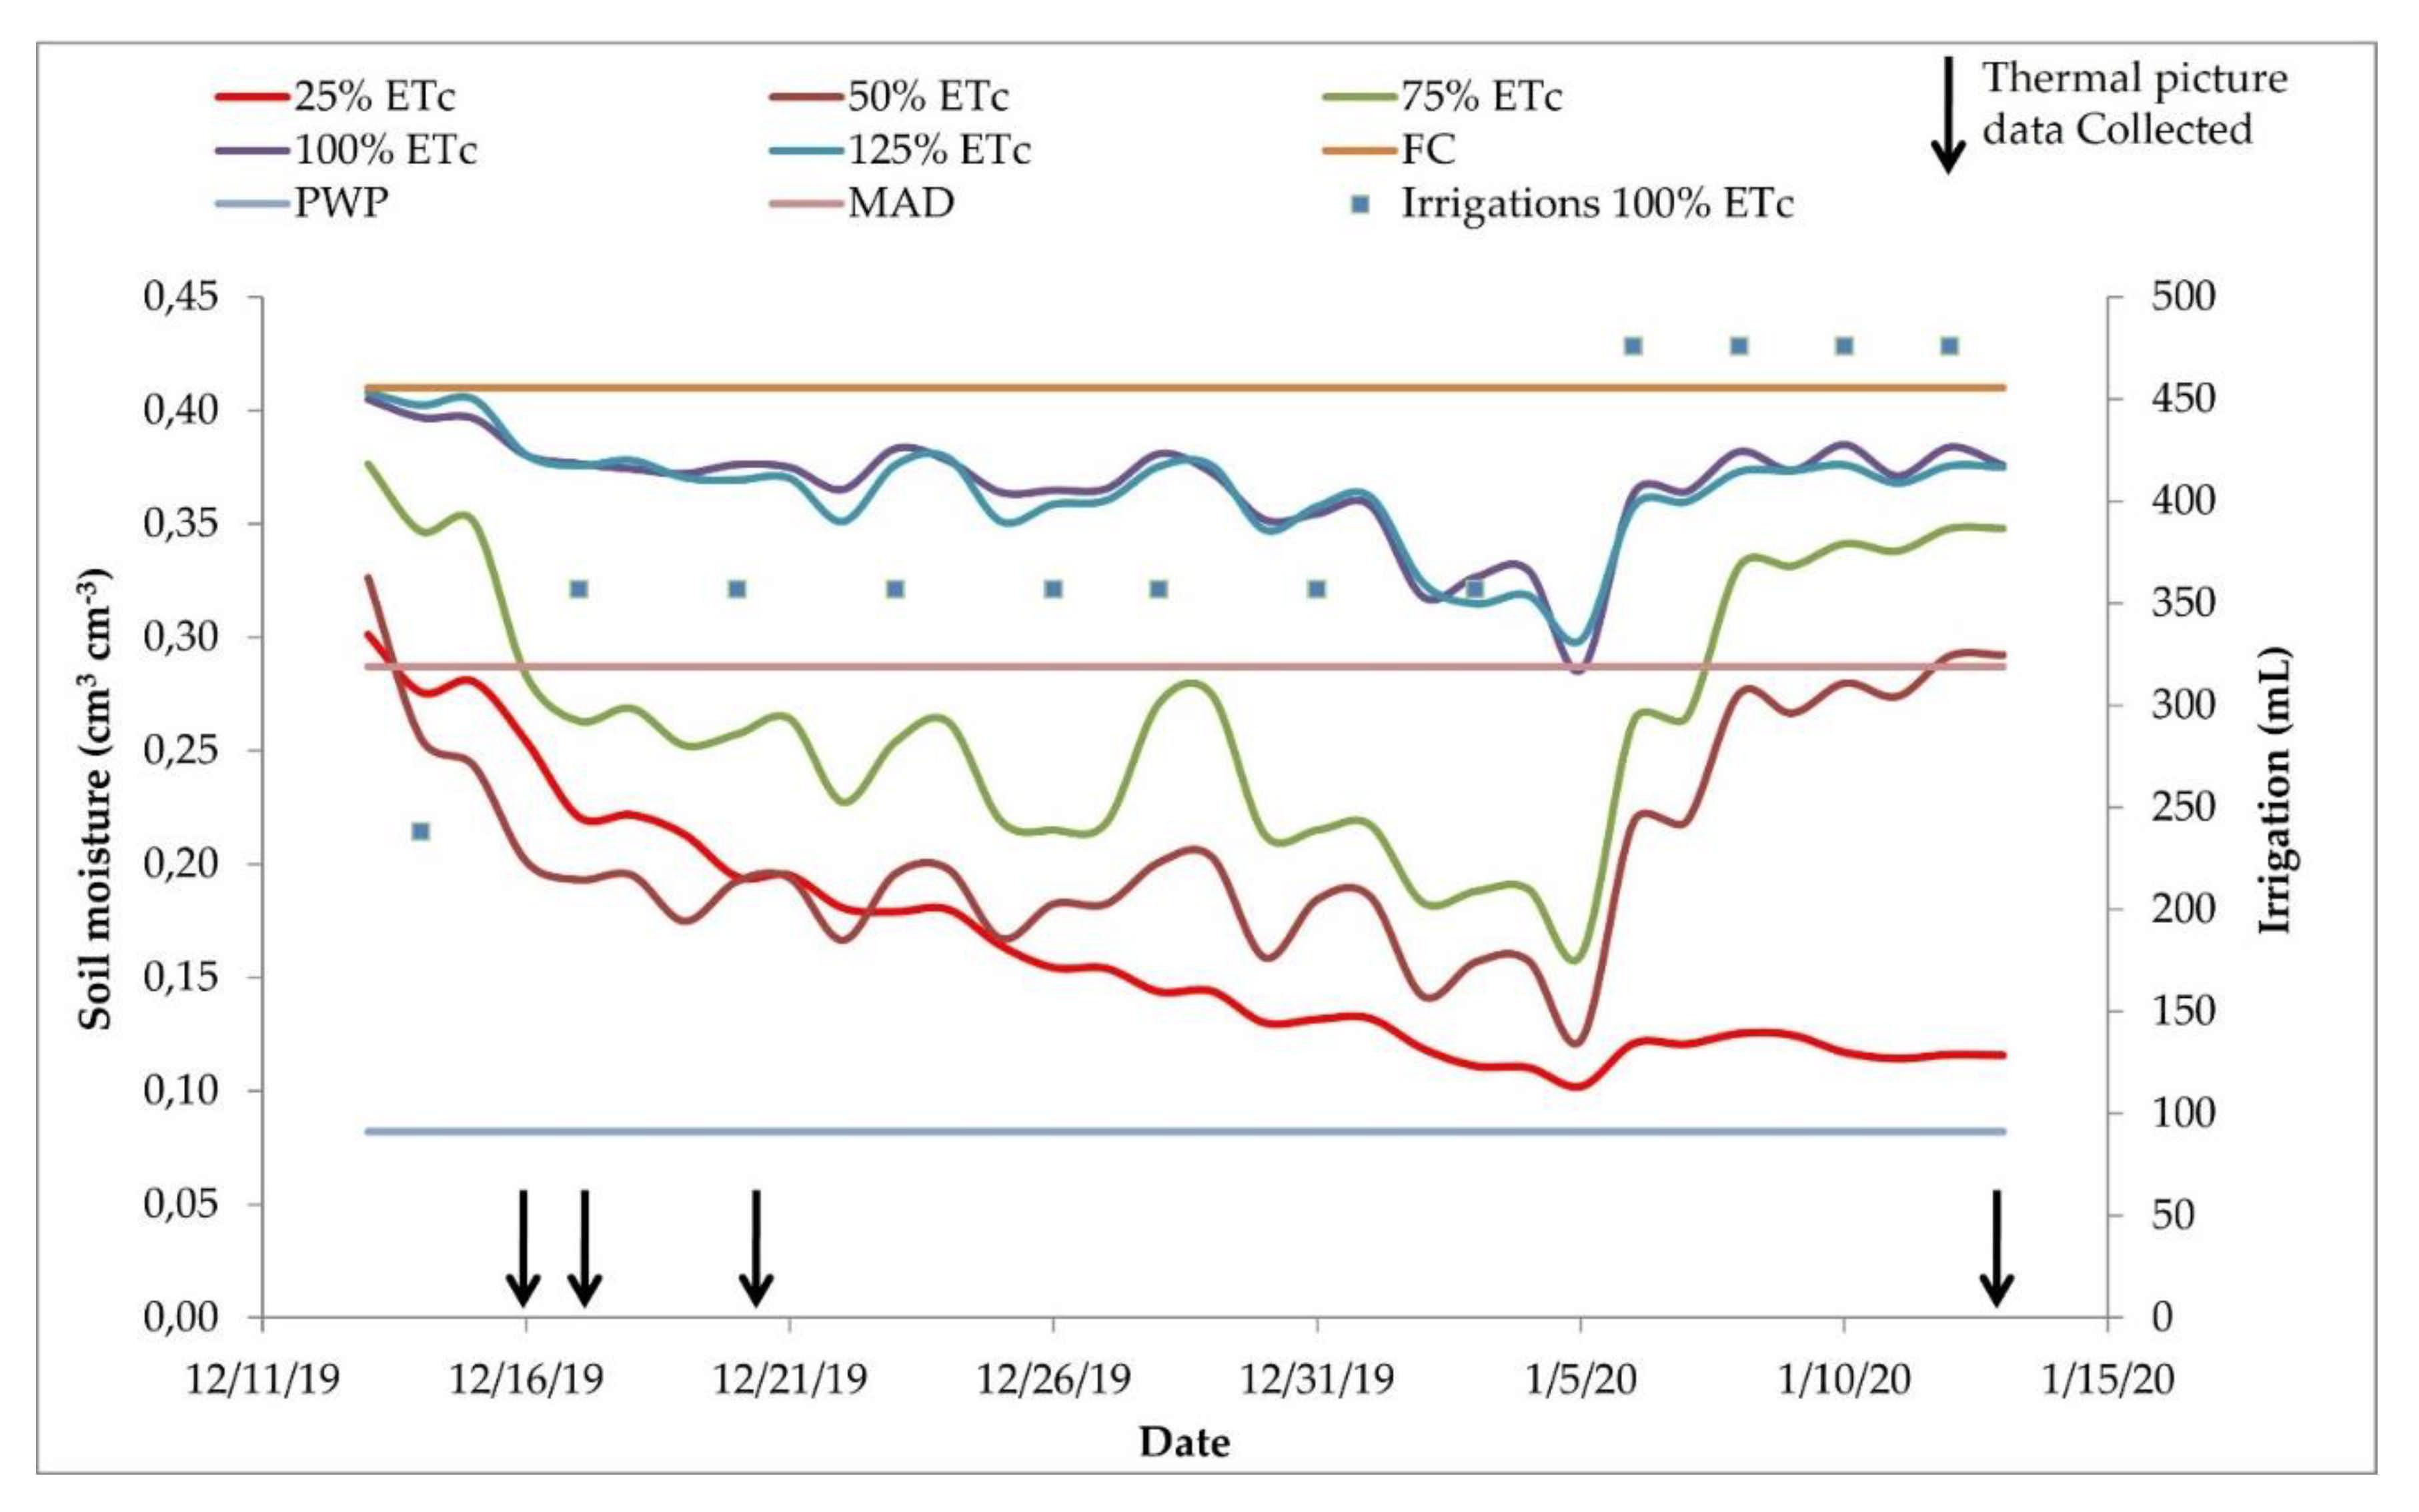
As expected, the soil moisture was kept between the field capacity and maximum allowable depletion (MAD) in the treatments with 100% and 125% ETc replacement (Figure 7). Because the 25%, 50%, and 75% ETc treatments received less water, the soil moisture decreased over time, reaching lower values. The 75% treatment reached values below the maximum allowed depletion in 23 out of 32 days of soil moisture monitoring. The 25% and 50% ETc treatments were kept in low soil moisture almost during the entire experiment, excluding the first day for the 25% ETc and the first and two last days for the 50% ETc treatment. Soil water content significantly decreased in the 25%, 50%, and 75% ETc treatments until 5 January and then increased. This happened because the soil moisture in the 100% and 125% ETc treatments was close to the MAD soil moisture, the irrigation time was increased to provide enough water to bring the soil moisture close to the soil field capacity. There were 12 irrigation events during the experiment. In Figure 7, we present only the irrigation volumes applied to the 100% treatment to facilitate the data visualization since the irrigation volumes for the other treatments were proportional (25%, 50%, 75%, and 125% ETc).
We applied water to keep the 100% ETc treatment soil moisture between the field capacity and the maximum allowable water depletion. As we observed a decrease in soil moisture, we increased the irrigation time, indicated as blue dots in Figure 7.
3.3. Photosynthesis and Transpiration
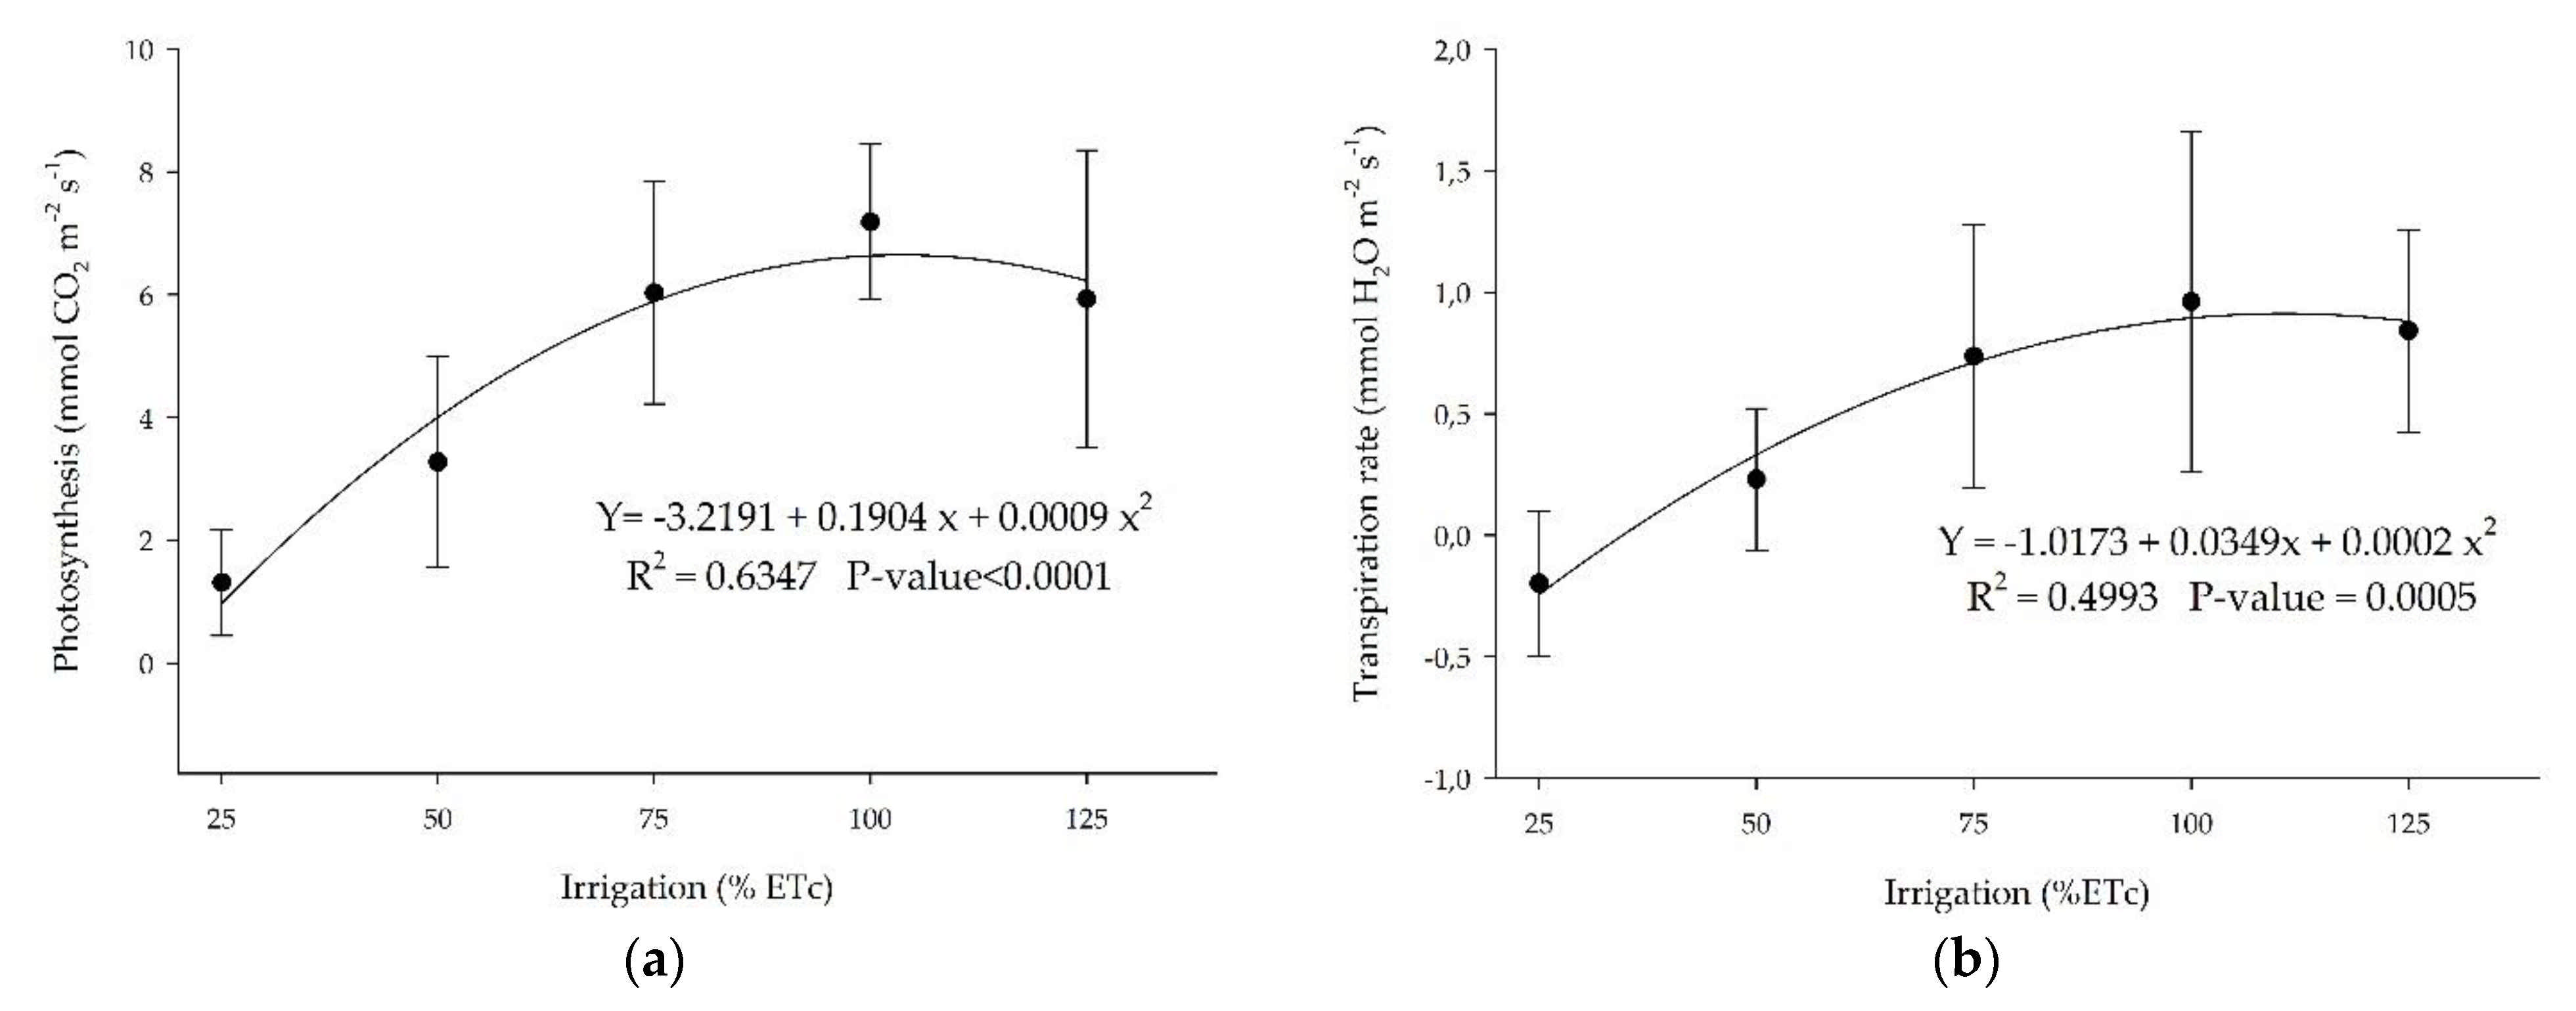
Physiological stress indicators such as leaf photosynthesis and transpiration showed that the higher the irrigation rates, the higher the plant’s response to physiological indicators, with an optimum at 100% ETc (Figure 8). Meager (25% and 50% ETc) or high water levels (125%) in the substrate promote a reduction of these physiological parameters as a response to water deficit or saturation.
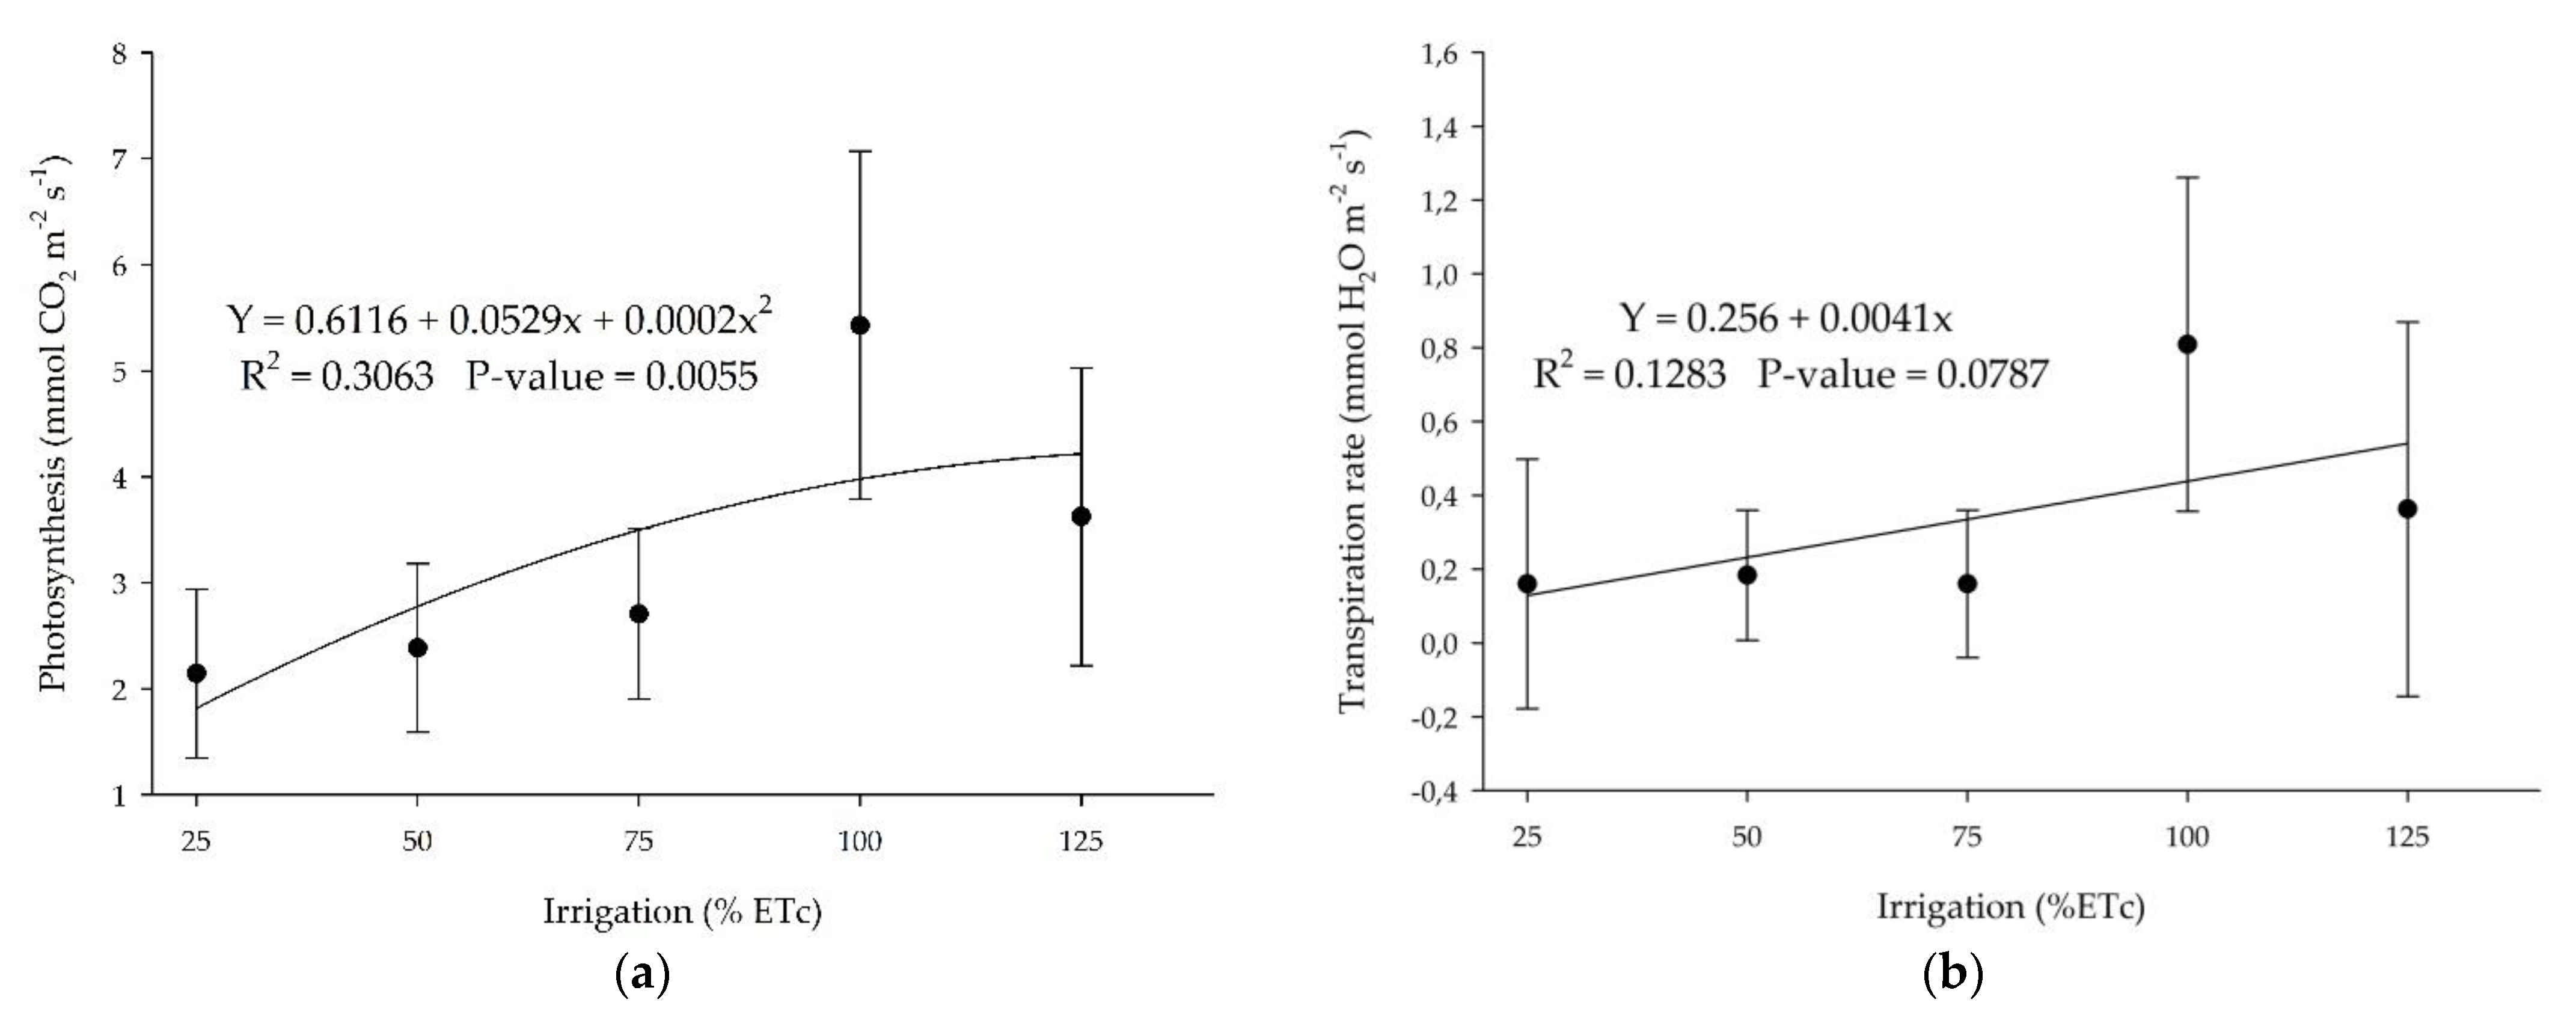
‘Ruby Red’ grapefruit and ‘Valencia’ sweet orange showed the same trend for photosynthesis and transpiration rate but with a polynomial and linear adjustment, respectively, with sweet orange presenting a lower coefficient of determination (Figure 9). Grapefruit presented higher values of photosynthesis and transpiration.
3.4. Biomass and Difference of Temperature
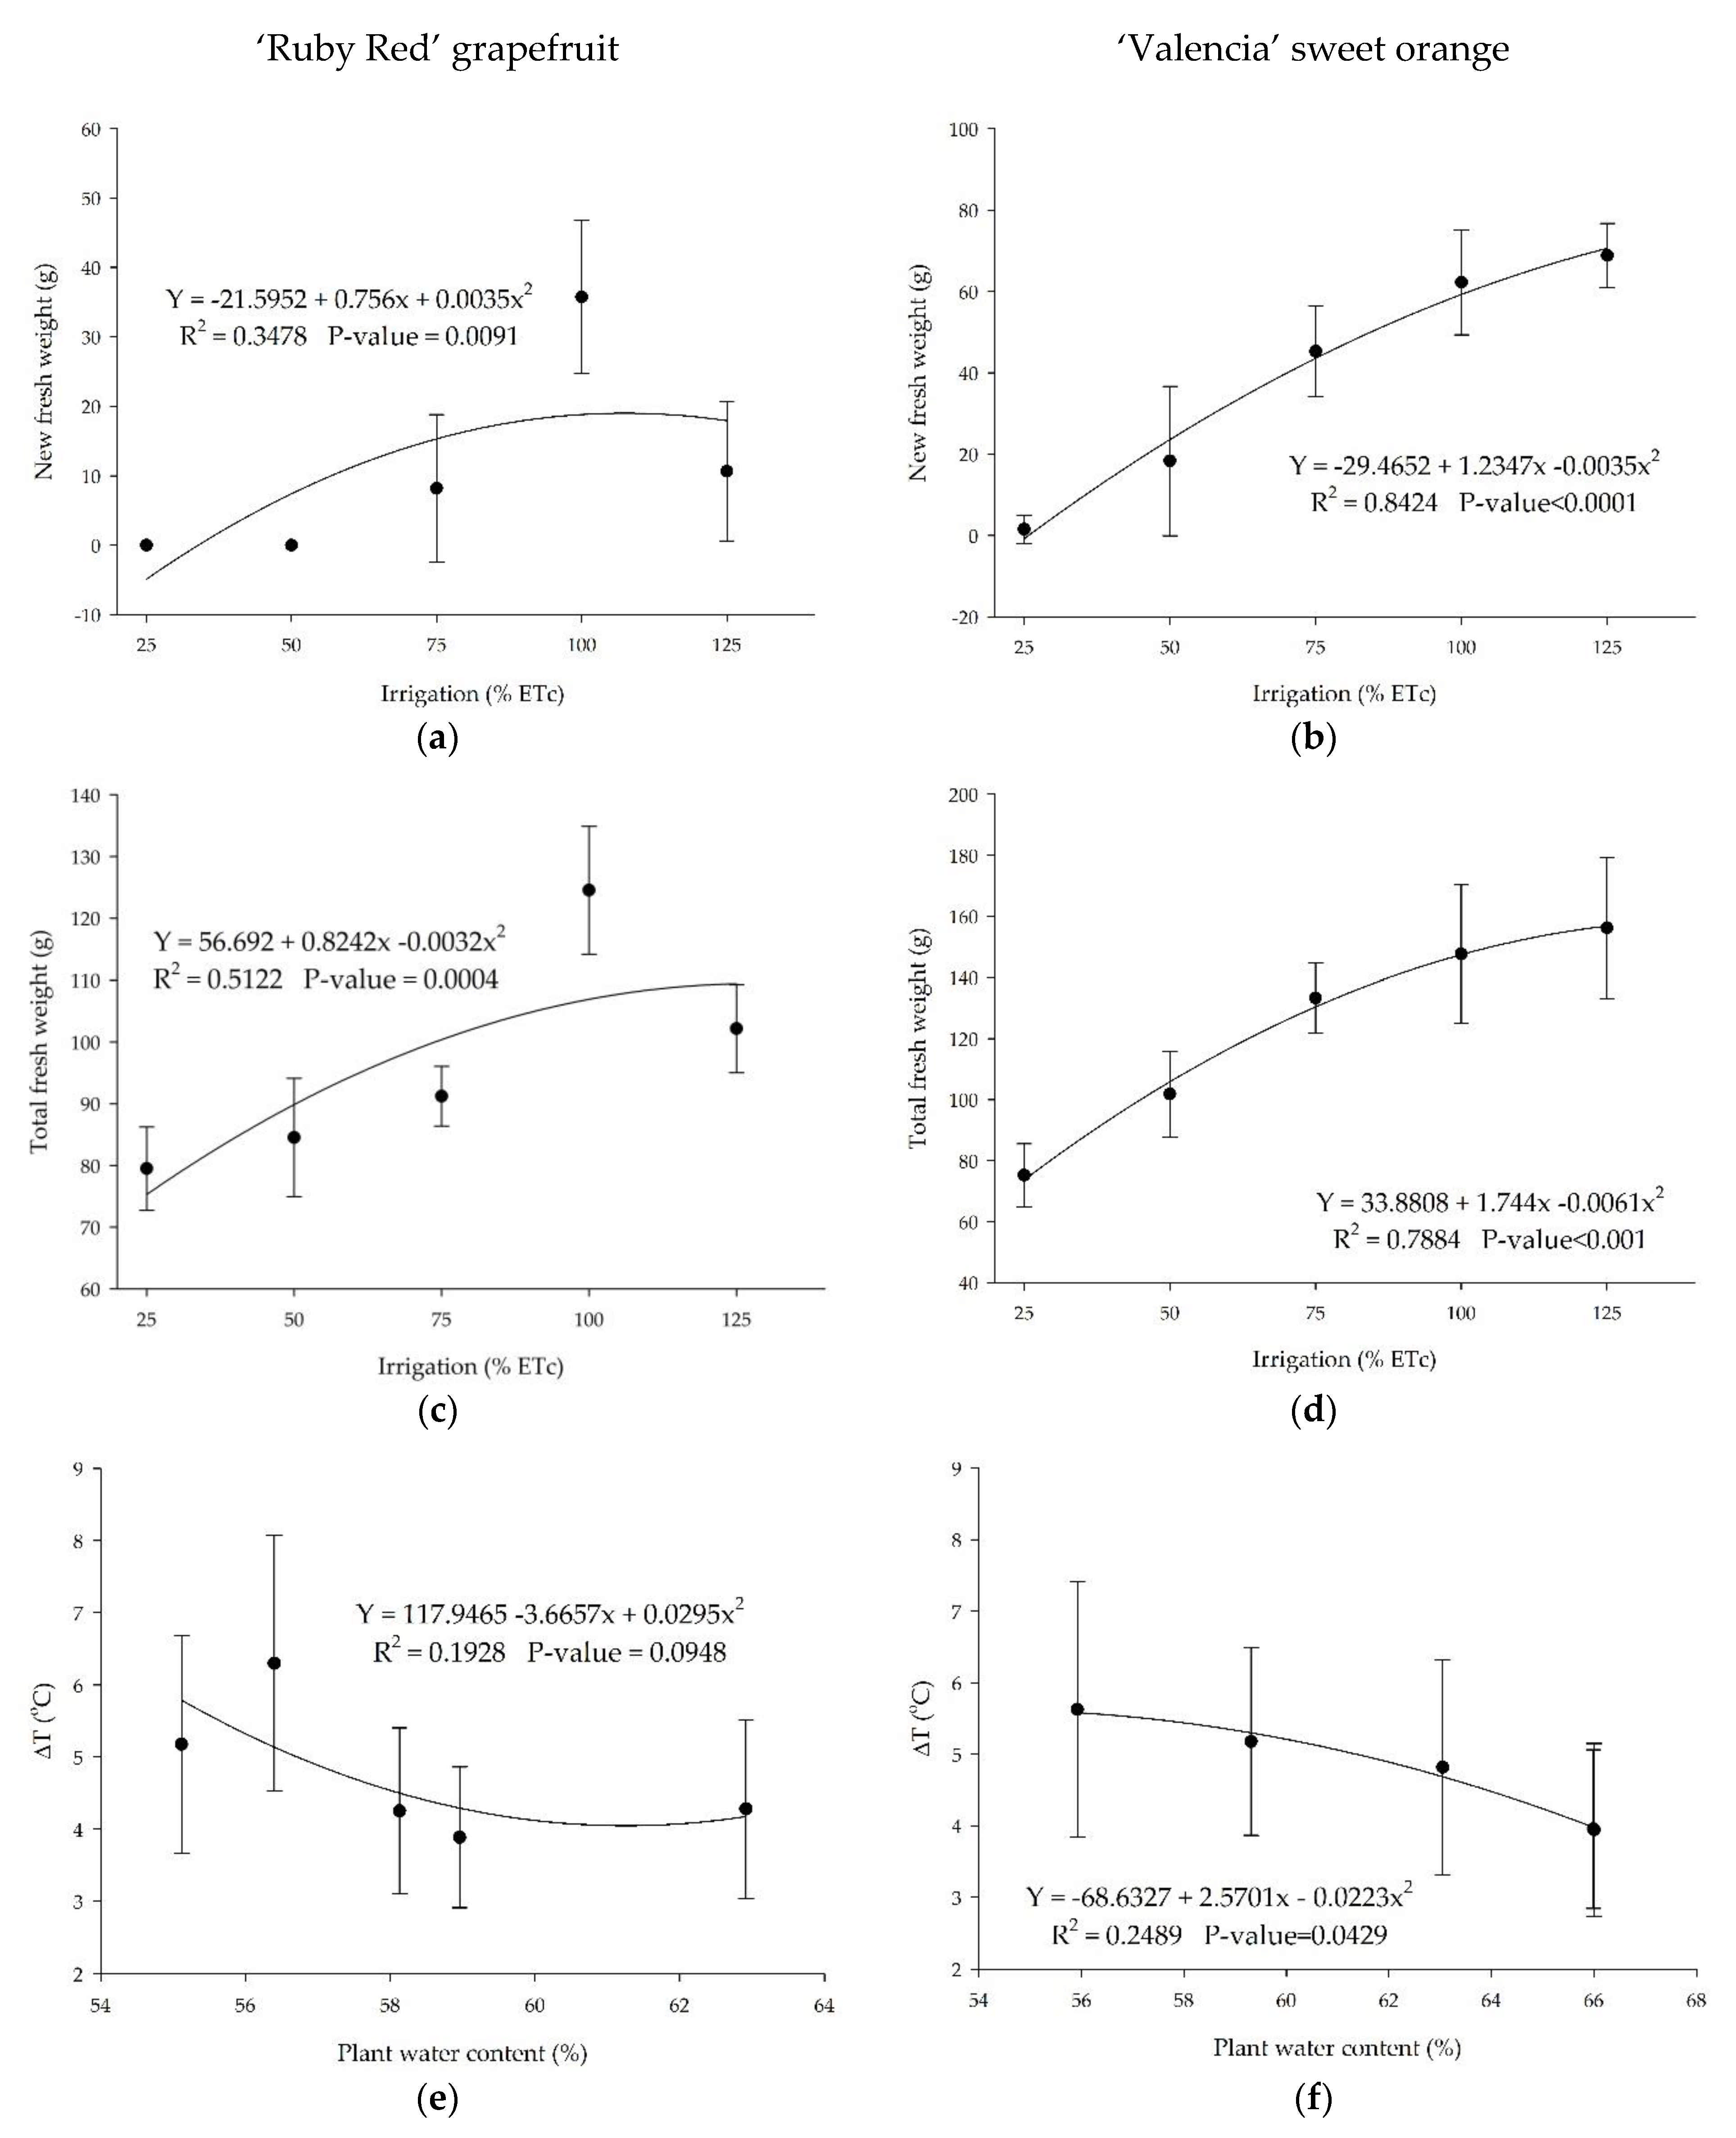
The treatments with soil moisture closer to the field capacity induced higher biomass (Figure 10). As expected, plants grown in adequate watering conditions accumulated higher fresh (Figure 10a,b) and total fresh biomasses (Figure 10c,d). There was a reverse trend for ‘Ruby Red’ grapefruit in the highest amount of water applied (Figure 10a,c). We observed the same trend for total dry weights for grapefruit (34.7, 37.9, 37.4, 46.1, and 42.8) and sweet orange (33.2, 41.2, 49.5, 50.3, and 53.3), respectively, to the 25%, 50%, 75%, 100%, and 125% treatments.
There is a relationship between the plant water content and the canopy temperature for sweet orange (Figure 10f). The relation was not significant for grapefruit plants (Figure 10e). The results showed a better fitting for the ‘Valencia’ sweet orange data, as discussed previously. In this study, the temperature difference between plants and the air reached values higher than 6 °C for ‘Red Ruby’ grapefruit and up to 5.6 °C for ‘Valencia’ sweet orange. For both citrus species, temperature values were higher than the air in all treatments. Another study observed differences in temperature between trees and the air ranging from −2.2 to 2.0 °C in well-irrigated and water-stressed citrus plants [19].
4. Discussion
Images taken with the thermal camera allowed discriminating the water stress in one-year-old citrus plants grown in a greenhouse. The procedure described is simple to follow, and images (Figure 6) can be exported to text files containing canopy temperature values (Figure 4). In addition, using the manual procedure, the operator can quickly identify water-stressed plants.
Our results are like other studies using older cameras. Ballester et al. concluded that canopy temperature variations in response to water stress could be detected in 8-year-old sweet orange trees in the field with a hand-operated thermal camera [19]. However, the study did not use a background to isolate the plants’ leaves. Gonzalez-Dugo et al. took canopy temperature images using sensors installed 1 m away from sweet orange trees and concluded that it is a suitable indicator for water status monitoring in citrus and managing irrigation in precision agriculture [32]. In this study, the results were quite similar for both species, with a higher temperature value for grapefruit (40 °C) compared to the sweet orange (37 °C). In the same way, grapefruit presented higher values of photosynthesis and transpiration. We can visualize plants’ thermal behavior using modern thermal cameras, an essential tool for decision-making in irrigated agriculture.
This technique, coupled with an automated system, can be used for irrigation scheduling. Thus, it is necessary to set up a limited canopy temperature to start the irrigation system and set the irrigation time based on the soil water content. Future studies with thermal imaging to assess plants’ water status need to focus on isolating the background to be extrapolated to field and automation conditions. Users need a computer-based algorithm to isolate the plants by simulating a different color around them. This procedure could reduce or remove the noise from the image and highlight the plant’s temperature.
The treatments kept in low soil moisture showed higher canopy temperature values. In these conditions, the plants absorb less water and were subject to water stress. As a result, both ‘Ruby Red’ grapefruit and ‘Valencia’ sweet orange showed lower photosynthesis values and transpiration. The effects of 25% and 50% water replenishment can be easily observed in the plants (Figure 6), and this technique indicates how simple it is to identify plants that are not well-watered.
In this study, plants were submitted to low water levels (25% and 50% treatments), which promoted a high reduction in plant metabolism due to water deficit, as observed in Figure 8 and Figure 9. The drought affected citrus plant physiology and morphology, leading to stomatal closure and an abrupt decrease in photosynthesis [35,36], ultimately resulting in fruit yield and quality losses [37]. The decrease in canopy temperature is due to transpiration, which cools off the leaf surface, and as the root zone soil moisture is depleted, it induces a decrease in stomatal conductance and transpiration, and consequently an increase in leaf temperature [6,9,38]. The same was observed in other studies with sugarcane ([8,39]), maize [10], common bean [12], almond [34], and citrus [19,32].
There is an effect of low water levels in the substrate, promoting a reduction in metabolic processes. Plant transpiration is essential for regulating leaf surface temperature, thus protecting photosystems from thermal degradation under high temperatures [40]. This trend is associated with partial stomatal closure when severe water restriction is imposed on the plants [34,41]. When a plant is under water stress, the stomata control the gas exchange at the leaf surface. Stomatal closure in response to water deficit is the primary limitation to photosynthesis [42,43] and constitutes a necessary expense in plant growth and temperature regulation under drought conditions [44].
When subjected to water stress, plant biomass tends to decrease due to lower carbohydrate transport and accumulation in response to low sugar contents in leaves [45]. Drought stress usually increases starch hydrolyzes and a reduction in sugar translocation, mainly sucrose [46].
Analyzing the effects of plant water content on the canopy temperature (Figure 10e,f), we can see a better fitting for the ‘Valencia’ sweet orange data, as discussed previously. As a result of low water levels in the substrate, the leaves closed the stomata to prevent plant wilting. These results are induced by the relationship between water content in the soil and canopy temperature.
This study found a positive relationship between canopy temperature and water status, indicating that thermal imaging is a reliable tool for assessing the water status of one-year-old citrus plants in the greenhouse. The temperature difference between the plants and the air was negligible when the plants contained more water since the transpiration rate regulates leaf temperature [47].
In other studies, some authors revealed that assessing crop water stress by canopy temperature in plants with small leaves such as citrus is more complicated and less precise than in other crops such as Vitis vinifera [48]. This can be explained because of the different stomatal regulation in response to irrigation restrictions [49] and differences in leaf characteristics among crops, like leaf size and stomatal density, which affect the aerodynamic and indirect stomatal conductance [19]. Xylem-borne abscisic acid (ABA) plays a crucial role in regulating stomatal aperture serving as the first line of defense against drought, whereas elevated atmospheric CO2 concentration delayed stomatal response to drying, which disrupts the adaptation mechanism against drought [50]. Although citrus plants have small leaves, we were able to apply this technology to assess water status. Plants with larger leaves could be easier to assess.
The usefulness of thermography for plant water stress detection was studied by [19] comparing citrus and persimmon (Diospyros virginiana) trees. They stated that thermal camera measurements to detect plant water stress appear more precise in persimmon than sweet orange. This might be because persimmon trees have a larger leaf size, which determines higher canopy resistance allowing for higher canopy temperature in response to water stress via stomatal closure.
5. Conclusions
A method for measuring the temperature of single one-year-old plants using a hand-operated thermal camera was successfully developed and tested in two citrus species in a greenhouse. The results showed a good relationship between temperature and the physiological response of plants exposed to different water levels. Plants that received less water and were subject to water restrictions showed higher canopy temperatures than the air for ‘Red Ruby’ grapefruit and ‘Valencia’ sweet orange. The thermal images easily identified plants with water stress. This process allows quickly obtaining the canopy temperature and can assess citrus water status for further research in the greenhouse and perhaps in commercial operations with mature trees in the field after specific experimentation. This technique, coupled with an automated system, can be used for irrigation scheduling. Thus, it is necessary to set up a limit temperature to start the irrigation system and set the irrigation time based on the soil water content. To use this process on a large scale, it is necessary to apply an automation routine to process the thermal images in real time and remove the weeds from the background to determine the canopy temperature.
Author Contributions
Conceptualization, G.H.S.V. and R.S.F.; methodology, G.H.S.V. and R.S.F.; formal analysis, G.H.S.V. and R.S.F.; investigation, G.H.S.V. and R.S.F.; resources, G.H.S.V. and R.S.F.; data curation, G.H.S.V. and R.S.F.; writing—original draft preparation, G.H.S.V. and R.S.F.; writing—review and editing, G.H.S.V. and R.S.F.; supervision, R.S.F.; project administration, R.S.F.; funding acquisition, G.H.S.V. and R.S.F. All authors have read and agreed to the published version of the manuscript.
Funding
This research was funded by the UF/IFAS, USDA-NIFA Hatch/Multistate W4128 “Microirrigation: A Sustainable Technology for Crop Intensification and Improved Crop Productivity” (Accession No. 1021596), and USDA-APHIS-HLB-MAC Agreement Number AP19PPQS&T00C116. Funding for the first author was provided by the Prodif (Institutional Scientific Diffusion Program) and the Federal Institute of Education, Science and Technology of Espírito Santo-Brazil.
Institutional Review Board Statement
Not applicable.
Informed Consent Statement
Not applicable.
Data Availability Statement
The data sets generated and/or analyzed during the current study are available from the corresponding author on reasonable request.
Acknowledgments
We thank Dinesh Phuyal, Guilherme Locatelli, and Thiago Rodrigues for technical support.
Conflicts of Interest
The authors declare no conflict of interest. The funders had no role in the study’s design, in the collection, analyses, or interpretation of data, in the writing of the manuscript, or in the decision to publish the results.
References
- García-Tejero, I.F.; Durán-Zuazo, V.H.; Muriel-Fernández, J.L.; Jiménez-Bocanegra, J.A. Linking canopy temperature and trunk diameter fluctuations with other physiological water status tools for water stress management in citrus orchards. Funct. Plant Biol. 2011, 38, 106–117. [Google Scholar] [CrossRef] [PubMed]
- Naor, A. Irrigation scheduling and evaluation of tree water status in deciduous orchards. In Horticultural Reviews, 32nd ed.; Janick, J., Ed.; John Wiley & Sons: Hoboken, NJ, USA, 2006; pp. 111–165. [Google Scholar] [CrossRef]
- Velez, J.E.; Intrigliolo, D.S.; Castel, J.R. Scheduling deficit irrigation of citrus trees with maximum daily trunk shrinkage. Agric. Water Manag. 2007, 90, 197–204. [Google Scholar] [CrossRef]
- Idso, S.B.; Jackson, R.D.; Pinter, P.J., Jr.; Reginato, R.J.; Hatfield, J.L. Normalizing the stress-degree-day parameter for environmental variability. Agric. Meteorol. 1981, 24, 45–55. [Google Scholar] [CrossRef]
- Clawson, K.L.; Blad, B.L. Infrared thermometry for scheduling irrigation of corn. Agron. J. 1982, 74, 311–316. [Google Scholar] [CrossRef]
- Testi, L.; Goldhamer, D.A.; Iniesta, F.; Salinas, M. Crop water stress index is a sensitive water stress indicator in pistachio trees. Irrig. Sci. 2008, 26, 395–405. [Google Scholar] [CrossRef] [Green Version]
- Jackson, R.D.; Reginato, R.J.; Idso, S.B. Wheat canopy temperature: A practical tool for evaluating water requirements. Water Resour. Res. 1977, 13, 651–656. [Google Scholar] [CrossRef]
- Trentin, R.; Zolnier, S.; Ribeiró, A.; Steidle Neto, A.J. Transpiration and leaf temperature of sugarcane under different matric potential values. Eng. Agríc. 2011, 31, 1085–1095, (In Portuguese with English Abstract). [Google Scholar] [CrossRef] [Green Version]
- Gardner, B.R.; Blad, B.L.; Watts, D.G. Plant and air temperatures in differentially irrigated corn. Agric. Meteorol. 1981, 25, 207–217. [Google Scholar] [CrossRef]
- Jackson, R.D. Canopy temperature and crop water stress. In Advances in Irrigation; Hillel, D., Ed.; Academic Press: New York, NY, USA, 1982; pp. 43–85. [Google Scholar]
- Fuchs, M.; Tanner, C.B. Infrared thermometry of vegetation. Agron. J. 1966, 58, 597–601. [Google Scholar] [CrossRef]
- Lobo, F.A.; Oliva, M.A.; Resende, M.; Lopes, N.F.; Maestri, M. Infrared thermometry to schedule irrigation of common bean. Pesqui. Agropecu. Bras. 2004, 39, 113–121. [Google Scholar] [CrossRef] [Green Version]
- Johnson, K.; Sankaran, S.; Ehsani, R. Identification of water stress in citrus leaves using sensing technologies. Agronomy 2013, 3, 747–756. [Google Scholar] [CrossRef] [Green Version]
- Ballester, C.; Castel, J.; Intrigliolo, D.S.; Castel, J.R. Response of Clementina de Nules citrus trees to regulated deficit irrigation. Yield components and fruit composition. Agric. Water Manag. 2011, 98, 1027–1032. [Google Scholar] [CrossRef]
- Jimenez-Bello, M.A.; Ballester, C.; Castel, J.R.; Intrigliolo, D.S. Development and validation of an automatic thermal imaging process for assessing plant water status. Agric. Water Manag. 2011, 98, 1497–1504. [Google Scholar] [CrossRef] [Green Version]
- Romano, G.; Zia, S.; Spreer, W.; Sanchez, C.; Cairns, J.; Araus, J.L.; Müller, J. Use of thermography for high throughput phenotyping of tropical maize adaptation in water stress. Comput. Electron. Agric. 2011, 79, 67–74. [Google Scholar] [CrossRef]
- Ghazouani, H.; Capodici, F.; Ciraolo, G.; Maltese, A.; Rallo, G.; Provenzano, G. Potential of Thermal Images and Simulation Models to Assess Water and Salt Stress: Application to Potato Crop in Central Tunisia. Chem. Eng. Trans. 2017, 58, 709–714. [Google Scholar] [CrossRef]
- González-Dugo, V.; Zarco-Tejada, P.J.; Nicolás, E.; Nortes, P.A.; Alarcón, J.J.; Intrigliolo, D.S.; Fereres, E. Using high-resolution UAV thermal imagery to assess the variability in the water status of five fruit tree species within a commercial orchard. Precis. Agric. 2013, 14, 660–678. [Google Scholar] [CrossRef]
- Ballester, C.; Jiménez-Bello, M.; Castel, J.; Intrigliolo, D. Usefulness of thermography for plant water stress detection in citrus and persimmon trees. Agric. For. Meteorol. 2013, 168, 120–129. [Google Scholar] [CrossRef]
- Bellvert, J.; Zarco-Tejada, P.J.; Fereres, E.; Girona, J. Mapping crop water stress index in a ‘Pinot-noir’ vineyard: Comparing ground measurements with thermal remote sensing imagery from an unmanned aerial vehicle. Precis. Agric. J. 2014, 15, 361–376. [Google Scholar] [CrossRef]
- O’Shaughnessy, S.A.; Evett, S.R.; Colaizzi, P.D.; Howell, T.A. Using radiation thermography and thermometry to evaluate crop water stress in soybean and cotton. Agric. Water Manag. 2011, 98, 1523–1535. [Google Scholar] [CrossRef]
- Viana, L.A.; Zambolim, L.; Sousa, T.V.; Tomaz, D.C. Potential use of thermal camera coupled in UAV for crop monitoring. Braz. J. Biosyst. Eng. 2018, 12, 286–298, (In Portuguese with English Abstract). [Google Scholar] [CrossRef] [Green Version]
- Xu, J.; Lv, Y.; Liu, X.; Dalson, T.; Yang, S.; Wu, J. Diagnosing Crop Water Stress of Rice using Infrared Thermal Imager under Water Deficit Condition. Int. J. Agric. Biol. 2016, 18, 565–572. [Google Scholar] [CrossRef]
- Xu, H.; Ying, Y. Application of infrared thermal imaging in the identification of citrus on trees. J. Infrared Millim. Waves 2004, 23, 353–356. [Google Scholar]
- Bulanon, D.; Burks, T.F.; Alchanatis, V. Study on temporal variation in citrus canopy using thermal imaging for citrus fruit detection. Biosyst. Eng. 2008, 101, 161–171. [Google Scholar] [CrossRef]
- Alchanatis, V.; Cohen, Y.; Cohen, S.; Moller, M.; Sprinstin, M.; Meron, M.; Tsipris, J.; Saranga, Y.; Sela, E. Evaluation of different approaches for estimating and mapping crop water status in cotton with thermal imaging. Precis. Agric. 2010, 11, 27–41. [Google Scholar] [CrossRef]
- Belfiore, N.; Vinti, R.; Lovat, L.; Chitarra, W.; Tomasi, D.; de Bei, R.; Meggio, F.; Gaiotti, F. Infrared Thermography to Estimate Vine Water Status: Optimizing Canopy Measurements and Thermal Indices for the Varieties Merlot and Moscato in Northern Italy. Agronomy 2019, 9, 821. [Google Scholar] [CrossRef] [Green Version]
- Gutiérrez, S.; Diago, M.P.; Fernández-Novales, J.; Tardaguila, J. Vineyard water status assessment using on-the-go thermal imaging and machine learning. PLoS ONE 2018, 13, e0192037. [Google Scholar] [CrossRef]
- Waller, P.; Yitayew, M. Irrigation and Drainage Engineering; Springer: New York, NY, USA, 2016; p. 742. [Google Scholar] [CrossRef]
- Keller, J.; Bliesner, R.D. Sprinkle and Trickle Irrigation; Springer: New York, NY, USA, 1990; p. 652. [Google Scholar]
- American Society of Agricultural Engineers (ASAE). Field Evaluation of Micro-Irrigation Systems (EP 458); ASAE: St. Joseph, MI, USA, 2001; pp. 792–797. [Google Scholar]
- Gonzalez-Dugo, V.; Zarco-Tejada, P.J.; Fereres, E. Applicability and limitations of using the crop water stress index as an indicator of water deficits in citrus orchards. Agric. For. Meteorol. 2014, 198–199, 94–104. [Google Scholar] [CrossRef]
- Pou, A.; Diago, M.P.; Medrano, H.; Baluja, J.; Tardaguila, J. Validation of thermal indices for water stress status identification in grapevine. Agric. Water Manag. 2014, 134, 60–72. [Google Scholar] [CrossRef]
- García-Tejero, I.F.; Rubio, A.E.; Viñuela, I.; Hernández, A.; Gutiérrez-Gordillo, S.; Rodríguez-Pleguezuelo, C.R.; Durán-Zuazo, V.H. Thermal imaging at plant level to assess the crop-water status in almond trees (cv. Guara) under deficit irrigation strategies. Agric. Water Manag. 2018, 208, 176–186. [Google Scholar] [CrossRef]
- Balfagón, D.; Zandalinas, S.I.; Baliño, P.; Muriach, M.; Gómez-Cadenas, A. Involvement of ascorbate peroxidase and heat shock proteins on citrus tolerance to combined conditions of drought and high temperatures. Plant Physiol. Biochem. 2018, 27, 194–199. [Google Scholar] [CrossRef]
- Shafqat, W.; Naqvi, S.A.; Maqbool, R.; Haider, M.S.; Jaskani, M.J.; Khan, I.A. Climate change and citrus. In Citrus; Intech Open: London, UK, 2021; 24p. [Google Scholar] [CrossRef]
- Shafqat, W.; Jaskani, M.J.; Maqbool, R.; Khan, A.S.; Ali, Z. Evaluation of citrus rootstocks against drought, heat, and combined stress based on growth and photosynthetic pigments. Int. J. Agric. Biol. 2019, 22, 1001–1009. [Google Scholar] [CrossRef]
- Ihuoma, S.O.; Madramootoo, C.A. Recent advances in crop water stress detection. Comput. Electron. Agric. 2017, 141, 267–275. [Google Scholar] [CrossRef]
- Vieira, G.H.S.; Mantovani, E.C.; Sediyama, G.C.; Delazari, F.T. Morpho-physiological indicators of water stress on sugarcane as a function of irrigation depths. Biosci. J. 2014, 30, 65–75, (In Portuguese with English Abstract). Available online: http://www.seer.ufu.br/index.php/biosciencejournal/article/view/15026 (accessed on 26 July 2021).
- Zandalinas, S.I.; Rivero, R.M.; Martínez, V.; Gómez-Cadenas, A.; Arbona, V. Tolerance of citrus plants to the combination of high temperatures and drought is associated with the increase in transpiration modulated by a reduction in abscisic acid levels. BMC Plant Biol. 2016, 16, 105. [Google Scholar] [CrossRef] [Green Version]
- Klein, T. The variability of stomatal sensitivity to leaf water potential across tree species indicates a continuum between isohydric and anisohydric behaviors. Funct. Ecol. 2014, 28, 1313–1320. [Google Scholar] [CrossRef]
- Flexas, J.; Medrano, H. Drought-inhibition of photosynthesis in C3 plants: Stomatal and non-stomatal limitations revisited. Ann. Bot. 2002, 89, 183–189. [Google Scholar] [CrossRef] [Green Version]
- Zandalinas, S.I.; Balfagón, D.; Arbona, V.; Gómez-Cadenas, A. Regulation of citrus responses to the combined action of drought and high temperatures depends on the severity of water deprivation. Physiol. Plant. 2018, 162, 427–438. [Google Scholar] [CrossRef] [Green Version]
- Martin-St. Paul, N.; Delzon, S.; Cochard, H. Plant resistance to drought depends on timely stomatal closure. Ecol. Lett. 2017, 20, 1437–1447. [Google Scholar] [CrossRef] [PubMed]
- Zaer-Ara, T.; Boroomand, N.; Sadat-Hosseini, M. Physiological and morphological response to drought stress in seedlings of ten citruses. Trees 2016, 30, 985–993. [Google Scholar] [CrossRef]
- De Souza, C.R.; Maroco, J.P.; dos Santos, T.P.; Rodrigues, M.L.; Lopes, C.M.; Pereira, J.S.; Chaves, M.M. Impact of deficit irrigation on water use efficiency and carbon isotope composition of field-grown grapevines under Mediterranean climate. J. Exp. Bot. 2005, 56, 2163–2172. [Google Scholar] [CrossRef] [PubMed] [Green Version]
- Brodribb, T.J.; McAdam, S.A.M. Evolution of the stomatal regulation of plant water content. Plant Physiol. 2017, 174, 639–649. [Google Scholar] [CrossRef] [PubMed] [Green Version]
- Jones, H.G.; Stoll, M.; Santos, T.; de Sousa, C.; Chaves, M.M.; Grant, O.M. Use of infrared thermography for monitoring stomatal closure in the field: Application to the grapevine. J. Exp. Bot. 2002, 53, 2249–2260. [Google Scholar] [CrossRef]
- Möller, M.; Alchanatis, V.; Cohen, Y.; Meron, M.; Tsipris, J.; Ostrovsky, V. Use of thermal and visible imagery for estimating crop water status of irrigated grapevine. J. Exp. Bot. 2007, 58, 827–838. [Google Scholar] [CrossRef] [Green Version]
- Li, S.; Li, X.; Wei, Z.; Liu, F. ABA-mediated modulation of elevated CO2 on stomatal response to drought. Curr. Opin. Plant Biol. 2020, 56, 174–180. [Google Scholar] [CrossRef] [PubMed]
Figure 1.
(a) General view of the greenhouse with the cooling panel in the back. (b) Experiment layout inside the greenhouse, showing the different blocks, benches, irrigation lines, and pots for the two citrus species tested: ‘Red Ruby’ grapefruit and ‘Valencia’ sweet orange.
Figure 1.
(a) General view of the greenhouse with the cooling panel in the back. (b) Experiment layout inside the greenhouse, showing the different blocks, benches, irrigation lines, and pots for the two citrus species tested: ‘Red Ruby’ grapefruit and ‘Valencia’ sweet orange.

Figure 2.
Environmental data inside the greenhouse during the trial showing photosynthetic photon flux density (PPF), relative humidity (RH), maximum (Tmax), and minimum (Tmin) temperatures during the experimental period and the days in which data were collected.
Figure 2.
Environmental data inside the greenhouse during the trial showing photosynthetic photon flux density (PPF), relative humidity (RH), maximum (Tmax), and minimum (Tmin) temperatures during the experimental period and the days in which data were collected.

Figure 3.
(a) Irrigation lateral line and distribution of drip stakes for treatment application in the pots placed on the benches with wireframes; (b) image capturing in one-year-old citrus plants, with the thermal camera, using a black screen as a background.
Figure 3.
(a) Irrigation lateral line and distribution of drip stakes for treatment application in the pots placed on the benches with wireframes; (b) image capturing in one-year-old citrus plants, with the thermal camera, using a black screen as a background.

Figure 4.
(a) Digital image of a one-year-old citrus plant with a black screen background. Thermal images before (b) and after (c) the threshold temperature adjustment made by the software and the temperature value showed on the upper right corner. (d) Spreadsheet with the separated values (numbers vs. letters) showing the silhouette of the plant.

Figure 5.
Temperature difference (∆T) between the plants and the air of ‘Ruby Red’ grapefruit (a) and ‘Valencia’ sweet orange (b) under increasing levels of irrigation based on crop evapotranspiration (ETc). Polynomial and linear models adjusted by regression using data from 5 replications (n = 5). Each data point is an average of 5 replications.

Figure 6.
Digital (left) and thermal (right) images of ‘Ruby Red’ grapefruit and ‘Valencia’ sweet orange plants subjected to different crop evapotranspiration treatments.
Figure 6.
Digital (left) and thermal (right) images of ‘Ruby Red’ grapefruit and ‘Valencia’ sweet orange plants subjected to different crop evapotranspiration treatments.

Figure 7.
Substrate moisture and amount of irrigation applied during the study. Each colored line indicates the average values of three sensors. The upper reference line indicates the field capacity (FC), the lower line represents the permanent wilting point (PWP), and the central line represents the maximum allowed depletion (MAD). Irrigations 100% show the water volumes applied to the treatment 100%. The black arrows indicate the days in which the thermal images were taken. ETc = crop evapotranspiration.

Figure 8.
(a) Photosynthesis and (b) transpiration rate for ‘Ruby Red’ grapefruit submitted to different irrigation levels. Polynomial models adjusted by regression using data from 5 replications. Each data point is the average ± standard deviation of 5 replications. ETc = crop evapotranspiration.
Figure 8.
(a) Photosynthesis and (b) transpiration rate for ‘Ruby Red’ grapefruit submitted to different irrigation levels. Polynomial models adjusted by regression using data from 5 replications. Each data point is the average ± standard deviation of 5 replications. ETc = crop evapotranspiration.

Figure 9.
(a) Photosynthesis and (b) transpiration rate for ‘Valencia’ sweet orange submitted to different irrigation levels. Polynomial and linear models adjusted by regression using data from 5 replications. Each data point is the average ± standard deviation of 5 replications. ETc = crop evapotranspiration.

Figure 10.
New and total fresh weight and temperature difference (∆T) between the plants and the air in ‘Ruby Red’ grapefruit (a,c,e) and ‘Valencia’ sweet orange plants (b,d,f). Polynomial models adjusted by regression using data from 5 replications. Each data point is the average ± standard deviation of 5 replications. ETc = crop evapotranspiration.


Table 1.
Treatments tested, number of drippers per pot, average emitter discharge, and total water applied per pot on all irrigation events during the experiment.
Table 1.
Treatments tested, number of drippers per pot, average emitter discharge, and total water applied per pot on all irrigation events during the experiment.
| Treatment | Number of Drippers Per Pot | Emitter Discharge (L h−1) | Total Water Applied (L) |
|---|---|---|---|
| 25% ETc | 1 | 1.81 | 1.66 |
| 50% ETc | 2 | 3.43 | 3.14 |
| 75% ETc | 3 | 5.20 | 4.76 |
| 100% ETc | 4 | 7.15 | 6.55 |
| 125% ETc | 5 | 8.73 | 8.00 |
Table 2.
Adjustment equations, coefficients of determination (R2), and probability (P) values of the regressions for the temperature difference (∆T).
Table 2.
Adjustment equations, coefficients of determination (R2), and probability (P) values of the regressions for the temperature difference (∆T).
| Date | ‘Ruby Red’ Grapefruit | n | ||
|---|---|---|---|---|
| 16 December 2019 | Y = 6.2316 − 0.2114x + 0.0013x2 | R2 = 0.4490 | p = 0.0014 | 25 |
| 17 December 2019 | Y = 5.4340 − 0.1236x + 0.0007x2 | R2 = 0.4862 | p = 0.0007 | 25 |
| 20 December 2019 | Y = 4.2288 − 0.0812x + 0.0004x2 | R2 = 0.5331 | p = 0.0002 | 25 |
| 13 January 2019 | Y = 8.2156 − 0.0865x + 0.0004x2 | R2 = 0.3183 | p = 0.0148 | 25 |
| All dates | Y = 6.0275 − 0.1257x + 0.0007x2 | R2 = 0.1506 | p < 0.0001 | 100 |
| ‘Valencia’ sweet orange | ||||
| 16 December 2019 | Y = 1.0936 − 0.0474x | R2 = 0.7209 | p < 0.0001 | 25 |
| 17 December 2019 | Y = 1.8910 − 0.0237x | R2 = 0.2793 | p = 0.0066 | 25 |
| 20 December 2019 | Y = 2.6618 − 0.0304x | R2 = 0.6003 | p < 0.0001 | 25 |
| 13 January 2019 | Y = 6.0794 − 0.0183x | R2 = 0.2082 | p = 0.0219 | 25 |
| All dates | Y = 2.9315 − 0.0300x | R2 = 0.1220 | p < 0.0001 | 100 |
Publisher’s Note: MDPI stays neutral with regard to jurisdictional claims in published maps and institutional affiliations. |
© 2021 by the authors. Licensee MDPI, Basel, Switzerland. This article is an open access article distributed under the terms and conditions of the Creative Commons Attribution (CC BY) license (https://creativecommons.org/licenses/by/4.0/).
Share and Cite
MDPI and ACS Style
Vieira, G.H.S.; Ferrarezi, R.S. Use of Thermal Imaging to Assess Water Status in Citrus Plants in Greenhouses. Horticulturae 2021, 7, 249. https://0-doi-org.brum.beds.ac.uk/10.3390/horticulturae7080249
AMA Style
Vieira GHS, Ferrarezi RS. Use of Thermal Imaging to Assess Water Status in Citrus Plants in Greenhouses. Horticulturae. 2021; 7(8):249. https://0-doi-org.brum.beds.ac.uk/10.3390/horticulturae7080249
Chicago/Turabian StyleVieira, Gustavo Haddad Souza, and Rhuanito Soranz Ferrarezi. 2021. "Use of Thermal Imaging to Assess Water Status in Citrus Plants in Greenhouses" Horticulturae 7, no. 8: 249. https://0-doi-org.brum.beds.ac.uk/10.3390/horticulturae7080249
Note that from the first issue of 2016, this journal uses article numbers instead of page numbers. See further details here.