
High-Density Linkage Mapping and Identification of Quantitative Trait Loci Associated with Powdery Mildew Resistance in Flowering Dogwood (Cornus florida)


Abstract
:1. Introduction
2. Materials and Methods
2.1. Assembling the Mapping Populations
2.2. Phenotyping
2.3. ddRadseq Library Preparation and Sequencing
2.4. Calling SNP Markers
2.5. Linkage Map Construction
2.6. QTL Analysis
3. Results
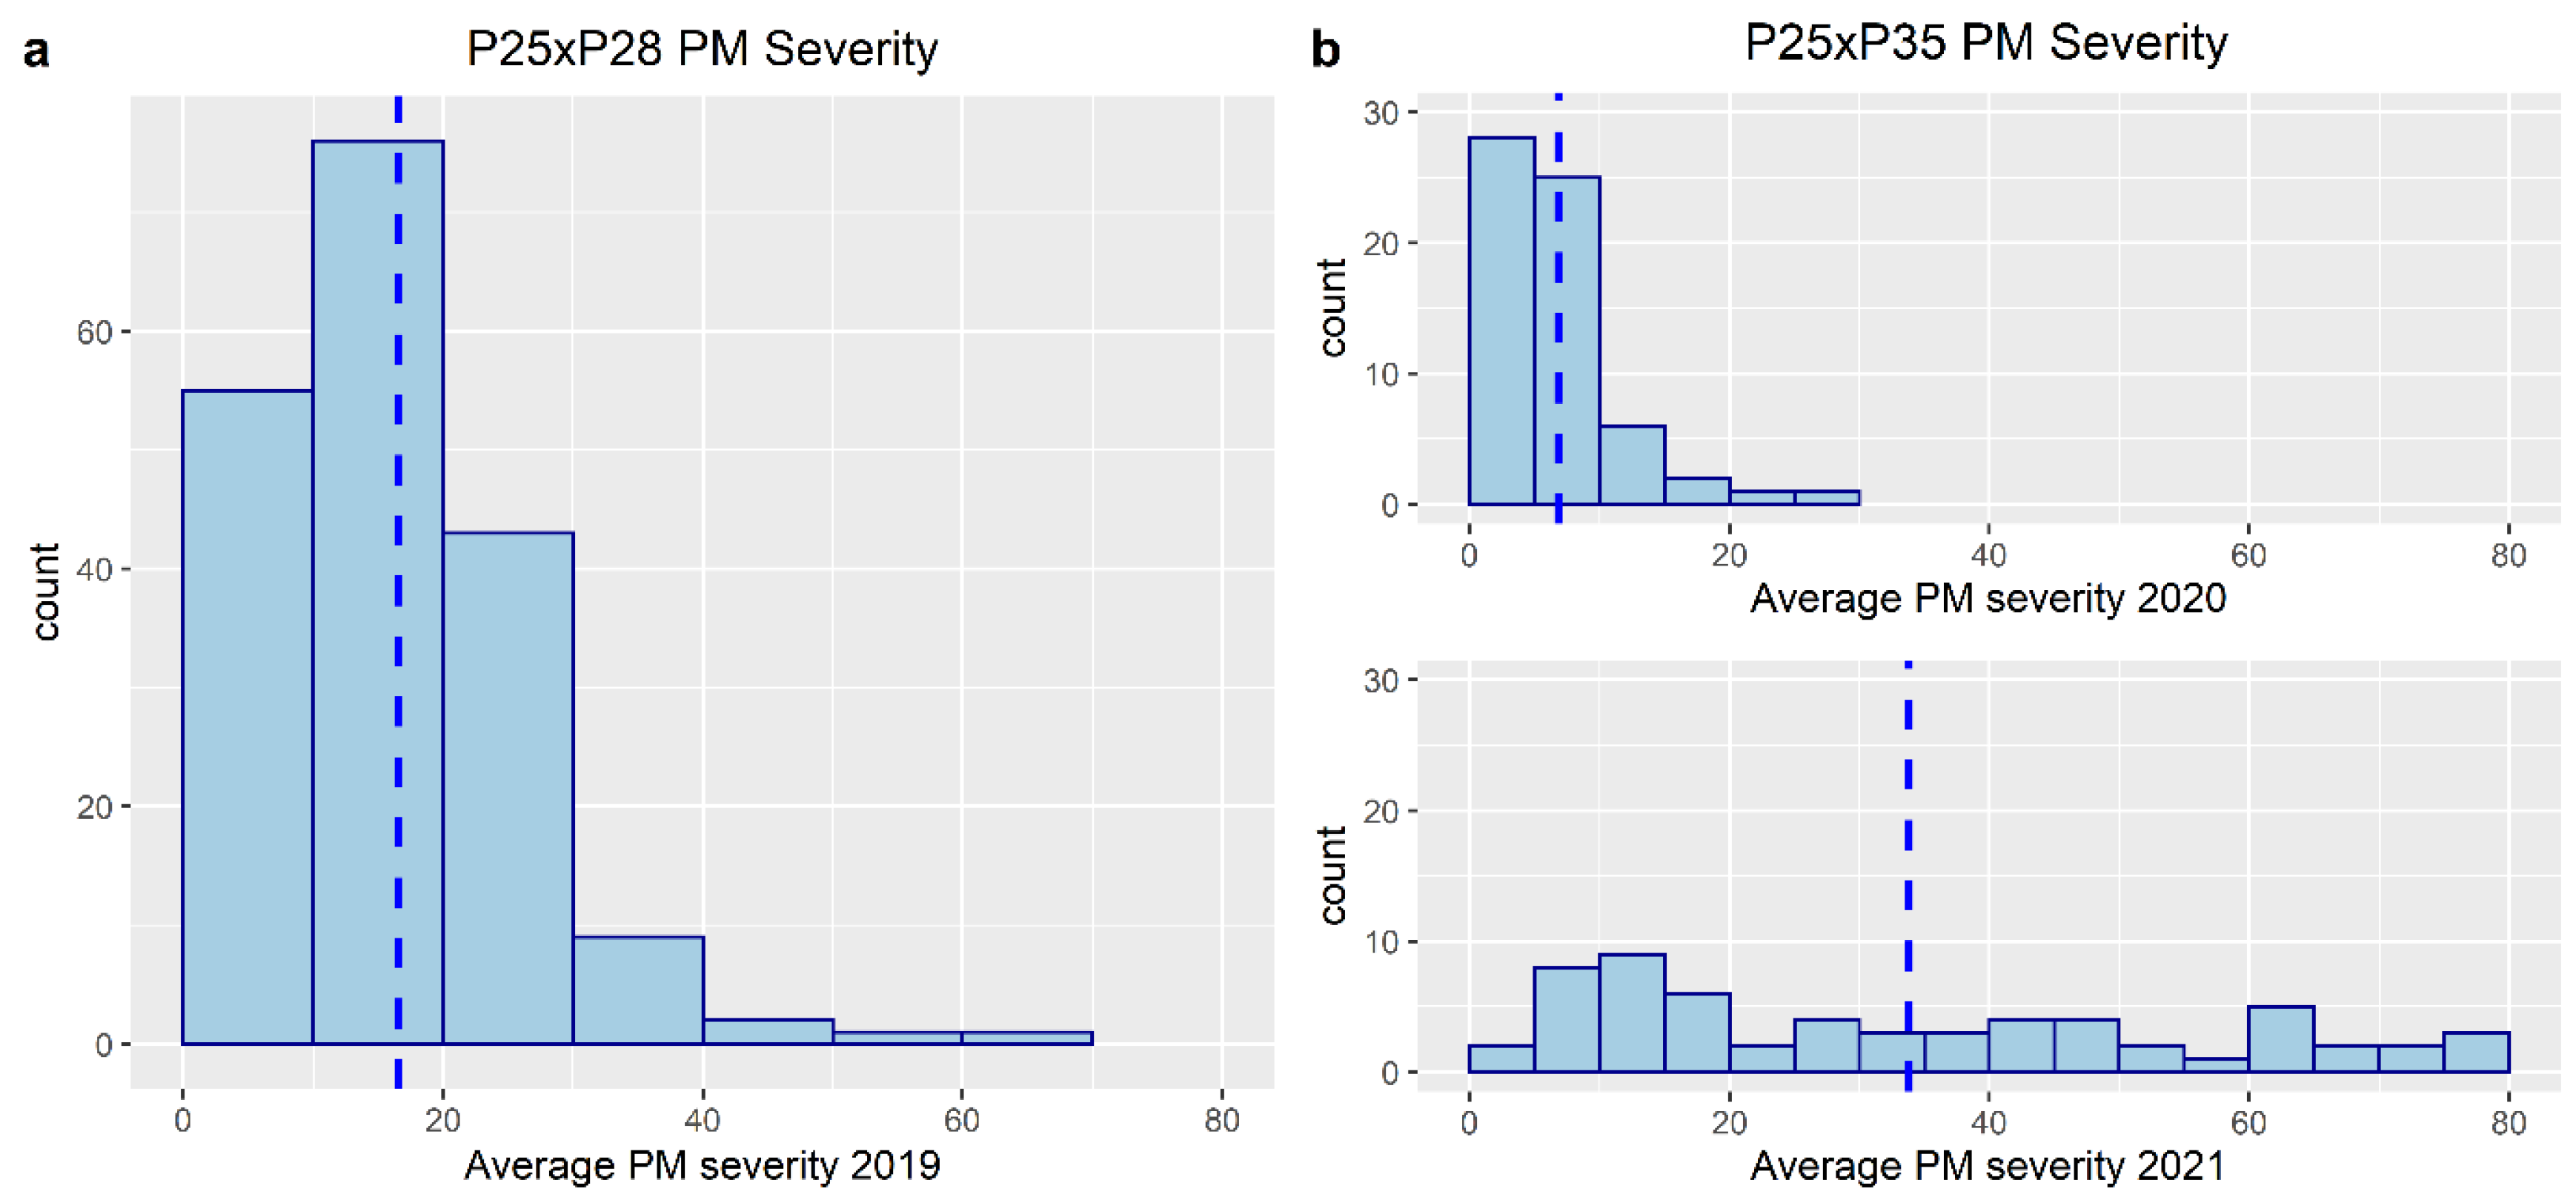
3.1. Phenotyping
3.2. Sequencing Statistics and SNP Marker Discovery
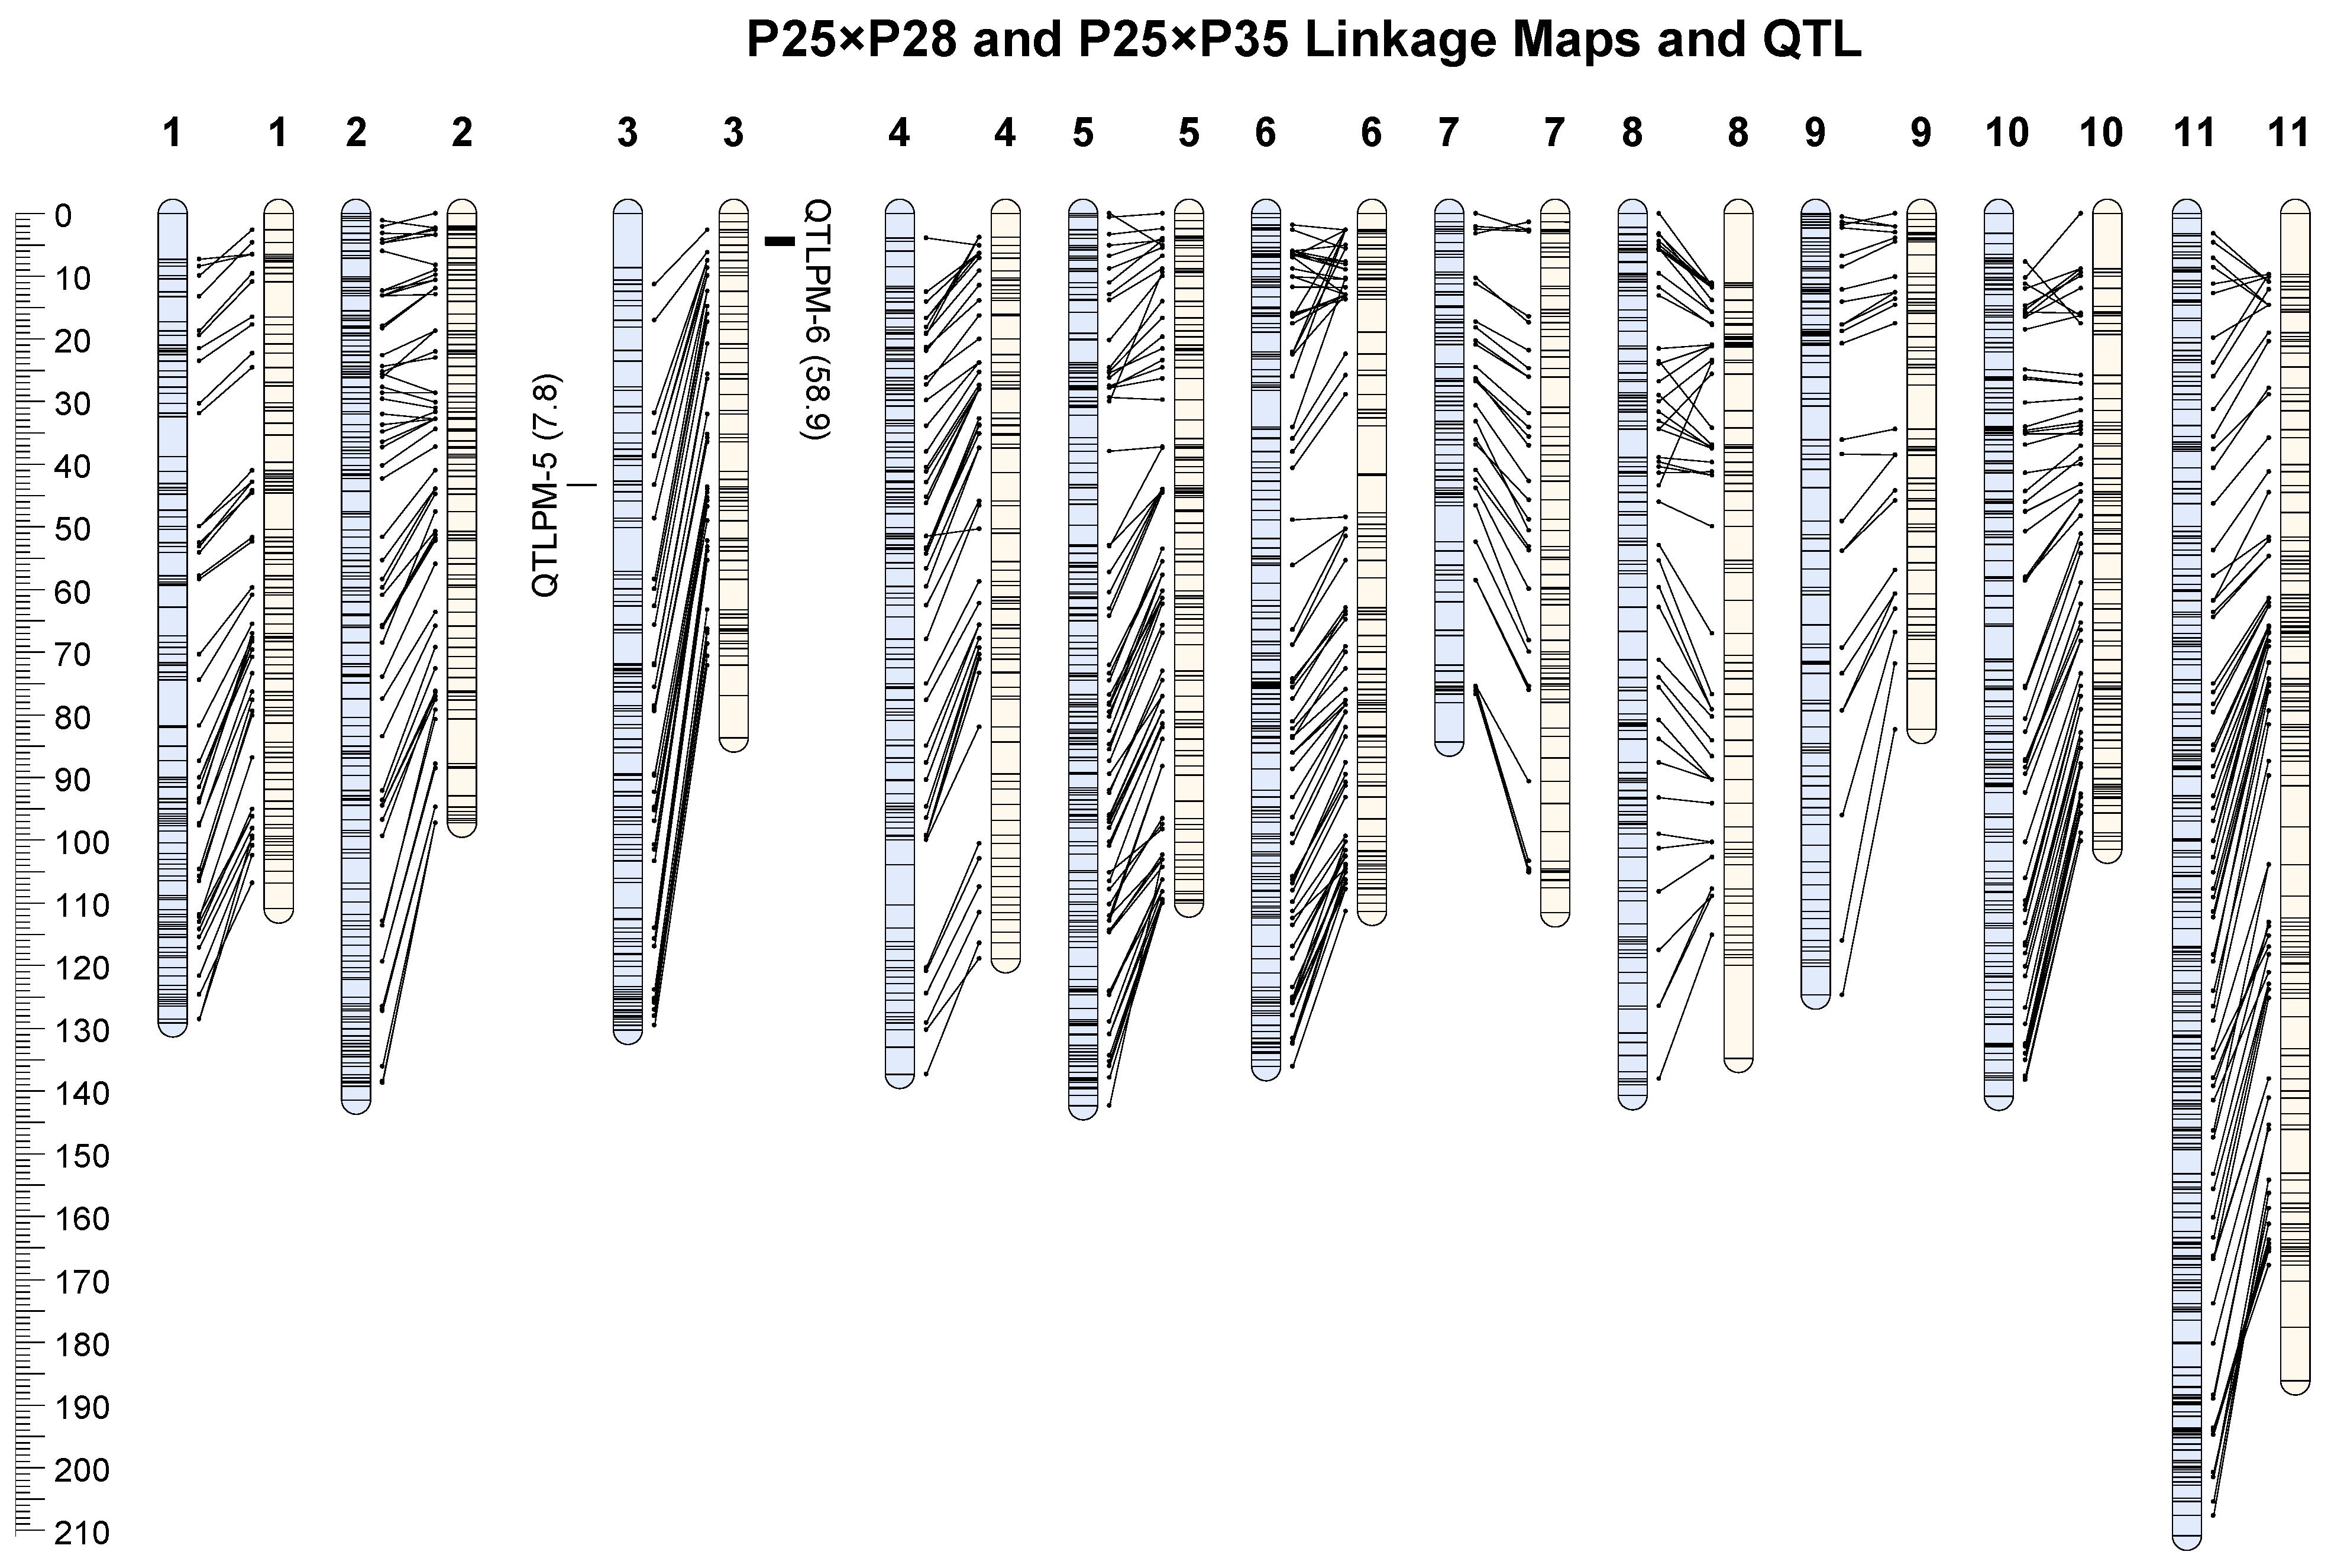
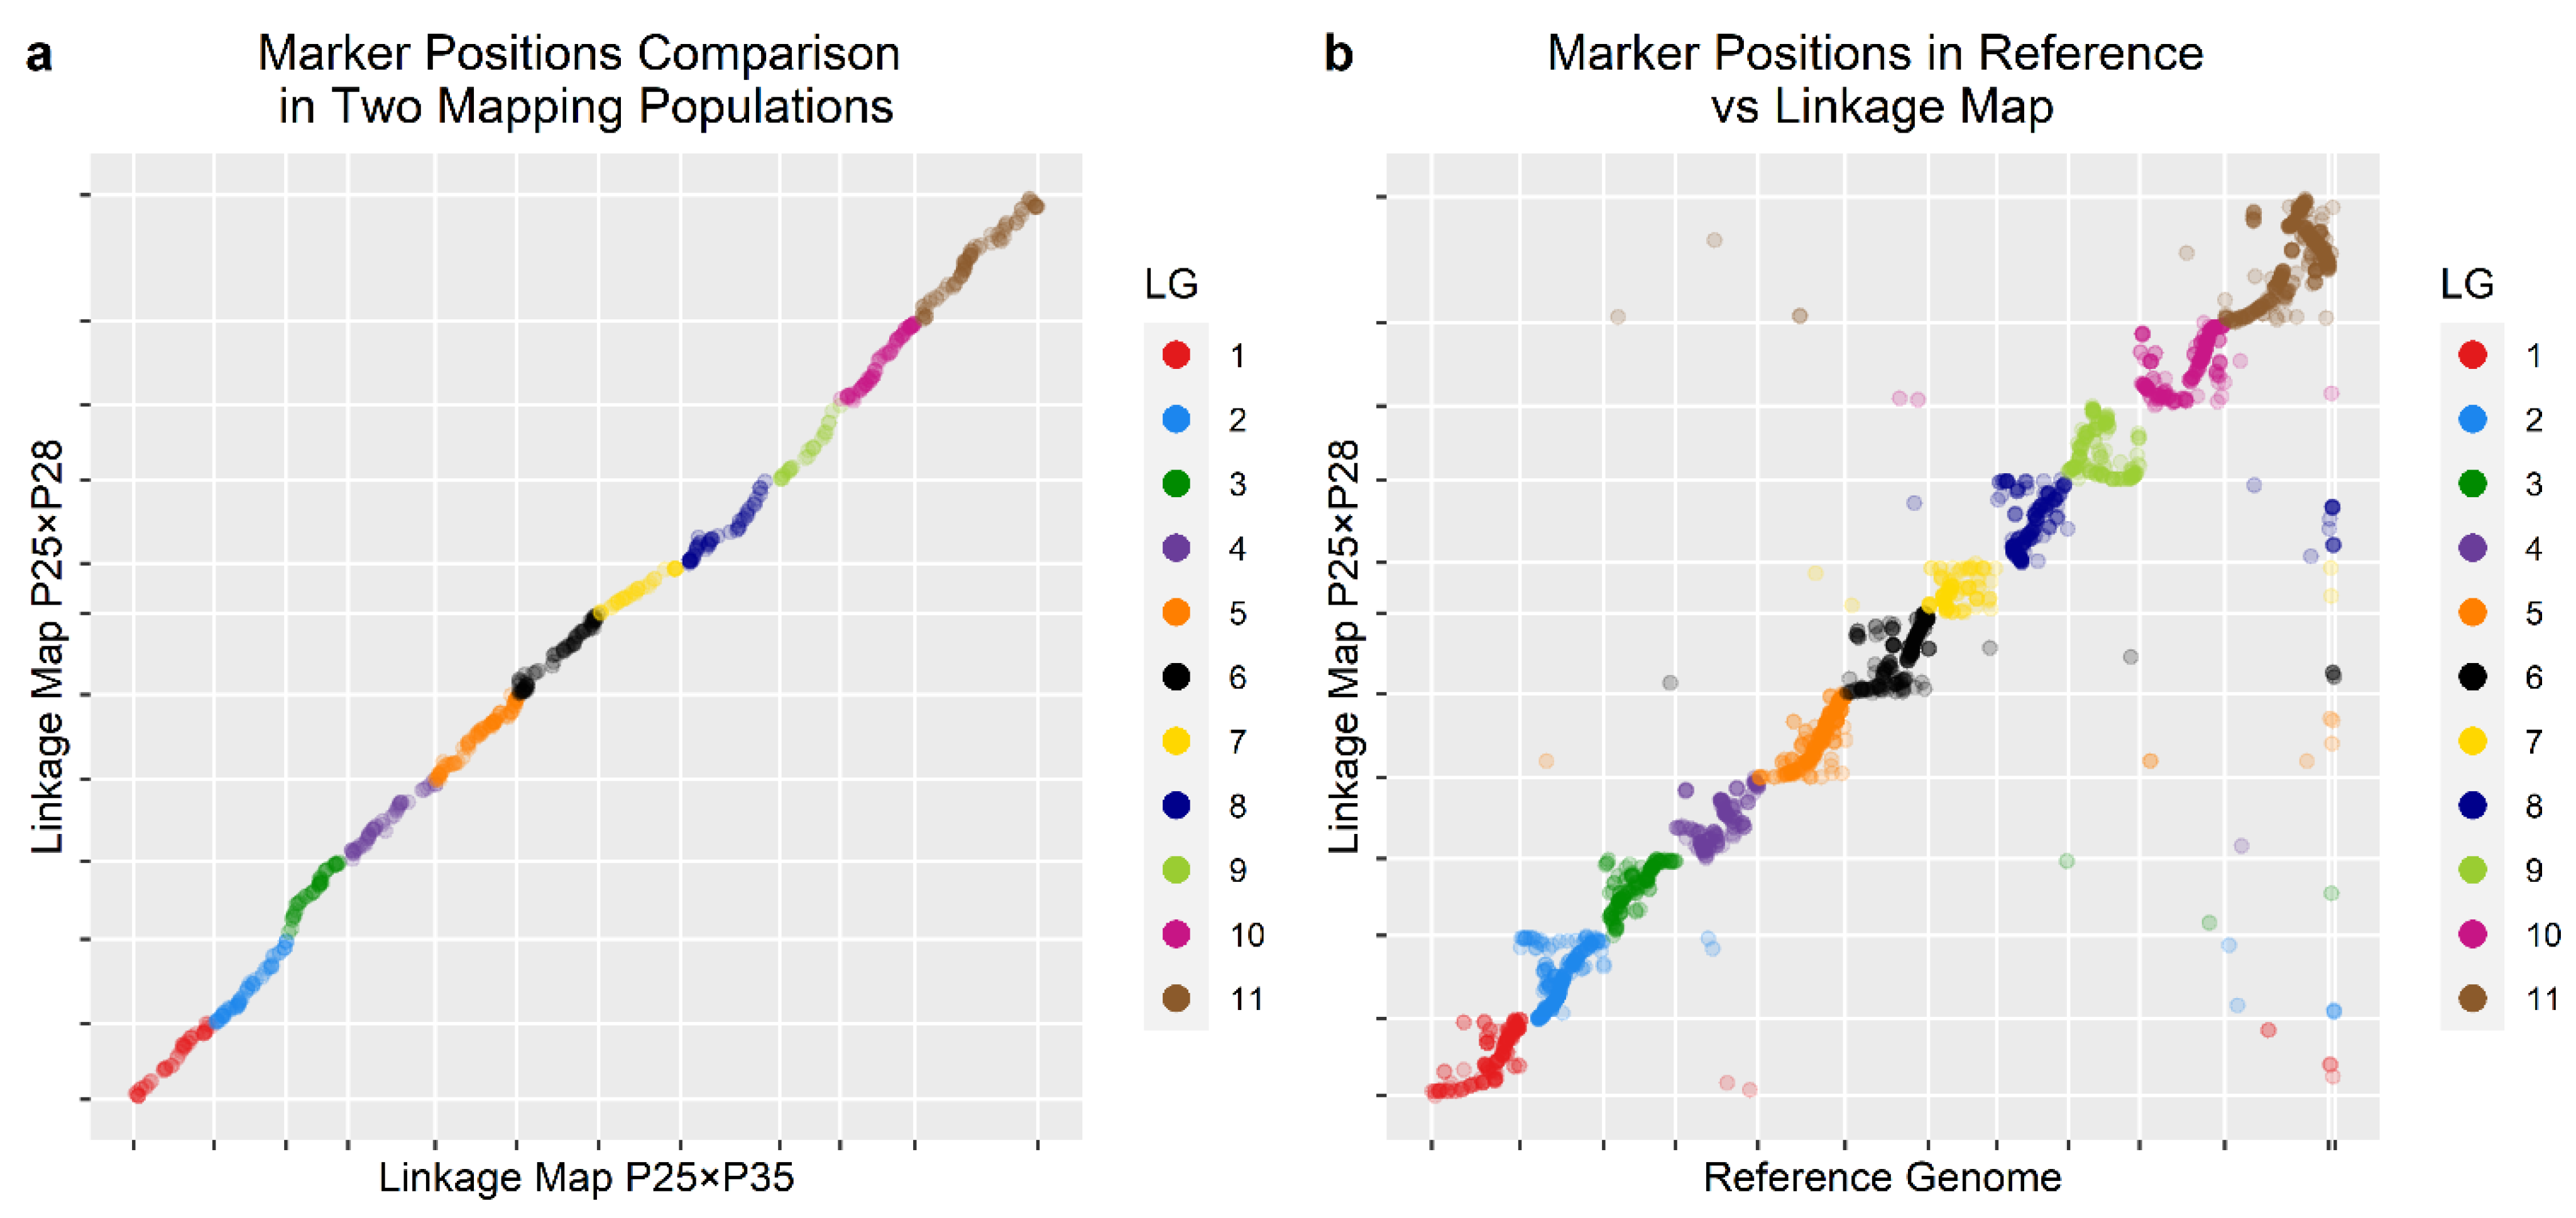
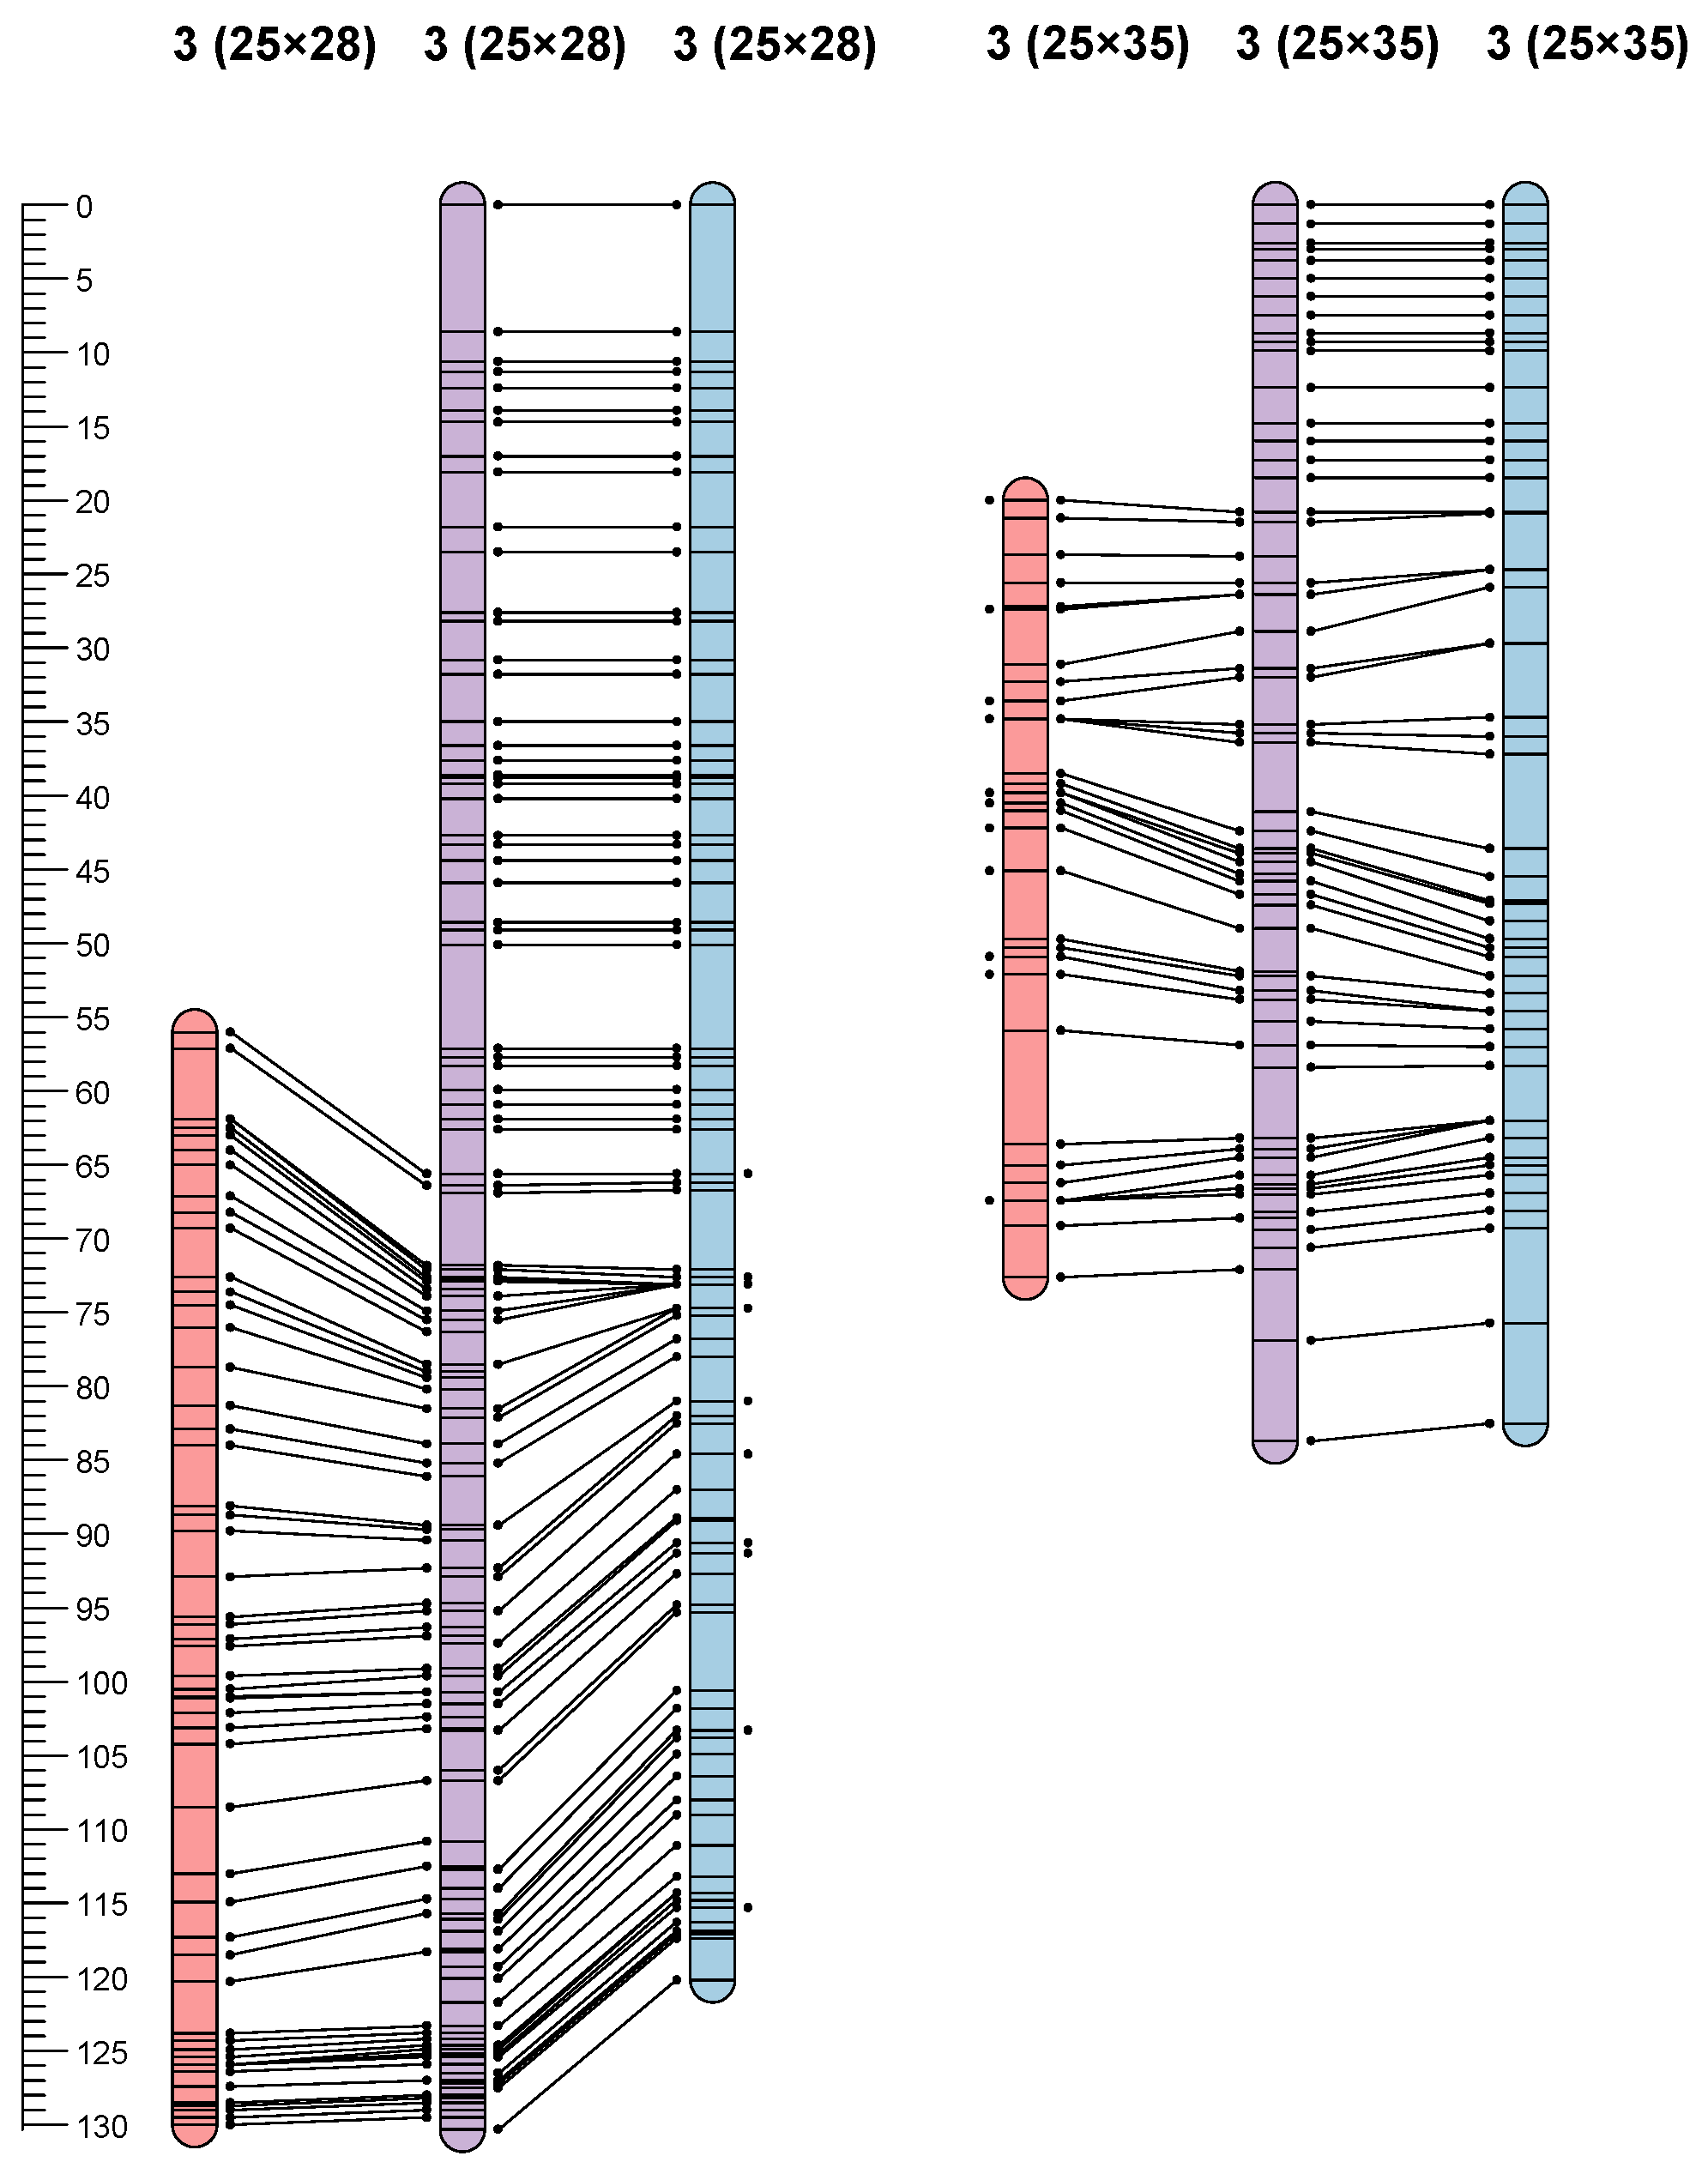
3.3. Linkage Maps
3.4. QTL Mapping
4. Discussion
5. Conclusions
Supplementary Materials
Author Contributions
Funding
Data Availability Statement
Acknowledgments
Conflicts of Interest
References
- United States Department of Agriculture. 2017 Census of Horticulture Specialities; National Agricultural Statistics Service: Washington, DC, USA, 2017.
- Windham, M.T.; Windham, A.S.; Halcomb, M.A. Enhancement of Growth of Flowering Dogwood by Using Fungicides to Control Powdery Mildew. In Proceedings of the The Southern Nursery Association Research Conference, Atlanta, GA, USA; 1999; pp. 208–209. [Google Scholar]
- Daughtrey, M.L.; Hagan, A.K. Dogwood Diseases. In Diseases on Woody Ornamentals and Trees in Nurseries; Jones, R.K., Benson, M.D., Eds.; APS Press: St. Paul, MN, USA, 2001; pp. 124–132. [Google Scholar]
- Dirr, M.A. Manual of Woody Landscape Plants; Stipes Publishing: Champaign, IL, USA, 2009. [Google Scholar]
- Wyman, C.R.; Hadziabdic, D.; Boggess, S.L.; Rinehart, T.A.; Windham, A.; Wadl, P.; Trigiano, R.N. Low genetic diversity suggests the recent introduction of dogwood powdery mildew to North America. Plant Dis. 2019, 103, 2903–2912. [Google Scholar] [CrossRef] [PubMed] [Green Version]
- Mmbaga, M.T.; Klopfenstein, N.B.; Kim, M.-S.; Mmbaga, N. PCR based identification of Erysiphe pulchra and Phyllactinia guttata from Cornus florida using ITS specific primers. For. Pathol. 2004, 34, 321–328. [Google Scholar] [CrossRef] [Green Version]
- Rotich, E.; Mmbaga, M.T.; Joshua, J. Biological control of powdery mildew on Cornus florida using endophytic Bacillus thuringiensis. Can. J. Plant Pathol. 2020, 42, 182–191. [Google Scholar] [CrossRef]
- Mmbaga, M.T.; Sauvé, R.J. Multiple disease resistance in dogwoods (Cornus spp.) to foliar pathogens. J. Arboric. 2004, 30, 101–107. [Google Scholar] [CrossRef]
- Windham, M.T.; Witte, W.T.; Trigiano, R.N. Three White-bracted Cultivars of Cornus florida Resistant to Powdery Mildew. HortScience 2003, 38, 1253–1255. [Google Scholar] [CrossRef] [Green Version]
- Cappiello, P.; Shadow, D. Dogwoods: The Genus Cornus; Timber Press Incorporated: Portland, Oregon, 2005. [Google Scholar]
- Molnar, T. Breeding Powdery Mildew Resistant Dogwoods and More at Rutgers University. In Proceedings of the International Plant Propagator’s Socienty, Chattanooga, TN, USA, 21–24 October 2018; pp. 385–395. [Google Scholar]
- Li, Y.; Mmbaga, M.T.; Windham, A.S.; Windham, M.T.; Trigiano, R.N. Powdery Mildew of Dogwoods: Current Status and Future Prospects. Plant Dis. 2009, 93, 1084–1092. [Google Scholar] [CrossRef] [Green Version]
- Reed, S.M. Self-incompatibility in Cornus florida. HortScience 2004, 39, 335–338. [Google Scholar] [CrossRef] [Green Version]
- Windham, M.T.; Witte, W.T. Naturally Occurring Resistance to Powdery Mildew in Seedlings of Cornus florida. J. Environ. Hortic. 1998, 16, 173–177. [Google Scholar] [CrossRef]
- Gardner, J.G.; Eastwood, D.B.; Brooker, J.R.; Riley, J.B.; Klingeman, W.E. Consumers’ Willingness-to-Pay for Powdery Mildew Resistant Dogwoods; The University of Tennessee: Knoxville, TN, USA, 2011. [Google Scholar]
- Gardner, J.G.; Eastwood, D.B.; Hall, C.R.; Brooker, J.R. Pricing Powdery-mildew-resistant Dogwoods: Simulated Impacts on the Nursery-industry Supply Chain. HortTechnology Horttech 2004, 14, 114–119. [Google Scholar] [CrossRef] [Green Version]
- Wang, X.; Wadl, P.; Rinehart, T.; EScheffler, B.E.; Windham, M.; Spiers, J.M.; Johnson, D.H.; Trigiano, R. A linkage map for flowering dogwood (Cornus florida L.) based on microsatellite markers. Euphytica 2009, 165, 165–175. [Google Scholar] [CrossRef]
- Dermen, H. Cytological studies of Cornus. J. Arnold Arbor. 1932, 13, 410–416. [Google Scholar] [CrossRef]
- Wadl, P.A.; Saxton, A.M.; Wang, X.; Pantalone, V.R.; Rinehart, T.A.; Trigiano, R.N. Quantitative trait loci associated with red foliage in Cornus florida L. Mol. Breed. 2011, 27, 409–416. [Google Scholar] [CrossRef]
- Parikh, L.; Mmbaga, M.; Meru, G.; Zhang, G.; Mackasmiel, L.; Wadl, P.; Wang, X.; Trigiano, R. Quantitative trait loci associated with resistance to powdery mildew in Cornus florida. Sci. Hortic. 2017, 226, 322–326. [Google Scholar] [CrossRef]
- Elshire, R.J.; Glaubitz, J.C.; Sun, Q.; Poland, J.A.; Kawamoto, K.; Buckler, E.S.; Mitchell, S.E. A Robust, Simple Genotyping-by-Sequencing (GBS) Approach for High Diversity Species. PLoS ONE 2011, 6, e19379. [Google Scholar] [CrossRef] [Green Version]
- Poland, J.A.; Rife, T.W. Genotyping-by-Sequencing for Plant Breeding and Genetics. Plant Genome 2012, 5. [Google Scholar] [CrossRef] [Green Version]
- Kushwah, A.; Bhatia, D.; Rani, U.; Yadav, I.S.; Singh, I.; Bharadwaj, C.; Singh, S. Molecular mapping of quantitative trait loci for ascochyta blight and botrytis grey mould resistance in an inter-specific cross in chickpea (Cicer arietinum L.) using genotyping by sequencing. Breed. Sci. 2021, 71, 229–239. [Google Scholar] [CrossRef]
- Honig, J.A.; Muehlbauer, M.F.; Capik, J.M.; Kubik, C.; Vaiciunas, J.N.; Mehlenbacher, S.A.; Molnar, T.J. Identification and Mapping of Eastern Filbert Blight Resistance Quantitative Trait Loci in European Hazelnut Using Double Digestion Restriction Site Associated DNA Sequencing. J. Am. Soc. Hortic. Sci. J. Amer. Soc. Hort. Sci. 2019, 144, 295–304. [Google Scholar] [CrossRef] [Green Version]
- Wu, X.; Hulse-Kemp, A.M.; Wadl, P.A.; Smith, Z.; Mockaitis, K.; Staton, M.E.; Rinehart, T.A.; Alexander, L.W. Genomic Resource Development for Hydrangea (Hydrangea macrophylla (Thunb.) Ser.)—A Transcriptome Assembly and a High-Density Genetic Linkage Map. Horticulturae 2021, 7, 25. [Google Scholar] [CrossRef]
- Seki, K.; Komatsu, K.; Hiraga, M.; Tanaka, K.; Uno, Y.; Matsumura, H. Identification of two QTLs for resistance to Fusarium wilt race 1 in lettuce (Lactuca sativa L.). Euphytica 2020, 216, 174. [Google Scholar] [CrossRef]
- Luo, H.; Guo, J.; Yu, B.; Chen, W.; Zhang, H.; Zhou, X.; Chen, Y.; Huang, L.; Liu, N.; Ren, X.; et al. Construction of ddRADseq-Based High-Density Genetic Map and Identification of Quantitative Trait Loci for Trans-resveratrol Content in Peanut Seeds. Front. Plant Sci. 2021, 12. [Google Scholar] [CrossRef]
- Bentley, N.; Grauke, L.J.; Ruhlman, E.; Klein, R.R.; Kubenka, K.; Wang, X.; Klein, P. Linkage mapping and QTL analysis of pecan (Carya illinoinensis) full-siblings usinggenotyping-by-sequencing. Tree Genet. Genomes 2020, 16, 83. [Google Scholar] [CrossRef]
- Yol, E.; Basak, M.; Kızıl, S.; Lucas, S.J.; Uzun, B. A High-Density SNP Genetic Map Construction Using ddRAD-Seq and Mapping of Capsule Shattering Trait in Sesame. Front. Plant Sci. 2021, 12, 6444402. [Google Scholar] [CrossRef]
- Pfarr, E.L.; Vaiciunas, J.; Kubik, C.; Capik, J.; Honig, J.; Molnar, T.J. Pollen flow in a flowering dogwood (Cornus florida L.) orchard: Using SSRs to develop a quantitative trait loci mapping population. In Proceedings of the Woody Onamentals of the Temperate Zone Conference, Torino, Italy, 3–4 March 2021; pp. 57–62. [Google Scholar]
- R Core Team. R: A Language and Environment for Statistical Computing; R Foundation for Statistical Computing: Vienna, Austria, 2020. [Google Scholar]
- Wickham, H. ggplot2: Elegant Graphics for Data Analysis; Springer: New York, NY, USA, 2016. [Google Scholar]
- Auguie, B. gridExtra: Miscellaneous Functions for “Grid” Graphics; Comprehensive R Archive Network: Vienna, Austria, 2017. [Google Scholar]
- Poland, J.A.; Brown, P.J.; Sorrells, M.E.; Jannink, J.-L. Development of High-Density Genetic Maps for Barley and Wheat Using a Novel Two-Enzyme Genotyping-by-Sequencing Approach. PLoS ONE 2012, 7, e32253. [Google Scholar] [CrossRef] [PubMed] [Green Version]
- Catchen, J.M.; Amores, A.; Hohenlohe, P.; Cresko, W.; Postlethwait, J.H. Stacks: Building and genotyping Loci de novo from short-read sequences. G3 (Bethesda Md.) 2011, 1, 171–182. [Google Scholar] [CrossRef] [PubMed] [Green Version]
- Rochette, N.C.; Rivera-Colón, A.G.; Catchen, J.M. Stacks 2: Analytical methods for paired-end sequencing improve RADseq-based population genomics. Mol. Ecol. 2019, 28, 4737–4754. [Google Scholar] [CrossRef] [PubMed]
- Paris, J.R.; Stevens, J.R.; Catchen, J.M. Lost in parameter space: A road map for stacks. Methods Ecol. Evol. 2017, 8, 1360–1373. [Google Scholar] [CrossRef]
- Bewick, A.; Leebens-Mack, J. Cornus florida Reference Genome. Available online: https://genomevolution.org/coge/GenomeInfo.pl?gid=53870 (accessed on 1 June 2020).
- Li, H.; Durbin, R. Fast and accurate short read alignment with Burrows-Wheeler transform. Bioinformatics 2009, 25, 1754–1760. [Google Scholar] [CrossRef] [Green Version]
- Van Ooijen, J.W. Multipoint maximum likelihood mapping in a full-sib family of an outbreeding species. Genet. Res. 2011, 93, 343–349. [Google Scholar] [CrossRef]
- Van Ooijen, J.W. JoinMap® 4, Software for the Calculation of Genetic Linkage Maps in Experimental Populations; Kyazma B.V.: Wageningen, The Netherlands, 2006. [Google Scholar]
- Grattapaglia, D.; Sederoff, R. Genetic linkage maps of Eucalyptus grandis and Eucalyptus urophylla using a pseudo-testcross: Mapping strategy and RAPD markers. Genetics 1994, 137, 1121–1137. [Google Scholar] [CrossRef]
- Van Ooijen, J.W. MapQTL® 6, Software for the Mapping of Quantitative Trait Loci in Experimental Populations of Diploid Species; Kyazma B.V.: Wageningen, The Netherlands, 2009. [Google Scholar]
- Voorrips, R.E. MapChart: Software for the Graphical Presentation of Linkage Maps and QTLs. J. Hered. 2002, 93, 77–78. [Google Scholar] [CrossRef] [PubMed] [Green Version]
- Kassambara, A. ggpubr: ‘ggplot2’ Based Publication Ready Plots; Comprehensive R Archive Network: Vienna, Austria, 2020. [Google Scholar]
- Santos, E.A.; Viana, A.P.; de Barros Walter, F.H.; de Oliveira Freitas, J.C.; Ramos, H.C.C.; Boechat, M.S.B. First report of a genetic map and evidence of QTL for resistance to CABMV in a segregating population of Passiflora. Eur. J. Plant Pathol. 2019, 155, 903–915. [Google Scholar] [CrossRef]
- Aradhya, M.K.; Velasco, D.; Wang, J.-R.; Ramasamy, R.; You, F.M.; Leslie, C.; Dandekar, A.; Luo, M.-C.; Dvorak, J. A fine-scale genetic linkage map reveals genomic regions associated with economic traits in walnut (Juglans regia). Plant Breed. 2019, 138, 635–646. [Google Scholar] [CrossRef]
- Moreau, E.L.; Wait, A.; Honig, J.A.; Molnar, T.J. A Genetic Diversity Study of Big-Bracted Dogwood (Cornus spp.) Cultivars, Breeding Selections, and Wild-Collected Plants; Manuscript in preparation; Rutgers University: New Brunwsick, NJ, USA.


| Linkage Group | Mapping Population | Number of Markers | Total Distance (cM) | Average Distance (cM/marker) | Maximum Gap (cM) |
|---|---|---|---|---|---|
| LG1 | P25 × P28 | 174 | 130.2 | 0.75 | 7.3 |
| P25 × P35 | 154 | 110.9 | 0.72 | 5.8 | |
| LG2 | P25 × P28 | 239 | 141.4 | 0.59 | 3.9 |
| P25 × P35 | 159 | 97.2 | 0.61 | 7.1 | |
| LG3 | P25 × P28 | 155 | 130.3 | 0.84 | 8.6 |
| P25 × P35 | 132 | 83.7 | 0.63 | 6.8 | |
| LG4 | P25 × P28 | 176 | 137.3 | 0.78 | 6.4 |
| P25 × P35 | 135 | 127.9 | 0.95 | 5.1 | |
| LG5 | P25 × P28 | 258 | 142.3 | 0.55 | 3.7 |
| P25 × P35 | 216 | 109.9 | 0.51 | 4.2 | |
| LG6 | P25 × P28 | 231 | 136.1 | 0.59 | 5.9 |
| P25 × P35 | 166 | 111.3 | 0.67 | 7.7 | |
| LG7 | P25 × P28 | 118 | 84.3 | 0.71 | 6.3 |
| P25 × P35 | 128 | 111.6 | 0.87 | 4.8 | |
| LG8 | P25 × P28 | 191 | 141.3 | 0.74 | 4.6 |
| P25 × P35 | 140 | 134.8 | 0.96 | 14.8 | |
| LG9 | P25 × P28 | 147 | 124.7 | 0.85 | 5.4 |
| P25 × P35 | 114 | 81.2 | 0.71 | 8 | |
| LG10 | P25 × P28 | 221 | 140.8 | 0.64 | 5.3 |
| P25 × P35 | 181 | 101.4 | 0.56 | 8.8 | |
| LG11 | P25 × P28 | 355 | 210.9 | 0.59 | 3.8 |
| P25 × P35 | 263 | 186.1 | 0.71 | 9.7 | |
| Total | P25 × P28 | 2265 | 1520 | 0.69 | |
| P25 × P35 | 1788 | 1256 | 0.72 | ||
| Previously published map | 255 | 1175 | 4.6 | ||
| Contig in Reference Genome | Linkage Group in This Study | Linkage Group in Wang et al. [17] |
|---|---|---|
| 1 | LG1 | LG9 |
| 2 | LG2 | LG10 |
| 3 | LG3 | LG5 |
| 4 | LG4 | LG2 |
| 5 | LG5 | LG8 |
| 6 | LG6 | LG6 |
| 7 | LG7 | LG1 |
| 8 | LG8 | LG11 |
| 9 | LG9 | LG4 |
| 10 | LG10 | LG3 |
| 0 | LG11 | LG7 |
| QTL | Population | LG | Position (cM) | LOD | R2 | Marker(s) | Additive Effect |
|---|---|---|---|---|---|---|---|
| QTLPM-5 | P25 × P28 | 3 | 43.3 | 3.30 | 7.8 | 799 | −5.82 |
| QTLPM-6 | P25 × P35 | 3 | 3.78–5.01 | 11.36 | 58.9 | 702 and 686 | −62.86 |
Publisher’s Note: MDPI stays neutral with regard to jurisdictional claims in published maps and institutional affiliations. |
© 2022 by the authors. Licensee MDPI, Basel, Switzerland. This article is an open access article distributed under the terms and conditions of the Creative Commons Attribution (CC BY) license (https://creativecommons.org/licenses/by/4.0/).
Share and Cite
Pfarr Moreau, E.; Honig, J.A.; Molnar, T.J. High-Density Linkage Mapping and Identification of Quantitative Trait Loci Associated with Powdery Mildew Resistance in Flowering Dogwood (Cornus florida). Horticulturae 2022, 8, 405. https://0-doi-org.brum.beds.ac.uk/10.3390/horticulturae8050405
Pfarr Moreau E, Honig JA, Molnar TJ. High-Density Linkage Mapping and Identification of Quantitative Trait Loci Associated with Powdery Mildew Resistance in Flowering Dogwood (Cornus florida). Horticulturae. 2022; 8(5):405. https://0-doi-org.brum.beds.ac.uk/10.3390/horticulturae8050405
Chicago/Turabian StylePfarr Moreau, Erin, Josh A. Honig, and Thomas J. Molnar. 2022. "High-Density Linkage Mapping and Identification of Quantitative Trait Loci Associated with Powdery Mildew Resistance in Flowering Dogwood (Cornus florida)" Horticulturae 8, no. 5: 405. https://0-doi-org.brum.beds.ac.uk/10.3390/horticulturae8050405