Article

A Fruit Colour Development Index (CDI) to Support Harvest Time Decisions in Peach and Nectarine Orchards

1
Tatura SmartFarm, Agriculture Victoria, Tatura, VIC 3616, Australia
2
Centre for Agricultural Innovation, University of Melbourne, Parkville, VIC 3010, Australia
*
Author to whom correspondence should be addressed.
Submission received: 19 April 2022 / Revised: 5 May 2022 / Accepted: 18 May 2022 / Published: 19 May 2022
(This article belongs to the Special Issue Precision Management of Fruit Trees)

Abstract

:
Fruit skin colour is one of the most important visual fruit quality parameters driving consumer preferences. Proximal sensors such as machine vision cameras can be used to detect skin colour in fruit visible in collected images, but their accuracy in variable orchard light conditions remains a practical challenge. This work aimed to derive a new fruit skin colour attribute—namely a Colour Development Index (CDI), ranging from 0 to 1, that intuitively increases as fruit becomes redder—to assess colour development in peach and nectarine fruit skin. CDI measurements were generated from high-resolution images collected on both east and west sides of the canopies of three peach and one nectarine cultivars using the commercial mobile platform Cartographer (Green Atlas). Fruit colour (RGB values) was extracted from the central pixels of detected fruit and converted into a CDI. The repeatability of CDI measurements under different light environments was tested by scanning orchards at different times of the day. The effects of cultivar and canopy side on CDI were also determined. CDI data was related to the index of absorbance difference (IAD)—an index of chlorophyll degradation that was correlated with ethylene emission—and its response to time from harvest was modelled. The CDI was only significantly altered when measurements were taken in the middle of the morning or in the middle of the afternoon, when the presence of the sun in the image caused significant alteration of the image brightness. The CDI was tightly related to IAD, and CDI values plateaued (0.833 ± 0.009) at IAD ≤ 1.20 (climacteric onset) in ‘Majestic Pearl’ nectarine, suggesting that CDI thresholds show potential to be used for harvest time decisions and to support logistics. In order to obtain comparable CDI datasets to study colour development or forecast harvest time, it is recommended to scan peach and nectarine orchards at night, in the early morning, solar noon, or late afternoon. This study found that the CDI can serve as a standardised and objective skin colour index for peaches and nectarines.

1. Introduction

In a worldwide agriculture 4.0 [1] context, fruit growers are moving towards automating orchard management using artificial intelligence and robotics. In Australia, orchard labour is a volatile resource that often depends on the seasonal availability of casual workers. In addition, labour is becoming more expensive, contributing to the reduced profitability of fruit growing. Robots and artificial intelligence have the potential to reduce volatile costs such as labour and guarantee a standardised cost for a steady flow of orchard data that aims to support orchard management decisions and the production of consistently high-quality fruit.
Broadly, fruit skin colour, together with fruit size, is the most important visual fruit quality parameter driving consumer preferences and purchases at retail stores. Although the perception of colour is subjective, colour charts have traditionally supported a correct classification of fruit based on their skin colouration. Colour charts are prone to misinterpretation and are not ideal for workers with visual impairment. The use of colourimeters that measure colour in different colour spaces (e.g., RGB, CMYK, XYZ CIELab/LCh) can be found in the relevant literature, but they often required contact devices such as portable spectrometers [2]. For example, a* and hue angle were successfully linked to maturity in peach and nectarine [3,4,5,6,7], and hue angle was related to harvest time in ‘Majestic Pearl’ nectarines in a recent study [8]. These devices have proved reliable and useful for objectively measuring skin colour in different crops. Despite their suitability, these instruments have never been adopted on a large scale for fruit quality measurements in stone fruits such as peach, nectarine, plum and apricot. Most growers still rely on in situ visual observations and/or using commercial graders post-harvest. The former has the disadvantage of being a subjective classification that cannot be easily and reliably compared from season to season, whereas the latter are only used after fruit is picked, when it is too late to go back and improve fruit colouration with orchard operations such as the use of biostimulants, reflective mulch, leaf blowers or pruning.
Possible explanations for the lack of industry uptake of portable colourimeters and colour parameters such as a* or hue angle are: the complex interpretation of their scale (i.e., 0–60 and 0–360° for a* and hue angle, respectively), poor application to a vast range of crops and cultivars with diverse skin colour characteristics, sensor costs and relatively slow measurements leading to a limited sample size. For example, hue angle decreases as nectarine maturity increases, which is counterintuitive. Poor application of colourimeters for stone fruit maturity assessments may have derived from the fact that the literature suggests that mainly skin background colour significantly responds to fruit maturity [9] by decreasing chlorophyll concentration. However, although skin background colour is the main portion of fruit skin responding to fruit maturity variations in peach and nectarine, the overall average colour of each fruit also mutates along fruit ripening. These subtle variations can be imperceptible when fruit colour is assessed by human eyes but have the potential to be detected using machine vision. A more intuitive index for colour development is needed in order to reliably measure fruit colour in fruits with different skin colour characteristics and development trends as they approach harvest time.
Proximal sensors such as machine vision cameras can be used for fruit colour determination in large samples of fruit visible in the collected images. The first step is typically to apply a machine learning algorithm and train it to automate fruit detections that are often used to estimate fruit number. Afterwards, skin colour can be determined within the detection perimeter (e.g., box or circle) by defining the number of pixels for colour extraction. Accurate fruit colour measurements using proximal sensing techniques such as machine vision are strongly affected by external light [10,11]. In fact, external light such as direct or background sunlight can substantially alter the brightness and chromaticity of the pixels where fruit colour is measured, which in turn may cause a change in the most typical colour parameters used for stone fruit quality estimation (i.e., a* and hue angle). In cloudy conditions, light scattering creates relatively uniform light environments around tree canopies; thus, the influence of sunlight on colour assessment is likely to be similar in east- or west-facing fruit. In sunny conditions, direct or background sunlight and the presence and the angle of the sun in the background of collected images could lead to erroneous colour perception in the two sides of the canopy.
Green Atlas is an Australian commercial company that commercialises a ground-based platform—namely Cartographer—for predictions of important fruit tree crop parameters such as flower number, fruit number and canopy size, as previously validated in apples [12]. Green Atlas attempts to limit the external light effect by simultaneously flashing the canopies with strobe lights while collecting images so that image brightness is relatively standardised. Although Cartographer has been validated and used for measurements of fruit number, fruit colour and size in peach and nectarine cultivars [13], the consistency of fruit colour measurements in different light environments or time of the day, and the relationship between fruit colour and ripeness or harvest time need to be investigated to determine if scanning the orchards can provide a valuable tool to plan harvest time based on objective fruit colour thresholds.
This work aimed to (i) derive a fruit skin colour development index (CDI, ranging from 0 to 1) that can be easily calculated from hue angle data—a CIELab colour attribute that was successfully related to harvest time and maturity in stone fruit [3,4,5,6,7,8] using a fast-scanning mobile platform; (ii) determine the temporal variability of CDI readings when measurements are collected at different times of the day thereby providing changing light environments on different sides of the canopy; and (iii) test the relationship between the CDI and a conventional fruit maturity index used in peach and nectarine. One of our propositions was that collecting big data on the entire fruit population in an orchard block would offset the need to separate background and foreground skin colour for maturity estimation; thus, our premise is that the overall colour estimated on large samples of fruit in the orchard can support harvest decision making. In addition, we argue that the time of the day may influence colour values, but if measurements are collected in similar light environments, skin colour determination and forecasts of colour development have the potential to be used to schedule harvest decisions in peach and nectarine.

2. Materials and Methods

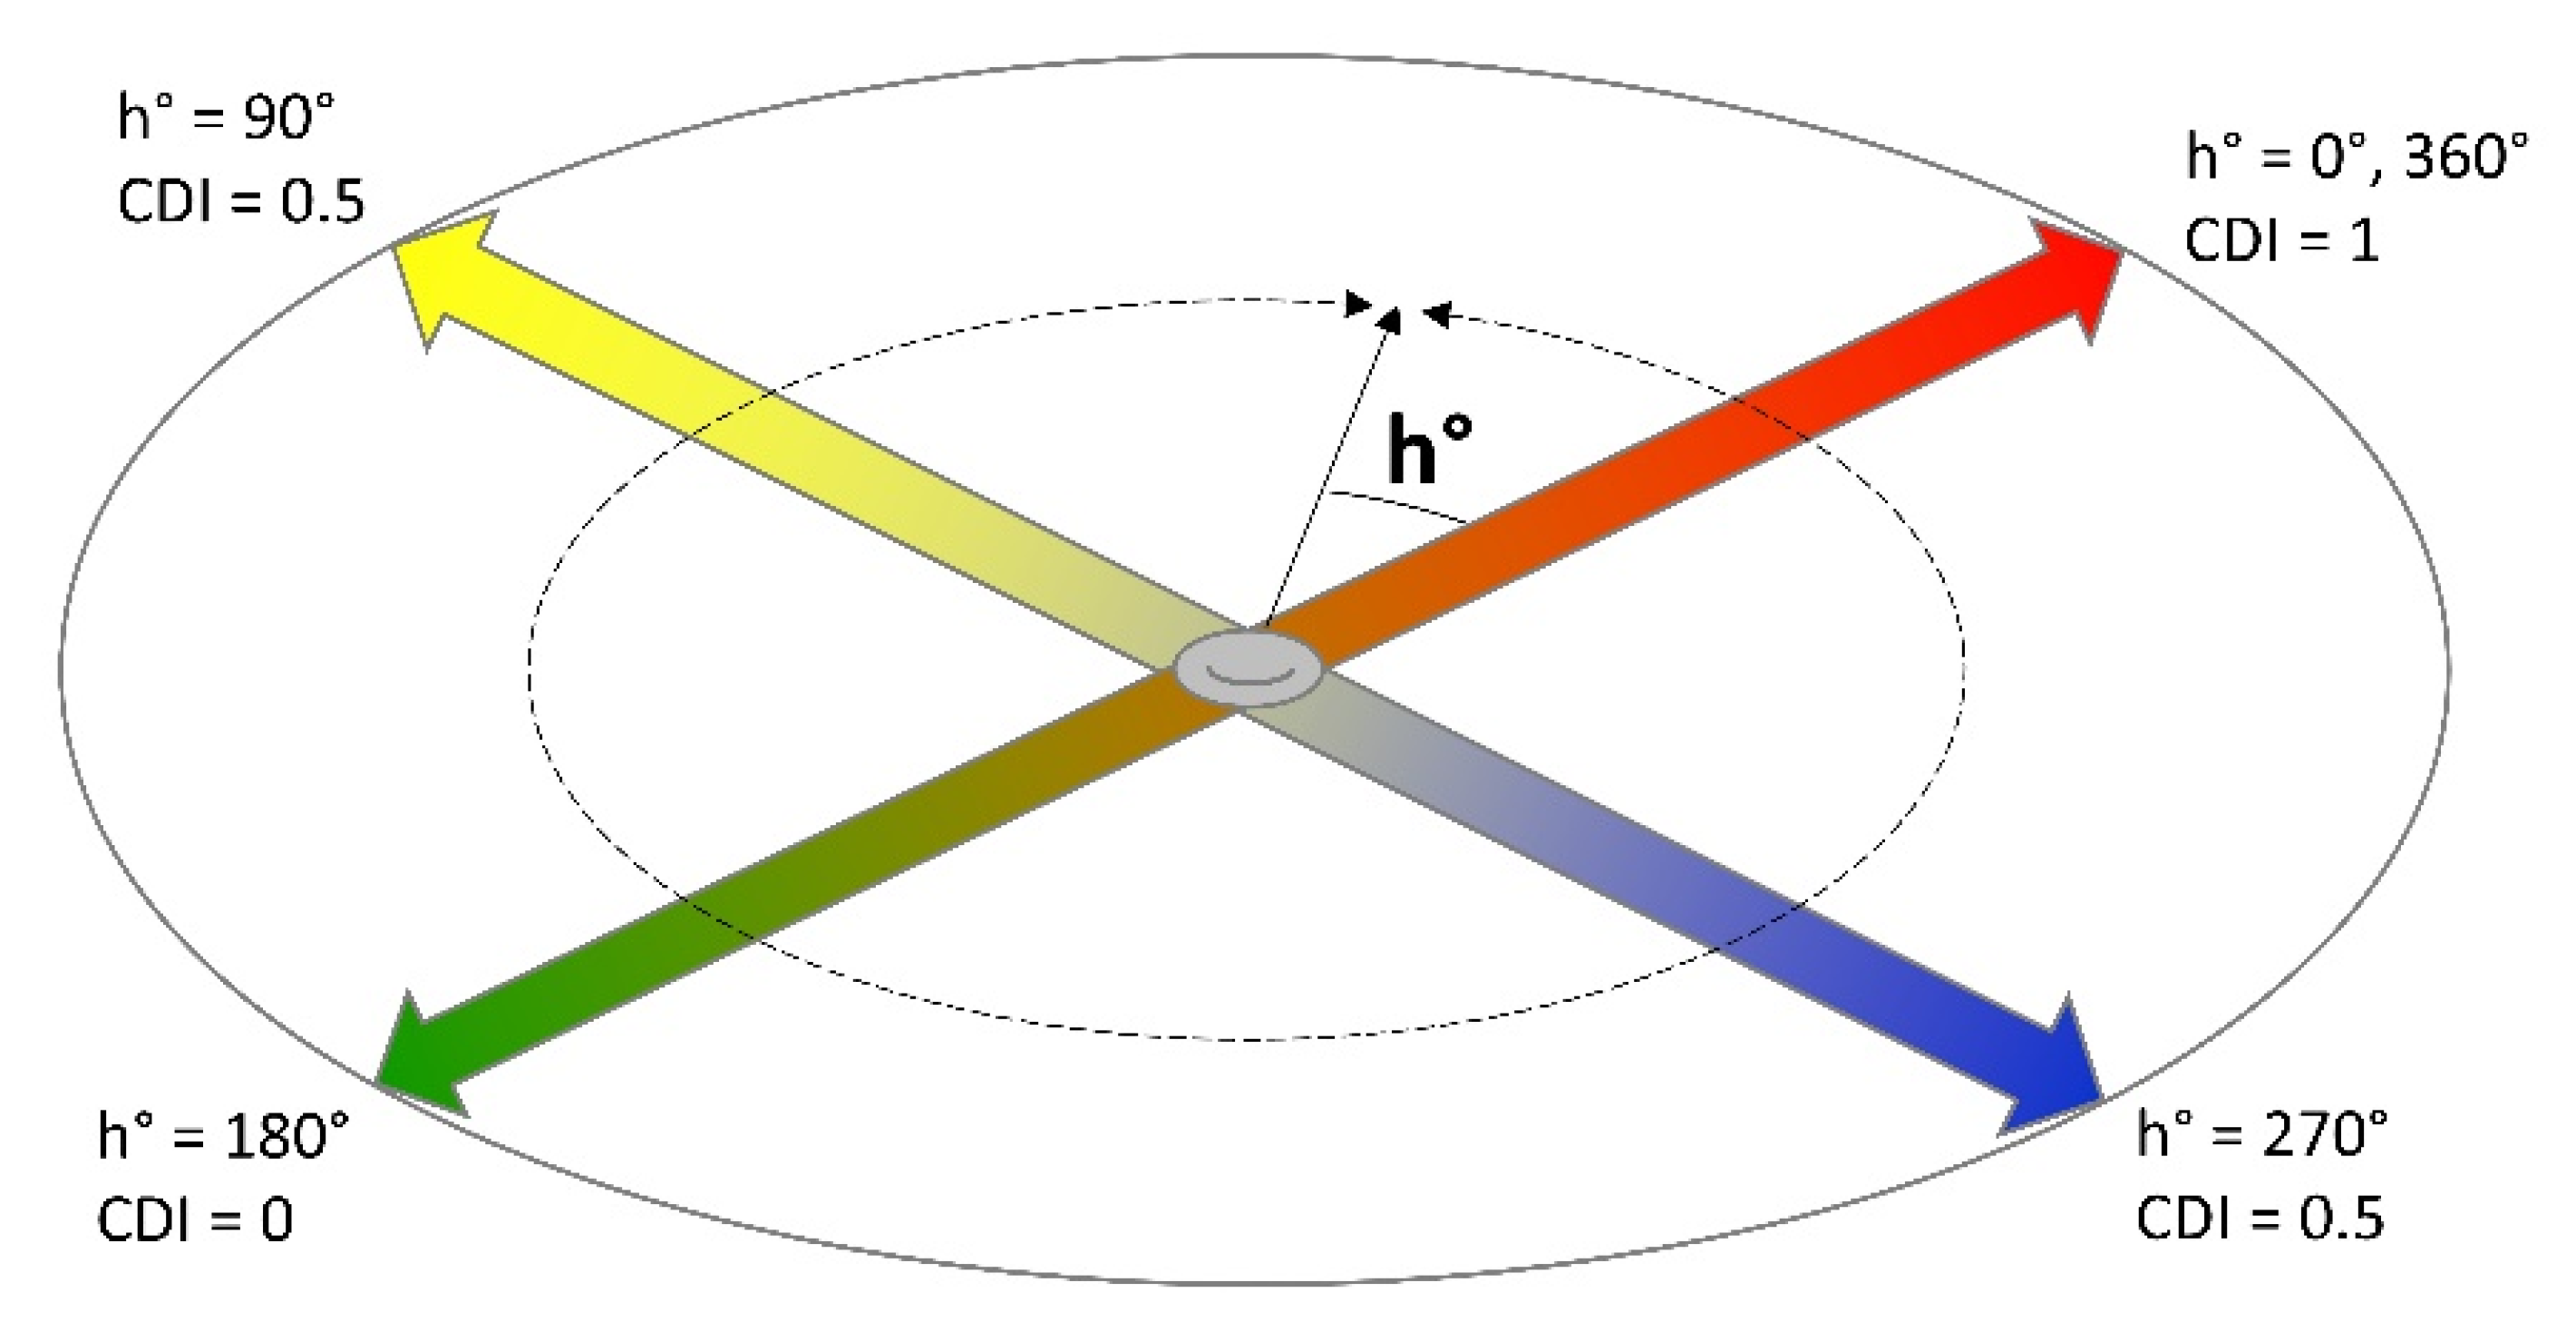
2.1. Colour Development Index (CDI)

Previous research has shown that hue angle (i.e., a colour attribute within the CIELab colour space) is a strong indicator of colour development in the skin and flesh of peach and nectarine fruit [8]. RGB values obtained with cameras or spectrophotometers can be converted to CIELab and hue angle obtained using a Python script [14]. Hue angle ranges from 0 to 360°, where 0° (or 360°) represents maximum redness, 90° maximum yellowness, 180° maximum greenness and 270° maximum blueness (Figure 1). As peach or nectarine skin transitions from green towards yellow, orange or red pigmentation, hue angle decreases accordingly. A more intuitive index of colour development, correlated with colour development in peach and nectarine, and ranging from 0 (pure green) to 1 (pure red) was derived from hue angle to simplify user-friendliness and improve application. This new parameter was named the Colour Development Index (CDI) and represented the departure from skin greenness towards yellowness, blueness or redness (Figure 1). The interpretation of the CDI does not require prior knowledge of the CIELab colour space as it intuitively increases as greenness is lost. The CDI was derived from hue angle (h°) using the formula shown in Equation (1).
CDI = |(h°/180) − 1|
The CDI developed in this study can be used in all the fruit that have skin colour departing from greenness towards yellow, orange, red, blue or purple. The CDI expected response in peach fruit ranging from green to red is shown in Figure 2.

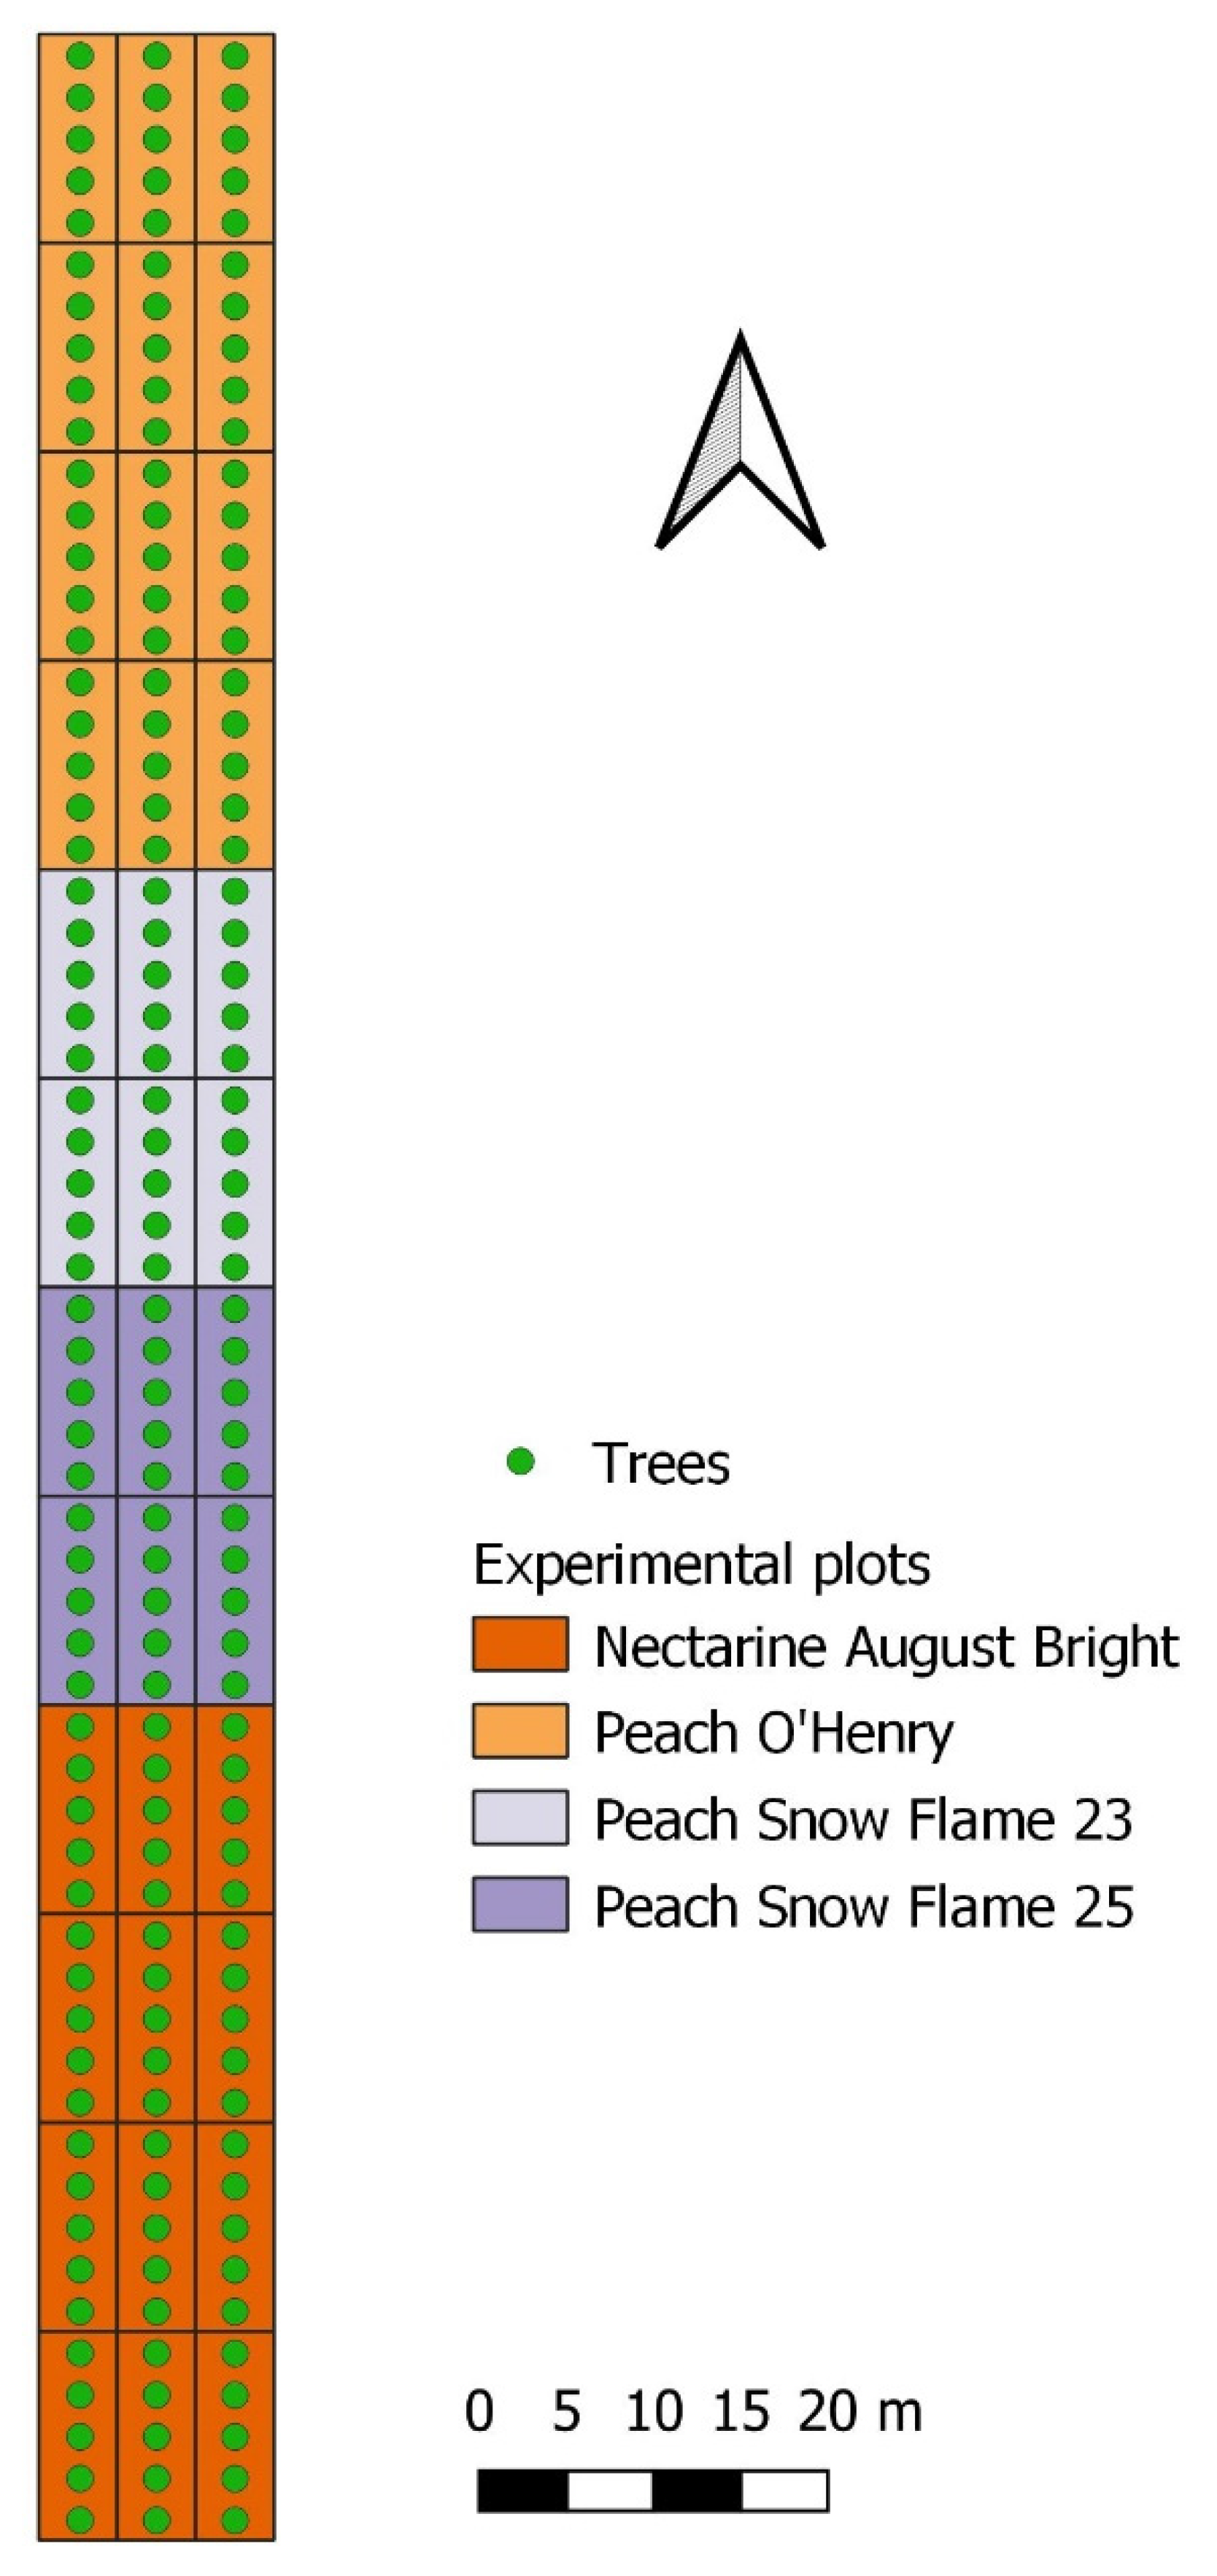
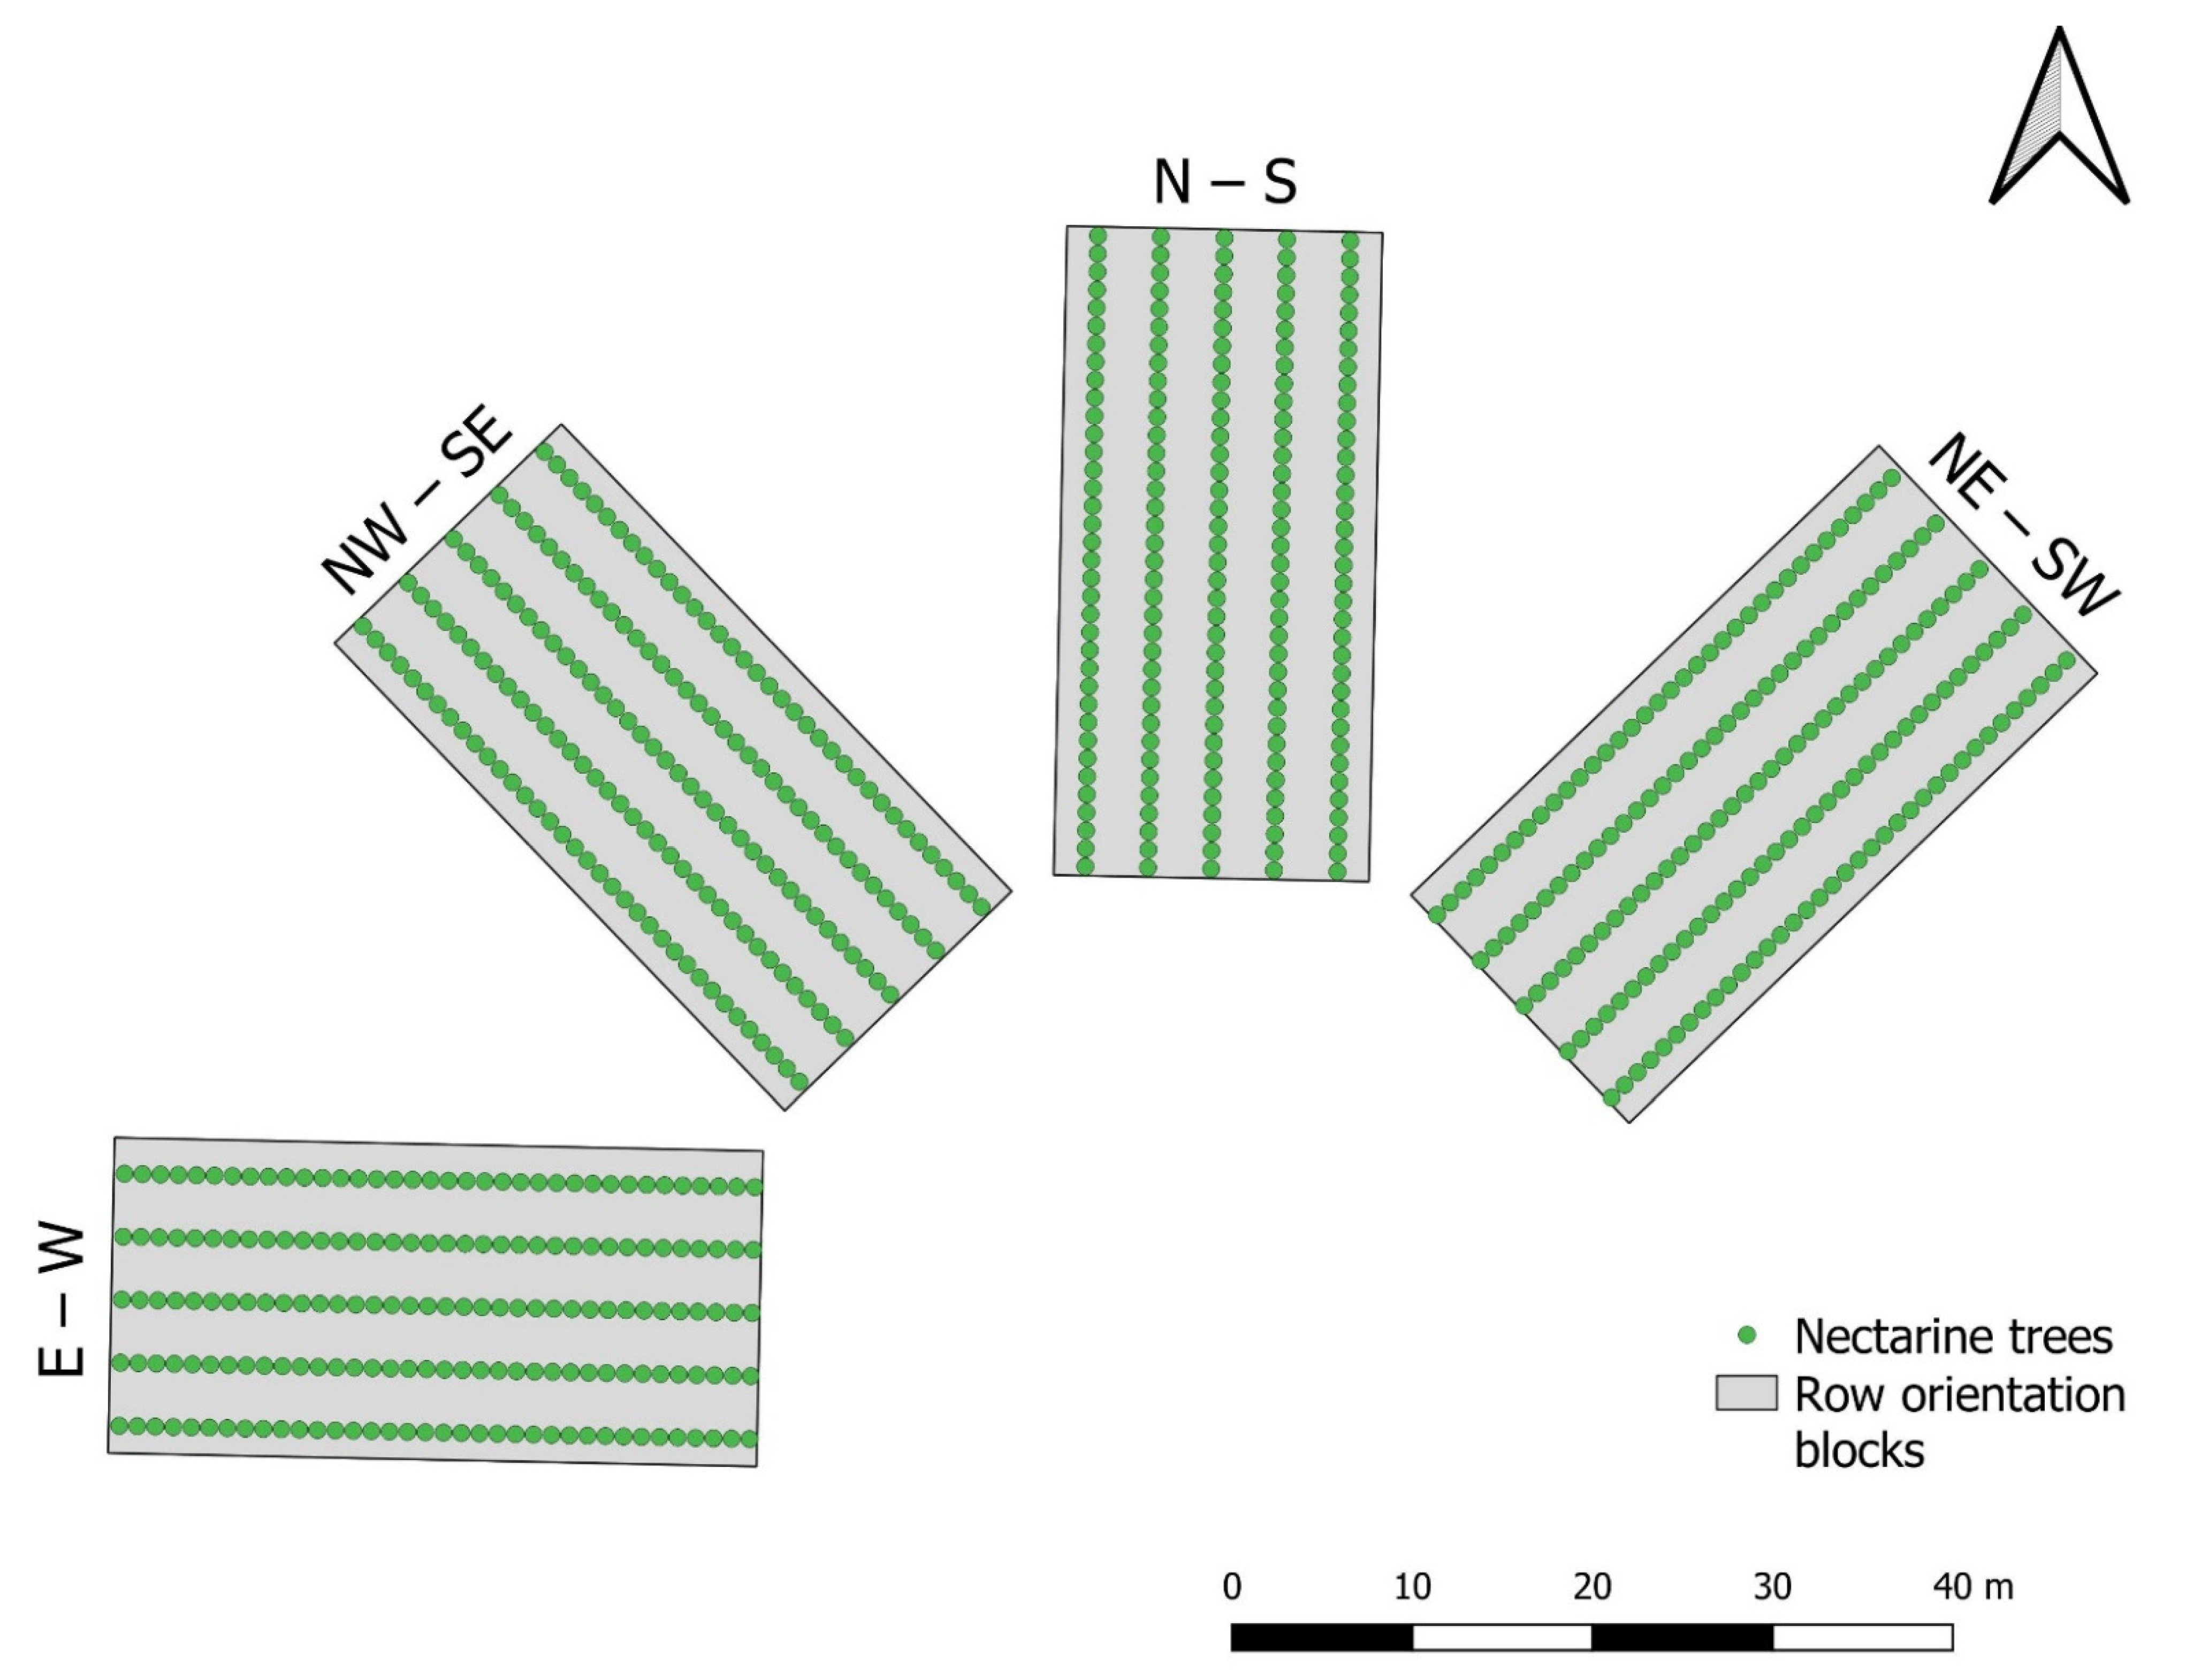
2.2. Experimental Sites and Cultivars

The experiment was conducted in the Stonefruit and Sundial experimental orchards at the Tatura SmartFarm, Tatura, VIC, Australia (36°26′7.2″ S and 145°16′8.4″ E, 113 m a.s.l.), over 2020–2021 and 2021–2022. The two experimental orchards used in this study host thirteen peach and nectarine (Prunus persica, L. Batsch) cultivars. This research was undertaken on one yellow-fleshed peach cultivar (‘O’Henry’), two white-fleshed peach cultivars (‘Snow Flame 23’ and ‘Snow Flame 25’), one yellow-fleshed nectarine cultivar (‘August Bright’) and one white-fleshed nectarine cultivar (‘Majestic Pearl’). ‘O’Henry’, ‘Snow Flame 23’, ‘Snow Flame 25’ and ‘August Bright’ trees were planted in 2014 along N–S rows and trained on 2D trellis at 2.5 m tree spacing within the row and at 4.5 m row spacing. ‘Majestic Pearl’ trees were planted in 2018 in a semicircle of the Sundial orchard, in four blocks with different row orientations (E–W, NW–SE, N–S and NE–SW), and in high density configurations along 2D trellis and V systems at 1 m tree spacing and 3.5 m row spacing.

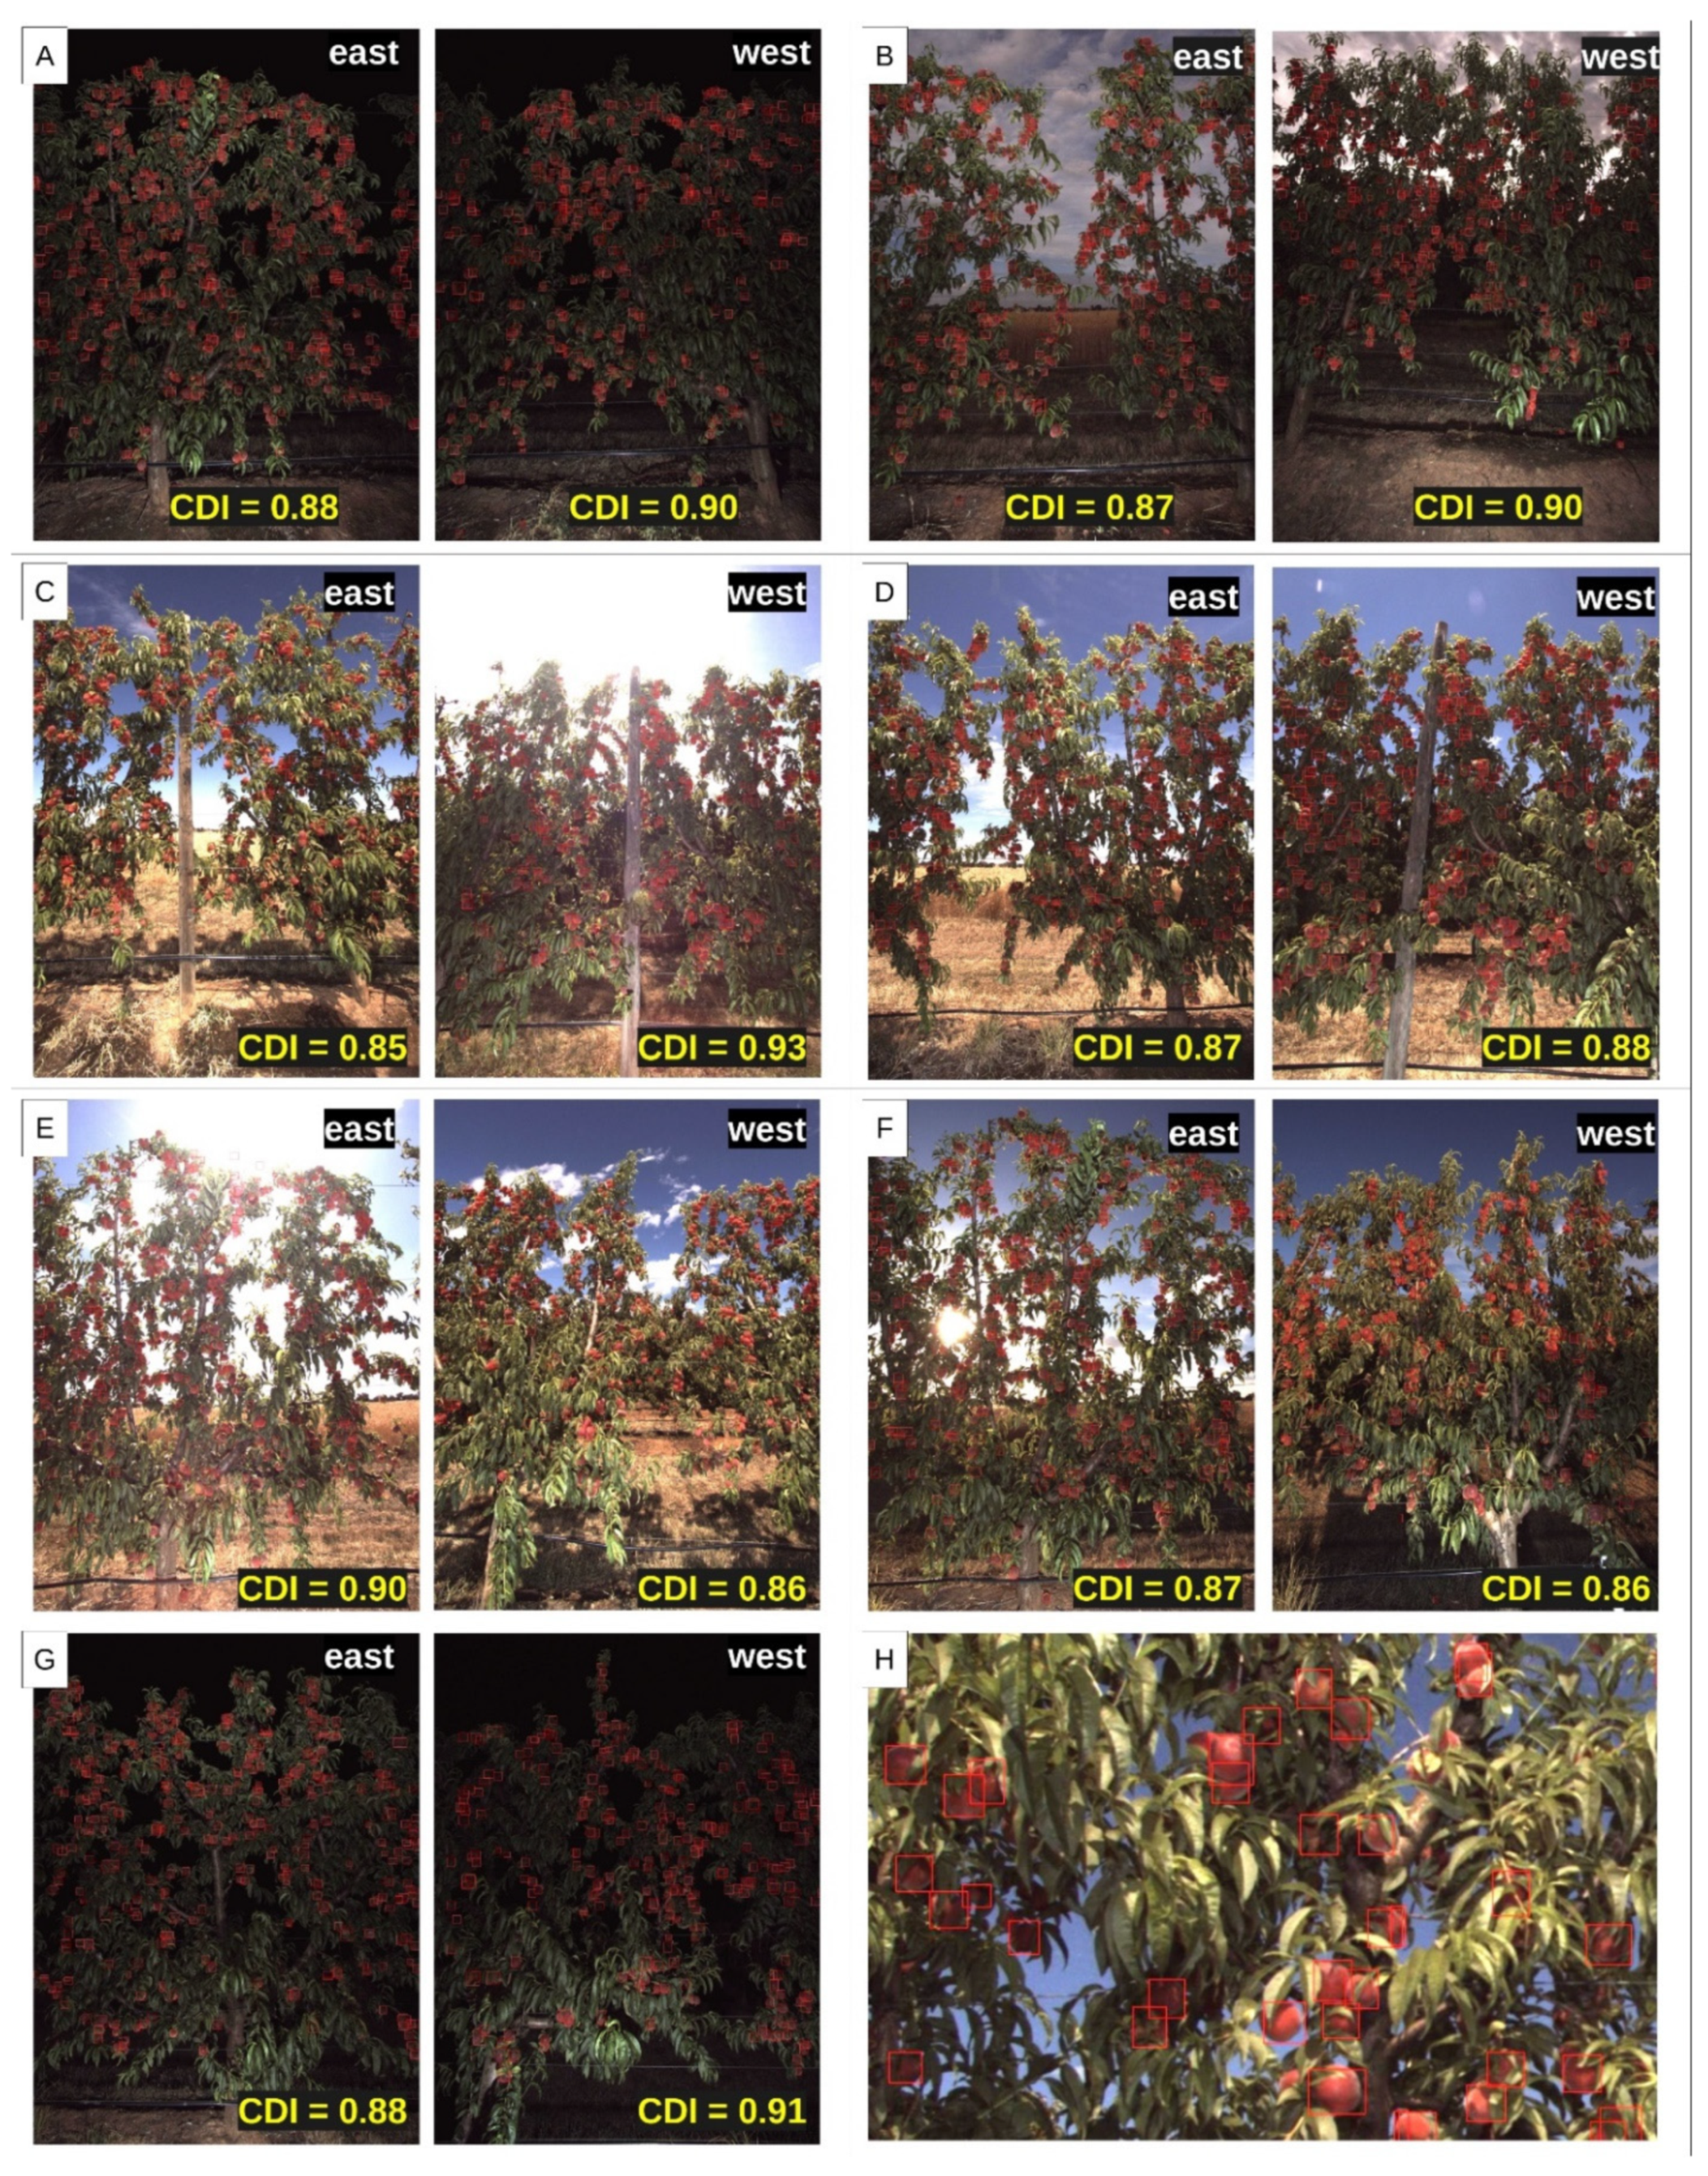
2.3. Ground-Based Platform for Fruit Detection and Colour Recognition

The commercial mobile platform Cartographer (Green Atlas Pty Ltd., Alexandria, NSW, Australia) was used to collect georeferenced images in the experimental orchards. This platform is a combination of hardware and software that implements AI predictive algorithms. Machine vision is used to take high-resolution photos of trees at a speed of 5 images per second. Cartographer’s cameras point to both the left and right side and can be driven at a speed > 10 km/h along orchard interrows to collect images of trees located in the two adjacent rows. Images are segmented and fruit detected with a proprietary Green Atlas machine learning algorithm that produces estimations of fruit number per image, and detection boxes are automatically generated around detected fruit in each image. Fruit detections had overall low prediction errors, although a slightly better performance was obtained in peach (% standard errors = 4.5%) compared to nectarine (% standard error = 7.4%), in line with Islam et al. [13], as the former was trained on 2D trellises and fruit was more visible.
Cartographer was used to collect images of fruit on both west and east sides of the canopy. Fruit colour was extracted from the central pixels of fruit detection boxes in collected images. RGB values were generated from the pixels in each detection box. Subsequently, RGB values were converted to hue angle using a Python script [14] and CDI was calculated as shown in Equation (1). The average fruit skin colour values per image were calculated, georeferenced and then extracted in csv format with geographical coordinates using Green Atlas software. Accurate RTK DGPS/DGNSS corrections were achieved using an NTRIP (Networked Transport of RTCM via Internet Protocol) configuration that linked the Cartographer’s Reach RS + receiver (Emlid Ltd., Hong Kong, China) with the SmartnetAus RTK Network.

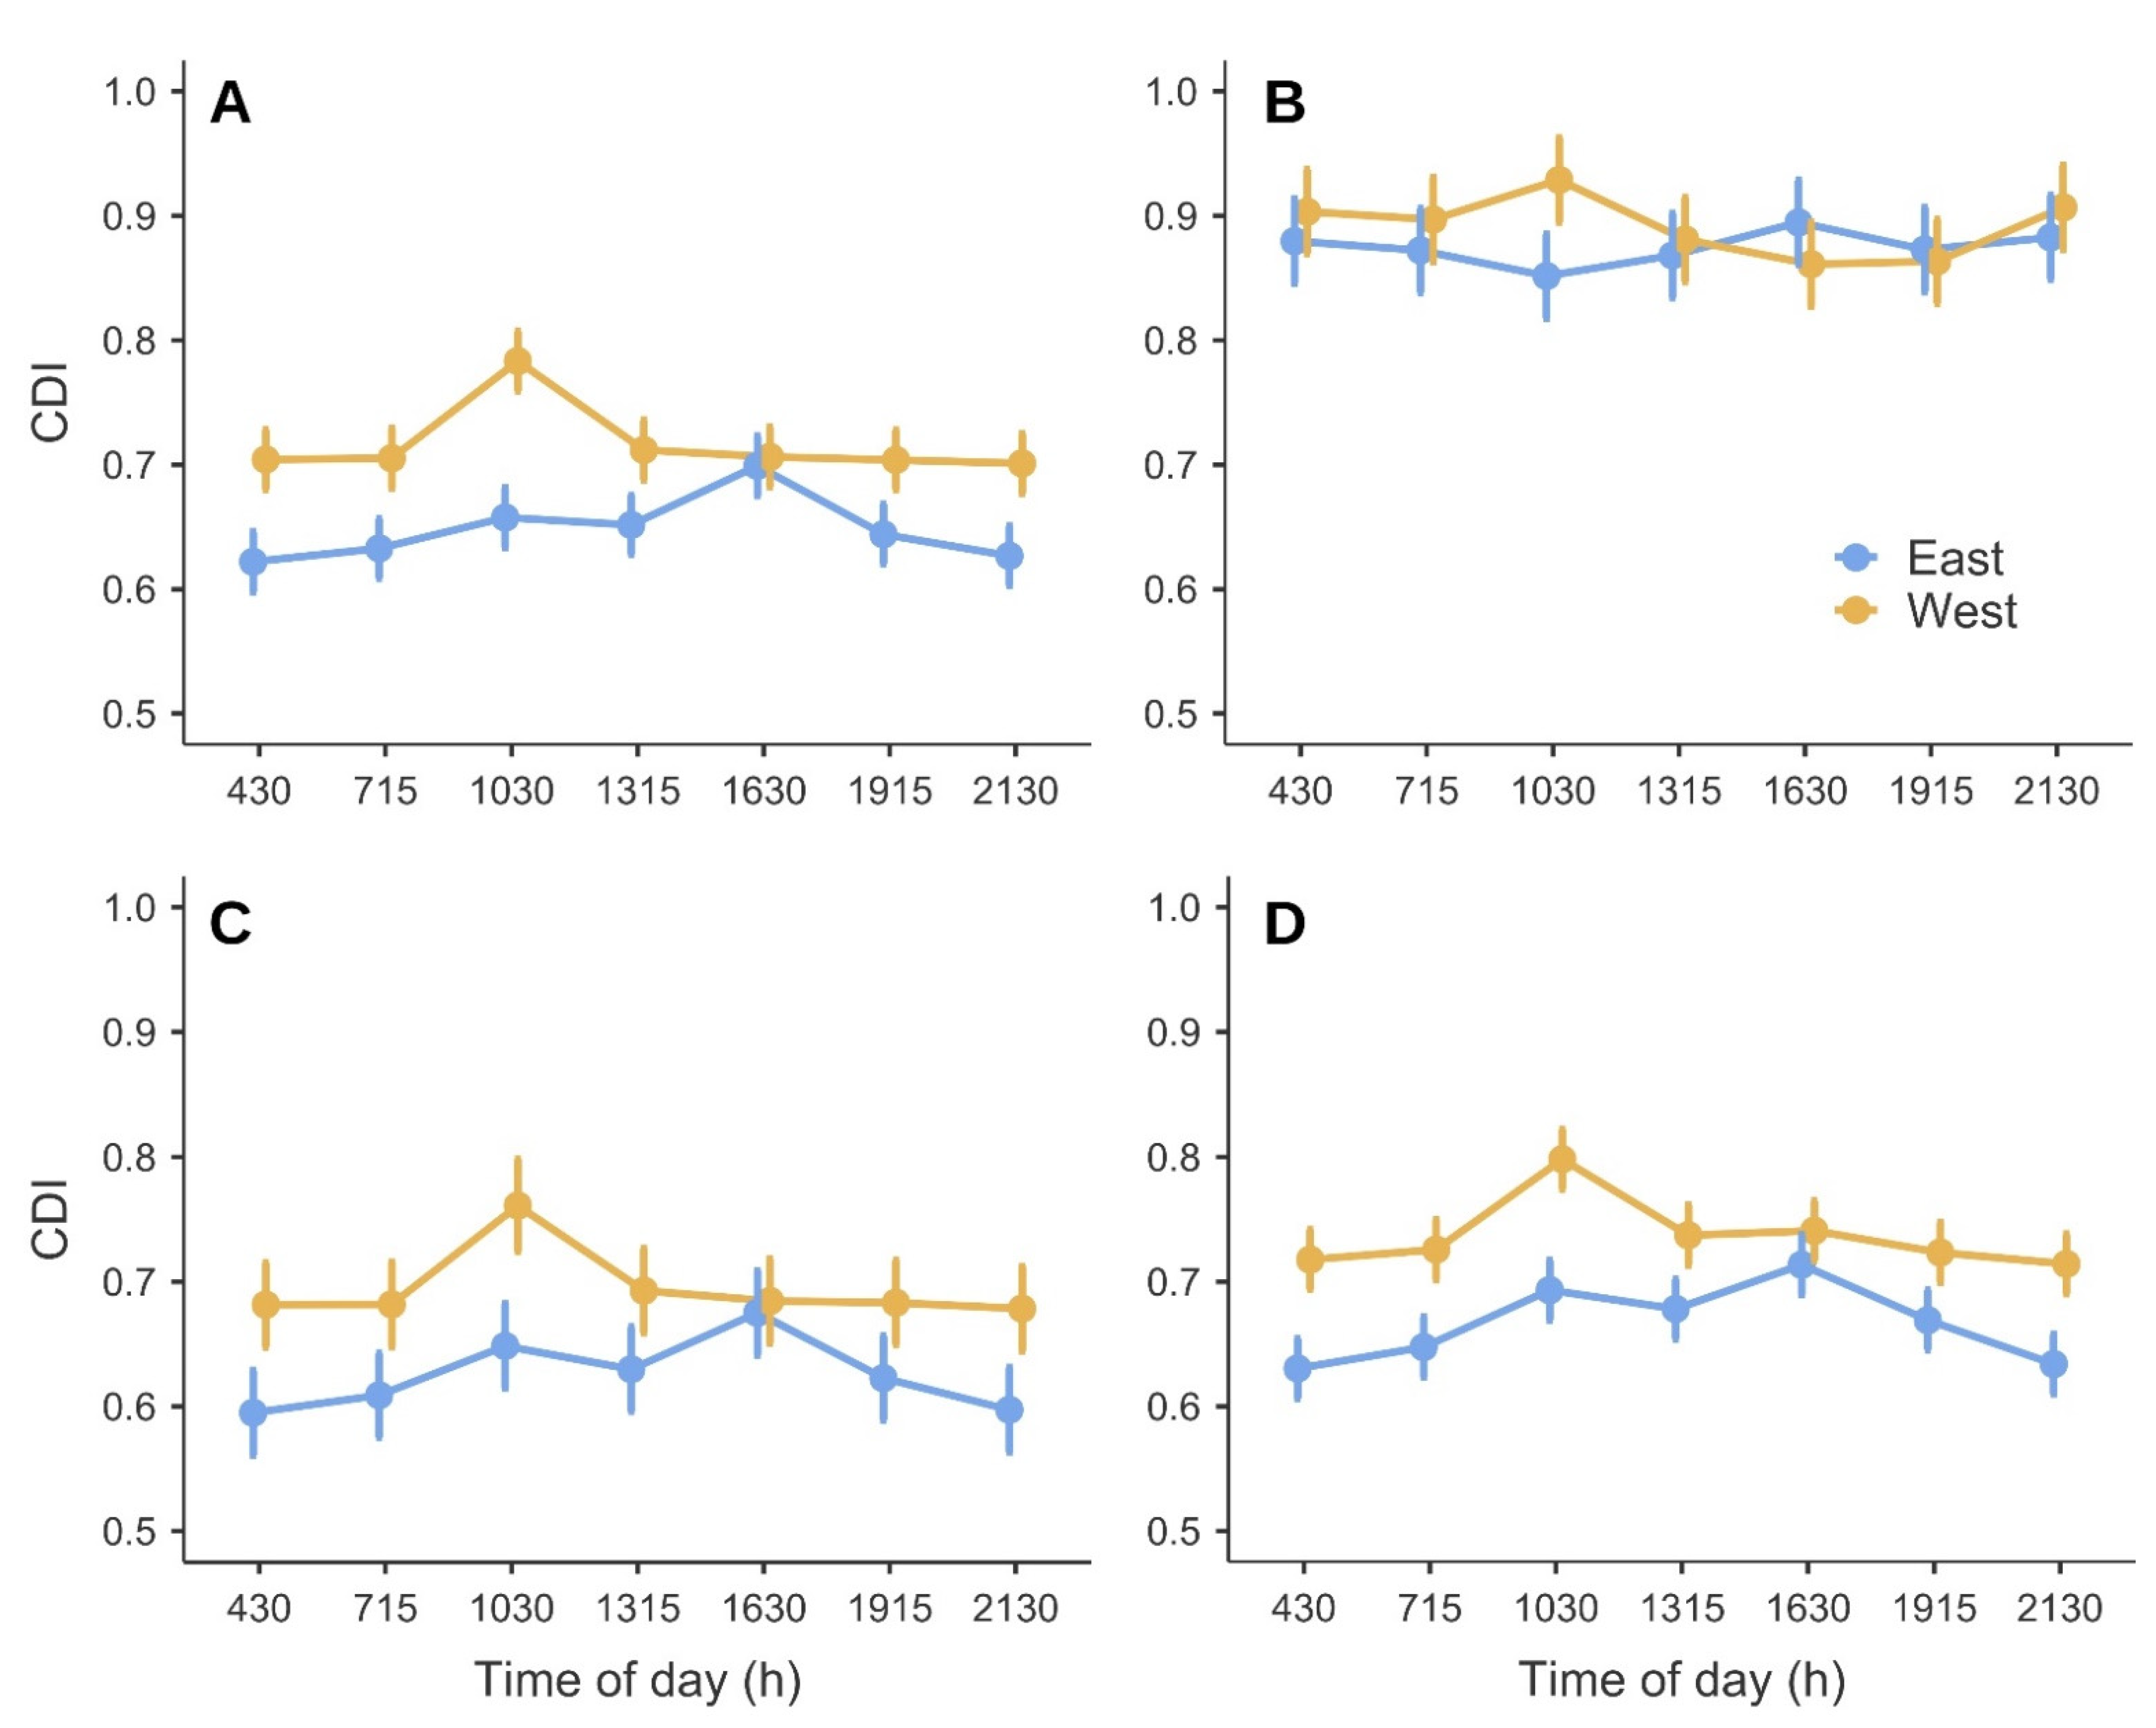
2.4. Effects of Time of Scan, Cultivar and Canopy Side on Colour Measurements

To establish the effects of time of day, cultivar and canopy side on CDI estimation, orchard scans and image collection were conducted at seven different times on a sunny day (14 December 2021). Scans were conducted at 430, 715, 1015, 1315, 1615, 1915 and 2130 h (AEDT). The first and last scan were conducted before dawn and after dusk, respectively, whereas the scan at 1315 h corresponded to solar noon. Images (sample size shown in Table 1) were collected in the ‘O’Henry’ (60 trees), ‘Snow Flame 23’ (30 trees), ‘Snow Flame 25’ (30 trees) and ‘August Bright’ (60 trees) experimental plots shown in Figure 3. Fruit in both west and east sides of the canopy were scanned and compared.

2.5. Fruit Maturity and Harvest Time

The degree of ripeness of ‘Majestic Pearl’ nectarine fruit was assessed with a DA-meter (TR Turoni, Forlì, Italy) and expressed as Index of Absorbance Difference (IAD) between the 670 and 720 nm wavelengths [15,16]. The DA-meter effectively measures chlorophyll-α spectral reflectance in the skin and outer mesocarp which is strongly correlated with greenness. IAD was previously linked to maturity in peach and nectarines [17,18,19,20,21,22,23,24]. In order to model the relationship between IAD and maturity in ‘Majestic Pearl’ fruit, IAD and ethylene emission were measured in 2020–2021 on a sample of 123 fruit collected from −18 to +9 days from harvest (DfH). Ethylene emission was measured as described by Frisina et al. [25] and expressed using its natural logarithm (ETHln). In addition, in 2020–2021, relationships between IAD and FF and SSC were obtained on a fruit sample (n = 207) collected from −18 to +6 DfH.
In 2021–2022, IAD measurements were taken at different times from harvest on a sample of 320 fruit per measurement date, 80 per row orientation arm (i.e., used as replication units, see Figure 4). IAD measurements were conducted on 5 January (−23 days DfH), 12 January (−16 days DfH), 10 January (−10 days DfH), 27 January (−1 days DfH), 31 January (+3 days DfH) and 2 February 2022 (+5 DfH). Harvest time in 2021–2022 was based on achieving a median IAD = 1.20, flesh firmness (FF) = 9 kg cm−2 and soluble solids concentration (SSC) = 16 °Brix. FF and SSC were considered for harvest time decisions as they are among the most important fruit quality parameters in stone fruit [26].

2.6. CDI Relationship with Maturity and Time from Harvest

To establish the relationship between ripeness, time from harvest and CDI, ‘Majestic pearl’ fruit were scanned at different DfH, on the same days when IAD measurements were taken (i.e., −23, −16, −10, −1, +3 and +5 DfH in 2022). Scans were conducted prior to 700 h (AEDT) to limit sunlight influence on colour measurements. A map of the Sundial orchard semicircle planted with the ‘Majestic Pearl’ nectarines used to build the relationship between CDI and IAD is shown in Figure 4. The four row orientations were used as replication units for CDI and IAD relationships at each time from harvest. An average of 685 (±34) images were obtained on trees in each row orientation arm at each DfH with an average number of 28 (±4) fruit detected per image.

2.7. Geoprocessing, CDI Data Extraction and Spatial Mapping

Georeferenced csv files obtained with Green Atlas software were uploaded into QGIS (v. 3.16, QGIS Development Team, Open Source Geospatial Foundation, 2021) and combined with the experimental plot and tree layers shown in spatial maps in Figure 3 and Figure 4. Summaries of CDI medians per experimental plot were obtained separately for east and west sides of the canopies at the seven different times of the day when scanning the five cultivars in the experimental plots. CDI medians per row orientation (i.e., E–W, NW–SE, N–S and NE–SW arms used as experimental units) were obtained with a similar process after scanning the ‘Majestic Pearl’ nectarine trees (Figure 4) six times from harvest.

2.8. Statistical Analysis

The effect of time of day, cultivar and canopy side on CDI measurements in different cultivars was assessed using a General Linear Model (GLM) routine available in Jamovi (v. 2.2.5, The Jamovi Project, Sydney, NSW, Australia) using the GAMLj: General analyses for linear models [jamovi module] [27]. Effect size was assessed using Eta-squared (η2).
The relationship between CDI and IAD from −23 to +5 DfH in 2021–2022 was modelled using nonlinear regression procedures. The relationships between IAD and ETHln, CDI and IAD, and CDI and time from harvest were established using linear and nonlinear regression procedures. Graphs were generated using SigmaPlot 12.5 (Systat software Inc., Chicago, IL, USA).

3. Results

3.1. Effect of Time of Scan and Canopy Side on Colour Measurements

Representative examples of images collected using Cartographer to detect fruit and measure CDI on the east and west side of ‘Snow Flame 23’ peach canopies and at different times of the day are shown in Figure 5. CDI values were similar in east and west sides of the canopy, although consistent higher CDI values were shown in west sides of the canopies, except for the scan at 1615 h (Figure 5E). The largest differences between CDI values in east and west sides (≥0.04) of the canopy were observed at 1015 (Figure 5C) and 1615 h (Figure 5E), respectively, when the sun was visible in the images due to its angle in the sky. Fruit detections are shown in red detection boxes in a zoomed-in image (Figure 5H),
The GLM procedure highlighted significant effects of time of scan, cultivar and canopy side (p < 0.001) on CDI values. In all the cultivars under study, CDI peaked in scans carried out in west-side canopies at 1015 h (Figure 6), when the sun was visible in the background of the image, as shown in Figure 5C (west). The highest CDI in east sides of the canopies, was observed at 1615 h (Figure 6), when the sun appeared again in the image (Figure 5E, east). Comparisons between CDI in east and west sides of the canopies scanned under dark conditions (430 and 2130 h) unveiled a significant higher CDI (i.e., redness) in fruit in the west side of the canopies that are exposed to the afternoon sun in N–S oriented orchard rows. The only exception was in ‘Snow Flame 23’ fruit (Figure 6B), the only ready-to-harvest cultivar within the four cultivars scanned, where no significant differences (p > 0.05) between CDI values in east and west canopy sides were found when scanning at 430, 715, 1315 (solar noon), 1915 and 2130 h. Therefore, true CDI differences between east- and west-exposed fruit (i.e., not influenced by the interference of sunlight) became negligible when fruit achieved their maximum redness expression and were ready to harvest.
Regardless of cultivar and canopy side, the effect of time of scan was significant (p < 0.001), although the GLM procedure highlighted that cultivar and canopy side had the highest (η2 = 0.633) and second highest (η2 = 0.079) effects on CDI, respectively. The effect size of time of scan on CDI detection was below 3% (η2 = 0.028). The Bonferroni post hoc test highlighted that, when pooling together east and west sides of the canopies, the only CDI values that were significantly different from CDIs obtained with nocturnal measurements were those generated from mid-morning (1015 h) and mid-afternoon (1615 h) scans (Figure 7). In fact, even at solar noon, when the sun was not visible in the collected images, CDI values did not significantly diverge from nocturnal measurements.

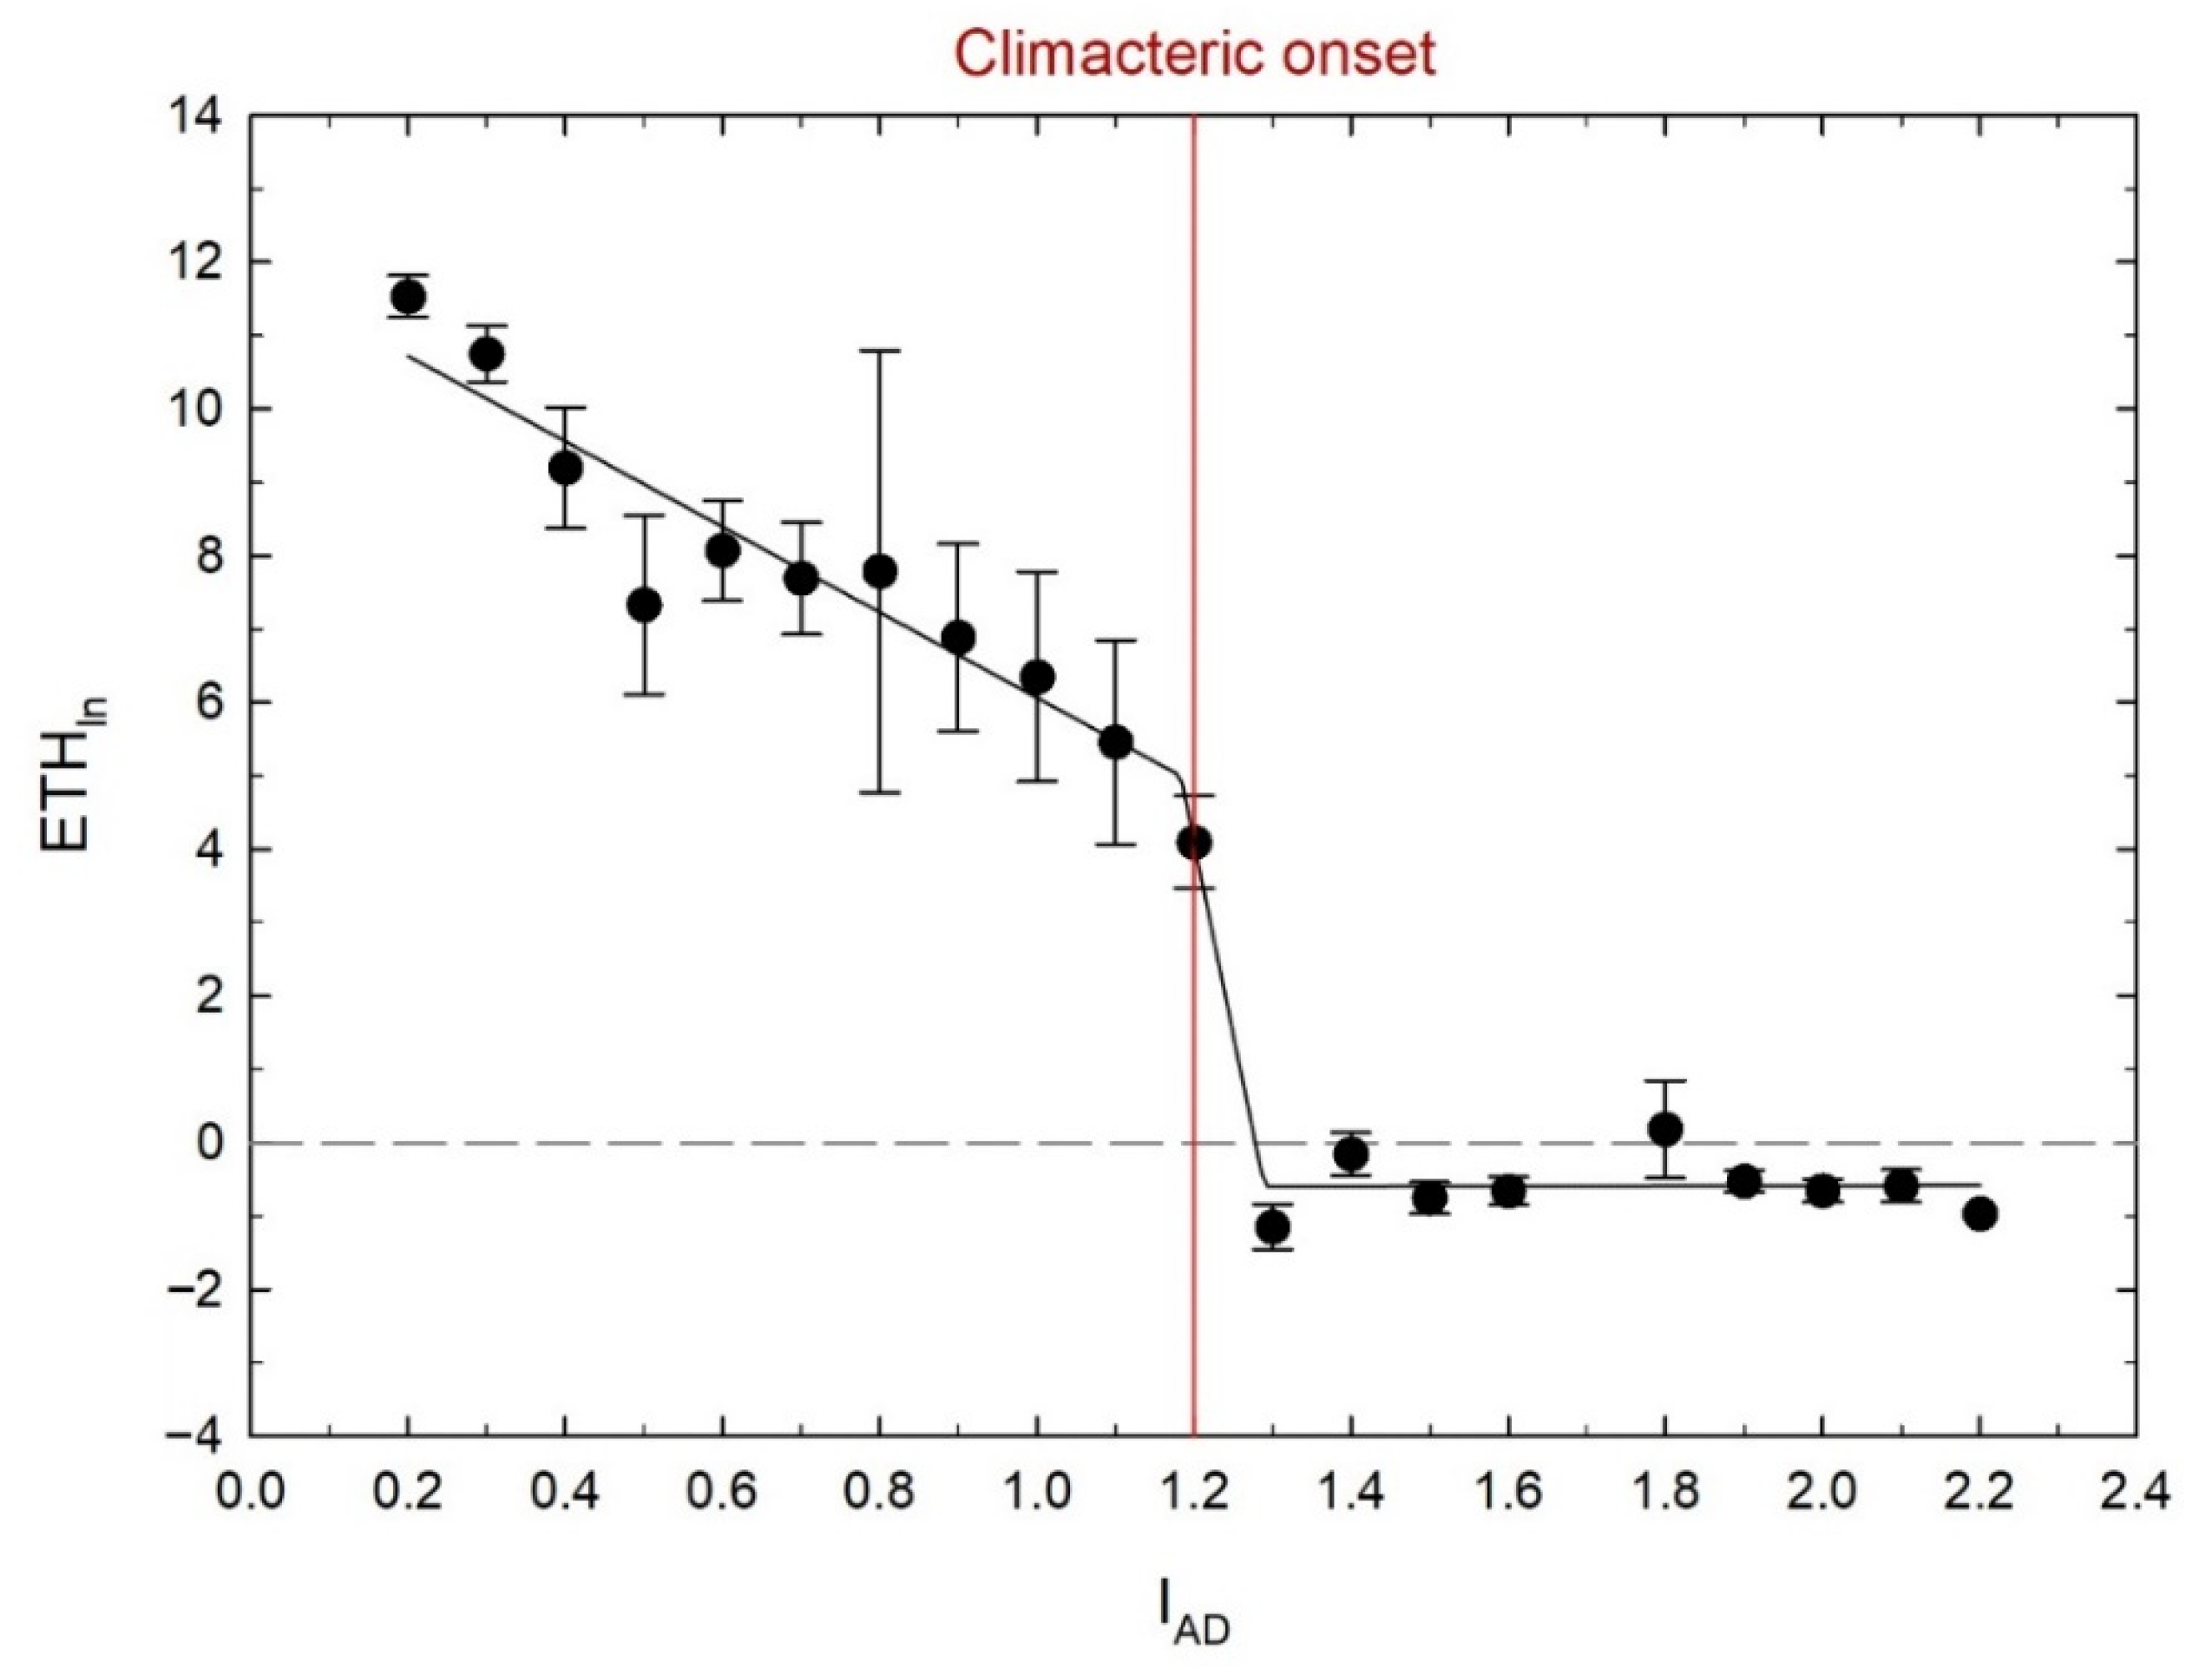
3.2. Relationship between IAD and Ethylene

The ‘Majestic Pearl’ nectarine fruit (n = 123) collected from −18 to +9 DfH in 2020–2021 were divided into 21 groups corresponding to 0.1 IAD increments ranging from 0.2 to 2.2 IAD. The scatterplot in Figure 8 shows the relationship of ETHln to IAD described by a piecewise, three-segment regression line. The climacteric onset (sharp rise in ethylene emission) was visually estimated to occur at IAD = 1.20, as significant ethylene emission was not observed in fruit with IAD > 1.20. This IAD threshold was used to decide the harvest time of ‘Majestic Pearl’ fruit in both 2020–2021 and 2021–2022.

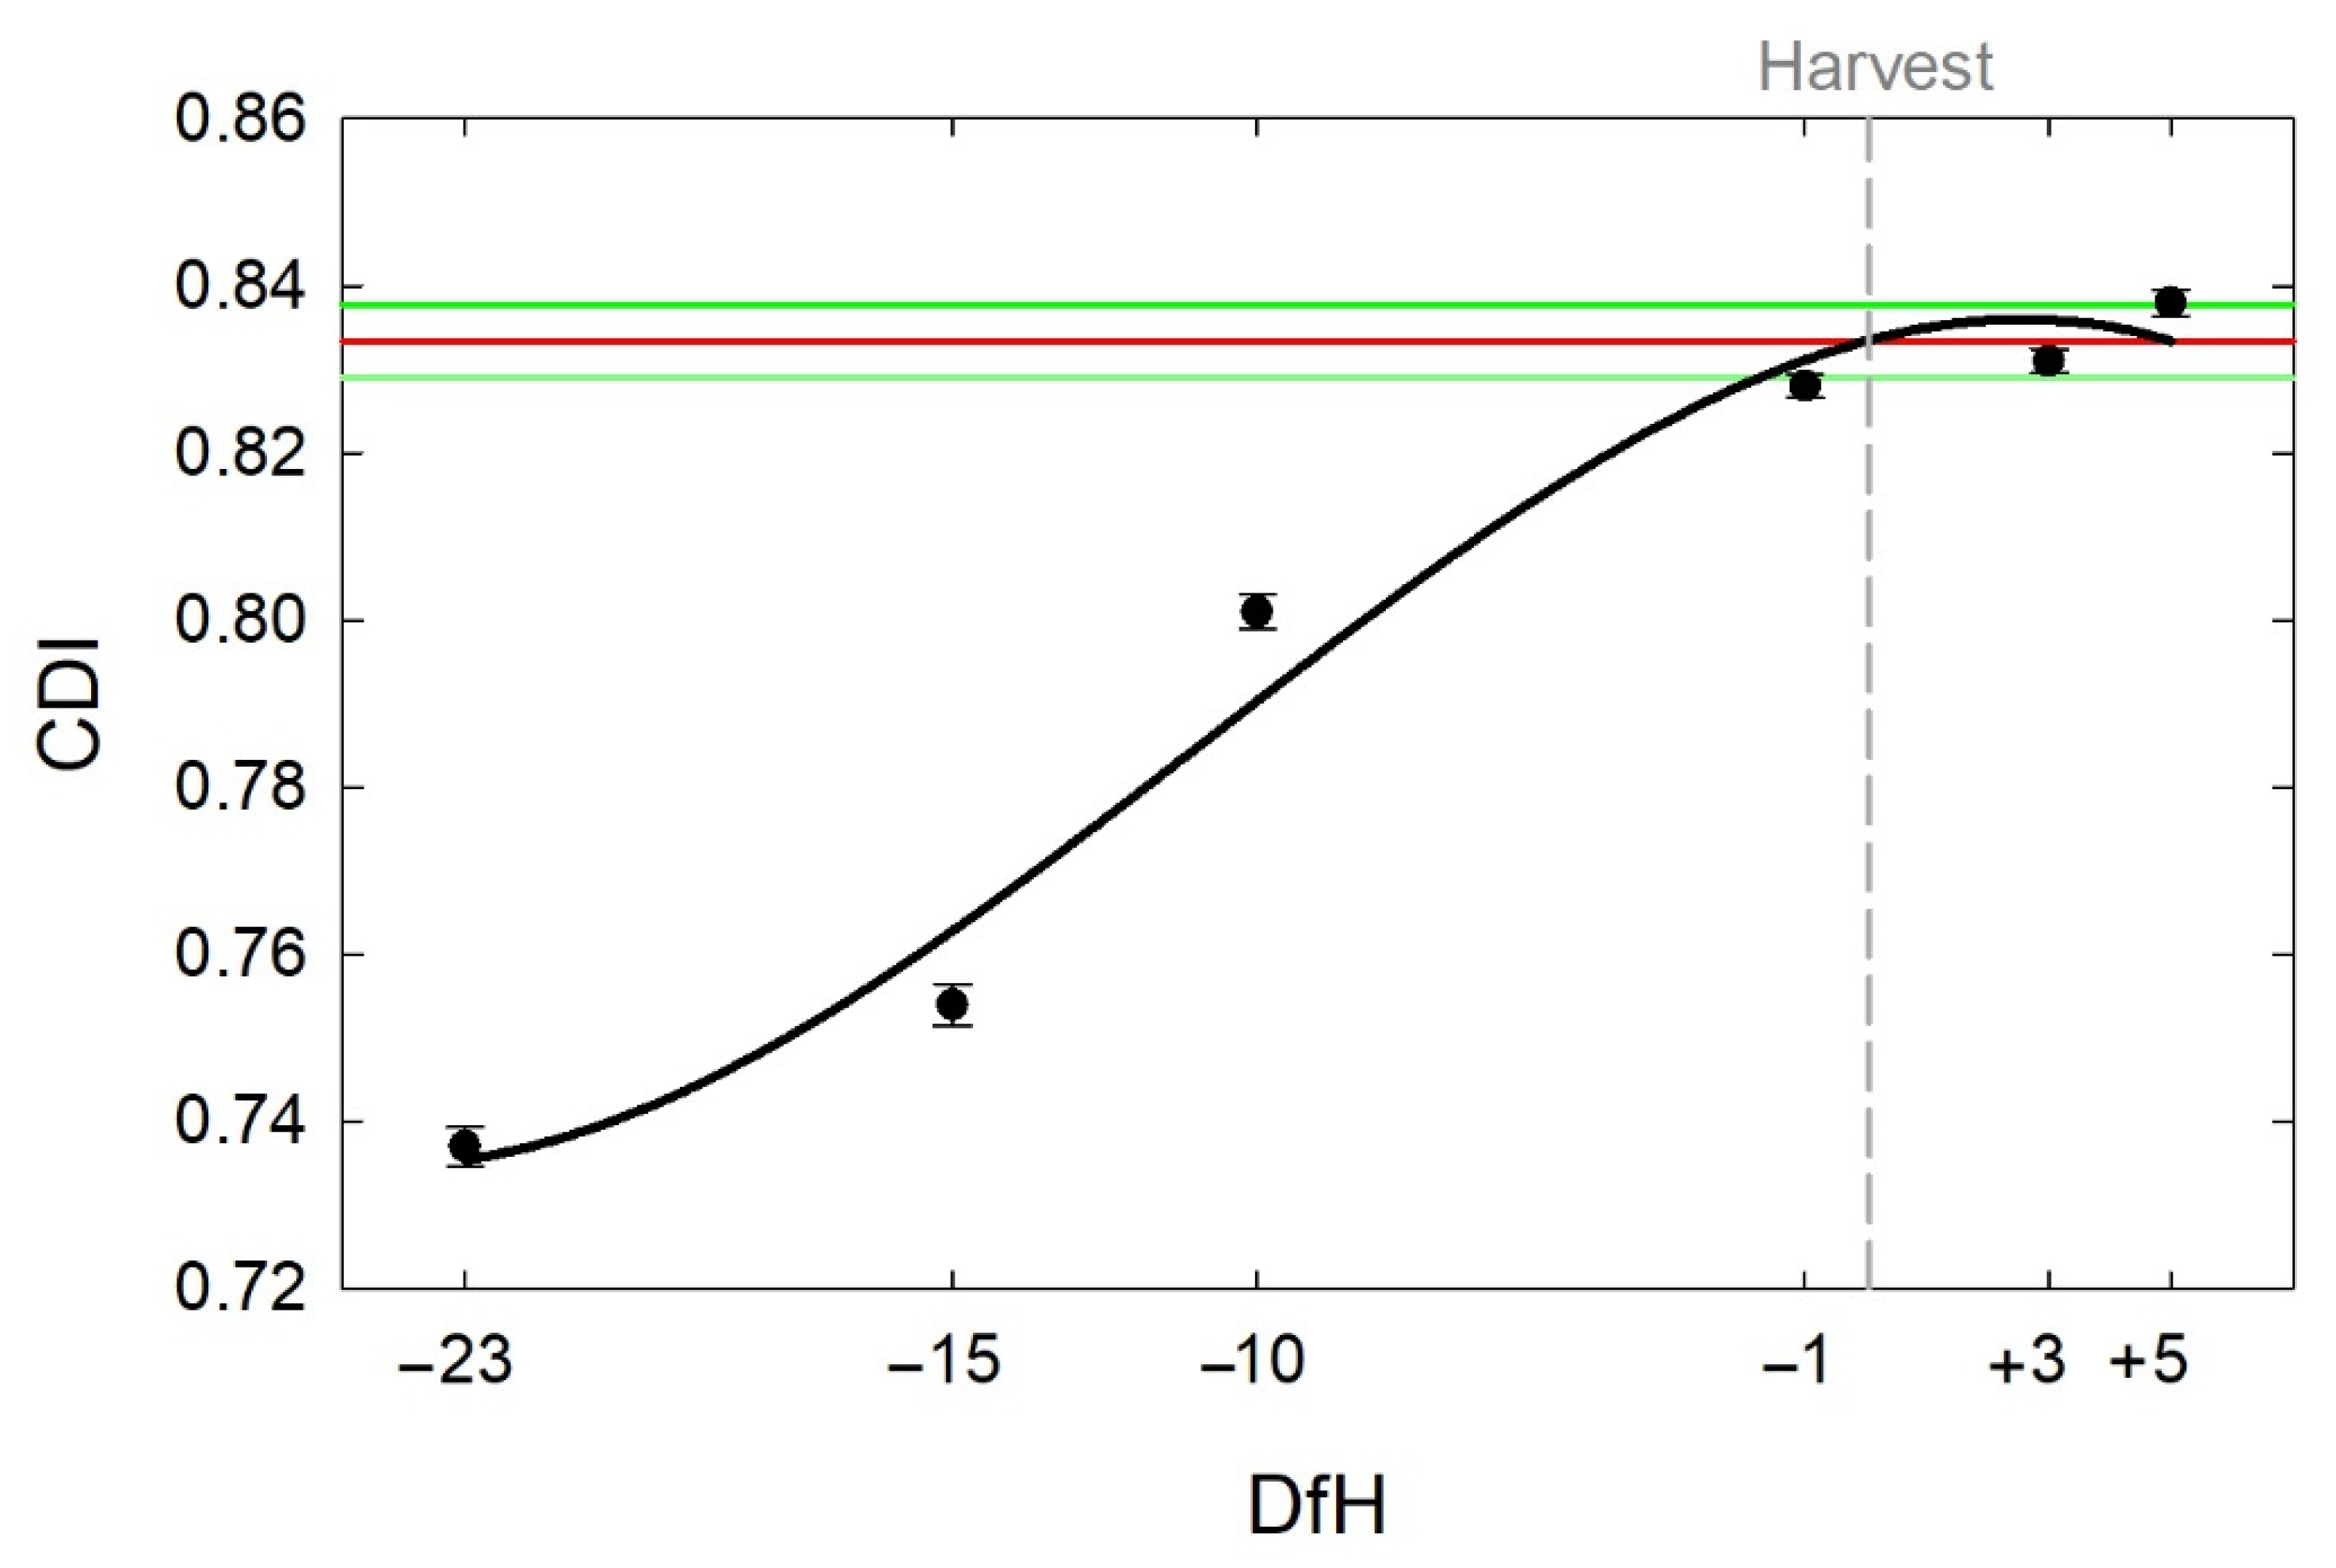
3.3. CDI Relationship with IAD and Time from Harvest

For ‘Majestic Pearl’, the relationship between CDI and IAD was characterised by a polynomial regression fit with a quadratic and a logarithmic component (Figure 9). The relationship was significant and robust (p < 0.001; R2 > 0.90 and S.E. = 0.015). The value of CDI plateaued at 0.835.
The progression of CDI before and after harvest was characterised by a polynomial cubic model (Figure 10), in line with the modelling approach used to describe the development of different colour attributes (e.g., a*, hue angle) in the same cultivar (Scalisi et al., 2021a). According to the model, the value of CDI at harvest was 0.833 (±0.009) which was in line with the CDI obtained when the relationship between CDI and IAD plateaued (Figure 9).

4. Discussion

The main goal in this study was to simplify the objective measurement of colour development in peaches and nectarines by adopting a simplified new index (CDI) compared to fruit colour attributes such as a* and hue angle, traditionally used to determine fruit colour relationships with fruit maturity [3,4,5,6,7,8]. Fruit colour is often measured with colourimeters reading small areas of the fruit surface [2]. Different colour spaces have been used in the literature (e.g., RGB, standardised RGB, XYZ, HIS) to measure fruit colour, but the CIELab appears to be the most appropriate for colour quantification in curved fruit surface [28], with hue angle being the ideal candidate for bi-colour fruit according to Kang et al. [29]. Colourimeters are not ideal for measurements in fruit with heterogenous colour [30] and cameras are required to investigate the colour variability in the pixels associated with the surface area [2].
CDI can be obtained with both machine vision and colourimeters. Being measured on a scale from 0 to 1, CDI represents an intuitive measure of colour that increases along with maturity. At physiological maturity, ‘Snow Flame 23’ peaches and ‘Majestic Pearl’ nectarines had average CDI = 0.88 (Figure 6B) and CDI = 0.83 (Figure 10), respectively.
Scanning east and west sides of the canopies separately unveiled a significant tendency to yield redder fruit (i.e., highest CDI) in the west-facing side of the canopy (Figure 5 and Figure 6)–fruit that are exposed to afternoon sun. Fruit exposed to the afternoon sun were likely to experience a combination of high light and temperature regimes that drove more pronounced red pigmentation development. Fruit exposure to sunlight was previously linked to significant changes in hue angle in ‘Loring’ and ‘Raritan Rose’ peaches [31].
Time of scanning affected CDI and the effect was more pronounced in greener (less mature) fruit (Figure 6A,C,D) than in red, ready-to-harvest fruit (Figure 6B). Measurements of CDI conducted under dark conditions (before dawn and after dusk) were considered the reference for colour measurements as the effect of sunlight on colour perception was removed. Canopies were illuminated using the strobe lights on the Green Atlas Cartographer, which guaranteed same illumination intensity and light quality for both west and east sides of the canopy. In fact, CDI values obtained at 430 and at 2130 h were not significantly different and were practically identical (CDI = 0.682 ± 0.012) when pooling together different cultivars and canopy sides (Figure 7). Sunlight in measurements from 715 to 1915 h caused an increase of the CDI values due to the change of image brightness. However, when pooling together east and west fruit, CDI was not significantly higher in scans at 715, 1315 and 1915 h compared to nocturnal scans (Figure 7). The only significant deviations of CDI values from what observed in dark conditions occurred at 1015 (mid-morning) and 1615 h (mid-afternoon), when the presence of the sun in the background of the image (Figure 5C west and E east) caused a large alteration of the image brightness that was likely to cause the CDI to increase by a few centesimal points. This in turn led to the largest deviation of CDI values from what measured in dark conditions in both east and west sides of the canopies. Using their system, Mirbod et al. [10] noticed that when the sun was in front of the camera, the auto-exposure settings of the LED illuminants attempted to adjust the image brightness using the sky regions and caused a darkening of the foreground canopies, but a similar issue was not encountered in our study. Recent research [11] highlighted a trend to develop camera systems that are illumination-invariant and attempt to overcome the influence of external light and different exposure on the collected images.
To summarise, when the purpose of scanning is to compare data in a temporal scale or predict CDI thresholds to support harvest time decisions, it is recommended to scan peach and nectarine orchards at night, early morning, solar noon or late afternoon. Our preference remains to scan in dark conditions so that the sunlight effect on CDI is completely removed. However, if for logistical and safety reasons, nocturnal scans cannot be conducted, our results suggest that early morning, solar noon or late afternoon measurements conducted with Cartographer do not statistically differ from nocturnal scans. We stress the importance of avoiding mid-morning or mid-afternoon measurements, due to the significant influence of sunlight on CDI. When using most contact colourimeters, the sunlight effect is removed or negligible, as the surface where colour is measured is meant to be completely covered by the sensor. Thus, the use of colourimeters is not time dependent. However, proximal machine vision measurements of fruit colour offer the opportunity to quickly measure a much larger sample of the fruit (almost the entire population) in the orchard.
Optical methods were shown to perform better than low mass impact (mechanical) techniques for fruit maturity assessments in peach at harvest [32]. In our study, the machine vision-derived CDI proved to be tightly related to IAD in ‘Majestic Pearl’ nectarines, and CDI values plateaued at IAD ≤ 1.20 (Figure 9). IAD was linked to ethylene emission (Figure 8)–the most realistic measure of fruit maturity in climacteric fruit [33].
We argue that fruit skin colour development and fruit size in ‘Majestic Pearl’ nectarines represent the two main drivers to automate harvest time decisions with non-contact devices. Our modelling of CDI against time from harvest suggests that this cultivar can be harvested at CDI = 0.833 ± 0.009 (Figure 10). This threshold, however, is likely to be cultivar- and orchard-specific, as genetic characteristics, orchard designs, macro- and micro-environments, and orchard management (e.g., irrigation and nutrition) can affect colour expression [34,35]. Further work is required to assess the stability (annual variation) and utility of CDI among orchard systems. CDI has the potential to be used for selective harvest deployed by robotic harvesting platforms, where several picks can be planned upon achieving predetermined CDI thresholds.

5. Conclusions

In summary, this study promoted the adoption of a new fruit colour parameter, namely CDI, in peach and nectarine fruit. CDI measurements can be collected in situ using machine vision systems or portable colourimeters, or post-harvest using in-line grading systems. The CDI is strongly related to the degradation of chlorophyll in fruit skin and was found to be correlated with fruit maturity and time from harvest. In this study, we demonstrated that early morning, solar noon or late afternoon measurements of the CDI conducted with Cartographer do not statistically differ from nocturnal scans. Mid-morning or mid-afternoon measurements of CDI were significantly affected by sunlight and should be avoided.
The commercial mobile platform used in this study, Green Atlas Cartographer, can be used to collect and georeference large datasets of CDI in peach and nectarine orchards prior to harvest to support harvest-time decision making. The CDI data generated from Cartographer could potentially be used to inform precision horticulture applications including robotic systems (e.g., mechanised pruning platforms, biostimulant sprayers) to maximise and standardise fruit colour to meet premium fruit quality specifications and advance horticultural production outcomes.

Author Contributions

Conceptualisation, A.S., M.G.O., M.S.I. and I.G.; methodology, A.S. and M.G.O.; software, A.S.; validation, A.S. and M.G.O.; formal analysis, A.S.; investigation, A.S. and M.S.I.; resources, M.G.O. and I.G.; data curation, A.S.; writing—original draft preparation, A.S.; writing—review and editing, M.G.O., M.S.I. and I.G.; visualisation, A.S.; supervision, M.G.O. and I.G.; project administration, I.G.; funding acquisition, I.G. All authors have read and agreed to the published version of the manuscript.

Funding

The research was supported by the project ‘Deploying real-time sensors to meet Summerfruit export requirements’ funded by Food Agility CRC Ltd., under the Commonwealth Government CRC Program with co-investment from Agriculture Victoria and Summerfruit Australia Limited. The CRC Program supports industry-led collaborations between industry, researchers and the community.

Data Availability Statement

Not applicable.

Acknowledgments

The technical support and assistance of Christine Frisina and Tim Plozza is gratefully acknowledged. We thank James Underwood, Steve Scheding and Peter Morton (Green Atlas) for providing technical support on the efficient use of Cartographer to answer the research questions.

Conflicts of Interest

The authors declare no conflict of interest.

References

  1. Rose, D.C.; Chilvers, J. Agriculture 4.0: Broadening Responsible Innovation in an Era of Smart Farming. Front. Sustain. Food Syst. 2018, 2, 87. [Google Scholar] [CrossRef] [Green Version]
  2. Cubero, S.; Aleixos, N.; Moltó, E.; Gómez-Sanchis, J.; Blasco, J. Advances in Machine Vision Applications for Automatic Inspection and Quality Evaluation of Fruits and Vegetables. Food Bioprocess Technol. 2011, 4, 487–504. [Google Scholar] [CrossRef]
  3. Robertson, J.A.; Meredith, F.I.; Horvat, R.J.; Senter, S.D. Effect of Cold Storage and Maturity on the Physical and Chemical Characteristics and Volatile Constituents of Peaches (Cv. Cresthaven). J. Agric. Food Chem. 1990, 38, 620–624. [Google Scholar] [CrossRef]
  4. Byrne, D.H.; Nikolic, A.N.; Burns, E.E. Variability in Sugars, Acids, Firmness, and Color Characteristics of 12 Peach Genotypes. J. Am. Soc. Hortic. Sci. 1991, 116, 1004–1006. [Google Scholar] [CrossRef] [Green Version]
  5. Luchsinger, L.E.; Walsh, C.S. Development of an objective and non-destructive harvest maturity index for peaches and nectarines. Acta Hortic. 1998, 465, 679–687. [Google Scholar] [CrossRef]
  6. Ferrer, A.; Remón, S.; Negueruela, A.I.; Oria, R. Changes during the ripening of the very late season Spanish peach cultivar Calanda: Feasibility of using CIELAB coordinates as maturity indices. Sci. Hortic. 2005, 105, 435–446. [Google Scholar] [CrossRef]
  7. Do Nascimento Nunes, M.C. Color Atlas of Postharvest Quality of Fruits and Vegetables; Wiley-Blackwell: Ames, IA, USA, 2008. [Google Scholar]
  8. Scalisi, A.; O’Connell, M.G.; Pelliccia, D.; Plozza, T.; Frisina, C.; Chandra, S.; Goodwin, I. Reliability of a Handheld Bluetooth Colourimeter and Its Application to Measuring the Effects of Time from Harvest, Row Orientation and Training System on Nectarine Skin Colour. Horticulturae 2021, 7, 255. [Google Scholar] [CrossRef]
  9. Crisosto, C.H. Stone fruit maturity indices: A descriptive review. Postharvest News Inf. 1994, 5, 65N–68N. [Google Scholar]
  10. Mirbod, O.; Choi, D.; Thomas, R.; He, L. Overcurrent-driven LEDs for consistent image colour and brightness in agricultural machine vision applications. Comput. Electron. Agric. 2021, 187, 106266. [Google Scholar] [CrossRef]
  11. Silwal, A.; Parhar, T.; Yandun, F.; Kantor, G. A Robust Illumination-Invariant Camera System for Agricultural Applications. In Proceedings of the 2021 IEEE/RSJ International Conference on Intelligent Robots and Systems (IROS), Prague, Czech Republic, 27 September–1 October 2021; pp. 3292–3298. [Google Scholar] [CrossRef]
  12. Scalisi, A.; McClymont, L.; Underwood, J.; Morton, P.; Scheding, S.; Goodwin, I. Reliability of a commercial platform for estimating flower cluster and fruit number, yield, tree geometry and light interception in apple trees under different rootstocks and row orientations. Comput. Electron. Agric. 2021, 191, 106519. [Google Scholar] [CrossRef]
  13. Islam, M.S.; Scalisi, A.; O’Connell, M.G.; Morton, P.; Scheding, S.; Underwood, J.; Goodwin, I. A ground-based platform for reliable estimates of fruit number, size and colour in stone fruit orchards. Comput. Electron. Agric. 2022. [Google Scholar]
  14. Islam, M.S. RGB-to-CIELab Conversion. Available online: https://github.com/sirajulislam/RGB-to-CIELab/blob/main/rgb2_labrgblch.py/ (accessed on 20 December 2021).
  15. Costa, G.; Noferini, M.; Fiori, G.; Torrigiani, P. Use of Vis/NIR Spectroscopy to Assess Fruit Ripening Stage and Improve Management in Post-Harvest Chain Invited Mini-Review Fresh Produce Use of Vis/NIR Spectroscopy to Assess Fruit Ripening Stage and Improve Management in Post-Harvest Chain. Fresh Prod. 2009, 1, 35–41. [Google Scholar]
  16. Soto, A.; Ruiz, K.B.; Ziosi, V.; Costa, G.; Torrigiani, P. Ethylene and auxin biosynthesis and signaling are impaired by methyl jasmonate leading to a transient slowing down of ripening in peach fruit. J. Plant Physiol. 2012, 169, 1858–1865. [Google Scholar] [CrossRef] [PubMed]
  17. Bonora, E.; Stefanelli, D.; Costa, G. Nectarine fruit ripening and quality assessed using the index of absorbance difference (IAD). Int. J. Agron. 2013, 2013, 242461. [Google Scholar] [CrossRef] [Green Version]
  18. Bonora, E.; Noferini, M.; Vidoni, S.; Costa, G. Modeling fruit ripening for improving peach homogeneity in planta. Sci. Hortic. 2013, 159, 166–171. [Google Scholar] [CrossRef]
  19. Spadoni, A.; Cameldi, I.; Noferini, M.; Bonora, E.; Costa, G.; Mari, M. An innovative use of DA-meter for peach fruit postharvest management. Sci. Hortic. 2016, 201, 140–144. [Google Scholar] [CrossRef]
  20. Stefanelli, D.; Lopresti, J.; Hale, G.; Jaeger, J.; Frisina, C.; Jones, R.; Tomkins, B. Modelling peach and nectarine ripening during storage using the IAD maturity index. Acta Hortic. 2017, 1154, 17–23. [Google Scholar] [CrossRef]
  21. Zhang, B.; Peng, B.; Zhang, C.; Song, Z.; Ma, R. Determination of fruit maturity and its prediction model based on the pericarp index of absorbance difference (IAD) for peaches. PLoS ONE 2017, 12, e0177511. [Google Scholar] [CrossRef]
  22. Victorian Horticulture Industry Network DA Meter IAD Maturity Classes: Database—HIN. Available online: http://www.hin.com.au/networks/profitable-stonefruit-research/stonefruit-maturity-and-fruit-quality/da-meter-iad-maturity-classes-database (accessed on 10 February 2022).
  23. Zhang, P.; Wei, Y.; Xu, F.; Wang, H.; Chen, M.; Shao, X. Changes in the chlorophyll absorbance index (IAD) are related to peach fruit maturity. N. Z. J. Crop Hortic. Sci. 2020, 48, 34–46. [Google Scholar] [CrossRef]
  24. Scalisi, A.; O’Connell, M.G. Application of visible/NIR spectroscopy for the estimation of soluble solids, dry matter and flesh firmness in stone fruits. J. Sci. Food Agric. 2021, 101, 2100–2107. [Google Scholar] [CrossRef]
  25. Frisina, C.; Stefanelli, D.; Giri, K.; Tomkins, B. A revised method for the field collection and storage of fruit ethylene samples using evacuated vials. Sci. Hortic. 2018, 236, 123–126. [Google Scholar] [CrossRef]
  26. Scalisi, A.; Pelliccia, D.; O’Connell, M.G. Maturity Prediction in Yellow Peach (Prunus persica L.) Cultivars Using a Fluorescence Spectrometer. Sensors 2020, 20, 6555. [Google Scholar] [CrossRef] [PubMed]
  27. Gallucci, M. General Analyses for Linear Models. Available online: https://gamlj.github.io/ (accessed on 15 March 2022).
  28. Mendoza, F.; Dejmek, P.; Aguilera, J.M. Calibrated color measurements of agricultural foods using image analysis. Postharvest Biol. Technol. 2006, 41, 285–295. [Google Scholar] [CrossRef]
  29. Kang, S.P.; East, A.R.; Trujillo, F.J. Colour vision system evaluation of bicolour fruit: A case study with ‘B74′ mango. Postharvest Biol. Technol. 2008, 49, 77–85. [Google Scholar] [CrossRef]
  30. Gardner, J.L. Comparison of calibration methods for tristimulus colorimeters. J. Res. Natl. Inst. Stand. Technol. 2007, 112, 129–138. [Google Scholar] [CrossRef]
  31. Bible, B.B.; Singha, S. Canopy Position Influences CIELAB Coordinates of Peach Color. HortScience 1993, 28, 992–993. [Google Scholar] [CrossRef] [Green Version]
  32. Herrero-Langreo, A.; Fernández-Ahumada, E.; Roger, J.M.; Palagós, B.; Lleó, L. Combination of optical and non-destructive mechanical techniques for the measurement of maturity in peach. J. Food Eng. 2012, 108, 150–157. [Google Scholar] [CrossRef] [Green Version]
  33. Kader, A.A. Fruit maturity, ripening, and quality relationships. Acta Hortic. 1999, 485, 203–208. [Google Scholar] [CrossRef]
  34. Crisosto, C.H.; Costa, G. Preharvest factors affecting peach quality. In The Peach: Botany, Production and Uses; CABI: Wallingford, UK, 2008; pp. 536–549. [Google Scholar] [CrossRef] [Green Version]
  35. Anthony, B.M.; Minas, I.S. Redefining the impact of preharvest factors on peach fruit quality development and metabolism: A review. Sci. Hortic. 2022, 297, 110919. [Google Scholar] [CrossRef]
Figure 1. CieLAB colour space and representation of hue angle (h°) and Colour Development Index (CDI) values around the colour wheel (adapted with permission from Scalisi et al. [8]).
Horticulturae 08 00459 g001
Figure 2. Colour Development Index (CDI) expected response in peach fruit with different skin pigmentation.
Horticulturae 08 00459 g002
Figure 3. Spatial map of ‘O’Henry’ (60 trees), ‘Snow Flame 23’ (30 trees), ‘Snow Flame 25’ (30 trees) and ‘August Bright’ (60 trees) experimental plots and tree position in the Stonefruit experimental orchard at the Tatura SmartFarm.
Horticulturae 08 00459 g003
Figure 4. Spatial map of four row orientations and 720 ‘Majestic Pearl’ nectarine trees (180 trees per row orientation block) in the Sundial orchard at the Tatura SmartFarm.
Horticulturae 08 00459 g004
Figure 5. Average fruit Colour Development Index (CDI) per image in ready-to-harvest ‘Snow Flame 23’ peach fruit scanned at (A) 430, (B) 715, (C) 1015, (D) 1315, (E) 1615, (F) 1915 and (G) 2130 h (AEDT) on 14 December 2021. Images collected on east and west sides of the canopy. Brightness and contrast of the original images was increased by 50% to improve visualisation. In panel (H), detected fruit are shown with red detection boxes in a zoomed in image.
Horticulturae 08 00459 g005
Figure 6. Daily trends of colour development index (CDI) in fruit of (A) ‘O’Henry’, (B) ‘Snow Flame 23’ and (C) ‘Snow Flame 25’ peaches, and (D) ‘August Bright’ nectarine in the east and west side of the canopies. Error bars represent 95% confidence intervals of the estimates.
Horticulturae 08 00459 g006
Figure 7. Daily trend of fruit colour development index (CDI) in peach and nectarine cultivars with east- and west-exposed fruit pooled together. Grey bands highlight night-time before sunrise and after sunset, whereas dashed vertical line represents solar noon. Error bars represent 95% confidence intervals of the estimates and different letters show significant differences (p < 0.05) after a Bonferroni post hoc test.
Horticulturae 08 00459 g007
Figure 8. Natural logarithms of ethylene emission (ETHln) and corresponding Index of Absorbance Difference (IAD) in a sample of 123 ‘Majestic Pearl’ nectarine fruit collected at different times before and after harvest in 2020–2021. The horizontal dashed line shows ETHln = 0, whereas vertical error bars represent standard errors of ETHln. The fit is characterised by a piecewise regression with a three-segment line. The vertical red line represents the identified IAD threshold for climacteric onset.
Horticulturae 08 00459 g008
Figure 9. Polynomial regression fit (black line) describing the relationship between Colour Development Index (CDI) and Index of Absorbance Difference (IAD) in ‘Majestic Pearl’ nectarine fruit in 2021–2022. The points represent medians of experimental units (row orientation arm) at different times form harvest (n = 80 per experimental unit); horizontal and vertical bars show standard errors of the means; green lines show 95% confidence intervals. Model equation: CDI = 0.835 (0.004) − 0.030 (0.002) × IAD2 × ln (IAD); p < 0.001; R2 = 0.905; S.E. = 0.015.
Horticulturae 08 00459 g009
Figure 10. Cubic regression fit (black line) of Colour Development Index (CDI) against time (days from harvest, DfH) in ‘Majestic Pearl’ nectarine fruit measured in 2021–2022. The points represent means of experimental units (row orientation arm; n = 4) at different times form harvest and vertical bars show standard errors of the means. The red horizontal line represents the predicted CDI value at harvest (DfH = 0) and green lines represent the standard errors of the prediction. Model equation: CDI = 0.833 + 0.002 × DfH − 0.0003 × DfH2 − 1.04 × 10⁻⁵ × DfH3; p < 0.001; R2 = 0.973; S.E. = 0.011.
Horticulturae 08 00459 g010
Table 1. Number of images and fruit detections from which the Colour Development Index (CDI) was calculated in the experimental plots shown in Figure 3. Standard deviations reported in brackets.
CultivarImages/CultivarImages/Experimental PlotFruit Detections/Image
Peach ‘O’Henry’39533 (3)175 (53)
Peach ‘Snow Flame 23’19432 (2)282 (83)
Peach ‘Snow Flame 25’18731 (2)152 (38)
Nectarine ‘August Bright’41234 (3)75 (20)
Publisher’s Note: MDPI stays neutral with regard to jurisdictional claims in published maps and institutional affiliations.

