Article

Evaluation of the Storage Performance of ‘Valencia’ Oranges and Generation of Shelf-Life Prediction Models

1
Department of Postharvest Science of Fresh Produce, ARO, The Volcani Institute, Rishon LeZion 7528809, Israel
2
Robert H. Smith Faculty of Agricultural, Food and Environmental Sciences, The Hebrew University of Jerusalem, Rehovot 76100, Israel
3
Genomics and Bioinformatics Unit, ARO, The Volcani Institute, Rishon LeZion 7528809, Israel
4
Department of Industrial Engineering, Tel Aviv University, Tel Aviv 6997801, Israel
5
Department of Growing, Production and Environmental Engineering, ARO, The Volcani Institute, Rishon LeZion 7528809, Israel
*
Author to whom correspondence should be addressed.
Submission received: 31 May 2022 / Revised: 14 June 2022 / Accepted: 20 June 2022 / Published: 22 June 2022
(This article belongs to the Special Issue Postharvest Management of Citrus Fruit)

Abstract

:
We conducted a large-scale, high-throughput phenotyping analysis of the effects of various preharvest and postharvest features on the quality of ‘Valencia’ oranges in order to develop shelf-life prediction models. Altogether, we evaluated 10,800 oranges (~3.6 tons) harvested from three orchards at different periods and conducted 151,200 measurements of 14 quality parameters. The storage time was the most important feature affecting fruit quality, followed by the yield, storage temperature, humidity, and harvest time. The storage time and temperature features significantly affected (p < 0.001) all or most of the tested quality parameters, whereas the harvest time, yield, and humidity conditions significantly affected several particular quality parameters, and the selection of rootstocks had no significant effect at all. Five regression models were evaluated for their ability to predict fruit quality based on preharvest and postharvest features. Non-linear Support Vector Regression (SVR) combined with a data-balancing approach was found to be the most effective approach. It allowed the prediction of fruit-acceptance scores among the full data set, with a root mean square error (RMSE) of 0.195 and an R2 of 0.884. The obtained data and models should assist in determining the potential storage times of different batches of fruit.

1. Introduction

Orange (Citrus sinensis) is the world’s fifth-largest fruit crop, with annual global production of 75.4 million tons [1]. Oranges, like other citrus fruits, are very popular and appreciated for their delicate, fruity, and refreshing flavor, as well as their high nutritional value [2].
‘Valencia’ orange is a late-season variety with excellent taste and color, and is primarily grown for processing and orange juice production [3]. As it is a widely cultivated late-season variety, ‘Valencia’ fruits are commercially stored for relatively long periods of up to 4–5 months in order to extend the marketing season [4,5].
The postharvest storage performance of oranges may be affected by various preharvest and postharvest features [6]. Preharvest features, such as the climate conditions, cultivation practices, harvest time, choice of rootstock, tree age, and yield, may affect the postharvest quality [7,8]. For example, early harvested ‘Valencia’ oranges had higher weight loss rates during postharvest storage, but had fewer decay symptoms as compared with late-season-harvested fruit [4]. Furthermore, the selection of rootstocks may affect the development of peel disorders during storage [9]. Other preharvest features, such as the tree age and yield, may affect the sugar and acidity levels, firmness, and physiological behaviors manifesting as the respiration and ethylene production rates [10].
The postharvest storage performance of oranges is greatly influenced by the environmental conditions under which the fruits are stored, especially the temperature and relative humidity (RH) [6]. Temperature is the most important environmental factor affecting fruit quality after harvest, as low storage temperatures reduce respiration, the rate of ethylene production, water loss, and pathogen growth, but may cause chilling injury (CI) [6]. The optimal RH for the postharvest storage of most fruit species is 90–95%. Lower RH levels lead to greater water loss and RH levels that are too high may lead to condensation and the enhanced growth of pathogens [11]. Overall, it is recommended to store oranges at 3–6 °C and 90–95% RH [6].
Currently, the postharvest storage management of fruits and vegetables is predominantly governed by the First In, First Out (FIFO) logistics strategy, meaning that marketing decisions are based solely on storage time, irrespective of the initial quality of the produce and its remaining potential shelf life [12,13]. Although the FIFO approach is straightforward and easy to implement, it is based on the assumption that all products arriving at the cold-storage facility on a particular date have the same shelf-life potential, which, all too often, is not the actual case [12]. In contrast, the adoption of the more advanced First Expired, First Out (FEFO) logistics strategy would enable more efficient inventory management based on shelf-life predictions for each particular batch of produce to ensure that only high-quality produce will reach the distinct marketing destinations [13]. However, the adoption of an intelligent FEFO logistics-management system requires the development of accurate shelf-life prediction models that will provide reliable information regarding the remaining shelf-life of each batch of produce.
In recent years, various models have been developed to predict numerous postharvest storage traits, including the respiration rate; microbial growth; physical, chemical, and sensorial characteristics; and storage life [14,15,16,17]. Advanced machine learning and artificial intelligence technologies now allow for the development of even more accurate forecasting and prediction models for important agriculture outputs [18,19]. Nonetheless, the development of accurate and advanced shelf-life prediction models requires the acquisition of large amounts of postharvest storage data and the consideration of all of the factors that may affect produce quality, including various preharvest and postharvest features [20,21].
Overall, the main objective of the current research was to conduct a large-scale, high-throughput phenotyping analysis of the postharvest storage performance of ‘Valencia’ oranges in order to develop shelf-life prediction models to enable the implementation of the FEFO method. To that end, we evaluated 10,800 oranges (~3.6 tons) from different orchards and harvest periods and conducted 151,200 measurements of 14 quality parameters.

2. Materials and Methods

2.1. Plant Material

‘Valencia’ oranges grown on Sour orange (SO) and Volka mariana (VOL) rootstocks were harvested from three commercial orchards between 18 April 2021 and 12 May 2021, as described in Table 1. The day after harvest, the fruits were treated in a commercial citrus packinghouse. The treatment included washing, waxing, the application of fungicides, sorting, and packaging according to common commercial practices. Then, the fruits were transferred to the Department of Postharvest Science, ARO, The Volcani Institute, where they were placed in cold storage rooms as described below.

2.2. Postharvest Storage Conditions

Fruits from each orchard were stored at 90% RH and at two different storage temperatures of 2 and 5 °C. Fruits from Harvest 4 (Table 1) were also stored at 5 °C under high-humidity (RH = 95%) and low-humidity conditions (RH = 70%). The high RH was achieved by using a PARKOO PH06LB ultrasonic humidifier (Guangzhou DongAo Electrical Co., Ltd., Foshan, China) and the low RH was achieved by using an IVLTD08 dehumidifier (Vogel Refrigeration Services, Ltd., Rishon LeZion, Israel). The normal RH at 5 °C without modification was ~90%. Each harvest included 60 10 kg cartons of oranges (30 cartons were stored at each temperature), while Harvest 4 included 120 10 kg cartons of oranges (30 cartons stored at each temperature and/or RH condition). Overall, the experiment included 360 10 kg cartons of oranges (i.e., a total of 3.6 tons of oranges).

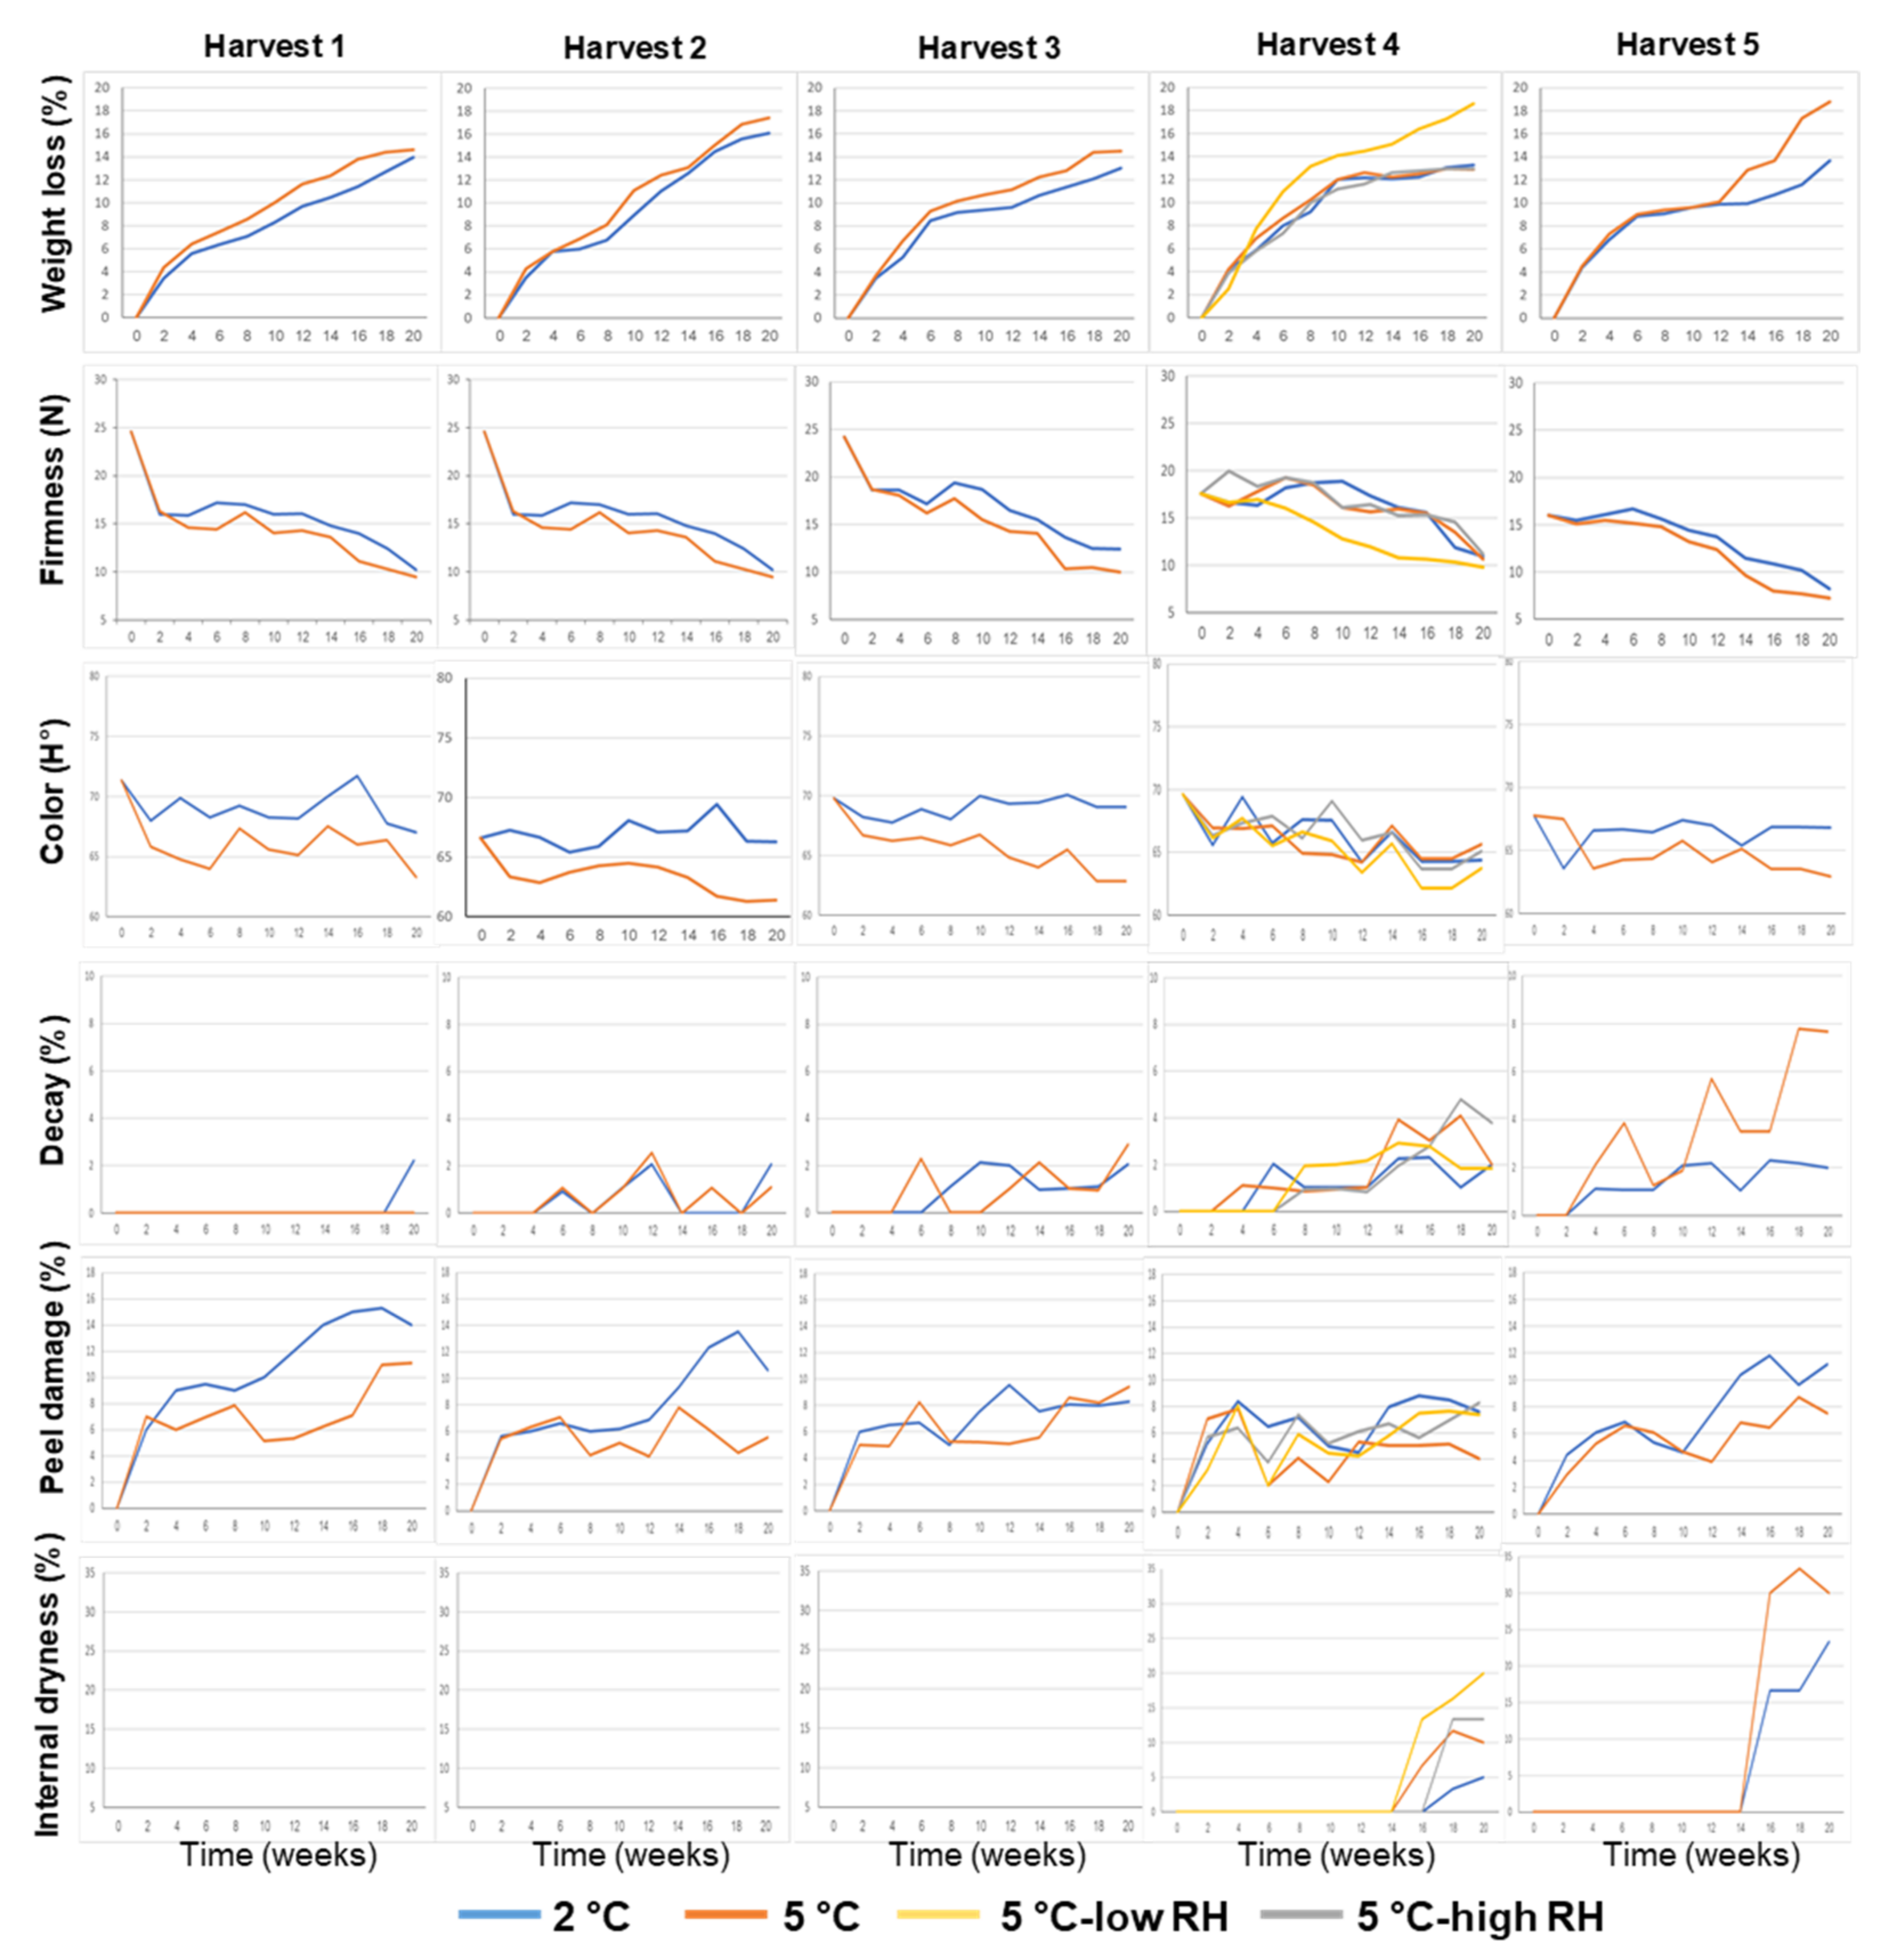
2.3. Evaluations of Fruit Quality

Evaluations of fruit quality were conducted at Time 0 and every two weeks over a period of 20 weeks (~4.5 months). The quality evaluations were conducted after one additional week of storage under shelf-life conditions at 20 °C. The different quality evaluations are described below.

2.3.1. Firmness

Firmness was tested with a texture analyzer (TA-XT plus, Stable Micro Systems, Surrey, UK) with a 50 kg load cell, using a 75 mm (diam.) cylindrical probe. The machine compressed the samples (15 replicates for each treatment and storage time) in the equatorial zone until 5% deformation at a speed of 1 mm·s−1. The results were expressed as the maximal force required to induce that level of deformation and expressed in Newtons (N).

2.3.2. Weight Loss

Weight loss was evaluated by measuring the weight of the produce at time zero (W0) and after the various storage periods (final weight, Wx), and the results were expressed as the percentage of weight lost from the initial weight.
% Weight loss = [(W0 − Wx)/W0] × 100

2.3.3. Peel Color

Peel color was determined by measuring the lightness (L*), chroma (C*), and hue angle (H°) values using a Minolta Chromo Meter, Model CR-400 (Minolta, Tokyo, Japan). The presented data were the means of 15 measurements.

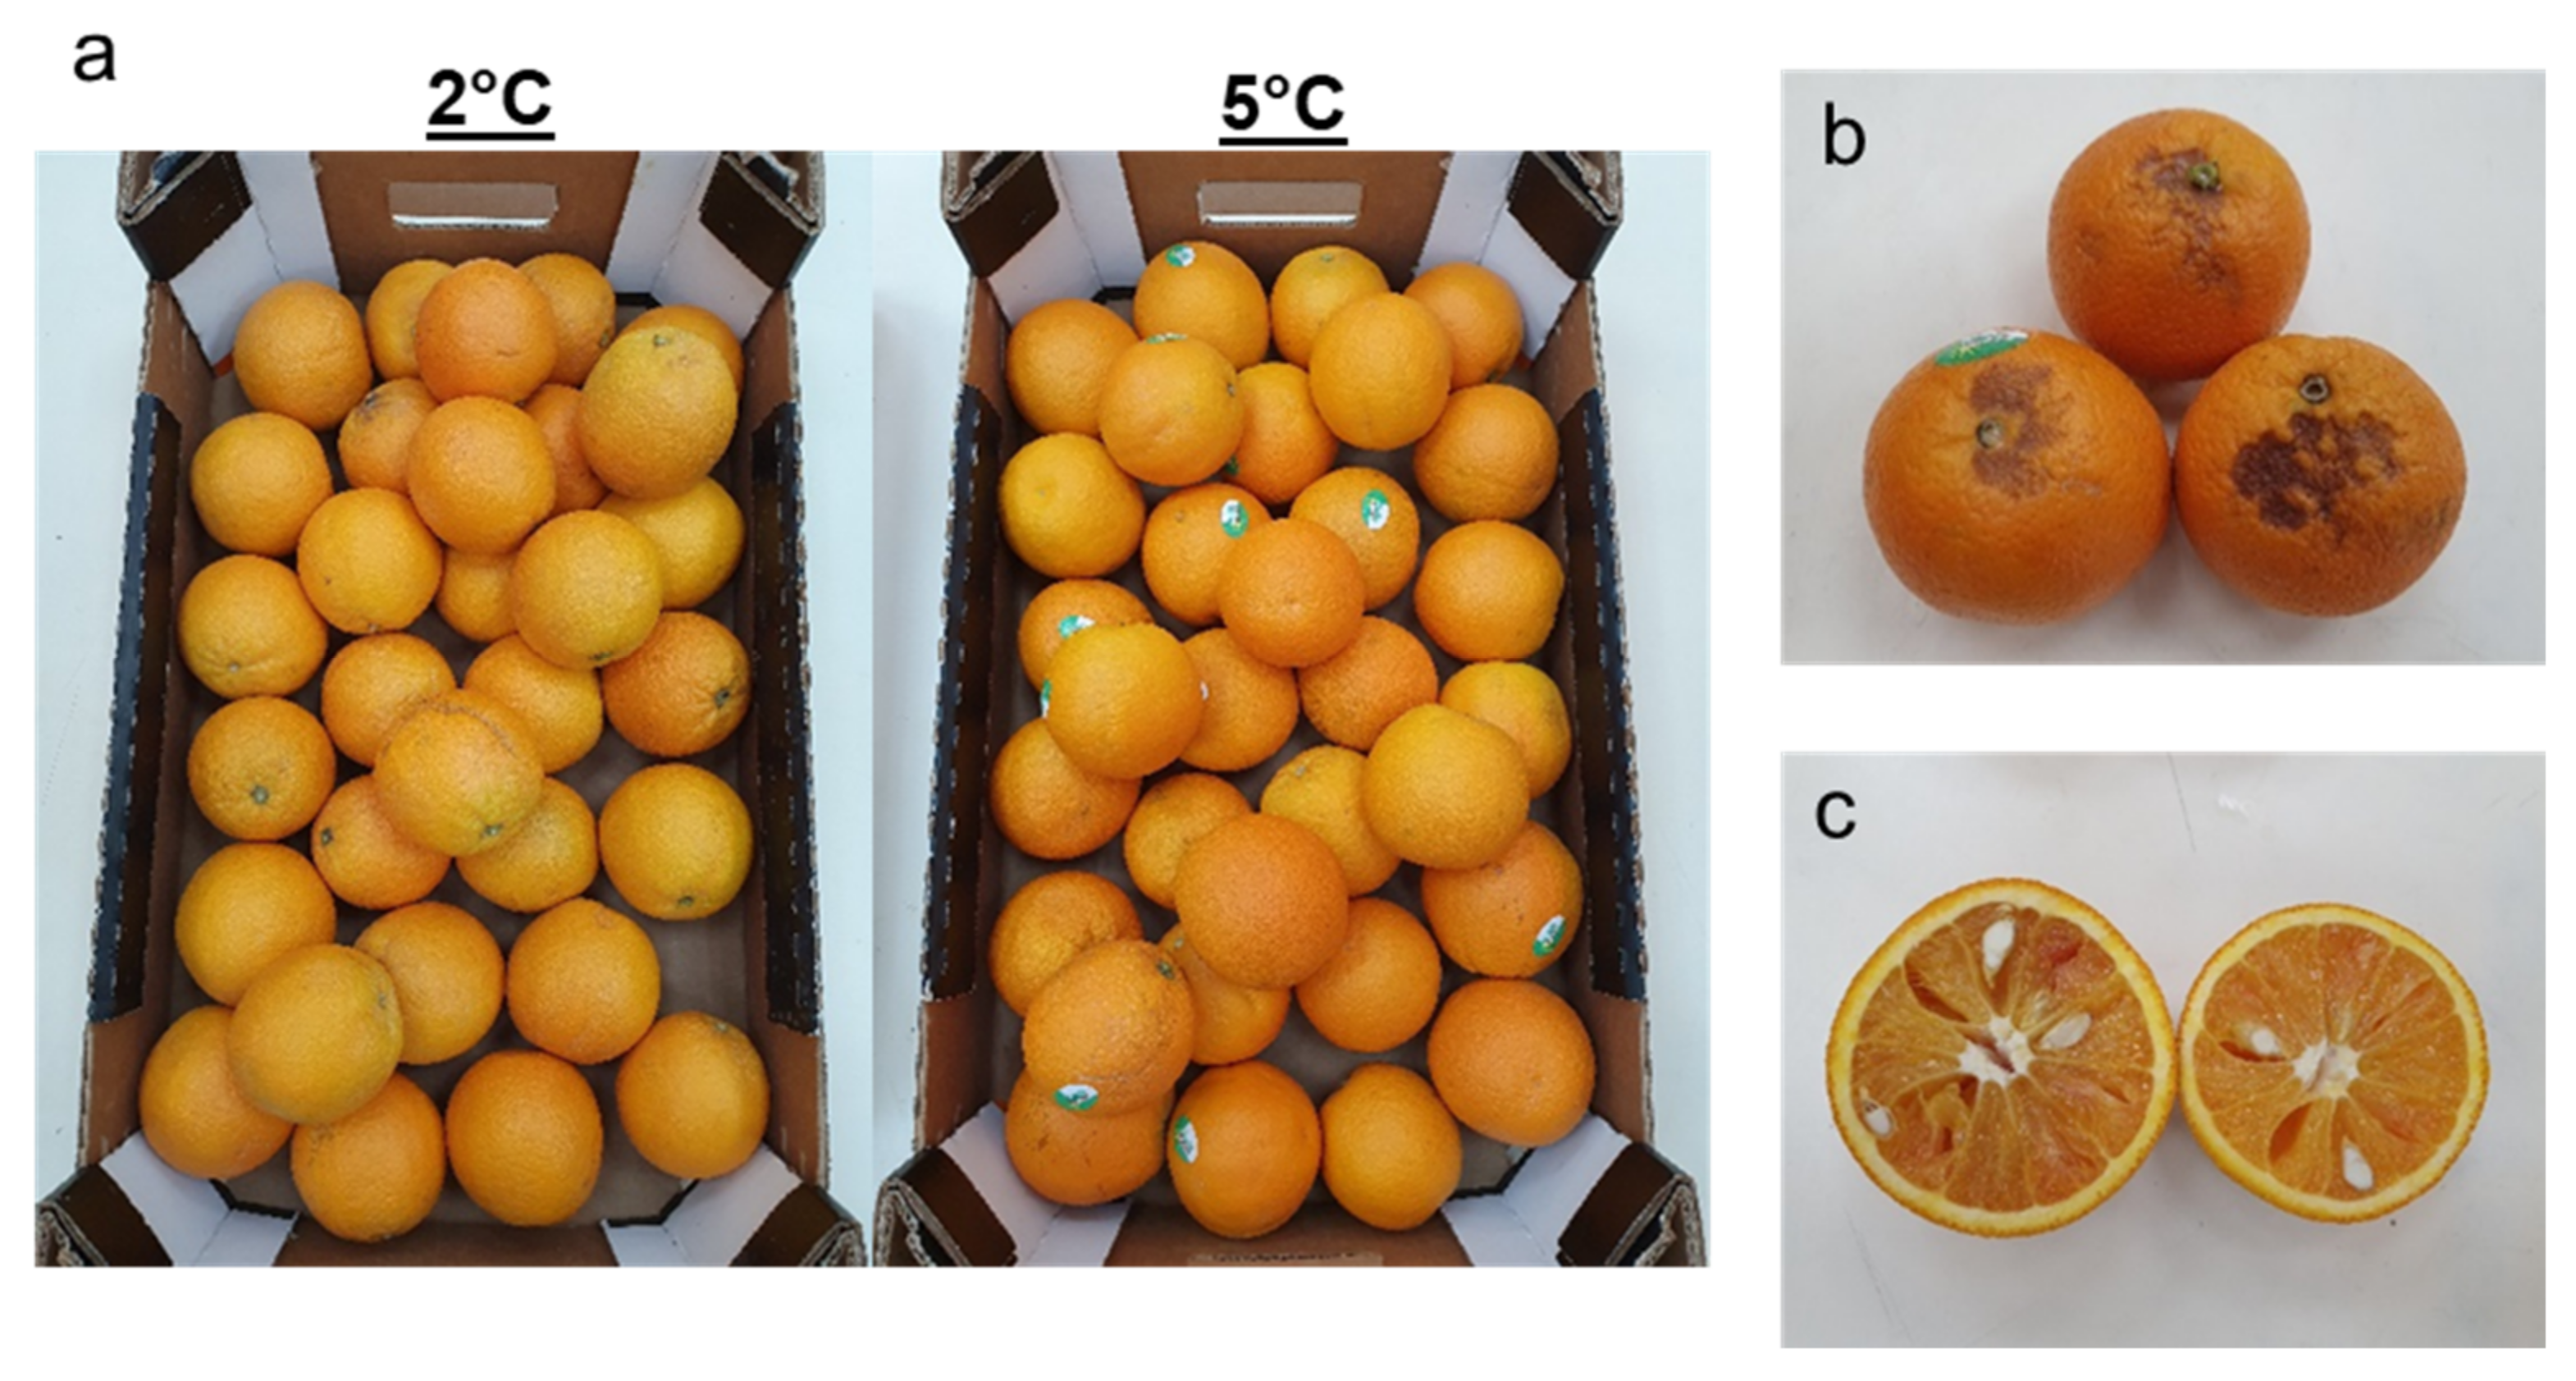
2.3.4. Peel Damage, Decay, and Internal Dryness

Peel damage, the incidence of decay, and internal dryness were evaluated for the different storage periods following the manual sorting of the produce. The results were expressed as the percentage of infected fruits among the total amount of produce as described below:
% disordered fruit = (number of disordered fruit/total number of fruit) × 100

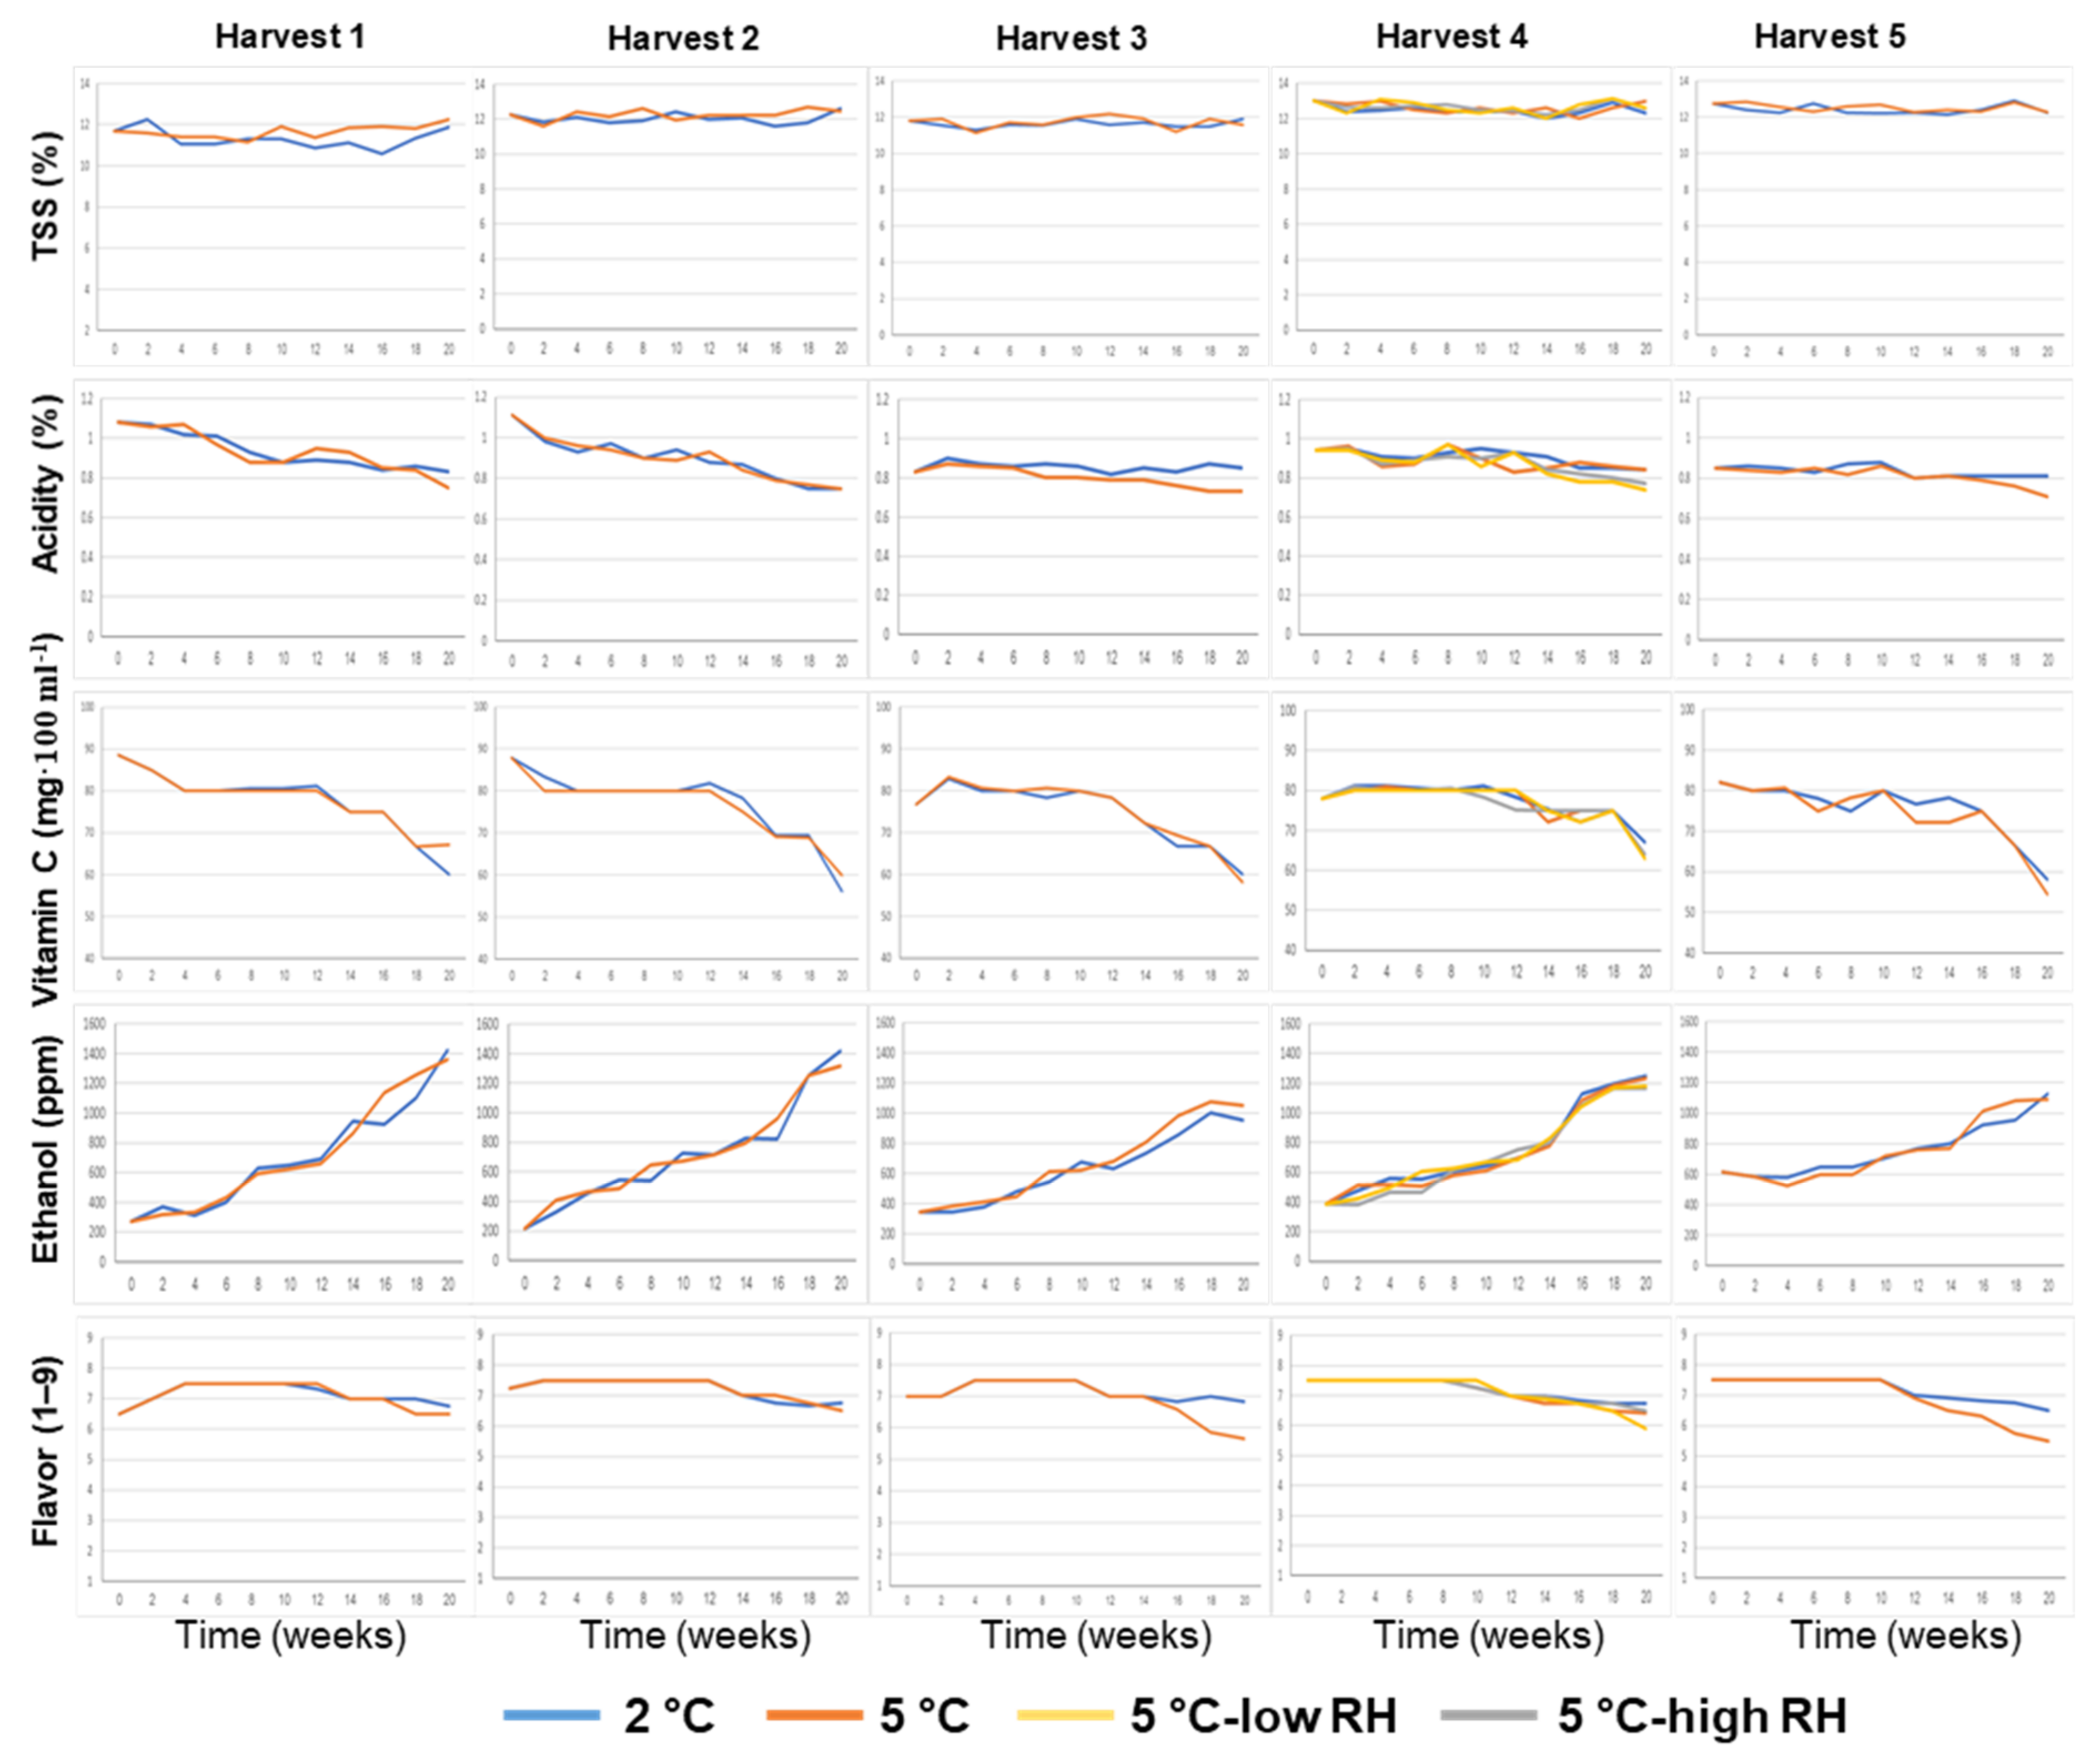
2.3.5. Total Soluble Solids (TSS) and Titratable Acidity (TA)

The total soluble solids (TSS) contents of the extracted juice were determined with a Model PAL-1 digital refractometer (Atago, Tokyo, Japan), and the acidity levels (%) were measured by titration to pH 8.3 with 0.1 M NaOH using a Model CH-9101 automatic titrator (Metrohm, Herisau, Switzerland). Each measurement was replicated three times, with juice collected from three fruits used each time.

2.3.6. Vitamin C

The vitamin C (ascorbic acid) content of the orange juice was determined by titration with 2,6-dichlorophenolindophenol. The levels of ascorbic acid were determined by comparing the titration volumes of the fruit juices with those of a standard solution containing 0.1% ascorbic acid as described below:
Ascorbic acid (mg/100 mL) = (μL of 0.1% standard solution/X μL of juice sample) × 100

2.3.7. Ethanol Levels

The juice ethanol concentrations were determined as described by Davis and Chace [22]. Generally, 10 mL aliquots of juice were incubated at 37 °C for 30 min in 25 mL Erlenmeyer flasks. In parallel, Erlenmeyer flasks containing 10 mL of 100 µL L−1 ethanol were used as internal standards for quantity evaluations. After incubation, 2 mL gas samples were withdrawn from the Erlenmeyers’ headspaces into syringes and the ethanol levels were determined with a Varian 3300 gas chromatograph. The results are the means of three replications; each replicate included juice collected from three different fruits.

2.3.8. Flavor

Flavor evaluations were conducted by three trained judges who used a 1–9 hedonic scale, in which 1 = very bad and 9 = excellent.

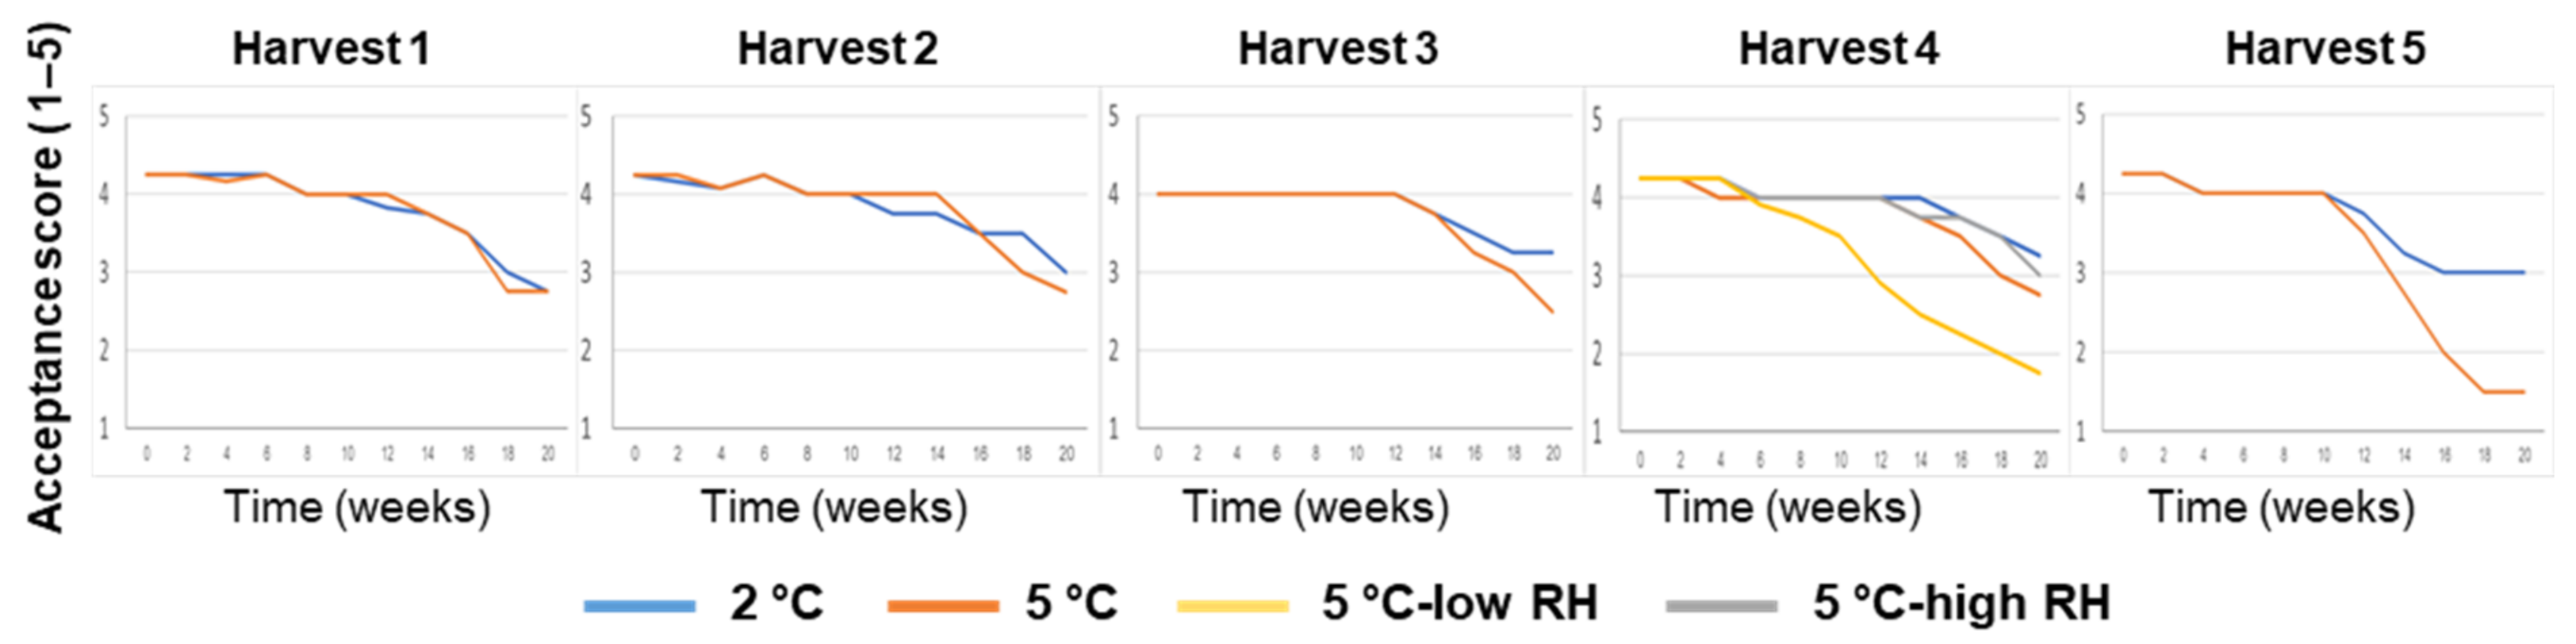
2.3.9. Acceptance Scores

The visual and final acceptance scores were assigned by three trained judges using a 5-grade scale, in which 1 = very bad, 2 = poor, 3 = fair, 4 = good, and 5 = excellent.

2.4. Statistical Analysis

Feature-importance values were analyzed using mean Shapley additive explanation (SHAP) values [23]. The ClusViz tool was used for heatmap graphical representation [24]. Pearson correlation values were calculated using the open-source R software version 4.1.3 (available online: http://www.r-project.org; accessed on 10 April 2022).

2.5. Quality-Prediction Models

2.5.1. Data-Set Preparation

The experiment produced 120 labeled data points; each data point included three cartons, i.e., a total of 360 cartons in the experiment. The input features were four preharvest variables (harvest date, yield, tree age, and rootstock) and three postharvest variables (storage time, temperature, and humidity). The main model’s output (i.e., label) was the 5-grade-scale final acceptance score assigned to each carton.

2.5.2. Prediction Models

We tested five different linear and non-linear regression models for their ability to predict fruit-acceptance scores. These models are described below:
  • Multiple Linear Regression (MLR)—This basic model attempts to establish a linear relationship between the features and the label [25]. The model finds the optimal parameters that minimize the mean squared error for the predicted quality scores;
  • Support Vector Regression (SVR)—SVR is a generalization of the support vector machine (SVM) for regression tasks [26,27]. Unlike other models, SVR attempts to predict the label within a small range of allowed error. In other words, while MLR punishes every prediction error, SVR tolerates small errors as long as they fall within a predefined range. SVR models often employ kernels, which enable the model to handle non-linearity in the input space. Non-linearity is achieved by transforming the data to a higher-dimensional space, in which the relation between the inputs and the label is a linear one. In this work, two kernels were used: a linear kernel, and a radial basis function (RBF) kernel that enables non-linearity [28];
  • Random Forests (RF)—RF is a supervised ensemble method that is widely used for regression problems [29]. The RF model employs multiple regression trees (i.e., forests) to reduce the variance error [30]. For each tree, the model introduces different subsets of samples and features with replacements, also known as the bagging approach [31]. At the prediction time (inference), each individual tree predicts a different value and the average of all of the predictions is used. The tree structure enables non-linearity and, by averaging multiple predictions of different trees, RF decreases the variance of the model, which often leads to more accurate results than SVR or MLR;
  • Extreme Gradient Boosting (XGBoost)—This is a state-of-the-art ensemble method that has become popular in recent years for tabular data predictions [32]. Similar to RF, this model is based on regression trees. However, unlike RF, it uses a boosting approach instead of bagging. In boosting, the trees are built sequentially, with each tree trying to minimize the remaining error of all previous trees [33].

2.5.3. Evaluation of the Models

A large amount of laboratory work was conducted to evaluate 10,800 oranges and produce a data set of 120 labeled points. However, machine-learning models usually require much more data to learn and make predictions [34]. The common 80–20% training set–test set split is risky when the data set is very small, since it is more likely to introduce bias. Hence, a K-fold cross-validation method was used [35], with 5 folds and 6 repetitions, producing 30 samples. Preprocessing parameter scaling was applied to each iteration separately.
Two metrics were used for the model evaluations: root-mean-square-error (RMSE) to compare the competing alternatives and the coefficient of determination (R2) to measure the amount of variance explained by each model.

2.5.4. Duplication as a Way to Deal with Unbalanced Data Sets

In this study, the target label (i.e., acceptance score) is a 5-grade scale variable, with 5 denoting that the produce is very suitable for marketing and 1 denoting that the produce is unlikely to be purchased. The advanced FEFO logistics strategy is expected to enable efficient inventory management based on shelf-life predictions, and thus has great interest in predicting low-scoring fruit. However, low scores were relatively rare in the current data set, as only 20.83% of the samples in the total data set had scores of 3 (“fair”) or less. To cope with this challenge, the training set samples with scores that were equal to or lower than 3 were duplicated. Overall, four modes of duplication were compared: no duplication (i.e., 0) and 1 to 3 duplications.

3. Results

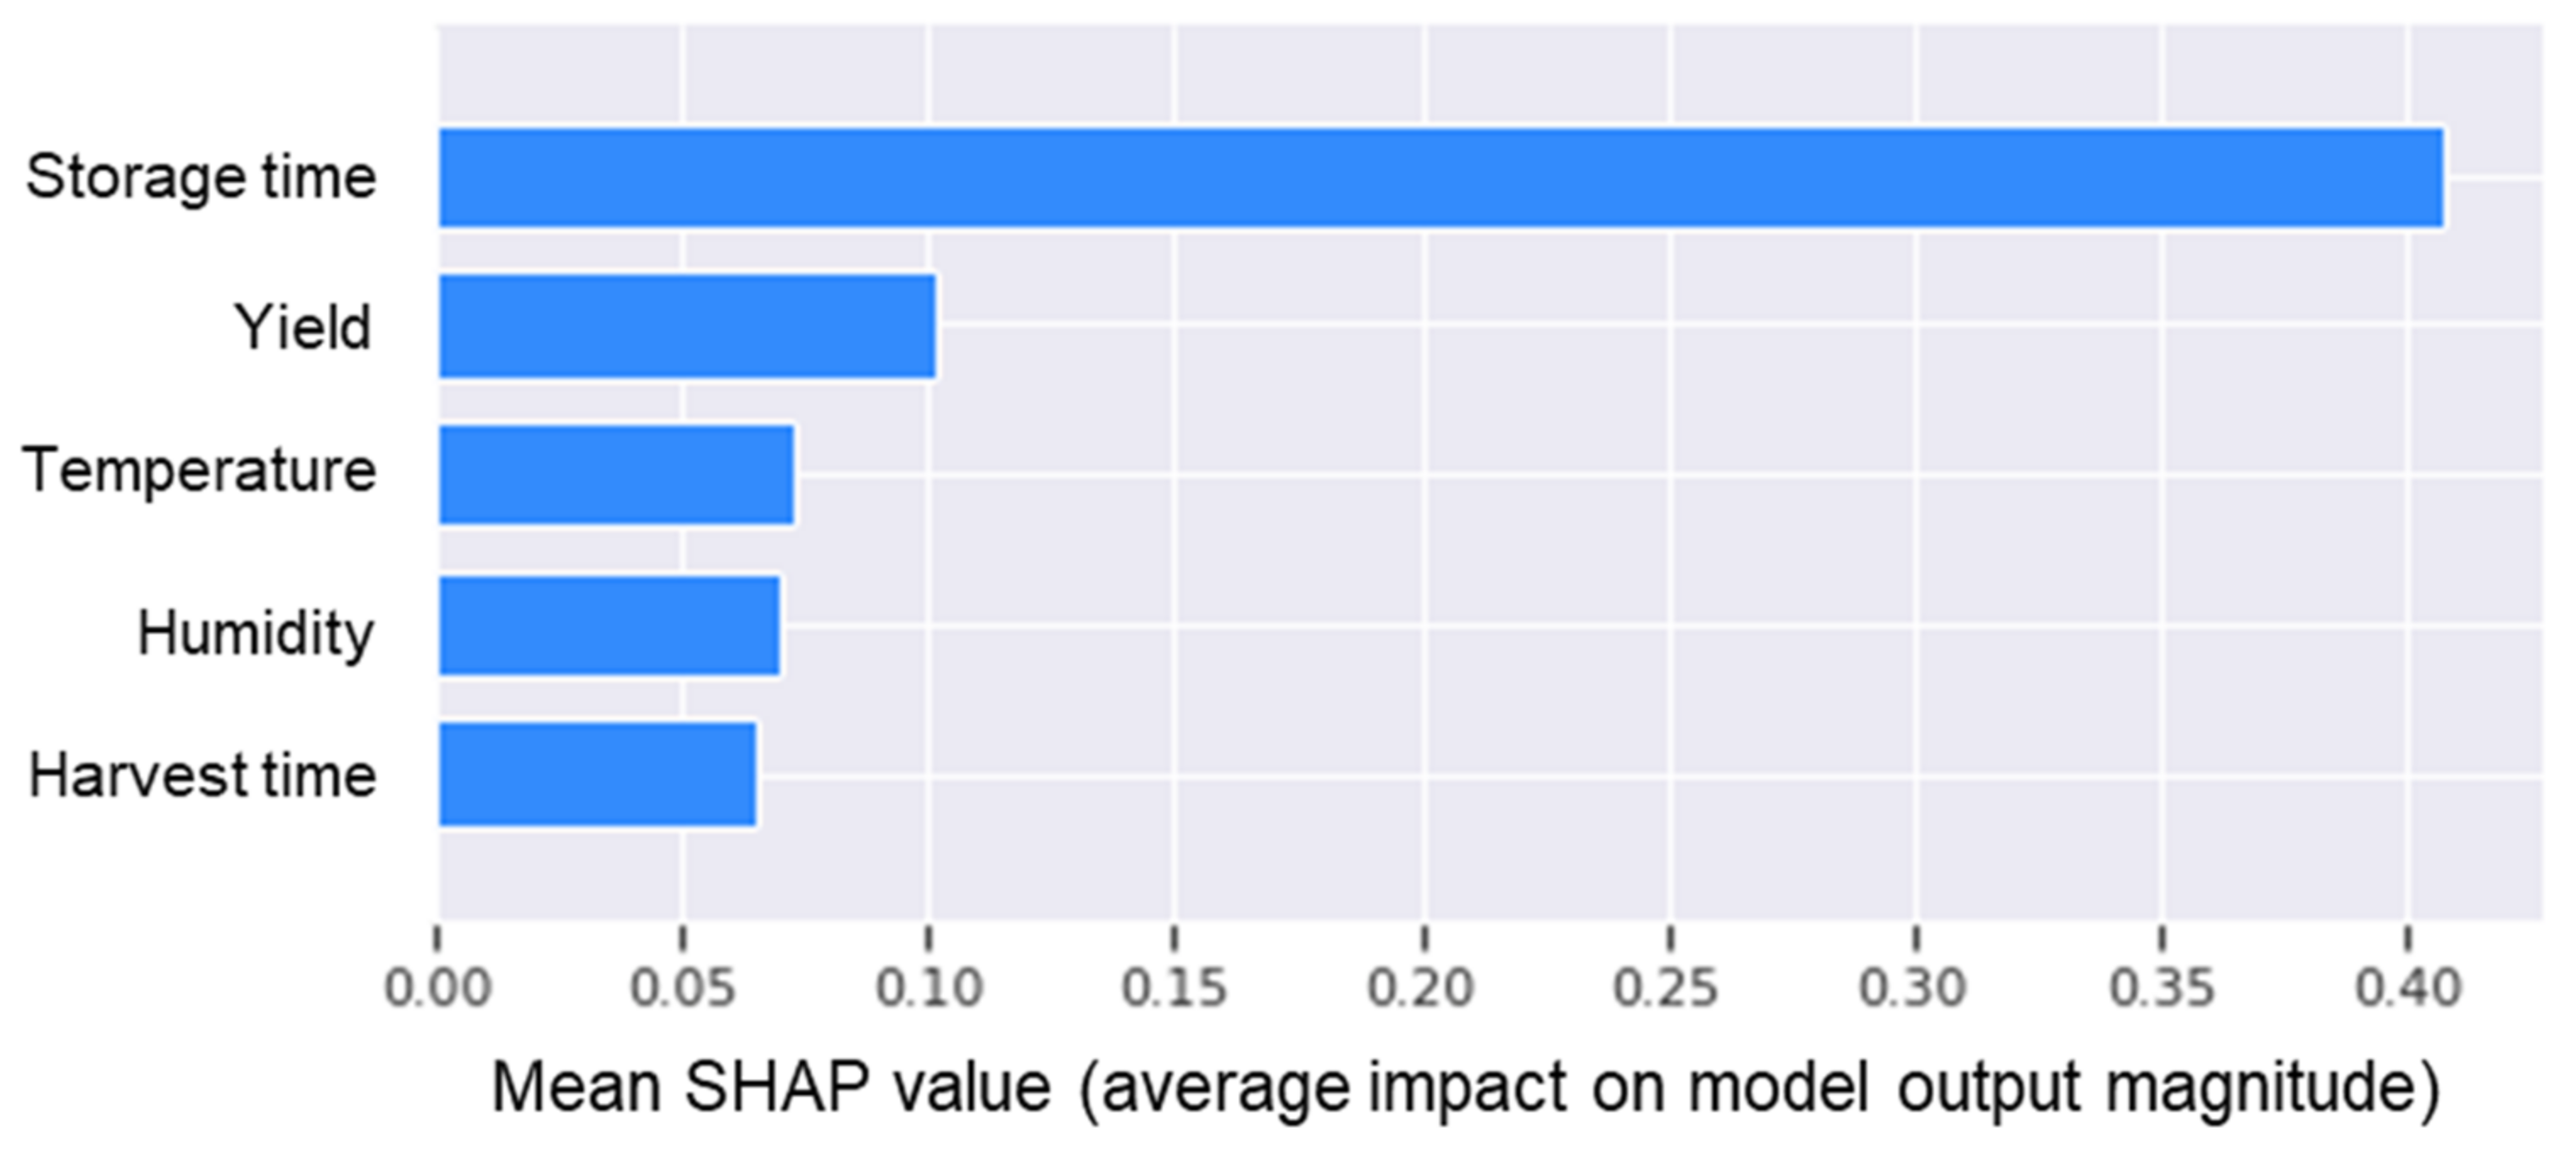
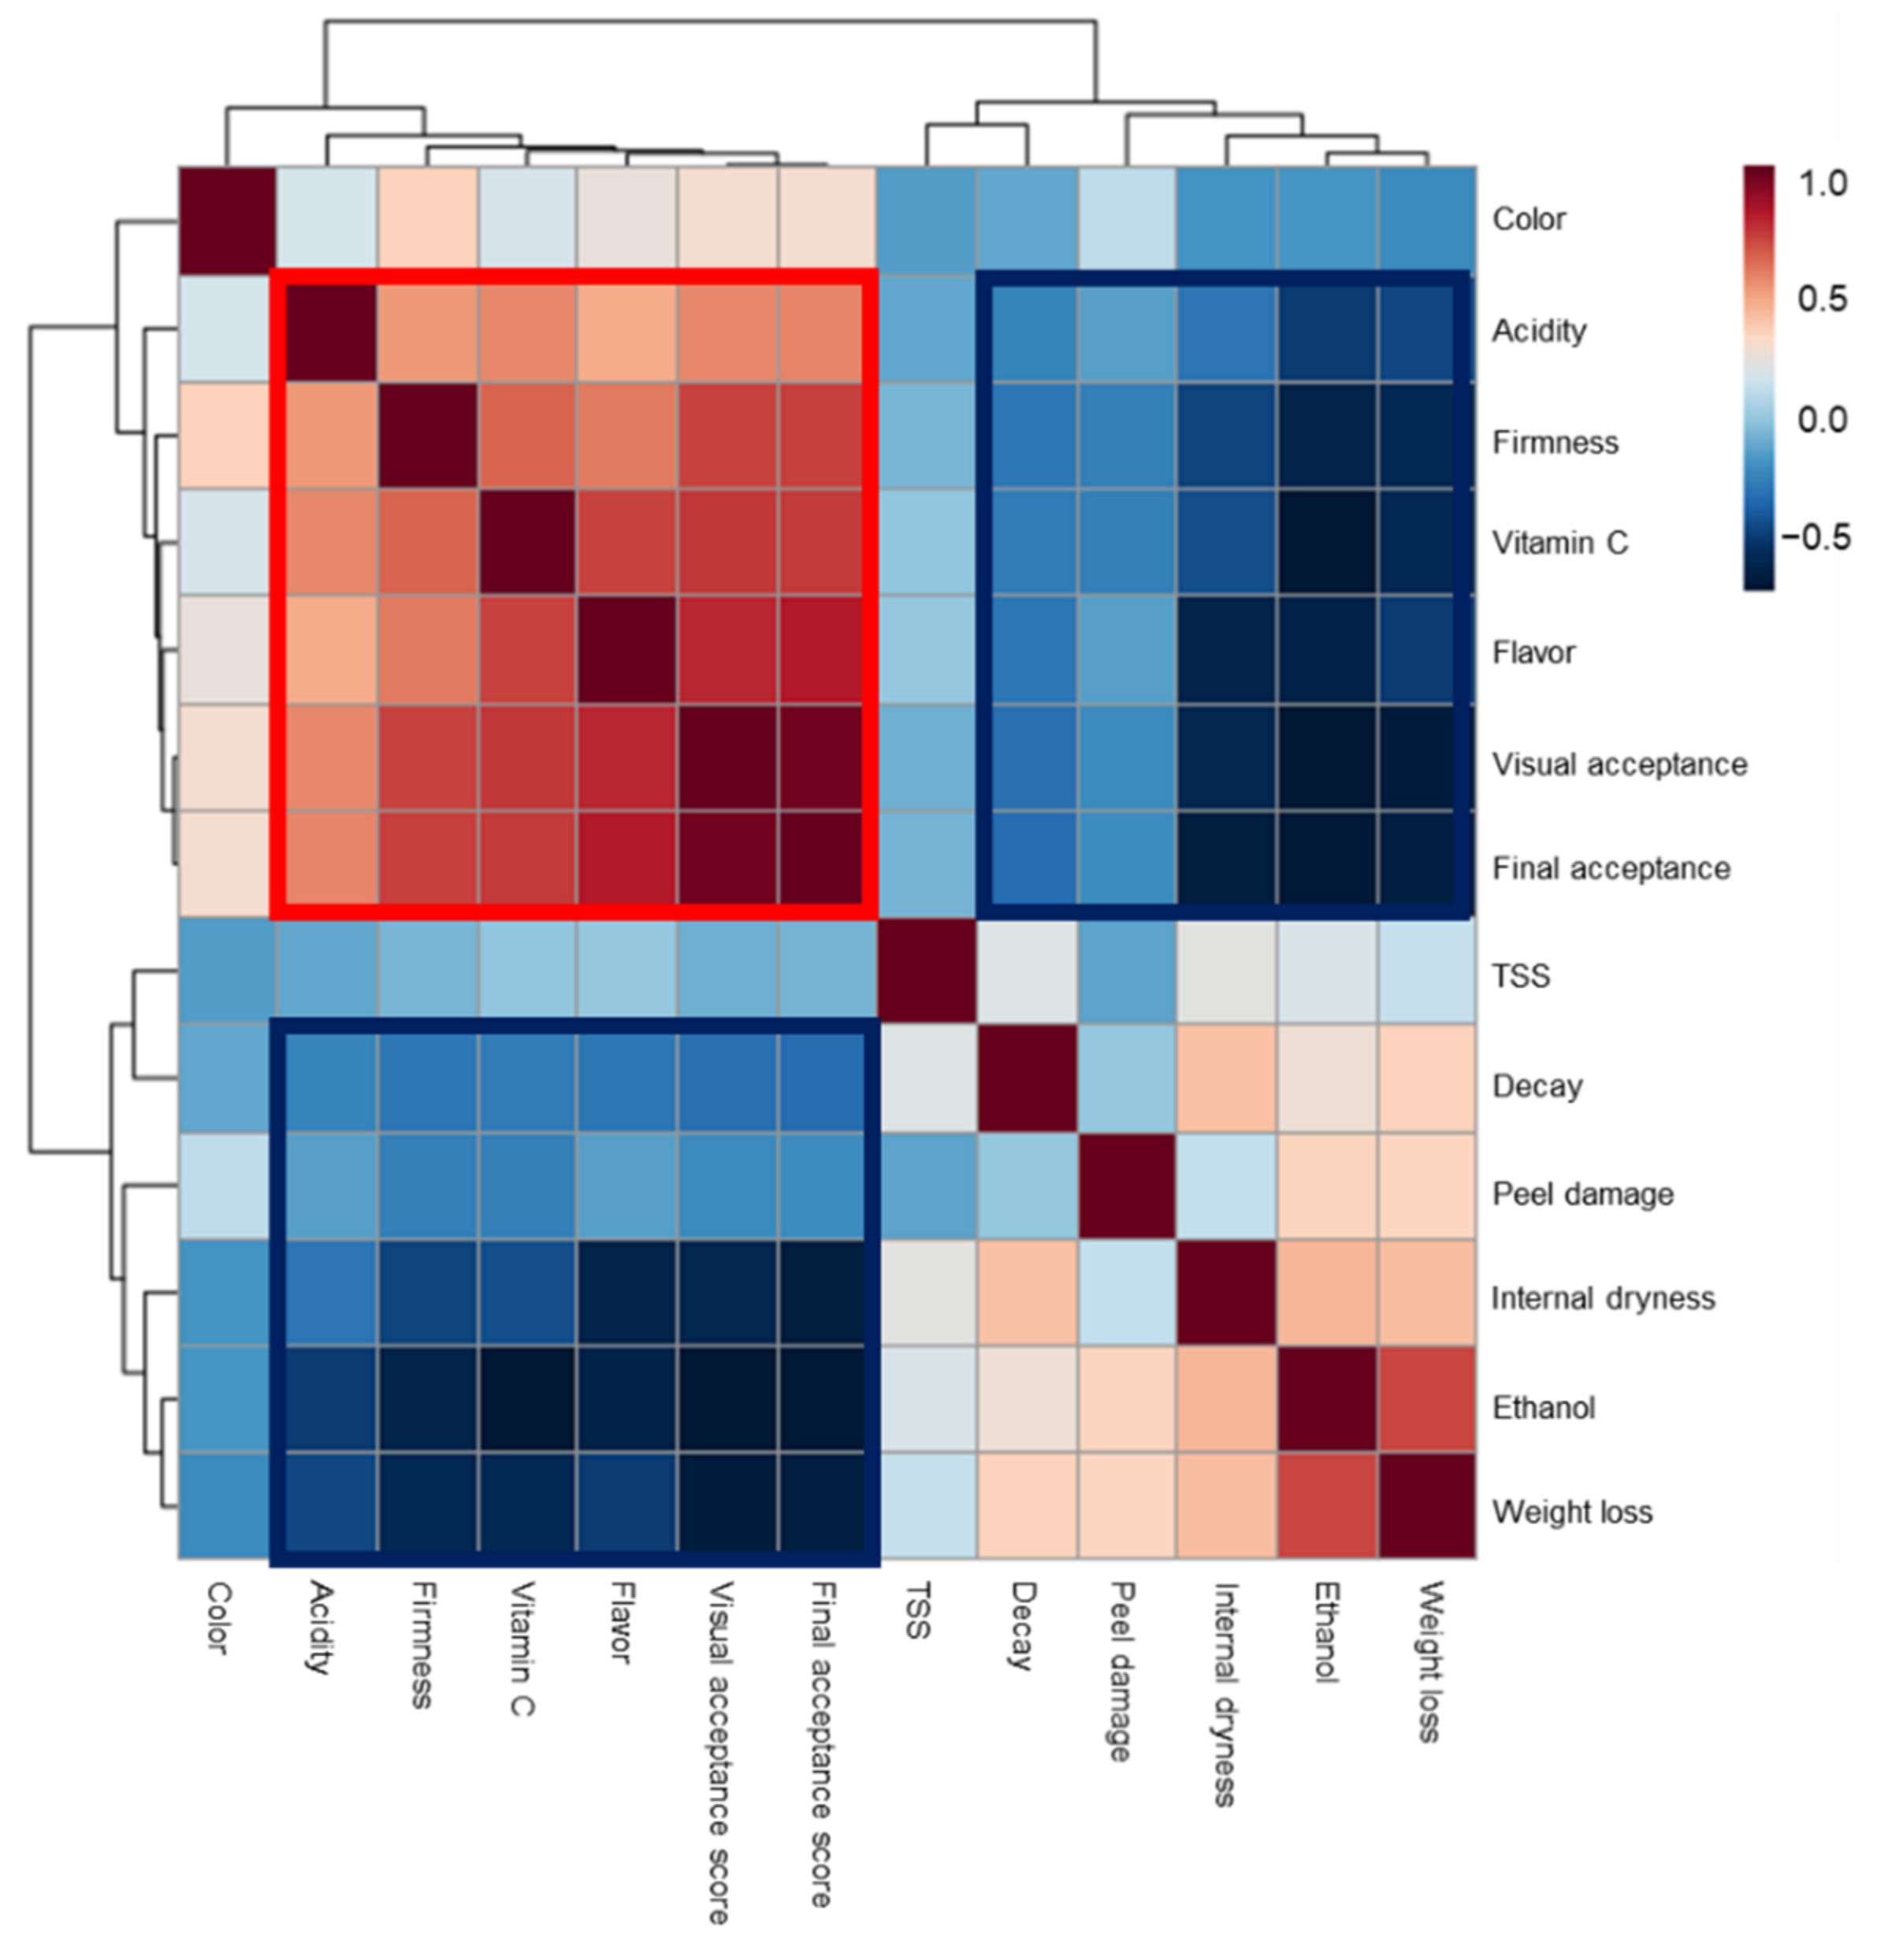
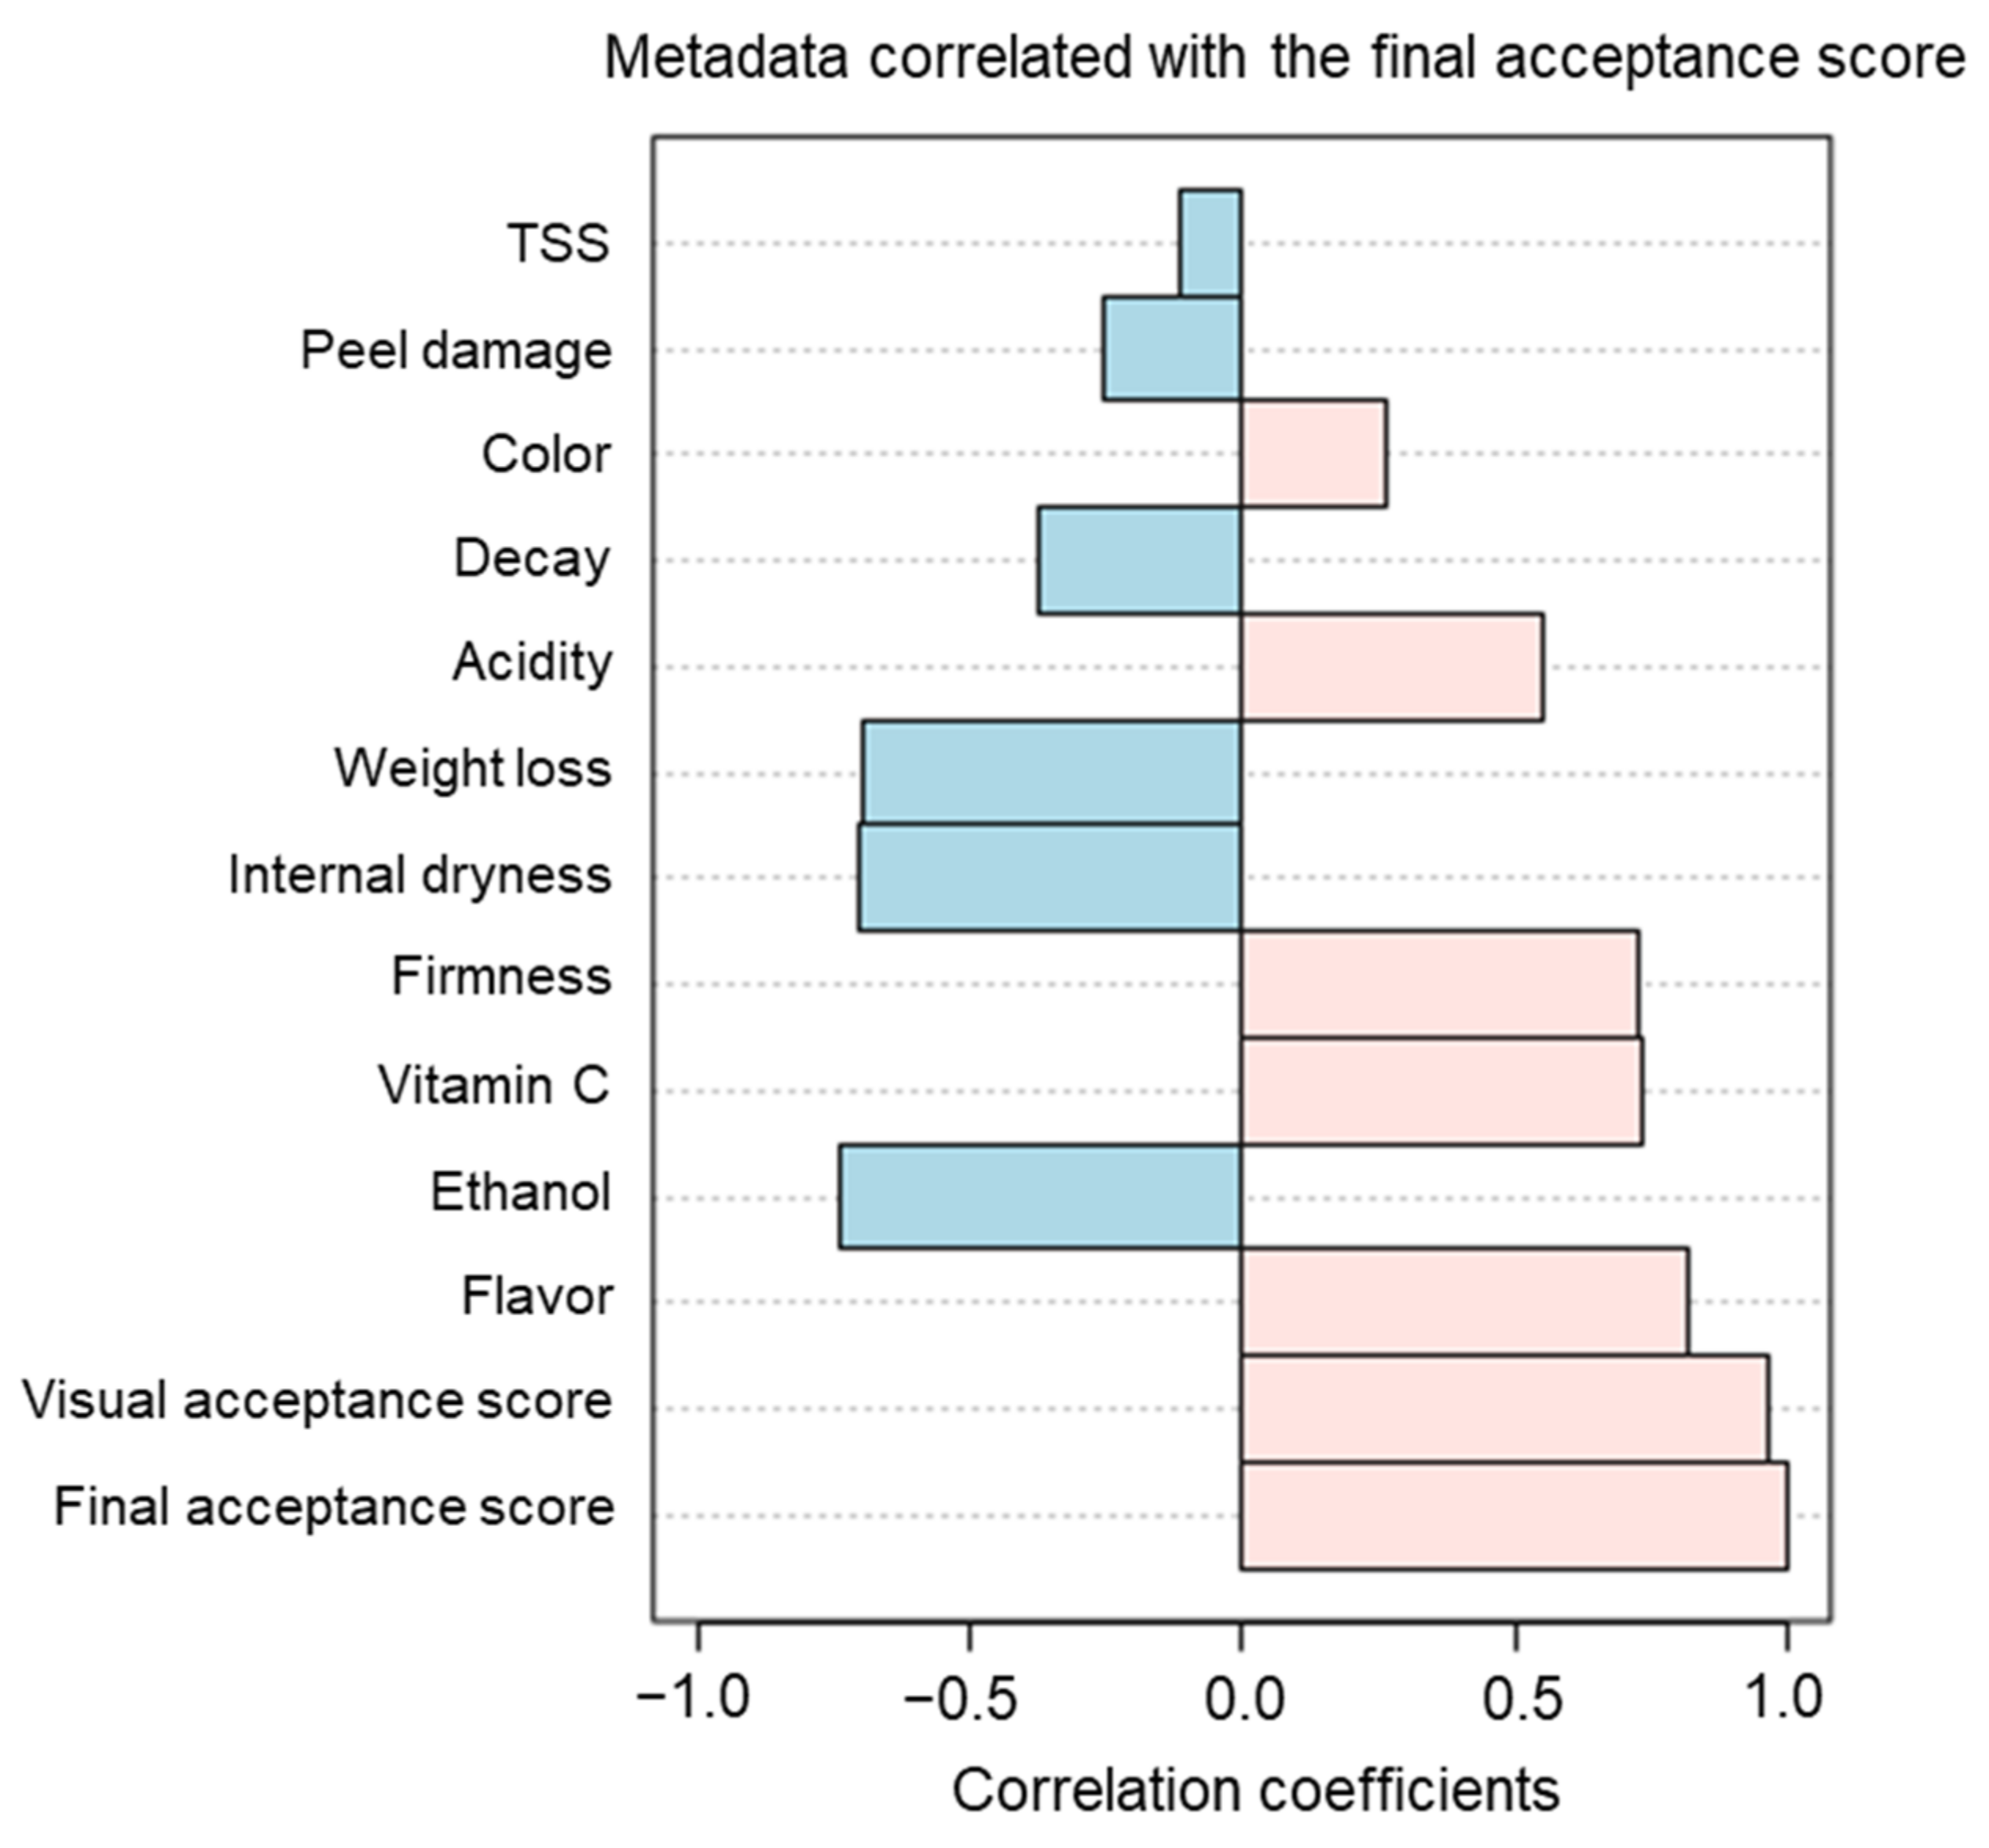
3.1. Effects of Preharvest and Postharvest Features on the Quality of ‘Valencia’ Oranges

We examined the effects of various preharvest and postharvest features on the quality of ‘Valencia’ oranges. The examined preharvest features included different harvest times ranging from 18 April 2021 to 12 May 2021, orchard yields, which ranged between 19 and 47 Ton/Hectare, different tree ages of 6 and 25 years, and two rootstocks, Sour Orange (SO) and Volka Mariana (Vol) (Table 1). The examined postharvest features included two storage temperatures (2 °C or 5 °C), three RH levels during storage (70%, 90%, or 95%), and the duration of storage, with fruits evaluated every two weeks over a period of 20 weeks.
The effects of the different features on the postharvest storage performance of ‘Valencia’ oranges, including weight loss, firmness, color, decay, peel damage, CI, and internal dryness symptoms, are presented in Figure 1. Weight loss gradually increased during storage under all of the examined conditions, with the highest weight loss rates under low-RH conditions at 5 °C. There seemed to be differing kinetics of weight loss rates among early and late-harvested fruit. As expected, weight loss and firmness had opposite trends. The initial firmness was higher in the first three harvests, and it decreased steeply, reaching more than a 2-fold decrease after 20 weeks in storage. The fruits from all of the orchards developed a yellowish pale color (high hue angle) following storage at the low temperature of 2 °C, and maintained a deeper orange color (lower hue angle) following storage at 5 °C (Figure 1 and Figure 2a). Decay was very low and inconsistent in the first harvest periods, but increased during storage, and was more pronounced in late-harvested fruit (harvests 4 and 5). Peel damage increased during storage and was somewhat more pronounced during storage under the low temperature of 2 °C, especially in the early harvested fruit (Figure 1 and Figure 2b). Internal dryness symptoms were detected only after 14 weeks of storage and only in the late-harvested fruit (Figure 1 and Figure 2c).
The effects of the various preharvest and postharvest features on the biochemical composition of ‘Valencia’ oranges, including the TSS, acidity, and vitamin C and ethanol levels, as well as flavor acceptance, are presented in Figure 3. The TSS levels remained relatively stable during storage, without apparent effects of the storage conditions. The acidity levels were above 1% in the first two harvests, and decreased to levels of about 0.8% after 20 weeks, with no apparent effects of the various storage conditions. The vitamin C levels exhibited an interesting trend of decrease, typically after 12 weeks of storage. The ethanol levels gradually increased during storage. The fruit flavor acceptability remained relatively high (flavor acceptance score ≥7.0, on a scale of 1 to 9) until 12–16 weeks in fruits from the different orchards and treatments, but tended to decrease afterward, in some cases more rapidly, at the higher storage temperature of 5 °C (Figure 3).
Overall, the fruit-acceptance scores remained relatively high (acceptance score ≥4, on a scale of 1 to 5) for 10–14 weeks, with the exception of fruit stored under low RH, which achieved low acceptance scores several weeks earlier (Figure 4). The fruits from most orchards, and especially late-harvested fruit, maintained high acceptance scores for longer periods when stored at a lower temperature of 2 °C as compared with 5 °C.
Feature-importance analysis using the mean SHAP revealed that the storage time gained a value of 0.41 and was the most important feature affecting fruit quality, while the cumulative value of the yield, storage temperature, humidity, and harvest time was 0.31 (Figure 5).
ANOVA revealed that the storage time significantly affected all of the examined parameters at p < 0.001, and the storage temperature significantly affected all parameters except for the internal dryness, decay, and flavor (Table 2). In addition, harvest time significantly affected the internal dryness, decay, peel damage, and TSS levels; orchard yields significantly affected the acidity, vitamin C, decay, flavor, weight loss, peel damage, and color; and tree age significantly affected the acidity, internal dryness, and decay. The selection of rootstock did not have significant effects on any of the above parameters.
The Pearson correlations between the various quality parameters revealed positive correlations among the visual and final acceptance scores, flavor, vitamin C, firmness, and acidity levels, as well as negative correlations between these attributes and changes in weight loss, ethanol, internal dryness, peel damage, and decay (Figure 6; red and blue boxes, respectively).
Furthermore, the Pearson correlations revealed positive correlations between the final acceptance scores and color, acidity, firmness, vitamin C, flavor, and visual acceptance scores; and negative correlations between the final acceptance scores and changes in TSS, peel damage, decay, weight loss, internal dryness, and ethanol accumulation (Figure 7).

3.2. Quality-Prediction Models

Five regression models, including two linear models (MLR and Linear SVR) and three non-linear models (Non-linear SVR with a RBF kernel, RF, and XGBoost), were evaluated for their abilities to predict acceptance scores based on preharvest and postharvest features (Table 3). Since the data set was not balanced, as only 20.83% of the samples in the total data set had acceptance scores of 3 (“fair”) or less (on a scale of 1 to 5), the models were evaluated twice. First, we evaluated the entire test sets (referred to as the “full set”), and then we evaluated a subset of the full test sets that consisted only of samples with acceptance scores equal to or lower than 3 (i.e., low-quality samples, referred to here as the “low-score subset”). RMSE and R2 were calculated using a cross-validation method, which produced 30 samples, and the Wilcoxon non-parametric signed-rank test was applied to the results [36]. As shown in Table 3, the non-linear models (XGBoost, Non-linear SVR, and RF) outperformed (p < 0.01) the linear models (MLR and Linear SVR) by having lower RMSE and higher R2 values. There were no statistically significant differences between the three non-linear models. The XGBoost model outperformed the other models on the full data set, and the Non-linear SVR model outperformed the other models on the low-score subset. The observed RMSE and R2 values of the XGBoost full set were 0.220 and 0.859, respectively. The observed RMSE and R2 values of the Non-linear SVR model for the low-score subset were 0.387 and 0.401, respectively. As expected, the RMSE and R2 prediction values were higher for the full set than for the low-score subset.
To improve the prediction models, particularly their performance for the low-score subset, a duplication approach was applied to the three non-linear models that provided improved results, i.e., Non-linear SVR, RF, and XGBoost (Table 3). Low-quality samples in the training set were duplicated for each repetition and fold. Duplicating the low-quality samples mitigated the unbalanced dataset and enabled the models to better predict low-quality scores. Overall, four duplication modes were compared: no-duplication (i.e., 0) and 1 to 3 duplications. The RMSE and R2 of the full set and low-score subset were measured again for each duplication mode, and the results are presented in Table 4. It can be seen that the addition of the duplication method had only minor effects on the observed RMSE and R2 values of the RF and XGBoost models (Table 4). However, the addition of the duplication method substantially improved the Non-linear SVR model, especially for the low-quality samples. Regarding the full data set, the duplication method slightly reduced the RMSE from 0.235 to 0.195 and slightly increased R2 from 0.846 to 0.884. Nonetheless, for the low-score subset, the duplication approach meaningfully reduced the RMSE from 0.387 to 0.210, and greatly increased R2 from 0.401 to 0.823 (Table 4).
FIFO logistic management is based on the notion that storage time is the most crucial feature for predicting fruit quality. To evaluate the relative importance of storage time alone as compared with storage time in addition to the other examined preharvest and postharvest features in the prediction models; we conducted post hoc analyses to explore the contributions of various feature subsets to fruit quality predictions. The data sub-groups included: (1) storage time only, (2) storage time and preharvest features (harvest time and yield), (3) storage time and postharvest features (temperature and humidity), and (4) storage time and all preharvest and postharvest features (harvest time, yield, storage time, storage temperature, and storage humidity). Afterward, the Non-linear SVR model with three duplications for the training sets was used to compare these sub-groups, and the observed RMSE and R2 values are presented in Table 5. For the full data set, the addition of preharvest data (Subgroup 2) did not improve the prediction model. However, the addition of postharvest data (Subgroup 3) lowered the RMSE from 0.383 (Subgroup 1; i.e., storage time) to 0.269, and the inclusion of all features (Subgroup 4) further reduced the RMSE to 0.195. Similarly, the addition of postharvest data (Subgroup 3) increased R2 from 0.595 (Subgroup 1; i.e., storage time) to 0.801, and the inclusion of all features (Subgroup 4) further increased R2 to 0.884 (Table 5). For the low-score subset, the addition of preharvest data (Subgroup 2) did not improve the model. However, the addition of postharvest data (Subgroup 3) lowered the RMSE from 0.640 (Subgroup 1; i.e., storage time) to 0.466, and the inclusion of all features (Subgroup 4) further reduced the RMSE to 0.210. Similarly, the addition of postharvest data (Subgroup 3) increased R2 from −0.640 (Subgroup 1; i.e., storage time) to 0.132, and the inclusion of all features (Subgroup 4) remarkably increased R2 to 0.823 (Table 5).

4. Discussion

The main goal of the current study was to conduct a large-scale, high-throughput phenotyping analysis of the effects of various preharvest and postharvest features on the quality of ‘Valencia’ oranges in order to develop quality-prediction models to enable the implementation of the more efficient FEFO logistic management system [12,13].
The current postharvest storage evaluations yielded two main outcomes: (1) they contributed to our current understanding of the importance of various preharvest and postharvest features in the quality of ‘Valencia’ oranges, and (2) they allowed the generation of quality-prediction models.
SHAP analysis revealed that storage time is the most important feature affecting the postharvest quality of ‘Valencia’ oranges, but further demonstrated that other preharvest and postharvest features also have meaningful effects on fruit quality (Figure 5). Thus, taking into account all of the examined preharvest and postharvest features that influence the postharvest quality of ‘Valencia’ oranges should improve the quality-prediction models over a simple model based on storage time alone. More specifically, ANOVA revealed that storage time significantly affected all fruit quality parameters, storage temperature significantly affected most quality parameters, and the other preharvest and postharvest features had significant effects on particular quality traits (Table 2). For example, preharvest features, including harvest time, yield, and tree age, affected both the juice chemical composition (TSS, acidity, and vitamin C) and postharvest storage performance (decay, internal dryness, and peel damage). As expected, the RH levels during storage significantly affected the weight loss, firmness, and fruit acceptance scores (Table 2).
Similar findings regarding the importance of both preharvest and postharvest features for shelf-life predictions were recently reported for nectarines. That work found that preharvest features, such as irrigation methods and fruit load, and postharvest features, such as the storage temperature and storage RH, all have major effects on the postharvest quality of nectarines [37]. Other studies involving the development of shelf-life prediction models for strawberries, rocket leaves, and mushrooms reported that storage temperature is the most important feature affecting shelf life and quality [38,39,40]. However, another study pointed out the importance of RH for preserving the postharvest quality of strawberries [41].
The calculation of the Pearson correlations between various orange fruit quality parameters and final acceptance scores revealed that the fruit quality parameters positively correlated with high acceptance scores were the fruit color, acidity, firmness, vitamin C levels, and flavor, and that these parameters were also positively correlated with one another (Figure 6 and Figure 7). In contrast, peel damage, decay, weight loss, internal dryness, and ethanol accumulation were negatively correlated with fruit-acceptance scores (Figure 6 and Figure 7).
The second goal of the current study was to develop fruit quality prediction models. A large arsenal of potential machine learning models can be applied, and the choice of model should depend on the statistical properties of the problem at hand. According to Occam’s razor theory, we should seek the simplest model that explains the observed data. In this study, we examined five regression models: Linear Regression, Linear SVR, Non-linear SVR, RF, and XGBoost. We noticed that the linear models had difficulties explaining the data, which translated into higher prediction errors. This indicated the need for a non-linear model in order to describe the data. We found that the Non-linear SVR model based on a radial basis kernel was adequate (Table 3).
However, unfortunately, the collected data were not fairly balanced, as low acceptance scores (acceptance scores equal to or below 3 on a scale of 1 to 5) accounted for only 20.83% of the total data set and, accordingly, the observed RMSE and R2 values for the low-scoring data set were relatively poor. Thus, the tested regression models provided much better quality predictions for fruits with higher acceptance scores than for fruits with lower acceptance scores. To address this obstacle, we added a further duplication approach of the low-score subset and found that doing so helped to reduce the observed RMSE using the Non-linear SVR model from 0.387 to 0.210 and increased the R2 value from 0.410 to 0.823 (Table 4). Thus, combining the non-linear SVR model with the addition of a duplication method resulted in the development of a highly efficient quality-prediction method for both high-quality and lower-quality ‘Valencia’ oranges. A more or less similar RMSE value of 0.184 and R2 value of 0.911 were recently reported for the development of a shelf-life prediction model of table grapes using an optimized radial basis function (RBF) and neural network [14].
It is worth noting that produce from other farmers not included in this study may have different physical characteristics that would translate to somewhat different statistical patterns, which would eventually generate a larger prediction error. If this is indeed the case, it is possible to retrain the model using a larger dataset that also includes data from additional farmers. Moreover, it is also possible that produce from different harvest years would have different statistical characteristics, which are currently not controlled by the model. This non-stationary behavior of the data will probably increase the prediction error of the proposed model. By increasing the size of the training dataset, it will be possible to mitigate this as well.
Finally, post hoc analyses revealed that quality-prediction models based on storage-time data alone were much less accurate than quality-prediction models based on storage time together with the other examined preharvest and postharvest features (Table 5). Thus, the development of accurate quality-prediction models required for the implementation of the FEFO intelligent logistic management system necessitates the collection and use of as much preharvest and postharvest data as possible.

Author Contributions

All authors contributed substantially to this work. Conceptualization, R.P., A.L., N.K. and Y.S.; Data curation, A.O. and O.J.; Formal analysis, A.D.-F., O.J. and N.K.; Funding acquisition, R.P., A.L. and Y.S.; Investigation, A.O., O.J. and R.P.; Methodology, R.P., N.K. and Y.S.; Project administration, R.P. and Y.S.; Software, A.D.-F. and O.J.; Supervision, R.P., A.L., N.K. and Y.S.; Visualization, A.O. and R.P.; Writing–original draft, R.P. and O.J; Writing–review and editing, A.O., R.P., A.L., O.J., N.K. and Y.S. All authors have read and agreed to the published version of the manuscript.

Funding

This research was funded by The Israel Innovation Authority, grant number 70076.

Data Availability Statement

The data presented in this study are available on request from the corresponding author.

Conflicts of Interest

The authors declare no conflict of interest.

References

  1. Statista. Fruit: World Production by Type 2020. Available online: https://0-www-statista-com.brum.beds.ac.uk/statistics/264001/worldwide-production-of-fruit-by-variety/ (accessed on 19 May 2022).
  2. Ranganna, S.; Govindarajan, V.S.; Ramana, K.V.R. Citrus fruits—Varieties, chemistry, technology, and quality evaluation. Part II. Chemistry, technology, and quality evaluation. A. Chemistry. Crit. Rev. Food Sci. Nutr. 1983, 18, 313–386. [Google Scholar] [CrossRef] [PubMed]
  3. Hodgson, R.W. Horticultural varieties of citrus. In Citrus Ind.; Reuther, W., Webber, H.J., Batchelor, L.D., Eds.; University of California Press: Berkeley, CA, USA, 1967; pp. 431–591. [Google Scholar] [CrossRef] [Green Version]
  4. Pekmezci, M.; Erkan, M.; Demirkol, A. The effects of harvest time and different postharvest applications on the storage of “Valencia” oranges. Acta Hortic. 1995, 398, 277–284. [Google Scholar] [CrossRef]
  5. Ozdemir, A.E.; Dundar, O. Effect of different postharvest applications on storage of “Valencia” oranges. Acta Hortic. 2001, 553, 561–564. [Google Scholar] [CrossRef]
  6. Kader, A.A.; Arpaia, M.L. Postharvest handling systems: Subtropical fruit. In Postharvest Technology of Horticultural Crops, 3rd ed.; Kader, A.A., Ed.; University of California, Agriculture and Natural Resources: Oakland, CA, USA, 2002; pp. 375–384. [Google Scholar]
  7. Arpaia, M.L. Preharvest Factors Influencing Postharvest Quality of Tropical and Subtropical Fruit. HortScience 1994, 29, 982–985. [Google Scholar] [CrossRef] [Green Version]
  8. Tyagi, S.; Sahay, S.; Imran, M.; Rashmi, K.; Mahesh, S. Pre-harvest Factors Influencing the Postharvest Quality of Fruits: A Review. Curr. J. Appl. Sci. Technol 2017, 23, 1–12. [Google Scholar] [CrossRef]
  9. El-Zeftawi, B.M.; Peggie, I.D.; Minnis, D.C. Postharvest treatments, storage temperature and rootstocks in relation to storage disorders and fruit quality of ‘Valencia’ oranges. J. Hortic. Sci. 1989, 64, 373–378. [Google Scholar] [CrossRef]
  10. Khalid, S.; Malik, U.A.; Khan, A.S.; Khan, M.N.; Ullah, M.I.; Abbas, T.; Khalid, M.S. Tree age and fruit size in relation to postharvest respiration and quality changes in ‘Kinnow’ mandarin fruit under ambient storage. Sci. Hortic. 2017, 220, 183–192. [Google Scholar] [CrossRef]
  11. Paull, R. Effect of temperature and relative humidity on fresh commodity quality. Postharvest Biol. Technol. 1999, 15, 263–277. [Google Scholar] [CrossRef]
  12. Hertog, M.L.A.T.M.; Uysal, I.; McCarthy, U.; Verlinden, B.M.; Nicolaï, B.M. Shelf life modelling for first-expired-first-out warehouse management. Philos. Trans. R. Soc. A 2014, 372, 20130306. [Google Scholar] [CrossRef]
  13. Jedermann, R.; Nicometo, M.; Uysal, I.; Lang, W. Reducing food losses by intelligent food logistics. Philos. Trans. R. Soc. A 2014, 372, 20130302. [Google Scholar] [CrossRef]
  14. Li, Y.; Chu, X.; Fu, Z.; Feng, J.; Mu, W. Shelf life prediction model of postharvest table grape using optimized radial basis function (RBF) neural network. Br. Food J. 2019, 121, 2919–2936. [Google Scholar] [CrossRef]
  15. Song, Y.; Hu, Q.; Wu, Y.; Pei, F.; Kimatu, B.M.; Su, A.; Yang, W. Storage time assessment and shelf-life prediction models for postharvest Agaricus bisporus. LWT 2019, 101, 360–365. [Google Scholar] [CrossRef]
  16. Jalali, A.; Linke, M.; Geyer, M.; Mahajan, P.V. Shelf life prediction model for strawberry based on respiration and transpiration processes. Food Packag. Shelf Life 2020, 25, 100525. [Google Scholar] [CrossRef]
  17. Salehi, F. Recent Advances in the Modeling and Predicting Quality Parameters of Fruits and Vegetables during Postharvest Storage: A Review. Int. J. Fruit Sci. 2020, 20, 506–520. [Google Scholar] [CrossRef]
  18. Cammarota, G.; Ianiro, G.; Ahern, A.; Carbone, C.; Temko, A.; Claesson, M.J.; Gasbarrini, A.; Tortora, G. Gut microbiome, big data and machine learning to promote precision medicine for cancer. Nat. Rev. Gastroenterol. Hepatol. 2020, 17, 635–648. [Google Scholar] [CrossRef]
  19. Neethirajan, S. The role of sensors, big data and machine learning in modern animal farming. Sens. Bio Sens. Res. 2020, 29, 100367. [Google Scholar] [CrossRef]
  20. La Scalia, G.; Nasca, A.; Corona, O.; Settanni, L.; Micale, R. An Innovative Shelf Life Model Based on Smart Logistic Unit for an Efficient Management of the Perishable Food Supply Chain. J. Food Process Eng. 2017, 40, e12311. [Google Scholar] [CrossRef]
  21. Chaudhuri, A.; Dukovska-Popovska, I.; Subramanian, N.; Chan, H.K.; Bai, R. Decision-making in cold chain logistics using data analytics: A literature review. Int. J. Logist. Manag. 2018, 29, 839–861. [Google Scholar] [CrossRef] [Green Version]
  22. Davis, P.L.; Chace, W.G. Determination of alcohol in citrus juice by gas chromatographic analysis of headspace. Hortscience 1969, 2, 168–169. [Google Scholar]
  23. Lundberg, S.I.; Lee, S.M. A unified approach to interpreting model predictions. Adv. Neural Inf. Process. Syst. 2017, 30, 1–10. [Google Scholar] [CrossRef] [Green Version]
  24. Metsalu, T.; Vilo, J. ClustVis: A web tool for visualizing clustering of multivariate data using Principal Component Analysis and heatmap. Nucleic Acids Res. 2015, 43, W566–W570. [Google Scholar] [CrossRef] [PubMed]
  25. Lewis-Beck, C.; Lewis-Beck, M. Applied Regression: An Introduction; Sage Publications: Thousand Oaks, CA, USA, 2015. [Google Scholar]
  26. Drucker, H.; Surges, C.J.C.; Kaufman, L.A.; Vapnik, V. Support vector regression machines. Adv. Neural Inf. Process. Syst. 1997, 1, 155–161. [Google Scholar]
  27. Awad, M.; Khanna, R. Support vector regression. In Efficient Learning Machines; Apress: New York, NY, USA, 2015; pp. 67–80. [Google Scholar] [CrossRef] [Green Version]
  28. Mousavi, S.F.; Esteki, M.; Mostafazadeh-Fard, B.; Dehghani, S.; Khorvash, M. Linear and nonlinear modeling for predicting nickel removal from aqueous solutions. Environ. Eng. Sci. 2012, 29, 765–775. [Google Scholar] [CrossRef]
  29. Breiman, L. Random Forests. Mach. Learn. 2001, 45, 5–32. [Google Scholar] [CrossRef] [Green Version]
  30. Breiman, L.; Friedman, J.H.; Olshen, R.A.; Stone, C.J. Classification and Regression Trees; Routledge: New York, NY, USA, 2017. [Google Scholar] [CrossRef]
  31. Breiman, L. Bagging predictors. Mach. Learn. 1996, 24, 123–140. [Google Scholar] [CrossRef] [Green Version]
  32. Chen, C.; Guestrin, T. XGBoost: A Scalable Tree Boosting System. In Proceedings of the 22nd ACM SIGKDD International Conference on Knowledge Discovery and Data Mining, San Francisco, CA, USA, 13–17 August 2016; pp. 785–794. [Google Scholar]
  33. Polikar, R. Ensemble based systems in decision making. IEEE Circuits Syst. Mag. 2006, 6, 21–44. [Google Scholar] [CrossRef]
  34. Lin, Y.; Guan, Y.; Asudeh, A.; Jagadish, H.V. Identifying insufficient data coverage in databases with multiple relations. Proc. VLDB Endow. 2020, 13, 2229–2242. [Google Scholar] [CrossRef]
  35. Refaeilzadeh, P.; Tang, L.; Liu, H. Cross Validation, Encyclopedia of Database Systems (EDBS); Arizona State University Springer: Phoenix, AZ, USA, 2009; Volume 6. [Google Scholar]
  36. Wilcoxon, F. Individual Comparisons by Ranking Methods. In Breakthroughs in Statistics; Springer: New York, NY, USA, 1992; pp. 196–202. [Google Scholar] [CrossRef]
  37. Casagrande, E.; Génard, M.; Lurol, S.; Charles, F.; Plénet, D.; Lescourret, F. A process-based model of nectarine quality development during pre- and post-harvest. Postharvest Biol. Technol. 2021, 175, 111458. [Google Scholar] [CrossRef]
  38. Amodio, M.L.; Derossi, A.; Mastrandrea, L.; Colelli, G. A study of the estimated shelf life of fresh rocket using a non-linear model. J. Food Eng. 2015, 150, 19–28. [Google Scholar] [CrossRef]
  39. Wang, W.; Hu, W.; Ding, T.; Ye, X.; Liu, D. Shelf-life prediction of strawberry at different temperatures during storage using kinetic analysis and model development. J. Food Proc. Preserv. 2018, 42, 1–9. [Google Scholar] [CrossRef]
  40. Niu, Y.; Yun, J.; Bi, Y.; Wang, T.; Zhang, Y.; Liu, H.; Zhao, F. Predicting the shelf life of postharvest Flammulina velutipes at various temperatures based on mushroom quality and specific spoilage organisms. Postharvest Biol. Technol. 2020, 167, 111235. [Google Scholar] [CrossRef]
  41. Ktenioudaki, A.; O’Donnell, C.P.; do Nascimento Nunes, M.C. Modelling the biochemical and sensory changes of strawberries during storage under diverse relative humidity conditions. Postharvest Biol. Technol. 2019, 154, 148–158. [Google Scholar] [CrossRef]
Figure 1. Effects of various preharvest and postharvest features on the postharvest storage quality of ‘Valencia’ oranges harvested from five different orchards. The harvest times, yields, tree age, and rootstocks of the different orchards are presented in Table 1. The postharvest features included the storage temperature (2 °C or 5 °C) and storage RH level (70%, 90%, or 95%). Fruit quality was evaluated every 2 weeks after 1 additional week of storage under shelf conditions (at 20 °C) for a period of 20 weeks.
Horticulturae 08 00570 g001
Figure 2. Photographs of ‘Valencia’ oranges. (a) Fruit stored at 2 °C and 5 °C, (b) peel damage, and (c) internal dryness symptoms.
Horticulturae 08 00570 g002
Figure 3. Effects of various preharvest and postharvest features on the biochemical composition and flavor of ‘Valencia’ oranges harvested from five different orchards. The harvest times and yields of the different orchards are presented in Table 1. The postharvest features included the storage temperature (2 °C or 5 °C) and storage RH (70%, 90%, or 95%). Fruit quality was evaluated every 2 weeks after 1 additional week of storage under shelf conditions (20 °C) for a period of 20 weeks.
Horticulturae 08 00570 g003
Figure 4. Effects of various preharvest and postharvest features on the acceptance scores of ‘Valencia’ oranges harvested from five different orchards. The harvest times and yields of the different orchards are presented in Table 1. The postharvest features included the storage temperature (2 °C or 5 °C) and storage RH (70%, 90%, or 95%). Fruit quality was evaluated every 2 weeks after 1 additional week of storage under shelf conditions (at 20 °C) for a period of 20 weeks.
Horticulturae 08 00570 g004
Figure 5. Feature importance of various preharvest and postharvest factors on the quality of ‘Valencia’ oranges. The presented data are SHAP values.
Horticulturae 08 00570 g005
Figure 6. Pearson correlations and heat map analysis of the various fruit quality parameters of ‘Valencia’ fruit. Red and blue boxes indicate parameters that are positively and negatively correlated with one another, respectively.
Horticulturae 08 00570 g006
Figure 7. Pearson correlations between the various fruit quality parameters and the final acceptance scores of ‘Valencia’ oranges.
Horticulturae 08 00570 g007
Table 1. Harvest times, yields, tree age, and rootstocks of the ‘Valencia’ orchards used for the current experiment.
Harvest Time
(Weeks from Blooming)
Yield
(Ton/Hectare)
Tree Age
(Years)
Rootstock
Harvest 1 (18 April 2021)56476SO
Harvest 2 (19 April 2021)56316VOL
Harvest 3 (26 April 2021)571925SO
Harvest 4 (11 May 2021)59476SO
Harvest 5 (12 May 2021)5919 25SO
SO—sour orange, VOL—volka mariana.
Table 2. Effects of different preharvest and postharvest features on the quality attributes of ‘Valencia’ oranges.
Harvest TimeYieldTree AgeRootstockStorage TimeStorage TemperatureRH
Acidity0.0272.01 × 10−105.54 × 10⁻¹²-1.42 × 10−240.001-
Vitamin C 1.54 × 10−130.003-5.06 × 10−1210.001-
Internal dryness2.05 × 10−70.0021.49 × 10−50.0022.93 × 10−260.012-
Decay2.55 × 10−80.0015.42 × 10−6-2.37 × 10−50.022-
Flavor-3.55 × 10−50.018-2.12 × 10−930.044-
Final acceptance score0.0170.0030.013-3.89 × 10−852.83 × 10−54.37 × 10−7
Firmness0.011-0.023-3.52 × 10−554.67 × 10−140.001
Ethanol-0.002--2.38 × 10−1333.48 × 10−6-
Visual acceptance score0.0120.035--8.80 × 10−909.82 × 10−51.72 × 10−9
Weight loss-1.58 × 10⁻¹⁶--5.78 × 10−851.55 × 10−170.001
Peel damage0.0018.33 × 10−6--7.72 × 10−141.27 × 10⁻¹⁶-
Color (hue angle)0.0040.001--0.0013.48 × 10−13-
TSS1.87 × 10−39---1.42 × 10−245.70 × 10−61.11 × 10−9
Data are ANOVA p-values. Gray shading indicates statistical significance (p ≤ 0.001). RH—relative humidity, TSS—total soluble solids.
Table 3. RMSE and R2 values for the MLR, Linear SVR, Non-linear SVR, RF, and XGBoost regression models for the full set and low-score subset.
Full SetLow-Score Subset
AlgorithmRMSE R 2 RMSE R 2
MLR0.3410.6770.4880.047
Linear SVR0.3620.6460.641−0.640
Non-linear SVR0.2350.8460.3870.401
RF0.2420.8340.4470.201
XGBoost0.2200.8590.3960.373
Table 4. RMSE and R2 values for the Non-linear SVR, RF, and XGBoost regression models for the full set and the low-score subset with 0 to 3 duplications.
Full SetLow-Score Subset
Number of DuplicationsRMSE R 2 RMSE R 2
Non-linear SVR
00.2350.8460.3870.401
10.1990.8830.2480.755
20.1950.8850.2240.799
30.1950.8840.2100.823
RF
00.2420.8340.4470.201
10.2250.8560.4000.360
20.2210.8600.3840.411
30.2170.8640.3690.455
XGBoost
00.2200.8590.3960.373
10.2280.8490.3930.383
20.2350.8360.3890.396
30.2390.8300.3860.405
Table 5. The RMSE and R2 values for the Non-linear SVR regression model with three duplications for the full set and low-score subset using four different feature subgroups.
SubgroupFull SetLow-Score Subset
RMSE R 2 RMSE R 2
1.
Storage time
0.3830.5950.640−0.640
2.
Storage time + preharvest features (harvest time and yield)
0.4200.4890.662−0.752
3.
Storage time + postharvest features (temperature and humidity)
0.2690.8010.4660.132
4.
Storage time + preharvest (harvest time and yield) + postharvest features (temperature and humidity)
0.1950.8840.2100.823
Publisher’s Note: MDPI stays neutral with regard to jurisdictional claims in published maps and institutional affiliations.

