Article

Microstructure Evolution of Ag/TiO2 Thin Film

by
Dewi Suriyani Che Halin
1,2,*,
Kamrosni Abdul Razak
1,2,
Mohd Arif Anuar Mohd Salleh
1,2,
Mohd Izrul Izwan Ramli
1,2,
Mohd Mustafa Al Bakri Abdullah
1,2,
Ayu Wazira Azhari
3,
Kazuhiro Nogita
4,
Hideyuki Yasuda
5,
Marcin Nabiałek
6 and
Jerzy J. Wysłocki
6,*
1
Center of Excellence Geopolymer & Green Technology (CEGeoGTech), Universiti Malaysia Perlis, (UniMAP), Jalan Kangar-Arau, Perlis 02600, Malaysia
2
Faculty of Chemical Engineering Technology, Universiti Malaysia Perlis, Jalan Kangar-Arau, Perlis 02600, Malaysia
3
Faculty of Civil Engineering Technology, Universiti Malaysia Perlis, Jalan Kangar-Arau, Perlis 02600, Malaysia
4
Nihon Superior Centre for the Manufacture of Electronic Materials (NS CMEM), School of Mechanical and Mining Engineering, The University of Queensland (UQ), Brisbane, QLD 4072, Australia
5
Department of Materials Science and Engineering, Kyoto University, Sakyo-ku, Kyoto 606-8501, Japan
6
Department of Physics, Czestochowa University of Technology, al. Armii Krajowej 19, 42-200 Częstochowa, Poland
*
Authors to whom correspondence should be addressed.
Submission received: 5 December 2020 / Revised: 11 January 2021 / Accepted: 13 January 2021 / Published: 16 January 2021
(This article belongs to the Special Issue Advances in Amorphous and Nanocrystalline Magnetic Materials)

Abstract

:
Ag/TiO2 thin films were prepared using the sol-gel spin coating method. The microstructural growth behaviors of the prepared Ag/TiO2 thin films were elucidated using real-time synchrotron radiation imaging, its structure was determined using grazing incidence X-ray diffraction (GIXRD), its morphology was imaged using the field emission scanning electron microscopy (FESEM), and its surface topography was examined using the atomic force microscope (AFM) in contact mode. The cubical shape was detected and identified as Ag, while the anatase, TiO2 thin film resembled a porous ring-like structure. It was found that each ring that coalesced and formed channels occurred at a low annealing temperature of 280 °C. The energy dispersive X-ray (EDX) result revealed a small amount of Ag presence in the Ag/TiO2 thin films. From the in-situ synchrotron radiation imaging, it was observed that as the annealing time increased, the growth of Ag/TiO2 also increased in terms of area and the number of junctions. The growth rate of Ag/TiO2 at 600 s was 47.26 µm2/s, and after 1200 s it decreased to 11.50 µm2/s and 11.55 µm2/s at 1800 s. Prolonged annealing will further decrease the growth rate to 5.94 µm2/s, 4.12 µm2/s and 4.86 µm2/s at 2400 s, 3000 s and 3600 s, respectively.

1. Introduction

Titanium dioxide (TiO2) is a diamagnetic material that has been gaining increasing attention in the field of energy and sustainable environmental protection as it can integrate the advantages of magnetic recovery and the superior photocatalysis performance of TiO2. Nowadays, TiO2 is being widely used as a photocatalyst due to its chemical stability and excellent physical, optical, electrical and photoelectrochemical properties. The TiO2 also has a good optical transparency in the visible and near-infrared (IR) regions with a high refractive index [1,2,3]. In addition, its strong oxidizing ability vis-a-vis organic pollutants, superhydrophilicity, durability, nontoxicity and cost-effectiveness make it an effective photocatalyst [4,5]. TiO2 has three different crystalline phases, namely anatase, rutile and brookite. It is found that the anatase phase is actively photocatalytic when compared to the rutile phase. This can be attributed to the larger bandgap in the anatase phase, which can increase both the charge carrier lifetime and also the surface redox potential. The photocatalytic activity of TiO2 thin films does not only depend on the phase but also on the crystallite size and porosity [6,7,8]. Besides that, the grain size, specific surface area, pore volume and structure, and microstructural growth are some of the factors that can influence the photocatalytic performance of TiO2 thin films.
The properties of TiO2 thin films depend on the preparation technique and deposition parameters. In the sol-gel synthesis, thin films’ formation relies on parameters such as the sol’s reactivity, viscosity, water alkoxide ratio and metal precursor concentrations [9]. TiO2 thin film nanostructures have a large surface area and exhibit unique physicochemical and electronic properties that differ from their bulk counterpart [10]. Yin et al. outlined the morphological conditions and growth of pure TiO2 thin film via a cross-sectional display of a TiO2 monolayer thin film [11].
The addition of dopants in TiO2 thin films affects its surface morphology and roughness [12]. Sajid et al. posited that the addition of 0.75% Ag in TiO2 resulted in a thermally stable TiO2 anatase phase with a small particle size and uniform morphology, high surface area and low excitation energies. The Ag/TiO2 samples with 0.75% Ag also had a well-distributed Ag species (Ag2O and AgO) across their surface [13]. The percentage of Ag agglomerates on the surface (AgO) increased as the Ag content in the Ag/TiO2 sample increased [14]. The majority of microstructural studies were conducted using only scanning electron microscopy (SEM) and were limited to observations of the films’ surface morphology and thicknesses. Some studies used atomic force microscope (AFM) to analyze the films’ surface topography, but they are somewhat limited in number.
The growth process of films can be described by the phase transformation from anatase to rutile, which can be affected by the grain boundary concentrations, particle packing factors and the defects existing in the microstructure [15,16]. Controls on the phase structure of the films during growth are critical, as the properties of TiO2 films are highly dependent on the crystal structures, morphologies and orientations. Most studies have suggested that the sol-gel process is highly favorable due to its advantages that include a low-temperature and low-cost process, controllable film morphologies and composition, and the possibility to be coated on a large area. The synthesis of sol-gel-deposited TiO2 thin films can be manipulated by altering the processing conditions, which include the choice of solvents, solvent concentrations and post-deposition annealing temperatures [17]. Previous work on TiO2 films annealed at 400–700 °C showed a predominantly anatase-phase structure, and by controlling the Ag molar ratio it was found that the Ag nanoparticles were uniformly distributed and strongly attached to the mesoporous TiO2 matrix [18,19]. This work aims to study Ag/TiO2 thin films’ microstructural evolution during annealing at a low annealing temperature of 280 °C.

2. Materials and Methods

2.1. Materials

Titanium (IV) isopropoxide 97% (TTIP) was used as a precursor, and silver nitrate (AgNO3) powder was used as the source of Ag. Both were purchased from Sigma Aldrich, Saint Louis, MO, USA. Propan-2-ol was purchased from QReC Chemicals, QREC (Asia) Sdn Bhd, Selangor, Malaysia, while acetic acid (99.5%) and methylene blue (MB) were purchased from Daejung Reagent Chemicals, Daejung Chemicals and Metals Co., Ltd., Siheung, Korea. The chemicals were of analytical reagent grades and were used as received without further purification. The hydrolysis reaction will result in precipitation using precursors with a strong reactivity towards water (titanium alkoxide). The nonaqueous sol-gel technique was used with titanium chloride or titanium alkoxides as a precursor to mitigate the precipitation.

2.2. Preparations of Ag/TiO2 Thin Film

To prepare the Ti precursor sol, a given TTIP volume was dissolved in 20 mL of isopropanol. The solution was then stirred continuously for 10 min at room temperature. This was followed by the dropwise addition of a mixed solution of 0.1 mL of water, 2.0 mL of ethanol and 0.1 mL of 0.1 M AgNO3 while stirring the solution for another 10 min. A small aliquot of concentrated acetic acid of a negligible dilution was then added to adjust the solution. The produced alkoxide solution was stirred until a transparent sol was formed without any precipitation. To deposit the thin film, glass substrates (15 mm × 15 mm × 0.5 mm) were used. The substrates were degreased and cleaned with acetone for 30 min in an ultrasonic cleaner and thoroughly rinsed with water. The substrates were then dried at 90 °C for 90 min in lidded Petri dishes and then stored for further use. To prepare the Ag/TiO2 thin films, the Ti precursor sol was dropped on the substrate and spin-coated at 500 rpm for 10 s, followed by 2000 rpm for another 30 s. The sample was then dried on a hotplate at 60 °C for 10 min.

2.3. Characterizations

The prepared Ag/TiO2 thin films were characterized using the grazing incidence X-ray diffraction (GIXRD) at 0°–80° with a Cu Kα (λ = 1.5046). The GIXRD patterns were identified using the Diffract Eva Software., DIFFRAC.SUITE™ Software, Bruker, Billerica, MA, USA. The films’ morphologies were imaged using a field emission scanning electron microscopy (FESEM), and the energy dispersive X-ray (EDX) was used to reveal the composition of each element existing in the thin films. The surface topography was examined using an AFM in contact mode, and the growth behavior was elucidated by the real-time synchrotron radiation imaging technology. A real-time observation was performed at the BL20XU beamline in the Spring-8 synchrotron using the imaging observation setup. The nucleation and growth of microstructures and the formation of thin films were observed using the synchrotron. A camera with a resolution ratio of 2.74 μm per pixel and an exposure time of 1 s/frame was used to capture images of the growth process of the Ag/TiO2 thin films, while an X-ray energy of 21 keV between the edges was used to create a higher contrast between the primary and secondary phases. The samples’ position and cell configuration are shown in Figure 1. The observation window area of 10 × 10 m2 with a vent for flux outgassing was made using a 100-μm-thick polytetrafluoroethylene (PTFE) sheet placed between two SiO2 plates. The sample was annealed from room temperature to 280 °C at 0.33 °C/s and held for an hour before cooling at a rate of ~0.33 °C/s.

3. Results and Discussion

3.1. Phase Composition

The Ag/TiO2 thin film was analyzed using the GIXRD, and the results are shown in Figure 2. The GIXRD pattern revealed characteristic peaks at 2θ = 25.4°, 38.0°, 48.1°, 54.2° and 62.4°, which represent different crystallographic planes corresponding to the anatase phases of TiO2, (101), (112), (200), (211) and (204), respectively, with the Joint Committee on Powder Diffraction Standards (JCPDS) Card No.: 21-1272. There is no Ag characteristic peak due to the low concentration of AgNO3 added into the TiO2 parent solution, and the peak is below the detection limit of the GIXRD. Besides that, it may be due to the uniform distribution of Ag particles in the titanium matrix, or the Ag peak at 2θ = 38.16° is covered by the TiO2 peak at 2θ = 38.0° owing to the high dispersion or a small amount of Ag addition. This is in good agreement with another study reported by Chang et al. [20]. Seery et al. also reported that the presence of Ag content in the TiO2 thin film did not lead to apparent varieties in the crystalline structure [21].

3.2. Microstructural and Topography Analysis

The samples were imaged using FESEM and AFM to elucidate the nature of Ag’s incorporation into the TiO2 film (doping/segregation). The surface microstructure of Ag/TiO2 thin films obtained from the FESEM micrographs is shown in Figure 3. Theoretically, there are several stages for the films’ formation, which are: (1) the nucleation stage, encompassing the condensation of vapors, adsorption of atoms, migration of atoms, and formation of critical nuclei and stable clusters; (2) the films forming an island structure; (3) the coalescence of the island with gaps in between; (4) the channel stage; and (5) the formation of a continuous film [22]. The Ag particle deposits distributed randomly on the surface of the TiO2 thin film are evident in Figure 3a, which is still in the third or fourth stage of its growth. The Ag particle is mostly in a cubical shape, while the TiO2 thin film resembles porous ring-like structures, where each ring coalesces to form a channel of ring. Due to the low annealing temperature, the porous ring-like structures lack the energy to form continuous films. The structures limit the pore accessibility in the thin films, as the interfacial energy between the substrate’s surface and the films often leads to the pores being positioned parallel to the substrate surface [23]. Figure 3a shows the distribution of Ag on the surface of the TiO2 thin films, and it is evident that Ag precipitation is present on the TiO2 thin film, with the Ag’s average particle size estimated at ~0.1 μm. It can be concluded that the coalescences of porous ring-like structures for the TiO2 thin film and the formation of the cubical shape of Ag can occur at a low temperature of 280 °C.
The presence of Ag can be confirmed by the quantification of the EDX spectra of the Ag/TiO2 thin film, as shown in Figure 3a. The EDX spectra showed that the amount of Ag in the TiO2 thin film was very low, as only a small amount of AgNO3 (0.1 mL) was added into the sol solution. The spectra also showed a reduction process of Ag+ to Ag0 that took place as the AgNO3 decomposed when the thin film was annealed to a certain temperature. The Ag+ ions were dispersed uniformly and migrated along with the grain boundaries to the surface of the TiO2 thin film while the grains grew at the same time. It is also believed that the Ag+ ions were probably present on the surface of the TiO2 anatase grains, forming the Ag-O-Ti bonds. This result is in agreement with Yu et al. [19], who reported that low AgNO3 produced shining Ag nanoparticles similar to the shining cubical shape of Ag, as shown in Figure 3a. The EDX spectra also revealed the signals of Ti and Ag at 4.508 and 2.983 keV, respectively, which were similar to the ones reported by Tijani et al. [24]. The content of silicon (Si) and oxygen (O) was high due to the glass substrate used to deposit the Ag/TiO2 thin film.
It is believed that the presence of Ag could lead to improving the photocatalytic and antibacterial properties of TiO2. In a study by Li et al., it was reported that the surface modification of TiO2 was done by the addition of a ferromagnetic material [25]. In the study, Fe3O4 was added to the Ag/TiO2, and a strong antibacterial property was demonstrated due to the photocatalytic production of reactive oxygen species that damaged the cell components and viruses. He et al. also reported that the ferromagnetic property of Fe3O4 helped enhance the recovery of the catalyst via the external magnetic field and the visible light absorption, which resulted from the band gap reduction [26].
Figure 4a,b shows the AFM topography of the Ag/TiO2 thin film. The root mean square (RMS) roughness values obtained from the AFM for these films is 10.52 × 10⁻³ μm at a thickness of ~83.72 × 10⁻³ μm. The thin film’s surface’s roughness can be attributed to two factors; a limited surface diffusion caused by a relatively low thermal energy and the crystallite size effect. It is believed that during grain growth, the anatase phase is dominant due to its lower surface energy and higher driving force forming high volume-to-surface ratio grains. However, at higher temperatures, voids are formed, thus repositioning the existing anatase grains into the lower surface areas before transforming them into rutile. The lower surface energy of the anatase grains subsequently affects its growth, making the rutile phase more apparent in the structure [27]. Kumar et al. reported Ag/TiO2 nanocomposite films’ synthesis via the sol-gel method followed by electron beam physical vapor deposition (PVD). The RMS value of their films is in good agreement with the RMS value of the films obtained in this work [28].

3.3. Growth Behavior of Ag/TiO2

The growth behavior of the Ag/TiO2 when annealed at 280 °C was elucidated using in-situ synchrotron radiation imaging technology, as shown in Figure 5. It was observed that as the annealing time increased, the growth of Ag/TiO2 also increased in terms of area and the number of junctions. A further investigation was conducted on the synchrotron images, as shown in Figure 6a–f where the white area depicts areas with Ag/TiO2 and the black areas represent the glass substrate. In this study, Image-J software was used to calculate the area. It was perceived that the surface area of the Ag/TiO2 increased from 28,359 µm2 after 600 s to 35,263 µm2 after 1200 s. The graph in Figure 6g shows that a logarithmic increase is observed with y = 12,907 ln(x) + 27,678 and an R2 of 0.99. This shows that at the early stages of the annealing process, the area was increasing steadily and started to become constant towards the end. From the calculation, at 600 s, the growth rate of Ag/TiO2 was 47.26 µm2/s and after 1200 s it decreased to 11.50 µm2/s and 11.55 µm2/s at 1800 s. Prolonged annealing will further decrease the growth rate to 5.94 µm2/s, 4.12 µm2/s and 4.86 µm2/s at 2400 s, 3000 s and 3600 s, respectively. It is notable that during annealing, no cracks are detected. A study by Bharat et al. concluded that by increasing the annealing time, the growth area of TiO2 was also increased. However, the growth orientation is hard to control, and this is in line with the different crystallographic planes shown by the GIXRD [29].
From the in-situ synchrotron radiation images, the formation of junctions was also quantified. In this preliminary work, the number of junctions was calculated manually in order to observe its relationship with the annealing time. Figure 7 shows that the number of junctions increases with the annealing time, with the linearity being observable in three different phases (Phase I, transition phase (t) and Phase II). At the beginning (Phase I), the number of junctions increases abruptly from 32 to 67 at 600 s and 1200 s, respectively. However, in Phase II the increase in the number of junctions is much slower, almost becoming constant. This is in line with the initial observation where the formation of the junctions was still at the third or fourth stage due to the low annealing temperature. In this phase, the junctions started to grow bigger and coalesce with one another. It is believed that the coalescence of the junctions will cover the hole and gaps between the junctions and will finally form a continuous film when the annealing time or temperature is increased. It is also observed that the junctions grow at random orientations and patterns. This junction can be related to the morphology of Ag/TiO2. The TiO2 thin film resembles porous ring-like structures, and these porous ring-like structures lack the energy to form a continuous film. The surface roughness can also be attributed to the quantity of the junctions.

4. Conclusions

This work successfully synthesized Ag/TiO2 thin films onto a glass substrate via the sol-gel spin coating method. The deposited films were annealed at a low temperature of 280 °C and analyzed using a beamline in the Spring-8 synchrotron with the imaging observation setup. It was found that the obtained Ag/TiO2 thin film was suitable to be used as a photocatalyst, especially in the field of energy and sustainable environmental applications. The growth evolution of the microstructure and the formation of the Ag/TiO2 thin films were successfully observed. The results show that:
(a)
The GIXRD pattern confirmed the presence of the anatase phase without any diffraction peak for Ag that can be clearly seen, even at a low annealing temperature. It is believed that the Ag peak is not present in the GIXRD due to the low concentration of AgNO3 added into the TiO2 parent solution.
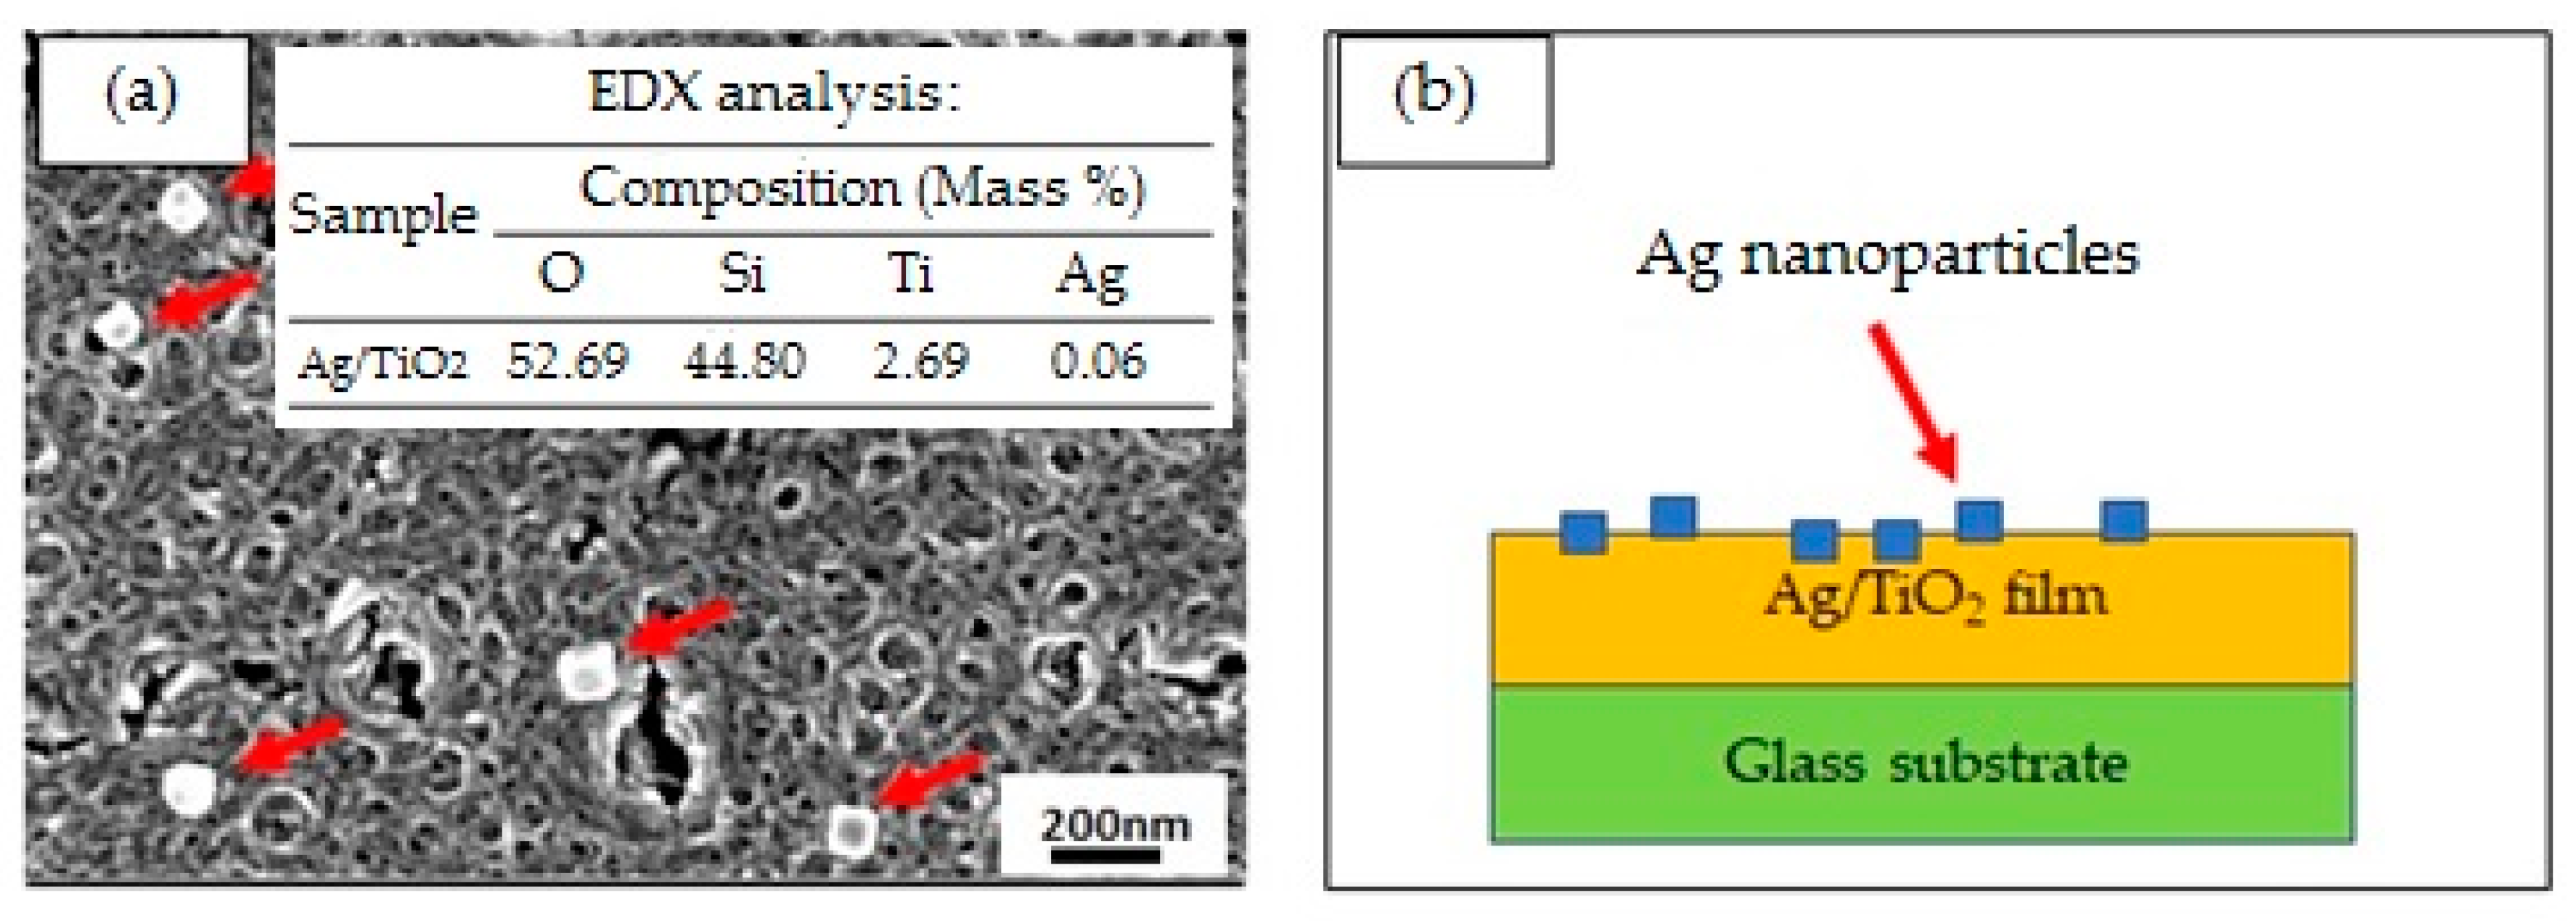
(b)
The FESEM micrograph confirmed that the Ag particles were mostly cubical, while the TiO2 thin film resembled porous ring-like structures, where each ring coalesced to form a channel of ring. It was revealed that the coalescences of the porous ring-like TiO2 thin film structures and the formation of the cubical shape of Ag could be obtained even at a low annealing temperature. The EDX results confirmed the presence of a small amount of Ag particles.
(c)
The surface topographical profile shows that the root mean square (RMS) roughness values obtained by the AFM for the film are 10.52 × 10⁻³ μm with a thickness of 83.72 × 10⁻³ μm. The film’s surface was rough due to the limited surface diffusion, caused by the relatively low thermal energy and the crystallite size effect.
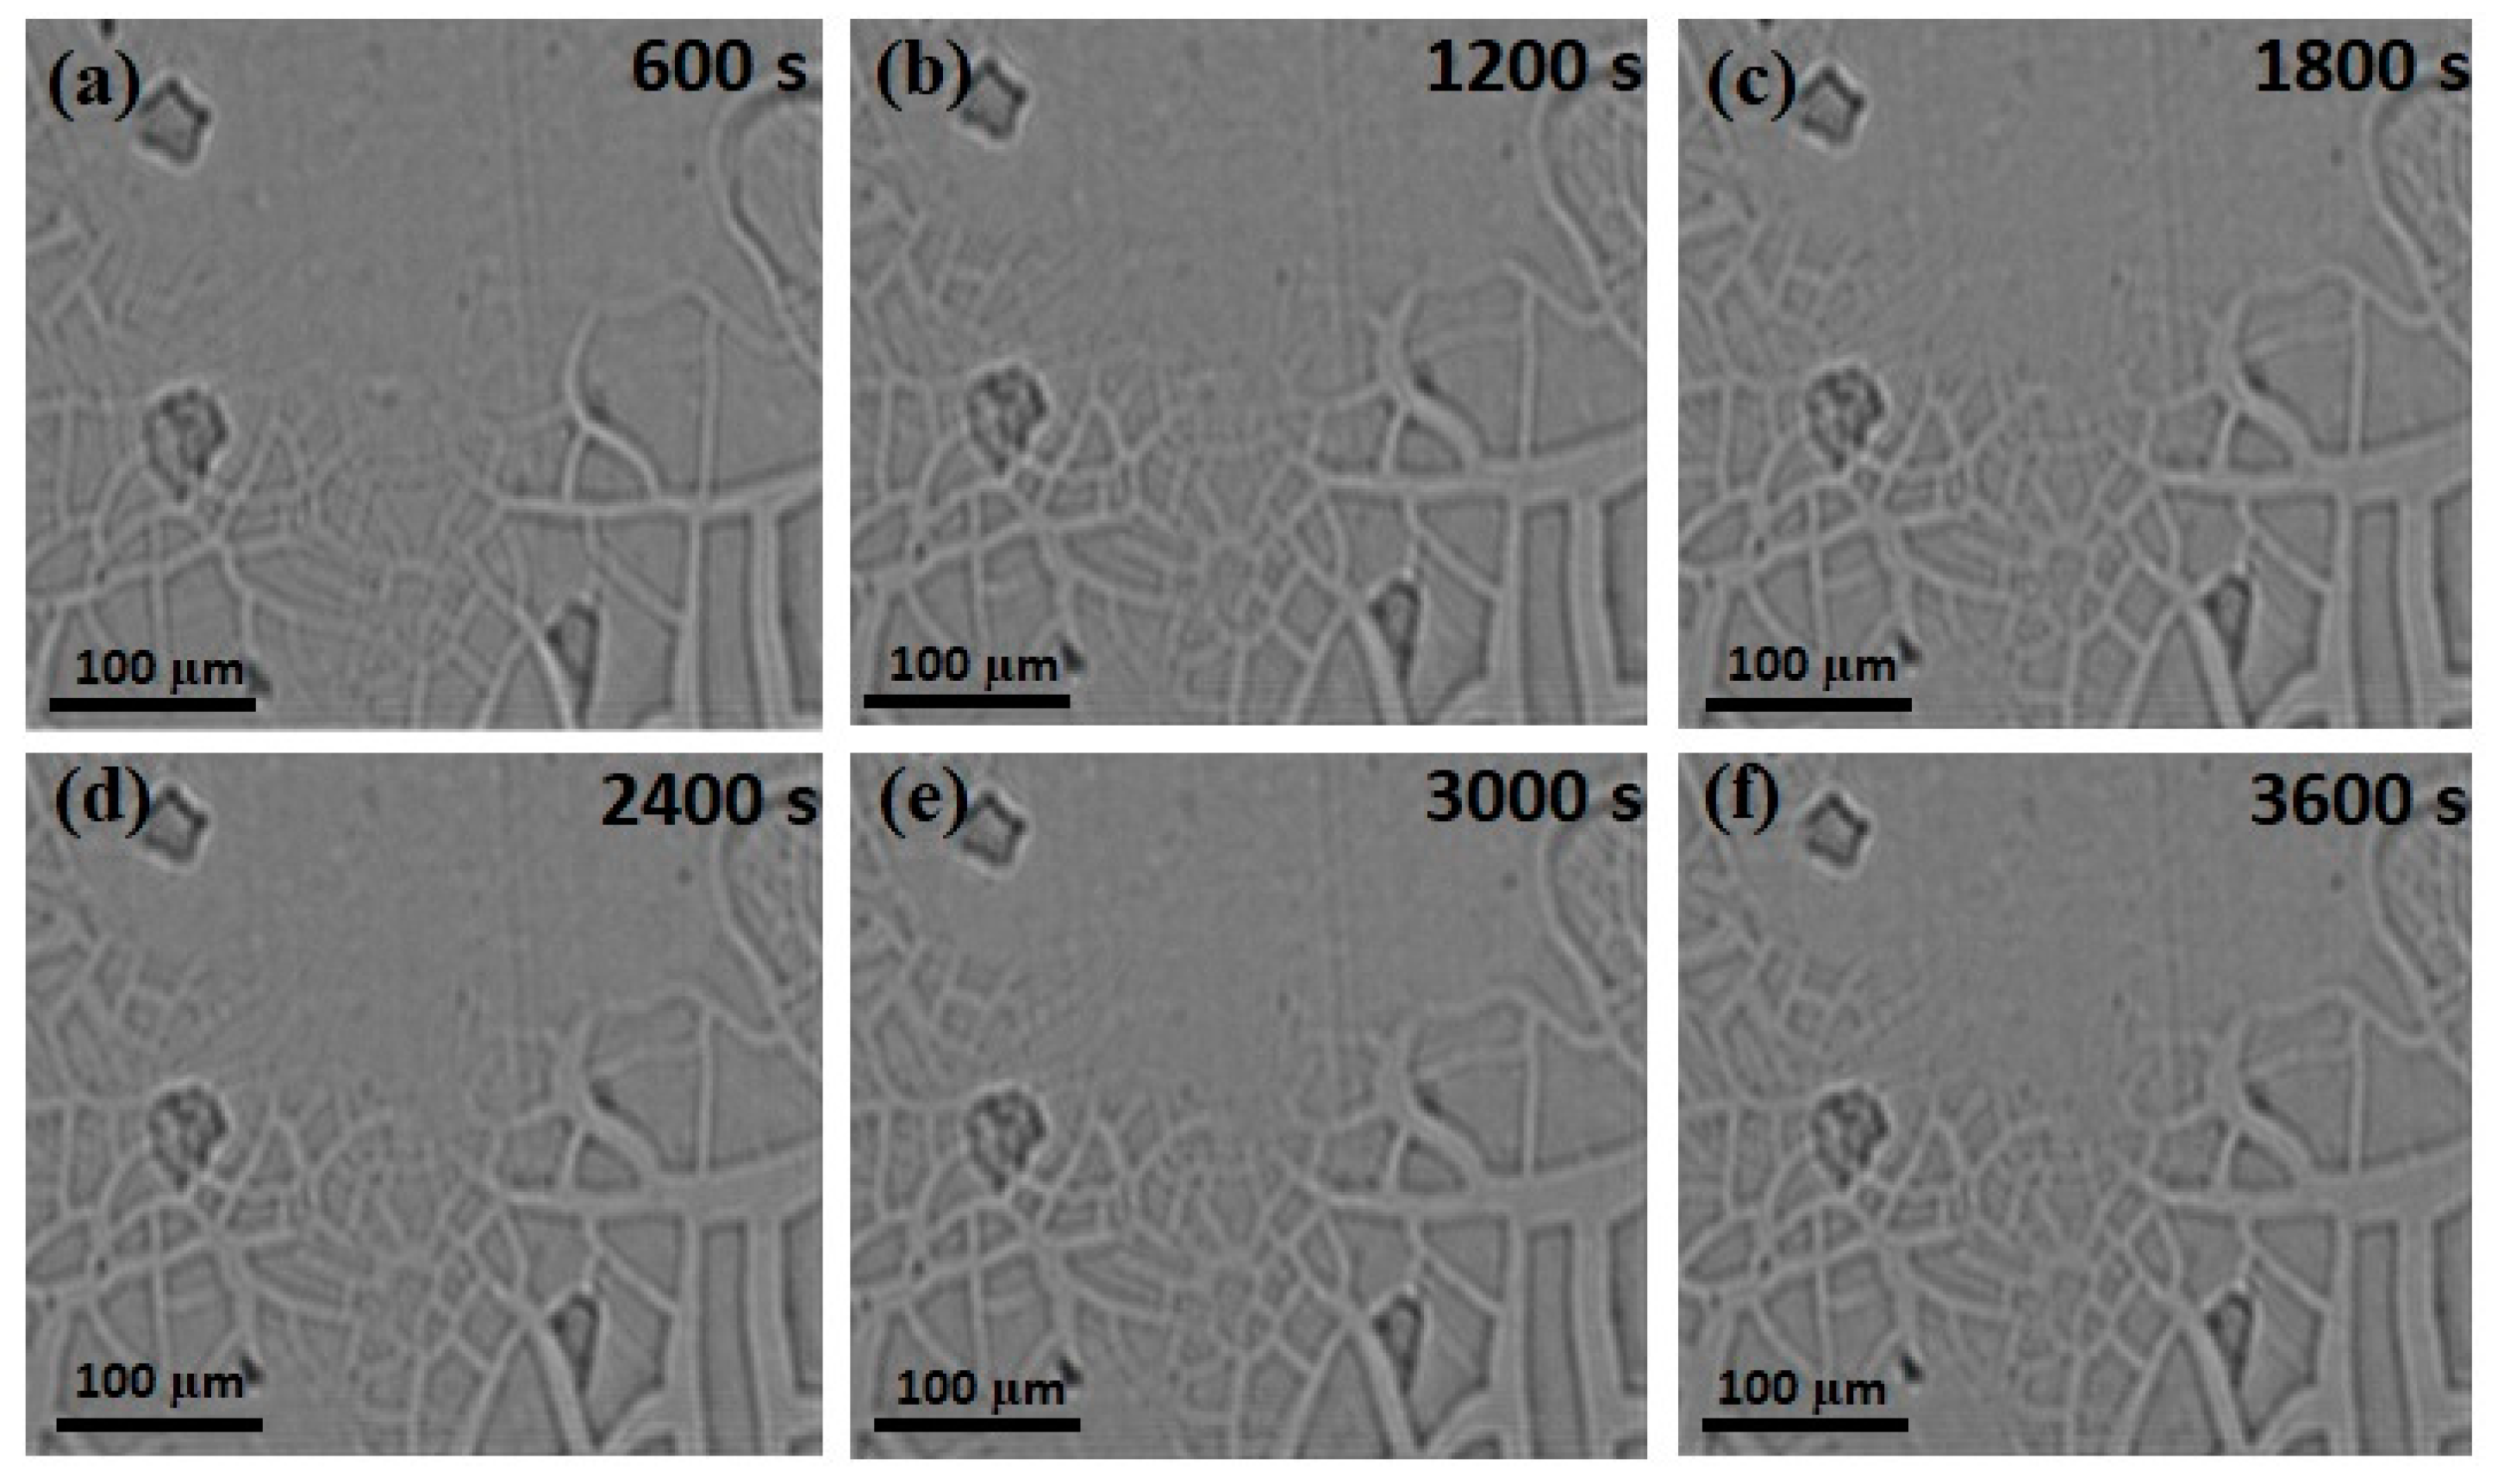
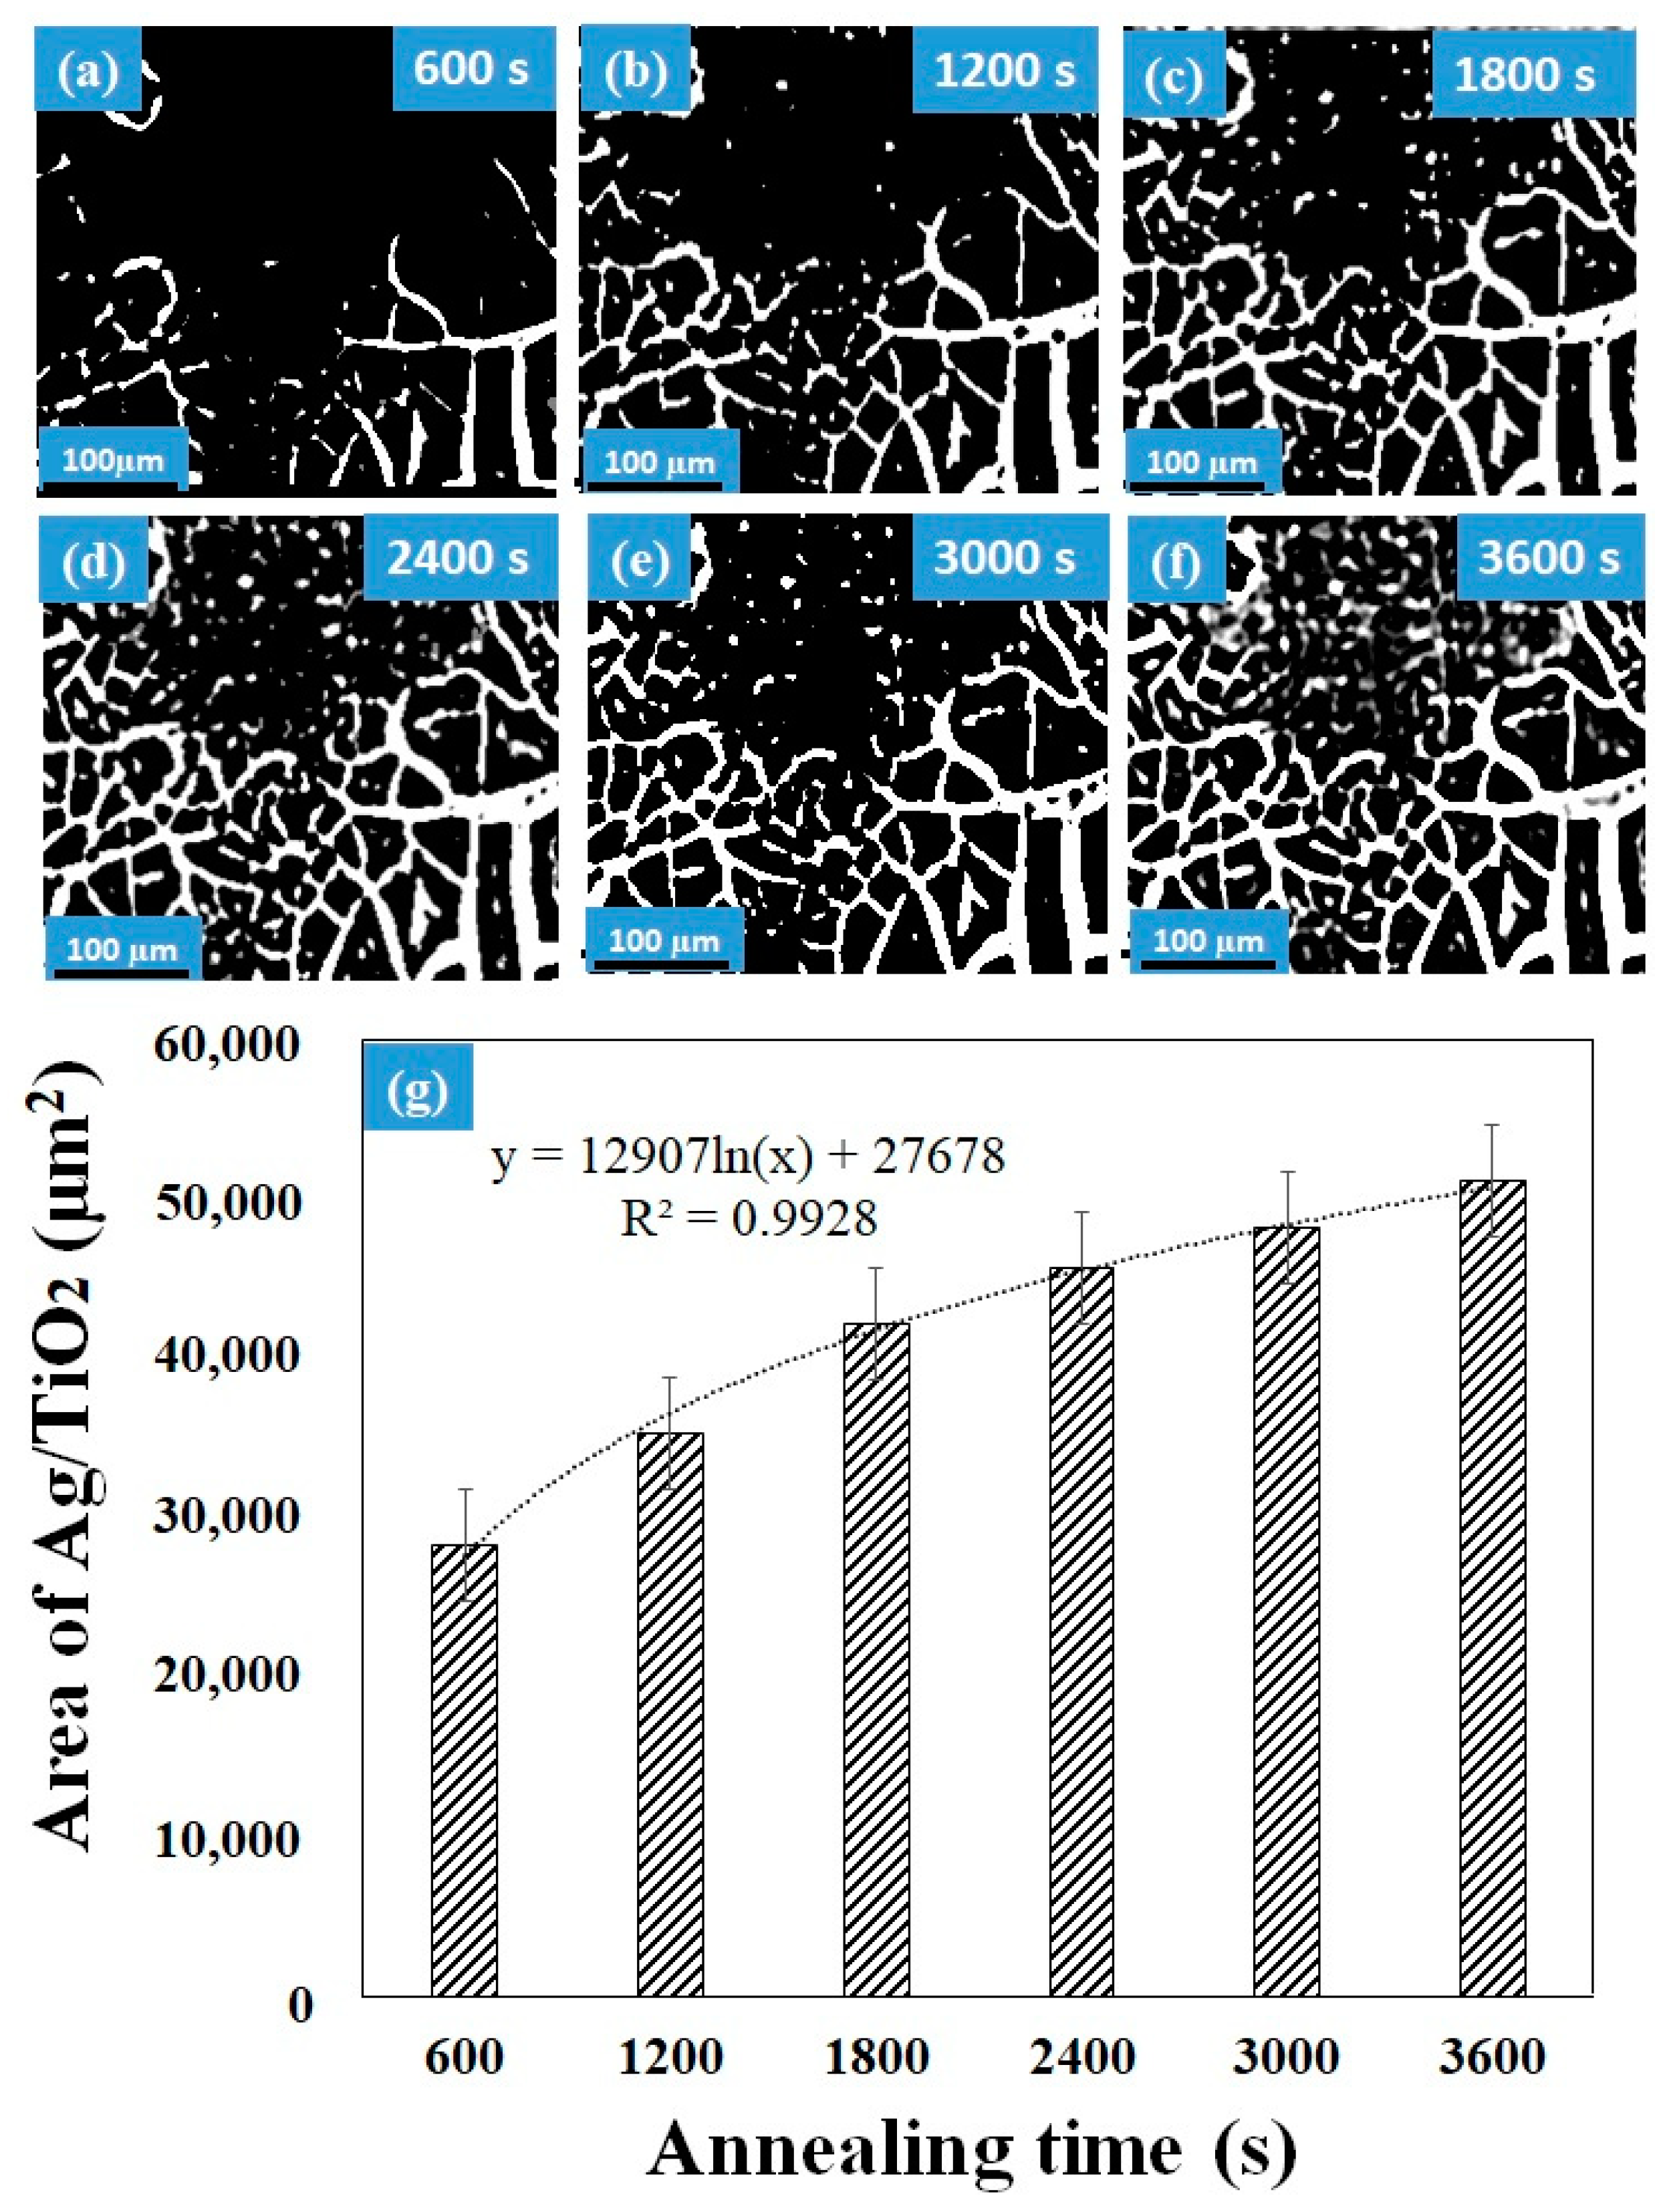
(d)
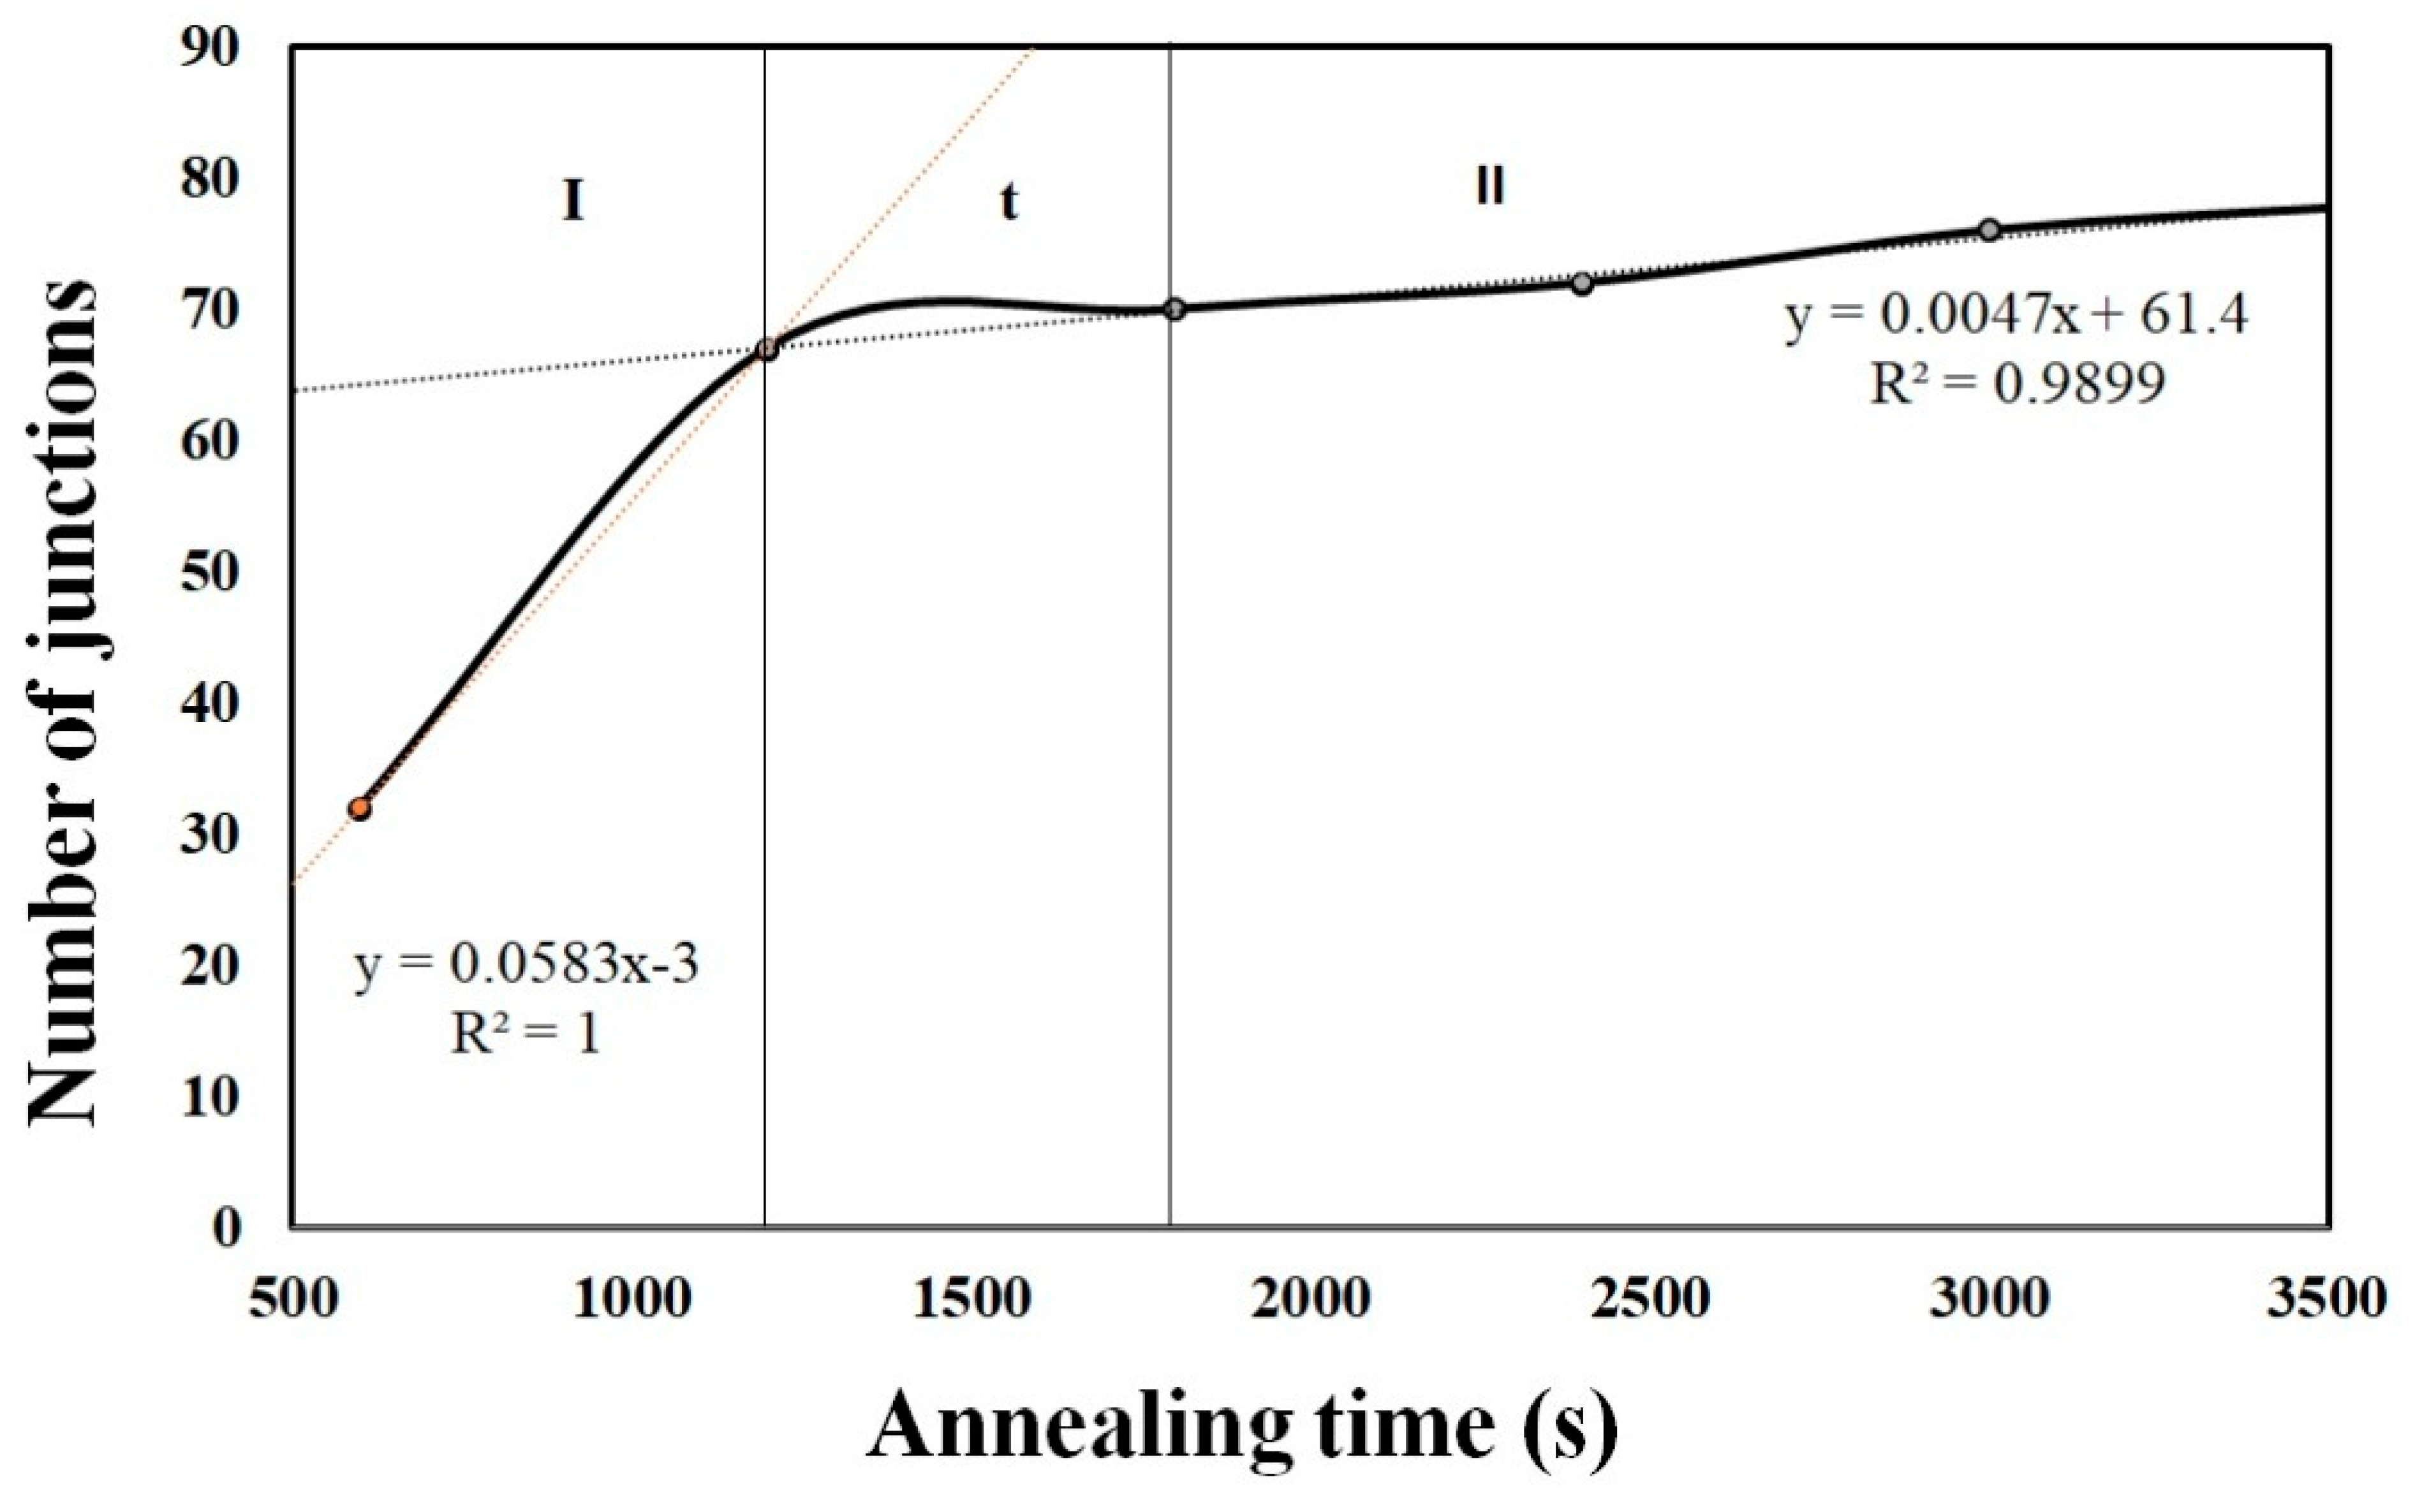
From the in-situ synchrotron radiation images, the formation of junctions was also quantified. It was observed that as the annealing time increased, the growth of Ag/TiO2 also increased in terms of area and the number of junctions. It was clearly seen that the growth rate of Ag/TiO2 at 600 s was 47.26 µm2/s, and that after 1200 s it decreased to 11.50 µm2/s and to 11.55 µm2/s at 1800 s. Prolonged annealing will further decrease the growth rate to 5.94 µm2/s, 4.12 µm2/s and 4.86 µm2/s at 2400 s, 3000 s and 3600 s, respectively. This shows that at the early stages of the annealing process, the area was increasing steadily and started to become constant towards the end.

Author Contributions

Conceptualization, D.S.C.H. and M.A.A.M.S.; synthesis of samples, K.A.R.; characterization and analysis, M.I.I.R., K.A.R., D.S.C.H., K.N. and H.Y.; validation, M.A.A.M.S. and A.W.A.; resources, M.M.A.B.A., J.J.W. and M.N.; writing—original draft preparation, D.S.C.H.; writing—review and editing, K.A.R., M.I.I.R. and A.W.A. All authors have read and agreed to the published version of the manuscript.

Funding

This research received no external funding.

Data Availability Statement

The data presented in this study are available in this article.

Acknowledgments

The authors would like to acknowledge the support from the Fundamental Research Grant Scheme under grant number FRGS/1/2017/TK07/UNIMAP/02/6 from the Ministry of Education Malaysia, Center of Excellence Geopolymer & Green Technology (CEGeoGTech), School of Materials Engineering, Universiti Malaysia Perlis, (UniMAP) for their partial support. The synchrotron radiation experiment was achieved at the Japan Synchrotron Radiation Research Institute (JASRI) at the BL20XU beamline of the SPring-8 Synchrotron, under proposal Nos: 2017A1287 and 2017B1519. The authors also acknowledge the support from Grant-in-Aid for Scientific Research (S) (No. 17H06155), JSPS, Japan for the in-situ observation. The authors would like to thank Kentaro Uesugi, Akihisa Takeuchi, and the research group from the Department of Materials Science and Engineering, Kyoto University for their help during the experiment.

Conflicts of Interest

The authors declare no conflict of interests.

References

  1. Kim, B.H.; An, J.H.; Kang, B.A.; Hwang, K.S.; Oh, J.S. Nickel-doped titanium oxide films prepared by chemical solution deposition. J. Ceram. Proc. Res. 2004, 5, 53–57. [Google Scholar]
  2. Zaharescu, M.; Crisan, M.; Muševič, I. Atomic force microscopy study of TiO2 films obtained by the sol-gel method. J. Sol–Gel Sci. Tech. 1998, 13, 769–773. [Google Scholar] [CrossRef]
  3. Nishide, T.; Sato, M.; Hara, H. Crystal structure and optical property of TiO2 gels and films prepared from Ti-edta complexes as titania precursors. J. Mater. Sci. 2000, 35, 465–469. [Google Scholar] [CrossRef]
  4. Nakata, K.; Fujishima, A. TiO2 photocatalysis: Design and applications. J. Photochem. Photobiol. C Photochem. Rev. 2012, 13, 169–189. [Google Scholar] [CrossRef]
  5. Fujishima, A.; Rao, T.N.; Tryk, D.A. Titanium Dioxide Photocatalysis. J. Photochem. Photobiol. C Photochem. Rev. 2000, 1, 1–21. [Google Scholar] [CrossRef]
  6. Schneider, J.; Matsuoka, M.; Takeuchi, M.; Zhang, J.; Horiuchi, Y.; Anpo, M.; Bahnemann, D.W. Understanding TiO2 photocatalysis: Mechanisms and materials. Chem. Rev. 2014, 114, 9919–9986. [Google Scholar] [CrossRef]
  7. Suhail, M.H.; Mohan Rao, G.; Mohan, S. dc reactive magnetron sputtering of titanium-structural and optical characterization of TiO2 films. J. Appl. Phys. 1992, 71, 1421. [Google Scholar] [CrossRef]
  8. Gyorgy, E.; del Pino, A.P.; Sauthier, G.; Figueras, A.; Alsina, F.; Pascual, J. Structural, morphological and local electric properties of TiO2 thin films grown by pulsed laser deposition. J. Phys. D Appl. Phys. 2007, 40, 5246–5251. [Google Scholar] [CrossRef]
  9. Alzamani, M.; Shokuhfar, A.; Eghdam, E.; Mastali, S. Influence of catalyst on structural and morphological properties of TiO2 nanostructured films prepared by sol–gel on glass. Prog. Nat. Sci. Mater. Int. 2013, 23, 77–84. [Google Scholar] [CrossRef] [Green Version]
  10. Qiu, J.; Zhang, S.; Zhao, H. Recent applications of TiO2 nanomaterials in chemical sensing in aqueous media. Sens. Actuators B Chem. 2011, 160, 875–890. [Google Scholar] [CrossRef]
  11. Yin, M.; Liu, X.; Hu, L.; Xu, L.; He, J. Effects of Nb doping on microstructure and photocatalytic properties of TiO2 thin film. Desalin. Water Treat. 2016, 57, 6910–6915. [Google Scholar] [CrossRef]
  12. Azani, A.; Che Halin, D.S.; Abdul Razak, K.; Abdullah MM, A.; Mohd Salleh MA, A.; Mahmed, N.; Abdul Razak MF, S.; Ramli, M.M.; Azhari, A.W.; Chobpattana, V. Effect of graphene oxide on microstructure and optical properties of TiO2 thin film. IOP Conf. Ser. Mater. Sci. Eng. 2019, 701, 012011. [Google Scholar] [CrossRef] [Green Version]
  13. Sajid, M.I.; Gandhi, V.G.; Mishra, M.; Tripathi, S.; Shripathi, T.; Joshi, P.A.; Shah, D.O. Single-Step Synthesis of Silver-Doped Titanium Dioxide: Influence of Silver on Structural, Textural, and Photocatalytic Properties. Ind. Eng. Chem. Res. 2014, 53, 5749–5758. [Google Scholar]
  14. Abdul Razak, K.; Che Halin, D.S.; Azani, A.; Abdullah, M.M.A.; Mohd Salleh, M.A.A.; Mahmed, N.; Abdul Razak, M.F.S.; Ramli, M.M.; Azhari, A.W.; Chobpattana, V. Microstructural studies of doped PEG Ag/TiO2 thin film. IOP Conf. Ser. Mater. Sci. Eng. 2019, 701, 012004. [Google Scholar] [CrossRef] [Green Version]
  15. Reidy, D.J.; Holmes, J.D.; Morris, M.A. The critical size mechanism for the anatase to rutile transformation in TiO2 and doped-TiO2. J. Eur. Ceram. Soc. 2006, 26, 1527. [Google Scholar] [CrossRef]
  16. Kumar, K.P.; Keizer, K.; Buggraaf, A.J.; Okubo, T.; Nagamoto, H. Textural Evolution and Phase Transformation in Titania Membranes: Part 2. J. Mater. Chem. 1993, 3, 1151. [Google Scholar] [CrossRef] [Green Version]
  17. Hu, L.; Yoko, T.; Kozuka, H.; Sakka, S. Effects of solvent on properties of sol—gel-derived TiO2 coating films. Thin Solid Film. 1992, 219, 18. [Google Scholar] [CrossRef]
  18. Kajutvichyanukul, P.; Ananpattarachai, J.; Pongpom, S. Sol–gel preparation and properties study of TiO2 thin film for photocatalytic reduction of chromium (VI) in photocatalysis process. Sci. Technol. Adv. Mater. 2005, 6, 352. [Google Scholar] [CrossRef]
  19. Yu, B.; Leung, K.M.; Guo, Q.; Lau, W.M.; Yang, J. Synthesis of Ag–TiO2 composite nano thin film for antimicrobial application. Nanotechnology 2011, 22, 115603. [Google Scholar] [CrossRef] [Green Version]
  20. Chang, C.-C.; Chen, J.-Y.; Hsu, T.-L.; Lin, C.-K.; Chan, C.-C. Photocatalytic properties of porous TiO2/Ag thin films. Thin Solid Film. 2008, 516, 1743–1747. [Google Scholar] [CrossRef]
  21. Seery, M.K.; George, R.; Floris, P.; Pillai, S.C. Silver doped titanium dioxide nanomaterials for enhanced visible light photocatalysis. J. Photochem. Photobiol. A Chem. 2007, 189, 258–263. [Google Scholar] [CrossRef] [Green Version]
  22. Eckertová, L. Mechanism of Film Formation. Phys. Thin Film. 1977, 72–114. [Google Scholar] [CrossRef]
  23. Lee, U.H.; Kim, M.H.; Kwon, Y.U. Mesoporous thin films with accessible pores from surfaces. Bull. Korean Chem. Soc. 2006, 27, 808–816. [Google Scholar]
  24. Tijani, J.O.; Totito, T.C.; Fatoba, O.O.; Babajide, O.O.; Petrik, L.F. Synthesis, characterization and photocatalytic activity of Ag metallic particles deposited carbon-doped TiO2 nanocomposites supported on stainless steel mesh. J. Sol-Gel Sci. Technol. 2017, 83, 207–222. [Google Scholar] [CrossRef]
  25. Li, Q.; Mahendra, S.; Lyon, D.Y.; Brunet, L.; Liga, M.V.; Li, D.; Alvarez, P.J. Antimicrobial nanomaterials for water disinfection and microbial control: Potential applications and implications. Water Res. 2008, 42, 4591–4602. [Google Scholar] [CrossRef]
  26. He, Q.; Zhang, Z.; Xiong, J.; Xiong, Y.; Xiao, H. A novel biomaterial—Fe3O4:TiO2 core-shell nano particle with magnetic performance and high visible light photocatalytic activity. Opt. Mater. 2008, 31, 380–384. [Google Scholar] [CrossRef]
  27. Vahl, A.; Veziroglu, S.; Henkel, B.; Strunskus, T.; Polonskyi, O.; Aktas, O.C.; Faupel, F. Pathways to Tailor Photocatalytic Performance of TiO2 Thin Films Deposited by Reactive Magnetron Sputtering. Materials 2019, 12, 2840. [Google Scholar] [CrossRef] [Green Version]
  28. Kumar, M.; Kumar Parashar, K.; Kumar Tandi, S.; Kumar, T.; Agarwal, D.C.; Pathak, A. Fabrication of Ag:TiO2 Nanocomposite Thin Films by Sol-Gel Followed by Electron Beam Physical Vapour Deposition Technique. J. Spectrosc. 2013, 491716. [Google Scholar] [CrossRef]
  29. Bade, B.R.; Rondiya, S.; Bhopale, S.R.; Dzade, N.Y.; Kamble, M.M.; Rokade, A.; Nasane, M.P.; More, M.A.; Jadkar, S.R.; Funde, A.M. Investigation of growth mechanism for highly oriented TiO2 nanorods: The role of reaction time and annealing temperature. Sn Appl. Sci. 2019, 1, 1073. [Google Scholar] [CrossRef] [Green Version]
Figure 1. The schematic diagram setup of the real-time synchrotron radiation imaging.
Magnetochemistry 07 00014 g001
Figure 2. The grazing incidence X-ray diffraction (GIXRD) pattern of the Ag/TiO2 thin film.
Magnetochemistry 07 00014 g002
Figure 3. Microstructural field emission scanning electron microscopy (FESEM) micrographs of (a) the distribution of Ag particles and the energy dispersive X-ray (EDX) result of the Ag/TiO2 thin film; (b) the schematic diagram of Ag particles formed on the TiO2 layer that was deposited onto a glass substrate.
Magnetochemistry 07 00014 g003
Figure 4. Atomic force microscope (AFM) topography of the Ag/TiO2 thin film; (a) surface image and (b) surface topographical profile.
Magnetochemistry 07 00014 g004
Figure 5. The growth behavior of the Ag/TiO2 thin film for (a) 600 s, (b) 1200 s, (c) 1800 s, (d) 2400 s, (e) 3000 s and (f) 3600 s at 280 °C.
Magnetochemistry 07 00014 g005
Figure 6. Growth of the Ag/TiO2 area at annealing times of (a) 600 s, (b) 1200 s, (c) 1800 s, (d) 2400 s, (e) 3000 s and (f) 3600 s, and the (g) graph of the Ag/TiO2 area versus the annealing time.
Magnetochemistry 07 00014 g006
Figure 7. The number of junctions formed at different annealing times.
Magnetochemistry 07 00014 g007
Publisher’s Note: MDPI stays neutral with regard to jurisdictional claims in published maps and institutional affiliations.

