Quantitative NMR as a Versatile Tool for the Reference Material Preparation


1
Organic Metrology Group, Division of Chemical and Biological Metrology, Korea Research Institute of Standards and Science, Daejeon 34113, Korea
2
Department of Chemistry, Chung-Ang University, Seoul 06974, Korea
*
Authors to whom correspondence should be addressed.
Magnetochemistry 2021, 7(1), 15; https://0-doi-org.brum.beds.ac.uk/10.3390/magnetochemistry7010015
Submission received: 10 December 2020
/
Revised: 6 January 2021
/
Accepted: 14 January 2021
/
Published: 18 January 2021
(This article belongs to the Special Issue Review Papers on Magnetic Resonances)
Abstract
:The assessment of primary calibrator purity is critical for establishing traceability to the International System of Units (SI). Recently, quantitative nuclear magnetic resonance (qNMR) has been used as a purity determination method for reference material development, and many related measurement techniques have been designed to acquire accurate and reliable results. This review introduces the recent advances in these techniques (including multidimensional methods), focusing on the application of qNMR to reference material preparation.
1. Introduction
The establishment of metrological traceability is important for achieving the comparability of measurement results [1]. In regard to chemical measurements, traceability to the International System of Units (SI) is realized through the use of calibration standards having certified purity values [2]. The purity of primary calibrators has been traditionally determined by the mass balance method, that is, by subtracting the total amount of impurities from 100%, with impurity quantitation performed using techniques such as gas chromatography, liquid chromatography, thermal gravimetric analysis, and Karl Fischer titration. Although the mass balance method is well-established, it cannot be applied to organic substances, which lack chromophores and nonvolatiles. Furthermore, it is very time- and labor-intensive.
Nuclear magnetic resonance (NMR) spectroscopy holds great promise for quantitative analysis, as the NMR peak area is proportional to the number of nuclei [3,4,5]. Recently, quantitative NMR (qNMR) has been used for purity analysis as an alternative to the mass balance method, allowing one to determine analyte purity directly by comparison with a standard and thus simplify the overall purity determination procedure. The Consultative Committee for Amount of Substance: Metrology in Chemistry and Biology (CCQM) working group on organic analysis (OAWG) is currently exploring the potential of qNMR through international comparison [6,7,8]. Furthermore, qNMR has been adopted as a purity determination method for pharmacopeia [9,10]. However, to obtain accurate and reliable results, one should further optimize the qNMR sample preparation procedure [11] and measurement parameters [12,13]. Indeed, collaborative international efforts have been made to demonstrate the capability of qNMR [7,14,15,16,17]. The present review discusses the basic quantitation methods and recent advances of qNMR techniques, and introduces reference materials developed by qNMR.
2. Basics of quantitative Nuclear Magnetic Resonance (qNMR)
2.1. Internal Standard Method
qNMR analysis is widely performed by adding a known amount of an internal standard (IS) to the sample solution. As the NMR peak area is proportional to the number of nuclei, analyte concentration or purity can be determined by comparing peak areas. The choice of the IS is critical; in particular, the IS should (i) have at least one peak that does not overlap with that of the analyte, (ii) be soluble in the employed solvent, (iii) not react with the analyte, (iv) be non-hygroscopic and nonvolatile, and (v) have high purity. Analyte purity can be determined as:
where P is the purity (mass fraction), I is the integrated signal area, N is the number of 1H atoms contributing to the signal area, M is the molecular weight, W is the weight, and the subscripts “a” and “s” refer to the analyte and the IS, respectively. The combined uncertainty of the purity value is calculated as:
A Bayesian approach was developed to evaluate the uncertainty of the qNMR measurement [18], and Markov chain Monte Carlo analysis was used to calculate the posterior probability distribution. In the Bayesian approach, analyte purity can be constrained in the range of 0–1 g/g.
The IS method is claimed to be more accurate than external and electric reference ones [19] but suffers from the possibility of overlap between analyte and IS peaks.
2.2. External Standard Method
In the external standard method (represented by several approaches), a separate NMR tube containing the standard is used instead of adding a standard to the sample solution. One of the variations is to use a coaxial insert containing the standard solution [20]. After the insert is placed into the NMR sample tube, the signals of the analyte and the standard are measured in a single run. This approach was used to determine the purities of military nerve agents with accuracies and precisions of 1%. A more general approach is to measure the NMR signals of the sample and standard solutions in independent runs [21]. The ratio of analyte and standard signal areas is proportional to corresponding concentration ratio if the response factor is consistent during measurement. The accuracy of such measurements can be enhanced by choosing appropriate experimental parameters.
According to the reciprocity principle, the 90° and 360° pulse lengths are inversely proportional to the NMR signal strength [22]. The PUlse Length based CONcentration determination (PULCON) approach was developed to account for the differences in NMR sensitivities between samples in relation to the pulse lengths [23]. In this case, the concentration of the analyte in the solution can be accurately calculated using Equation (3), after measuring the signal areas as well as the 360° pulse lengths of the analyte and standard solutions:
where c is the concentration, fT is instrument factor, T is the temperature, θ360 is the 360° rf-pulse length, and n is the number of transients used for measurement of the analyte and the standard. The PULCON approach is easy to implement and adapt to all NMR spectrometers as it does not require any special hardware or software. Additionally, it could provide accurate concentrations of the samples in the NMR tube. Therefore, PULCON has been used for the quantitative analyses of various samples. Monakhova et al. used the PULCON method for purity assay of pharmaceutical compounds [24]. The purities obtained with the PULCON method were compared with those assessed with the internal standard method to show the validity of the PULCON method. The PULCON method was used for the quantification of natural isolates without molecular weight information [25]. In addition, illicit drug components were analyzed by the PULCON method, without the addition of the reference standard [26].
The external standard method offers great flexibility in standard selection (as the sample and standard solution are not mixed), does not suffer from signal overlap, and allows the same molecule to be used as an external standard. While the IS method requires each sample to be supplemented with IS, a single standard solution can be used for multiple sample solutions in the external standard method. However, the external standard method contains significantly more bias factors than the IS method, with examples including the instrument and sample tube employed, and these can affect the results. Therefore, it is necessary to manage the experimental conditions, such as the stability of the NMR instrument, during all runs.
2.3. Electronic Reference Method
Several quantitative analysis strategies using an electronically generated signal were developed. In the ERETIC method (Electronic REference To access In vivo Concentrations), reference signals are synthesized by an electronic device and transmitted to the NMR probe [27,28,29]. The frequency and amplitude of the reference signal can be controlled to avoid peak overlap. After the ERETIC peak is calibrated using the signal obtained for a calibration solution of known concentration, the concentration of the sample solution is determined. When the composition of the sample solution differs from that of the reference solution, the quality factor of the probe is changed, which results in quantification errors. To circumvent this shortcoming, the amplitude-corrected referencing through signal injection (ARTSI) method was developed [30], in which an electronic reference signal is directly injected into the spectrometer receiver path, unlike in the case of ERETIC. Thus the ARTSI signal is not affected by the probe sensitivity change. In the (QUANTAS) method [31], a reference signal is generated by software, considering the change of experimental conditions and is used during data processing without being injected into the spectrometer.
2.4. Signal Processing
Appropriate NMR signal processing and peak integration is important for accurate quantification. Therefore, an automated data treatment method has been developed to increase the throughput and reduce the uncertainty induced by different operators. More specifically, Liu et al. developed an automatic peak integration method, and the concentrations of chemical library compounds were determined without any information regarding their chemical structure [32]. Impurity peaks were selected and excluded from the concentration calculation. However, an NMR spectrum having broad peaks and severe peak overlap could not be processed; therefore, global spectrum deconvolution was used for peak picking and integration of this spectrum [33]. For qNMR analysis, the absolute ratio of the peak areas between the calibration solution and sample solution was compared. In addition, the concentration conversion factor was derived to compensate for the area change when the experimental parameters were altered. An automated signal processing algorithm based on a Matlab script was developed to increase the speed of manual processing [34]. The quantification was completed rapidly without a reference database. However, complicated NMR spectra could not be processed by the algorithm.
3. Recent Advances of qNMR
3.1. Heteroatoms
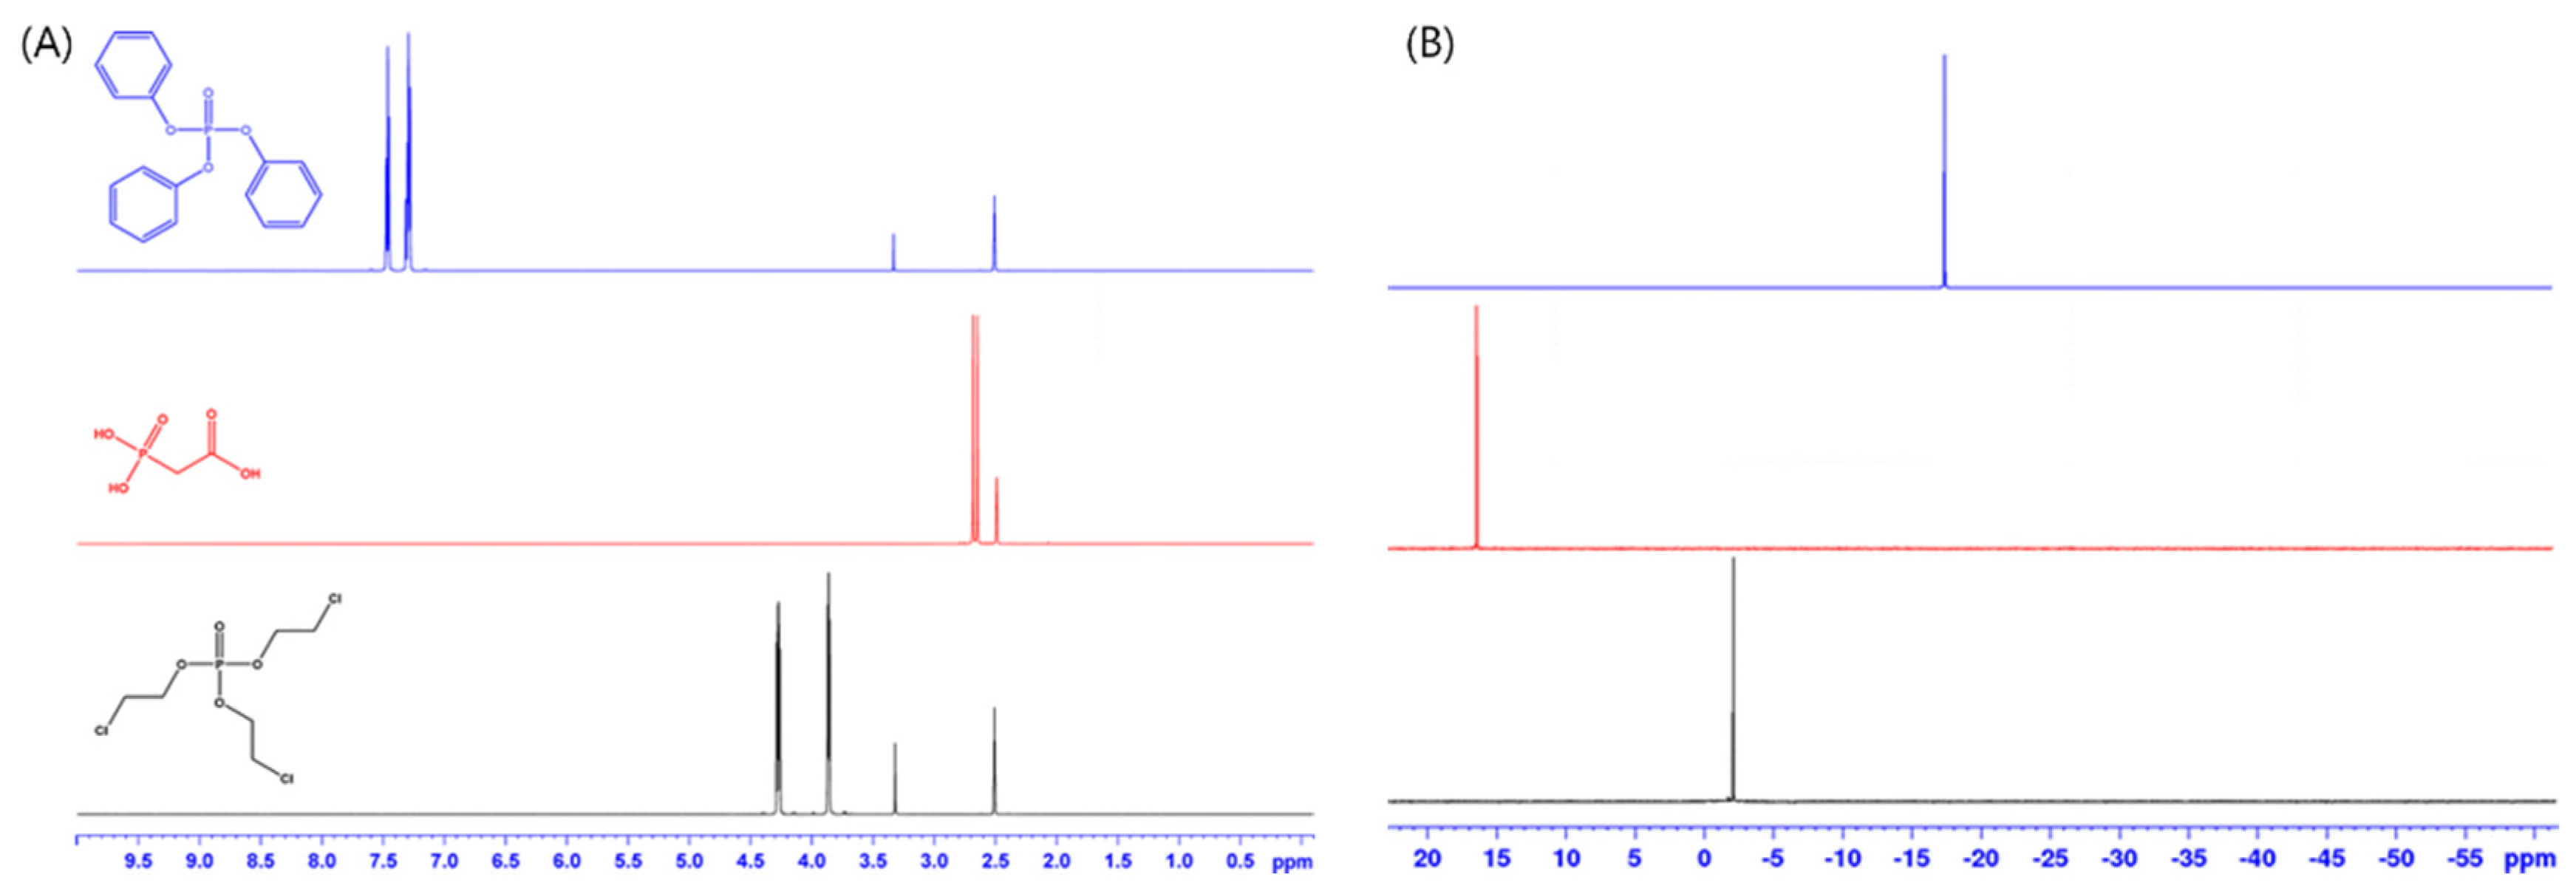
Biological samples often comprise phosphorus-containing analytes, and phosphorylation is one of the most important reactions in biosystems, while fluorine is often present in drugs, pesticides, and perfluorinated polymers. Therefore, 31P and 19F hold great promise as nuclei for qNMR analysis. Owing to the presence of a limited number of 31P and 19F nuclei in most chemicals, 31P and 19F NMR spectra tend to be less complex than 1H spectra, as shown in Figure 1 [35], thereby decreasing the possibility of peak overlap and allowing solvent interference to be avoided, since these nuclei are not present in common solvents. Furthermore, 31P and 19F NMR spectra feature better peak separations, as the chemical shift range of 31P and 19F exceeds that of 1H. Moreover, the natural abundance of 31P and 19F equals 100%, while the corresponding sensitivity is comparable to that of 1H NMR. On the other hand, the broad dispersion of chemical shifts observed for 31P and 19F precludes the application of uniform excitation to the entire shift range, which results in the loss of signal intensity at the edge of the range. Therefore, a novel pulse sequence was developed to increase the frequency range [36], and uniform excitation was realized for wide ranges using multiple chirp pulses. The line width of a 31P NMR spectrum tends to be broad and can be affected by the pH, temperature, and the counter ion of the solution [37]. Therefore, 31P NMR spectroscopy has not been widely used in metabolomics studies. The effects of experimental parameters including T1 relaxation time, excitation bandwidth, and number of transients were also investigated [38]. The offset was set at the middle of analyte and IS signals using excitation pulse symmetry [39], and the purities of flusulfamide and diflubenzuron were determined under optimized conditions and agreed with the reference values. The content of trifluoroacetic acid in a peptide sample was measured by 19F solid-state qNMR [40]. Quantitative volume was determined, the ERETIC method was adopted for calibration, and the EASY (elimination of artifacts in NMR spectroscopy) method [41,42] was used to suppress the background signal.
3.2. Coupling with Chromatography
Unlike to the mass balance method, qNMR is poorly suited for the separation and analysis of impurities with similar structures, as the analyte peaks of analyte may overlap with those of the impurities. Chromatography is a well-established separation technique that allows the risk of overestimation to be reduced by the separation of the analyte from impurities prior to qNMR measurement. Both on-line and off-line coupling were studied. Continuous-flow LC-NMR was used for quantitative analysis. Godejohann et al. suggested two methods suitable for gradient and isocratic elution in liquid chromatography [43]. For gradient elution, NMR measurement conditions may not be identical for the separated analyte and the IS, which can be accounted for by adding the IS to the mobile phase and measuring the analyte and the IS simultaneously. On the other hand, a known amount of IS was injected into a separation column independently from the analyte when isocratic elution was applied. The injected and measured amounts agreed in the LC-NMR experiments. In addition, the chromatograms indicated the separation of the analyte from impurities. Purity assessment was performed with LC-NMR [44]. The analyte and standard were analyzed using two independent LC runs. In this work, the standard was chosen to be identical to the analyte, and thus elution time and the NMR measurement conditions could be maintained in separate LC-NMR runs. The purity of commercial o-xylene was determined using o-xylene certified reference material (CRM) as a standard by LC-NMR and LC-UV, and both results agreed within the relative standard deviation of the method. The above method was also validated by comparison of LC-NMR, gas chromatography-flame ionization detector (GC-FID), and differential scanning calorimetry (DSC) results.
Offline hyphenation is simple and straightforward. An IS-fortified sample solution was analyzed by liquid chromatography [45], and impurity-free fractions containing the analyte and the IS were collected into the same vial, with subsequent purity assessment performed by qNMR. Unlike in the case of on-line LC-NMR analysis, no deuterated solvents were used, and a signal suppression method was applied during NMR measurement. The method developed to correct for the loss of analyte and IS during fraction collection was named as internal standard recovery correction (ISRC)-HPLC-qNMR [46]. Analyte (avermectin B1a) was mixed with IS (ethyl paraben) and injected into an LC column. The analyte- and IS-containing fractions were collected and subjected to qNMR analysis. Additionally, a recovery correction factor was calculated by comparing the analyte: comparing the IS peak area ratios of the initial sample and the collected solution. Seven experiments were performed, and the initially obtained purities (77.08–171.31%) were corrected to 92.87–93.29% using the ISRC method. This method was further developed for internal standard correction (ISC)-HPLC-qNMR [47]. In this case, the IS was added to the analyte-containing fraction and not to the sample itself before separation. Another solution prepared by the accurate weighing of the non-purified initial sample and the IS was analyzed by LC-UV. When the impurity identified during in LC separation was collected and measured by 1H NMR spectroscopy, the overlap of analyte and impurity peak was confirmed. ISC-HPLC-qNMR was used to correct the purity of the candidate material from 99.7 ± 0.3% to 97.6 ± 0.5%, which well agreed with the reference purity determined by the mass balance method (97.61 ± 0.22%). An extended IS method for 1H qNMR assisted by chromatography (EIC) was developed to perform accurate quantitative analysis without the bias of qNMR due to the overlap with impurity peaks [48]. The relative molar sensitivity (RMS) between the IS and analyte-overlapping impurity was calculated from the chromatography-determined response ratio and the molar ratio obtained by qNMR. Sample solution was analyzed by chromatography, and the impurity: IS molar ratio in this solution was obtained using RMS. Then analyte purity was determined by correcting the analyte peak area using the chromatography result as shown in Figure 2. The purity of 2-chlorophenol containing phenol as impurity was determined to show the validity of the EIC approach. The NMR peaks of 2-chlorophenol and phenol could be separated when the pD of the solution was controlled. Even without peak separation in 1H, the NMR spectrum, the purity of 2-chlorophenol determined by EIC well agreed with that assessed by controlling pD.
3.3. Multidimensional NMR
Multidimensional NMR is a promising solution to the problems posed by peak overlap in qNMR, allowing overlapping peaks to be discriminated using the addition of an orthogonal dimension to one-dimensional NMR. However, this approach suffers from a prolonged acquisition time and the dependence of peak volume on various parameters, such as homo-/heteronuclear coupling constants, off-resonance effect, and pulse sequence delay. Several endeavors were made to figure out the drawbacks of multidimensional NMR measurements. Quantitative analysis was performed using heteronuclear single quantum correlation (HSQC). In HSQC experiments, peak volume (Vc) is related to the heteronuclear 1JCH coupling constant and the duration of polarization transfer delay (Δ) as Vc ∝ sin2(πΔ1JCH). As the 1JCH coupling is specific to the analyte site, the proper setting of Δ values is a challenging task. Heikkinen et al. averaged four HSQC spectra obtained using optimized Δ values [49], applying this approach to the quantitative analysis of lignin isolated from wood. The major drawback of averaging is the increased experiment time. Hence quick, quantitative HSQC (QQ-HSQC) was developed to circumvent this problem [50]. As signals corresponding to shorter and longer delays were obtained in a single scan, the measurement time was identical to that of conventional HSQC. QQ-HSQC was applied to strychnine quantitation in solution, affording results comparable to those of Q-HSQC. Homonuclear JHH coupling was removed by including Carr-Purcell-Meiboom-Gill (CPMG) pulse trains in the polarization transfer period [51]. The effect of resonance offset on the edge of the 13C chemical shift was minimized by replacing 90° rectangle pulses with composite ones having an offset compensation. Adiabatic inversion pulses on the 13C channel were employed during the polarization transfer period to improve the accuracy of quantitative analysis [52]. This quantitative, offset-compensated, CPMG-adjusted HSQC (Q-OCCAHSQC) method was applied to strychnine and human blood plasma samples.
Another strategy of calculating a time-zero HSQC spectrum named as HSQC0 was proposed by the Markley group [53]. HSQC spectra were acquired with varying repetition numbers, and HSQC0 was calculated by extrapolation assuming that the logarithm of the signal intensity linearly depends on the repetition number. As HSQC0 corresponds to the hypothetical peak volume obtained at an evolution delay of zero, site specificity can be ignored. Compared to the works of the Heikkinen group, transverse relaxation is considered in this method, and a more reliable result can be obtained. When metabolite concentrations were measured in the presence of IS, noise from higher-concentration metabolites hindered the application of HSQC0. Consequently, this technique was improved using gradient-selective HSCQ spectra and the fast maximum likelihood reconstruction approach [54]. Furthermore, two ISs having high and low concentrations were used to increase accuracy and precision. Rai et al. calculated a correction factor based on theoretical considerations and applied it to the quantification of metabolites in urine samples [55]. However, theoretical calculations require information related to the relaxation process, including coupling constants and relaxation times. Moreover, calibration curves generated for each metabolite were employed for HSQC-based quantitative analysis [56]. Fardus-Reid et al. investigated the bias and uncertainty contribution of measurement parameters [57].
Homonuclear correlation spectroscopy (1H-1H COSY) has also been applied for the quantitative analysis of biological samples [58]. The amount of cyclodextrins present in the blood plasma was measured without any sample preparation process. Careful selection of the cross-peak interactions of the COSY spectra enabled quantitative analysis, even with signal overlap between the cyclodextrins and a large number of proteins and lipids in the 1D NMR spectra. Finally, a calibration curve was used, and the method was validated according to the International Conference on Harmonization (ICH) guidelines.
4. Reference Material Development
4.1. Internal Standard
The usage of IS is an essential requirement for purity assessment, with IS values assigned by higher-order methods viewed as critical for the acquisition of SI-traceable purity assessment results. To determine the purity of a wide range of chemicals with various solubilities and chemical shifts, Weber et al. developed 12 CRMs suitable for use as IS in qNMR analysis [59]. The purities of 12 IS candidates were characterized using two benzoic acid CRMs and a potassium hydrogen phthalate CRM to maintain SI traceability. The reliability of the obtained values was increased by measuring purities in multiple ways using qNMR. For example, the purity of maleic acid was determined directly using three CRMs as well as using secondary ISs whose purities were determined by maleic acid. The six purity values all agreed within the expanded uncertainty. These candidates were certified, and stability tests were performed to satisfy the ISO guidelines [60].
Westwood et al. developed seven SI-traceable ISs including CRMs certified by NMIs using titrimetric methods [61]. The purities of other compounds were assigned by qNMR using CRMs as ISs to achieve SI traceability. NMR measurement parameters were optimized to obtain accurate results with the relative uncertainties at the level of 0.5%. The relaxation delay time was chosen as 15 times the spin-lattice relaxation delay times (T1) and the pulse offset location was recommended to lie within ± 2 ppm of the midpoint of two quantification signals. If the signal-to-noise ratio was less than 1000, measurement uncertainties were significantly increased. These results were consistent with those of previous studies, and the recommended parameters settings would be suitable for a wide range of qNMR applications. The purity of each IS was assigned by combining values which were obtained using various combinations of ISs and solvents. For example, purity of dimethyl sulfone was assigned using two potassium hydrogen phthalate (KHP) CRMs, a 3,5-bis(trifluoromethyl) benzoic acid (BTFMBA) CRM, and a benzoic acid CRM. Additionally, purity was assigned using maleic acid, 1,4-bis(trimethylsilyl)benzene, and dimethyl terephthalate (DMTP), whose purities were determined using CRMs through 1H qNMR. All results agreed within the measurement uncertainty range. The properties of ISs including chemical shifts, and solubility in various solvents of internal standards are summarized in [61].
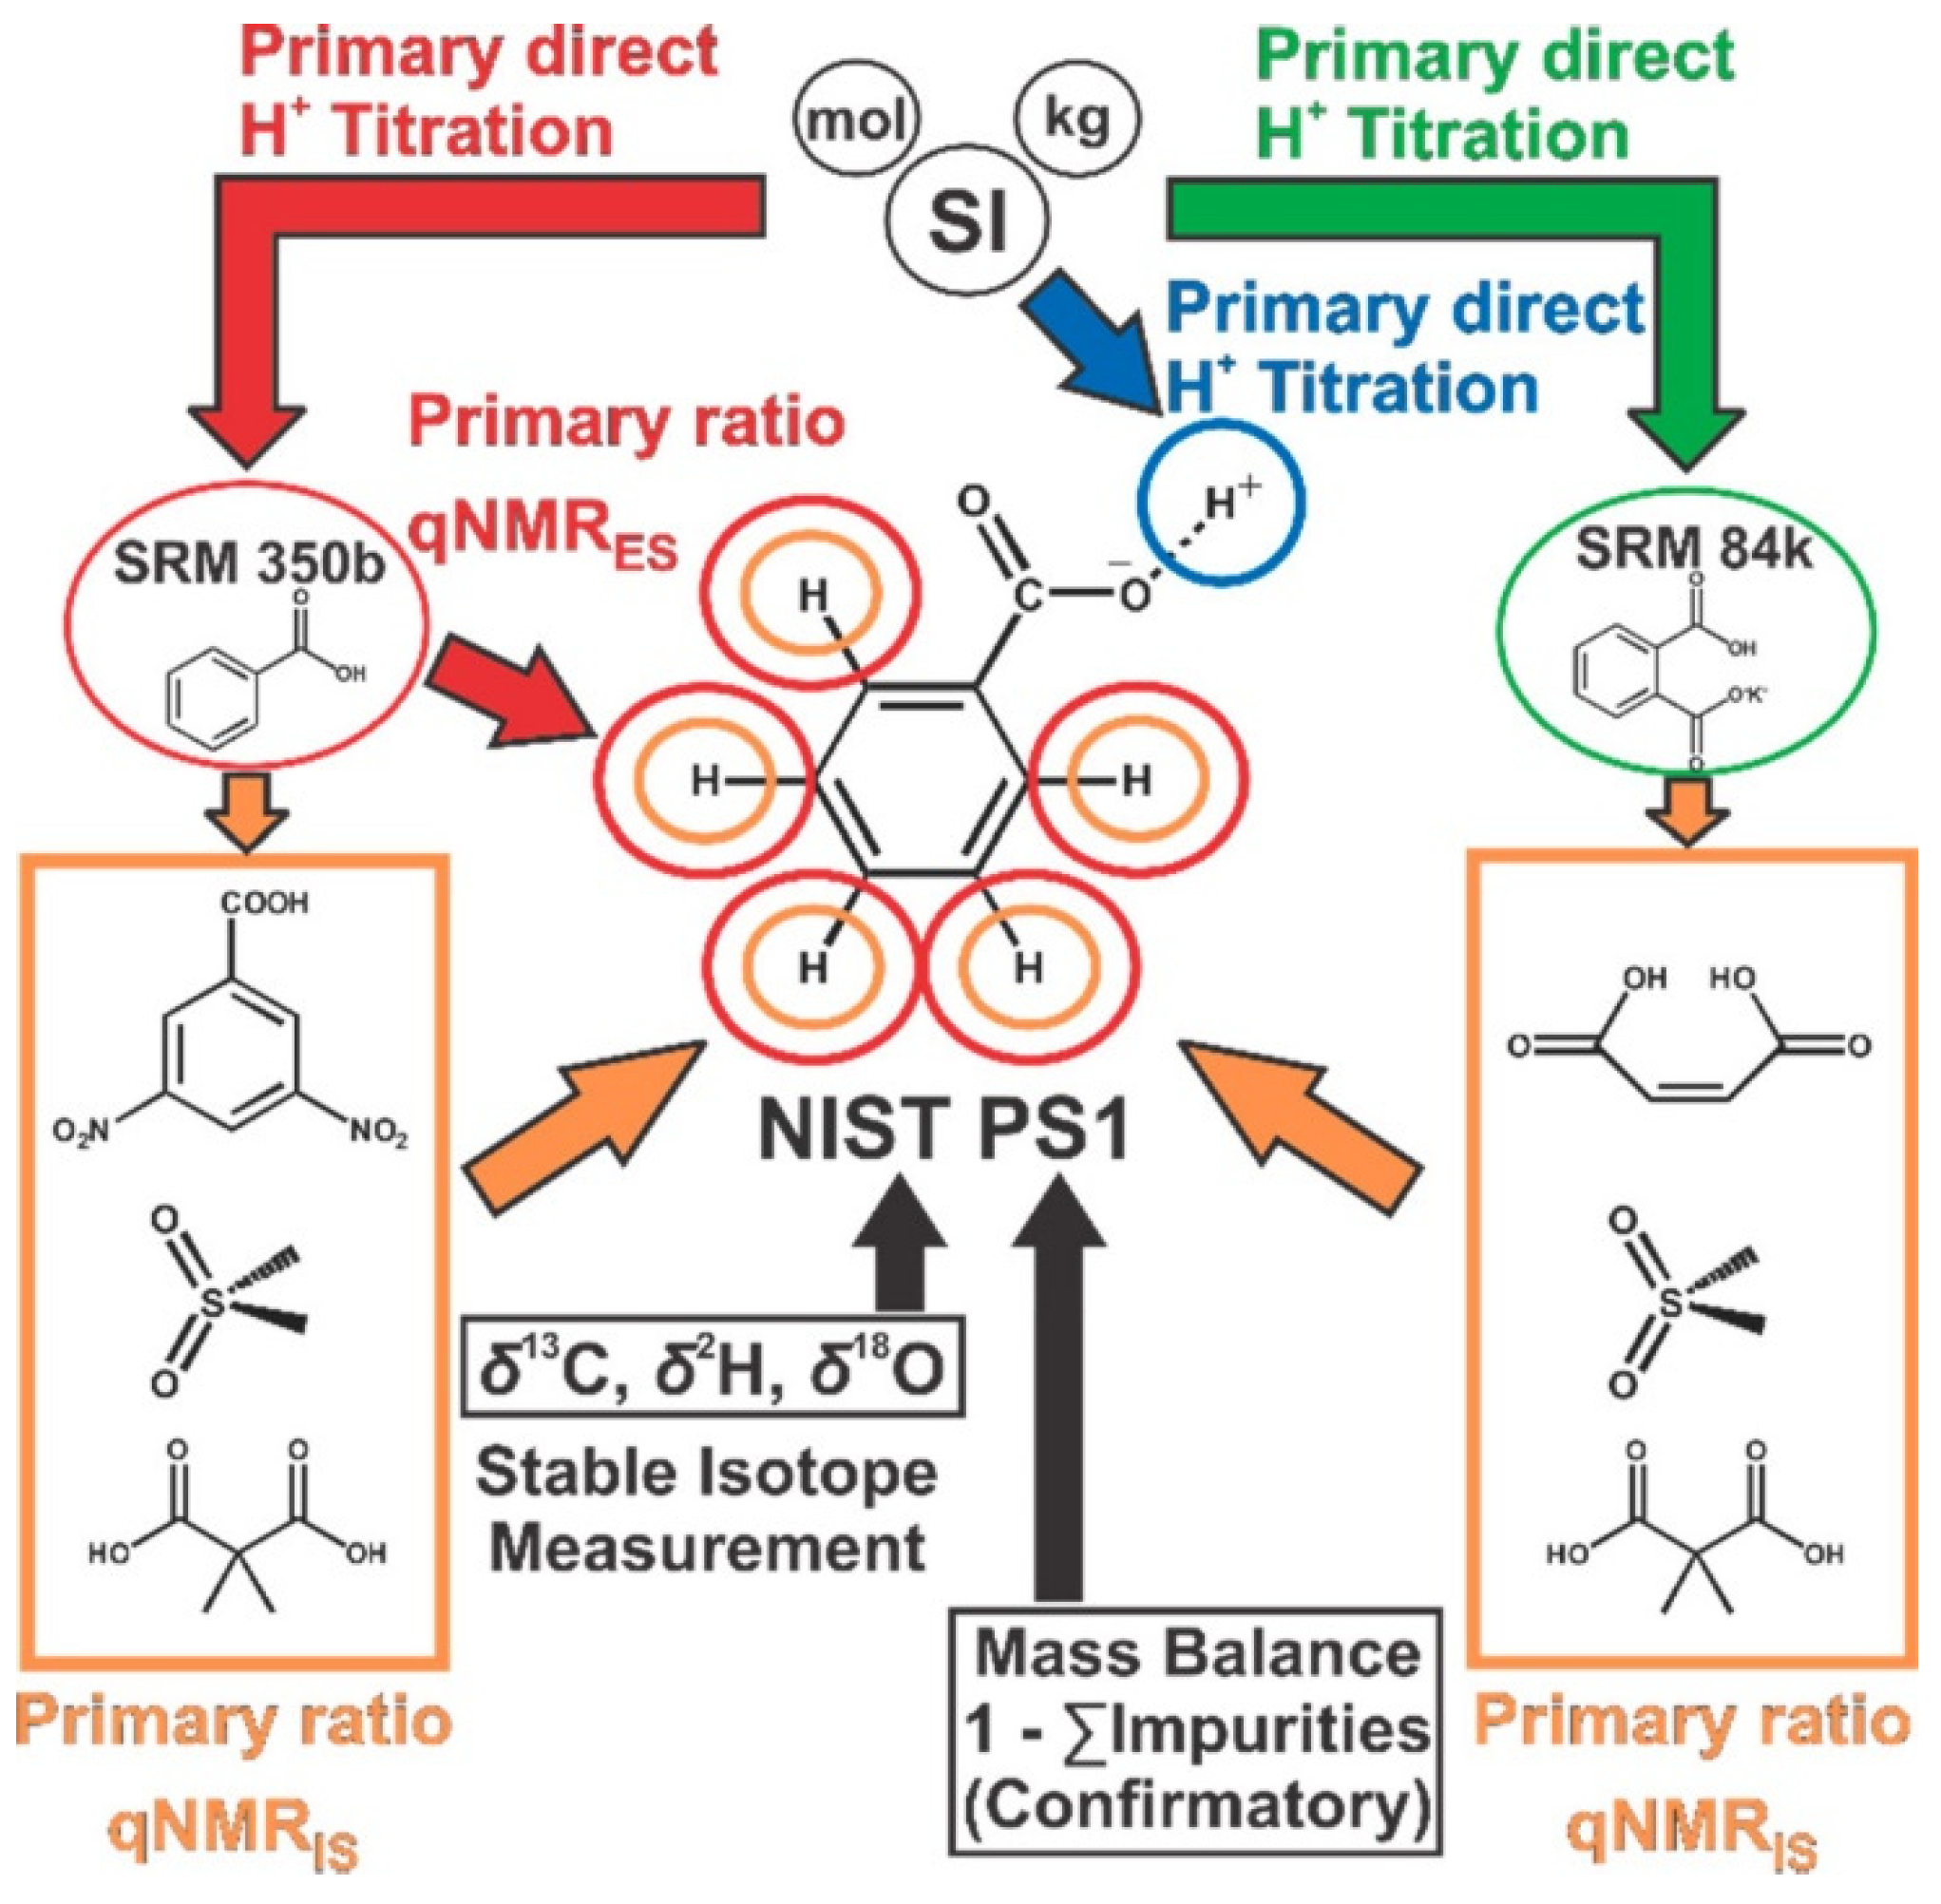
The use of an IS with a purity assigned by a higher-order method is critical to obtain SI-traceable purities. Benzoic acid developed as an organic acidimetric standard by National Institute of Standards and Technology (NIST, standard reference material 350b) were used for this purpose. However, the number of protons does not explicitly represent that of benzoic acid. Recently, NIST developed a benzoic acid CRM (PS1) with a purity that was certified by coulometry and 1H NMR as shown in Figure 3 [62]. The purities of 4 ISs for use in qNMR measurements were assessed using NIST SRM 350b benzoic acid and SRM 84k KHP, which had been previously calibrated by acidimetry. Then, purity was determined by combining the results obtained by 1H qNMR using the ISs, and the purity of PS1 was also assessed independently by coulometry. The result of purity assessment by coulometry and 1H NMR were combined to give a value of 999.92 mg/g (−0.00006 to +0.00004). CRM purity was also determined by the mass balance method to confirm the assigned value. Except for water and nonvolatile ash, no structurally related impurities were detected, and the purity of PS1 was determined as 999.9 mg/g (−999.83 to 999.97 mg/g with a 95% confidence interval) by the mass balance method. In addition, the PS1 purity determined by the external standard method with 350b was compared to the certified value to provide the metrological traceability of 350b.
IS reference materials for 31P qNMR and 19F NMR were also developed. In 31P qNMR analyses, water soluble phosphates were used as ISs. Weber et al. developed two certified reference materials, phosphonoacetic acid and triphenyl phosphate which are soluble in water and organic solvents, respectively [35]. The purity of phosphonoacetic acid was certified by 31P qNMR and 1H qNMR with ammonium dihydrogen phosphate and KHP as ISs, respectively. The two purity values agreed within the expanded uncertainties. As the sensitivity of 31P NMR is lower than that of 1H NMR, the former uncertainty was larger. The purity of triphenyl phosphate was certified using 1H qNMR with NIST benzoic acid as an IS. Signal overlap prohibited direct quantification, and dimethyl terephthalate was therefore employed as a secondary standard. Validation was performed by determining the purity of tris(2-chloroethyl) phosphate using two ISs independently.
For use in 19F qNMR, the National Metrology Institute of Japan (NMIJ) distributes two CRMs, BTFMBA and 1,4-bis(trimethylsilyl)-2,3,5,6-tetrafluorobenzene. Rigger et al. developed three ISs for 19F qNMR measurements traceable to NMIJ and NIST CRMs [63]. Similar to 31P qNMR, 1H and 19F qNMR were employed for the certification.
4.2. High Purity Reference Materials
Carbohydrate certified reference materials were developed using 1H qNMR [64]. As carbohydrates lack chromophores, only water and trace metal contents were measured by the mass balance approach. The purities determined by qNMR were lower than those obtained using the mass balance method for five out of six carbohydrates. Certified purities were determined from the weighted average of purities obtained by qNMR and the mass balance method.
NMIJ is currently establishing the traceability scheme of multi-component CRMs by adopting qNMR. For this purpose, the purities of more than 80 pesticides were assessed using a single CRM (1,4-dichloro benzene) [65]. To avoid peak overlap between the CRM and analytes, secondary standards calibrated using the CRM were used for purity determination. For method validation, linear regression analysis and comparison with DSC data were performed. Calibration services for purity assessment were provided using qNMR validated with DSC and chromatography by NMIJ.
The purities of pharmaceutical reference materials were determined using the PULCON method, and the obtained values were compared with those by the IS method [24]. The PULCON method obviates the need for IS selection and addition, allowing one to simplify and accelerate analysis without losing accuracy.
Josephs et al. assessed the purity of angiotensin I using qNMR [66]. As the sample contained peptide impurities whose peaks could overlapped with those of angiotensin I, the qNMR result was corrected using the data obtained by LC-high resolution mass spectrometry. This method was denoted as qNMR with a correction for structurally-related peptide impurities (PICqNMR) and afforded purity that well agreed with the values obtained using the mass balance method, peptide impurity corrected amino acid analysis, and peptide impurity corrected elemental analysis. Melanson et al. developed angiotensin II CRM using qNMR [67]. The purity of candidate materials was determined using the qNMR result corrected by amino acid analysis. Alternatively, the purity obtained by the mass balance method was corrected by subtracting the amount of trifluoroacetate counter ion measured using 19F-qNMR. The reference materials developed by qNMR are summarized in Table 1.
5. Conclusions
This review summarizes the reference methods used for qNMR purity assessment, the recently developed qNMR techniques, and the applications of qNMR to reference material production, revealing the great potential of qNMR as a primary ratio method for purity assessment. National metrology institutes and pharmacopeias around the world have adopted qNMR as a purity assessment method. To extend the applications of qNMR, novel techniques of overcoming the problems posed by peak overlapping have been developed, and universal standards have become commercially available. As a standalone method or in combination with the conventional mass balance method, qNMR is expected to find numerous uses in purity determination as a process of reference material development.
Author Contributions
Conceptualization, K.C. and S.A.; methodology, K.C., S.M. and Y.S.; formal analysis, K.C. and S.M.; investigation, K.C., S.M. and Y.S.; resources, S.A.; data curation, S.M. and Y.S.; writing—original draft preparation, K.C. and S.M.; writing—review and editing, S.A.; visualization, K.C. and S.M.; supervision, S.A.; project administration, K.C. and S.A.; funding acquisition, S.M. and S.A. All authors have read and agreed to the published version of the manuscript.
Funding
This research was supported by the Chung-Ang University Graduate Research Scholarship in 2019 and by the Korea Research Institute of Standards and Science, grant number 20011034.
Data Availability Statement
Data sharing is not applicable to this article.
Conflicts of Interest
The authors declare no conflict of interest.
References
- De Bièvre, P.; Dybkær, R.; Fajgelj, A.; Hibbert, D.B. Metrological traceability of measurement results in chemistry: Concepts and implementation (IUPAC Technical Report). Pure Appl. Chem. 2011, 83, 1873–1935. [Google Scholar] [CrossRef]
- Westwood, S.; Choteau, T.; Daireaux, A.; Josephs, R.D.; Wielgosz, R.I. Mass Balance Method for the SI Value Assignment of the Purity of Organic Compounds. Anal. Chem. 2013, 85, 3118–3126. [Google Scholar] [CrossRef] [PubMed]
- Pauli, G.F.; Chen, S.N.; Simmler, C.; Lankin, D.C.; Godecke, T.; Jaki, B.U.; Friesen, J.B.; McAlpine, J.B.; Napolitano, J.G. Importance of Purity Evaluation and the Potential of Quantitative 1H NMR as a Purity Assay. J. Med. Chem. 2014, 57, 9220–9231. [Google Scholar] [CrossRef] [PubMed] [Green Version]
- Crook, A.A.; Powers, R. Quantitative NMR-Based Biomedical Metabolomics: Current Status and Applications. Molecules 2020, 25, 5128. [Google Scholar] [CrossRef] [PubMed]
- Diehl, B.; Holzgrabe, U.; Monakhova, Y.; Schonberger, T.J. Quo Vadis qNMR? Pharm. Biomed. Anal. 2020, 177, 112847. [Google Scholar] [CrossRef]
- Lippa, K.A.; Duewer, D.L.; Nelson, M.A.; Davies, S.R.; Mackay, L.G. The role of the CCQM OAWG in providing SI traceable calibrators for organic chemical measurements. Accred. Qual. Assur. 2019, 24, 407–415. [Google Scholar] [CrossRef]
- Saito, T.; Yamazaki, T.; Numata, M. Development of nuclear magnetic resonance as a tool of quantitative analysis for organic materials. Metrologia 2019, 56, 054002. [Google Scholar] [CrossRef]
- Huang, T.; Li, H.; Zhang, W.; Numata, M.; Mackay, L.; Warren, J.; Jiao, H.; Westwood, S.; Song, D. Advanced approaches and applications of qNMR. Metrologia 2020, 57, 014004. [Google Scholar] [CrossRef]
- Pharmacopeia, T.U.S. The United States Pharmacopeia, USP 43/NF 38; The United States Pharmacopeial Convention: Rockville, MD, USA, 2020. [Google Scholar]
- Pharmacopoeia, E. European Pharmacopoeia, 10th ed.; EDQM: Strasbourg, France, 2020. [Google Scholar]
- Yamazaki, T.; Nakamura, S.; Saito, T. Optimization of sample preparation for accurate results in quantitative NMR spectroscopy. Metrologia 2017, 54, 224–228. [Google Scholar] [CrossRef]
- Saito, T.; Nakaie, S.; Kinoshita, M.; Ihara, T.; Kinugasa, S.; Nomura, A.; Maeda, T. Practical guide for accurate quantitative solution state NMR analysis. Metrologia 2004, 41, 213–218. [Google Scholar] [CrossRef]
- Monakhova, Y.B.; Diehl, B.W.K. Practical guide for selection of 1H qNMR acquisition and processing parameters confirmed by automated spectra evaluation. Magn. Reson. Chem. 2017, 55, 996–1005. [Google Scholar] [CrossRef] [PubMed]
- Li, C.; Bhavaraju, S.; Thibeault, M.P.; Melanson, J.; Blomgren, A.; Rundlof, T.; Kilpatrick, E.; Swann, C.J.; Rudd, T.; Aubin, Y.; et al. Survey of peptide quantification methods and comparison of their reproducibility: A case study using oxytocin. Pharm. Biomed. Anal. 2019, 166, 105–112. [Google Scholar] [CrossRef] [PubMed]
- Miura, T.; Sugimoto, N.; Bhavaraju, S.; Yamazaki, T.; Nishizaki, Y.; Liu, Y.; Bzhelyansky, A.; Amezcua, C.; Ray, J.; Zailer, E.; et al. Collaborative Study to Validate Purity Determination by 1H quantitative NMR Spectroscopy by Using Internal Calibration Methodology. Chem. Pharm. Bull. 2020, 68, 868–878. [Google Scholar] [CrossRef] [PubMed]
- qNMR Summit. Available online: http://www.qnmrsummit.com (accessed on 4 January 2021).
- ValidNMR. Available online: https://www.validnmr.com (accessed on 4 January 2021).
- Toman, B.; Nelson, M.A.; Lippa, K.A. Chemical purity using quantitative 1H-nuclear magnetic resonance: A hierarchical Bayesian approach for traceable calibrations. Metrologia 2016, 53, 1193–1203. [Google Scholar] [CrossRef] [PubMed]
- Cullen, C.H.; Ray, G.J.; Szabo, C.M. A comparison of quantitative nuclear magnetic resonance methods: Internal, external, and electronic referencing. Magn. Reson. Chem. 2013, 51, 705–713. [Google Scholar] [CrossRef] [PubMed]
- Henderson, T.J. Quantitative NMR Spectroscopy Using Coaxial Inserts Containing a Reference Standard: Purity Determinations for Military Nerve Agents. Anal. Chem. 2002, 74, 191–198. [Google Scholar] [CrossRef] [PubMed]
- Burton, I.W.; Quilliam, M.A.; Walter, J.A. Quantitative 1H NMR with External Standards: Use in Preparation of Calibration Solutions for Algal Toxins and Other Natural Products. Anal. Chem. 2005, 77, 3123–3131. [Google Scholar] [CrossRef]
- van der Klink, J.J. The NMR Reciprocity Theorem for Arbitrary Probe Geometry. J. Magn. Reson. 2001, 148, 147–154. [Google Scholar] [CrossRef]
- Wider, G.; Dreier, L.J. Measuring Protein Concentrations by NMR Spectroscopy. Am. Chem. Soc. 2006, 128, 2571–2576. [Google Scholar] [CrossRef]
- Monakhova, Y.B.; Kohl-Himmelseher, M.; Kuballa, T.; Lachenmeier, D.W. Determination of the purity of pharmaceutical reference materials by 1H NMR using the standardless PULCON methodology. J. Pharm. Biomed. Anal. 2014, 100, 381–386. [Google Scholar] [CrossRef]
- Frank, O.; Kreissl, J.K.; Daschner, A.; Hofmann, T.J. Accurate Determination of Reference Materials and Natural Isolates by Means of Quantitative 1H NMR Spectroscopy. Agric. Food Chem. 2014, 62, 2506–2515. [Google Scholar] [CrossRef] [PubMed]
- Benedito, L.E.C.; Maldaner, A.O.; Oliveira, A.L. An external reference 1H qNMR method (PULCON) for characterization of high purity cocaine seizures. Anal. Methods 2018, 10, 489–495. [Google Scholar] [CrossRef]
- Barantin, L.; Le Pape, A.; Akoka, S. A new method for absolute quantitation MRS metabolites. Magn. Reson. Med. 1997, 38, 179–182. [Google Scholar] [CrossRef] [PubMed]
- Akoka, S.; Barantin, L.; Trierweiler, M. Concentration Measurement by Proton NMR Using the ERETIC Method. Anal. Chem. 1999, 71, 2554–2557. [Google Scholar] [CrossRef] [PubMed]
- Silvestre, V.; Goupry, S.; Trierweiler, M.; Robins, R.; Akoka, S. Determination of Substrate and Product Concentrations in Lactic Acid Bacterial Fermentations by Proton NMR Using the ERETIC Method. Anal. Chem. 2001, 73, 1862–1868. [Google Scholar] [CrossRef] [PubMed]
- Mehr, K.; John, B.; Russell, D.; Avizonis, D. Electronic Referencing Techniques for Quantitative NMR: Pitfalls and How To Avoid Them Using Amplitude-Corrected Referencing through Signal Injection. Anal. Chem. 2008, 80, 8320–8323. [Google Scholar] [CrossRef] [PubMed]
- Farrant, R.D.; Hollerton, J.C.; Lynn, S.M.; Provera, S.; Sidebottom, P.J.; Upton, R.J. NMR quantification using an artificial signal. Magn. Reson. Chem. 2010, 48, 753–762. [Google Scholar] [CrossRef]
- Liu, X.; Kolpak, M.X.; Wu, J.; Leo, G.C. Automatic Analysis of Quantitative NMR Data of Pharmaceutical Compound Libraries. Anal. Chem. 2012, 84, 6914–6918. [Google Scholar] [CrossRef]
- Bernstein, M.A.; Sykora, S.; Peng, C.; Barba, A.; Cobas, C. Optimization and Automation of Quantitative NMR Data Extraction. Anal. Chem. 2013, 85, 5778–5786. [Google Scholar] [CrossRef]
- Monakhova, Y.B.; Diehl, B.W.K. Facilitating the performance of qNMR analysisusing automated quantification andresults verification. Magn. Reson. Chem. 2017, 55, 813–820. [Google Scholar] [CrossRef]
- Weber, M.; Hellriegel, C.; Rueck, A.; Wuethrich, J.; Jenks, P.; Obkircher, M. Method development in quantitative NMR towards metrologically traceable organic certified reference materials used as 31P qNMR standards. Anal. Bioanal. Chem. 2015, 407, 3115–3123. [Google Scholar] [CrossRef] [PubMed] [Green Version]
- Power, J.E.; Foroozandeh, M.; Adams, R.W.; Nilsson, M.; Coombes, S.R.; Phillips, A.R.; Morris, G.A. Increasing the quantitative bandwidth of NMR measurements. Chem. Commun. 2016, 52, 2916–2919. [Google Scholar] [CrossRef] [Green Version]
- Bhinderwala, F.; Evans, P.; Jones, K.; Laws, B.R.; Smith, T.G.; Morton, M.; Powers, R. Phosphorus NMR and Its Application to Metabolomics. Anal. Chem. 2020, 92, 9536–9545. [Google Scholar] [CrossRef] [PubMed]
- Mattes, A.O.; Russell, D.; Tishchenko, E.; Liu, Y.; Cichewicz, R.H.; Robinson, S.J. Application of 19F quantitative NMR to pharmaceutical analysis. Concepts Magn. Reson. Part A 2016, 45A, e21422. [Google Scholar] [CrossRef]
- Yamazaki, T.; Saito, T.; Ihara, T. A new approach for accurate quantitative determination using fluorine nuclear magnetic resonance spectroscopy. J. Chem. Metrol. 2017, 11, 16–22. [Google Scholar] [CrossRef]
- Brinkmann, A.; Raza, M.; Melanson, J.E. Metrologically traceable quantification of trifluoroacetic acid content in peptide reference materials by 19F solid-state NMR. Metrologia 2019, 56, 024002. [Google Scholar] [CrossRef] [Green Version]
- Jaeger, C.; Hemmann, F. EASY: A simple tool for simultaneously removing background, deadtime and acoustic ringing in quantitative NMR spectroscopy—Part I: Basic principle and applications. Solid State Nucl. Magn. Reson. 2014, 57–58, 22–28. [Google Scholar] [CrossRef] [PubMed]
- Jaeger, C.; Hemmann, F. “EASY: A simple tool for simultaneously removing background, deadtime and acoustic ringing in quantitative NMR spectroscopy. Part II: Improved ringing suppression, application to quadrupolar nuclei, cross polarisation and 2D NMR”. Solid State Nucl. Magn. Reson. 2014, 63–64, 13–19. [Google Scholar] [CrossRef]
- Godejohann, M.; Preiss, A.; Mügge, C. Quantitative Measurements in Continuous-Flow HPLC/NMR. Anal. Chem. 1998, 70, 590–595. [Google Scholar] [CrossRef]
- Saito, T.; Iwasawa, R.; Ihara, T.; Kinugasa, S.; Nomura, A.; Maeda, T. Evaluation of accuracy for the quantitative analysis using nuclear magnetic resonance as a detector of HPLC. Chromatography 2003, 24, 117–120. [Google Scholar]
- Huang, T.; Zhang, W.; Dai, X.; Li, N.; Huang, L.; Quan, C.; Li, H.; Yang, Y. High performance liquid chromatography-quantitative nuclear magnetic resonance (HPLC-qNMR) with a two-signal suppression method for purity assessment of avermectin B1a. Anal. Methods 2016, 8, 4482–4486. [Google Scholar] [CrossRef]
- Zhang, W.; Huang, T.; Li, H.; Dai, X.; Quan, C.; He, Y. Determination of avermectins by the internal standard recovery correction - high performance liquid chromatography - quantitative Nuclear Magnetic Resonance method. Talanta 2017, 172, 78–85. [Google Scholar] [CrossRef] [PubMed]
- Sun, X.; Zhang, W.; Huang, T.; He, Y.; Li, H.; Su, P.; Yang, Y. Purity determination of pyributicarb by internal standard correction–high-performance liquid chromatography–quantitative nuclear magnetic resonance. Anal. Bioanal. Chem. 2020, 412, 6983–6993. [Google Scholar] [CrossRef] [PubMed]
- Saito, N.; Kitamaki, Y.; Otsuka, S.; Yamanaka, N.; Nishizaki, Y.; Sugimoto, N.; Imura, H.; Ihara, T. Extended internal standard method for quantitative 1H NMR assisted by chromatography (EIC) for analyte overlapping impurity on 1H NMR spectra. Talanta 2018, 184, 484–490. [Google Scholar] [CrossRef]
- Heikkinen, S.; Toikka, M.M.; Karhunen, P.T.; Kilpeläinen, I.A. Quantitative 2D HSQC (Q-HSQC) via Suppression of J-Dependence of Polarization Transfer in NMR Spectroscopy: Application to Wood Lignin. J. Am. Chem. Soc. 2003, 125, 4362–4367. [Google Scholar] [CrossRef]
- Peterson, D.J.; Loening, N.M. QQ-HSQC: A quick, quantitative heteronuclear correlation experiment for NMR spectroscopy. Magn. Reson. Chem. 2007, 45, 937–941. [Google Scholar] [CrossRef]
- Koskela, H.; Kilpeläinen, I.; Heikkinen, S.J. Some aspects of quantitative 2D NMR. Magn. Reson. 2005, 174, 237–244. [Google Scholar] [CrossRef]
- Koskela, H.; Heikkilä, O.; Kilpeläinen, I.; Heikkinen, S.J. Quantitative two-dimensional HSQC experiment for high magnetic field NMR spectrometers. Magn. Reson. 2010, 202, 24–33. [Google Scholar] [CrossRef]
- Hu, K.; Westler, W.M.; Markley, J.L. Simultaneous Quantification and Identification of Individual Chemicals in Metabolite Mixtures by Two-Dimensional Extrapolated Time-Zero 1H−13C HSQC (HSQC0). J. Am. Chem. Soc. 2011, 133, 1662–1665. [Google Scholar] [CrossRef]
- Hu, K.; Ellinger, J.J.; Chylla, R.A.; Markley, J.L. Measurement of Absolute Concentrations of Individual Compounds in Metabolite Mixtures by Gradient-Selective Time-Zero 1H−13C HSQC with Two Concentration References and Fast Maximum Likelihood Reconstruction Analysis. Anal. Chem. 2011, 83, 9352–9360. [Google Scholar] [CrossRef] [Green Version]
- Rai, R.K.; Tripathi, P.; Sinha, N. Quantification of Metabolites from Two-Dimensional Nuclear Magnetic Resonance Spectroscopy: Application to Human Urine Samples. Anal. Chem. 2009, 81, 10232–10238. [Google Scholar] [CrossRef] [PubMed]
- Gronwald, W.; Klein, M.S.; Kaspar, H.; Fagerer, S.R.; Nurnberger, N.; Dettmer, K.; Bertsch, T.; Oefner, P.J. Urinary Metabolite Quantification Employing 2D NMR Spectroscopy. Anal. Chem. 2008, 80, 9288–9297. [Google Scholar] [CrossRef] [PubMed]
- Fardus-Reid, F.; Warren, J.; LeGresley, A. Validating heteronuclear 2D quantitative NMR. Anal. Methods 2016, 8, 2013–2019. [Google Scholar] [CrossRef] [Green Version]
- Dufour, G.; Evrard, B.; de Tullio, P. 2D-Cosy NMR Spectroscopy as a Quantitative Tool in Biological Matrix: Application to Cyclodextrins. AAPS J. 2015, 17, 1501–1510. [Google Scholar] [CrossRef] [PubMed] [Green Version]
- Weber, M.; Hellriegel, C.; Rück, A.; Sauermoser, R.; Wüthrich, J. Using high-performance quantitative NMR (HP-qNMR®) for certifying traceable and highly accurate purity values of organic reference materials with uncertainties <0.1 %. Accred. Qual. Assur. 2013, 18, 91–98. [Google Scholar] [CrossRef] [Green Version]
- Weber, M.; Hellriegel, C.; Rueck, A.; Wuethrich, J.; Jenks, P.J. Using high-performance 1H NMR (HP-qNMR®) for the certification of organic reference materials under accreditation guidelines—Describing the overall process with focus on homogeneity and stability assessment. Pharm. Biomed. Anal. 2014, 93, 102–110. [Google Scholar] [CrossRef] [PubMed] [Green Version]
- Westwood, S.; Yamazaki, T.; Huang, T.; Garrido, B.; Ün, I.; Zhang, W.; Martos, G.; Stoppacher, N.; Saito, T.; Wielgosz, R. Development and validation of a suite of standards for the purity assignment of organic compounds by quantitative NMR spectroscopy. Metrologia 2019, 56, 064001. [Google Scholar] [CrossRef]
- Nelson, M.A.; Waters, J.F.; Toman, B.; Lang, B.E.; Rück, A.; Breitruck, K.; Obkircher, M.; Windust, A.; Lippa, K.A. A New Realization of SI for Organic Chemical Measurement: NIST PS1 Primary Standard for Quantitative NMR (Benzoic Acid). Anal. Chem. 2018, 90, 10510–10517. [Google Scholar] [CrossRef] [PubMed]
- Rigger, R.; Rück, A.; Hellriegel, C.; Sauermoser, R.; Morf, F.; Breitruck, K.; Obkircher, M.J. Certified reference material for use in 1H, 31P, and 19F quantitative NMR, ensuring traceability to the International System of Units. AOAC Int. 2017, 100, 1365–1375. [Google Scholar] [CrossRef]
- Quan, C. Establishment of the purity values of carbohydrate certified reference materials using quantitative nuclear magnetic resonance and mass balance approach. Food Chem. 2014, 153, 378–386. [Google Scholar] [CrossRef]
- Saito, T.; Ihara, T.; Miura, T.; Yamada, Y.; Chiba, K. Efficient production of reference materials of hazardous organics using smart calibration by nuclear magnetic resonance. Accred. Qual. Assur. 2011, 16, 421. [Google Scholar] [CrossRef]
- Josephs, R.D.; Stoppacher, N.; Daireaux, A.; Choteau, T.; Lippa, K.A.; Phinney, K.W.; Westwood, S.; Wielgosz, R.I. State-of-the-art and trends for the SI traceable value assignment of the purity of peptides using the model compound angiotensin I. TrAC Trends Anal. Chem. 2018, 101, 108–119. [Google Scholar] [CrossRef]
- Melanson, J.E.; Thibeault, M.-P.; Stocks, B.B.; Leek, D.M.; McRae, G.; Meija, J. Purity assignment for peptide certified reference materials by combining qNMR and LC-MS/MS amino acid analysis results: Application to angiotensin II. Anal. Bioanal. Chem. 2018, 410, 6719–6731. [Google Scholar] [CrossRef] [PubMed]
- Yamazaki, T.; Takatsu, A. Quantitative NMR spectroscopy for accurate purity determination of amino acids, and uncertainty evaluation for different signals. Accred. Qual. Assur. 2014, 19, 275–282. [Google Scholar] [CrossRef]
- Le, P.M.; Ding, J.; Leek, D.M.; Mester, Z.; Robertson, G.; Windust, A.; Meija, J. Determination of chemical purity and isotopic composition of natural and carbon-13-labeled arsenobetaine bromide standards by quantitative 1H-NMR. Anal. Bioanal. Chem. 2016, 408, 7413–7421. [Google Scholar] [CrossRef]
- Wu, Y.; He, Y.; He, W.; Zhang, Y.; Lu, J.; Dai, Z.; Ma, S.; Lin, R.J. Application of quantitative 1H NMR for the calibration of protoberberine alkaloid reference standards. Pharm. Biomed. Anal. 2014, 90, 92–97. [Google Scholar] [CrossRef]
- Luan, J.; Feng, R.; Yu, C.; Wu, X.; Shen, W.; Chen, Y.; Di, B.; Su, M. Quantitative Assessment of the Absolute Purity of Thiopeptcin Reference Standard by 1H-NMR. Anal. Sci. 2018, 34, 1093–1098. [Google Scholar] [CrossRef] [Green Version]
- Liu, S.Y.; Hu, C.Q. A comparative uncertainty study of the calibration of macrolide antibiotic reference standards using quantitative nuclear magnetic resonance and mass balance methods. Anal. Chim. Acta 2007, 602, 114–121. [Google Scholar] [CrossRef]
- Saito, T.; Ihara, T.; Koike, M.; Kinugasa, S.; Fujimine, Y.; Nose, K.; Hirai, T. A new traceability scheme for the development of international system-traceable persistent organic pollutant reference materials by quantitative nuclear magnetic resonance. Accred. Qual. Assur. 2009, 14, 79–86. [Google Scholar] [CrossRef]
Figure 1.
Overlaid (A) 1H NMR and (B) 31P NMR spectra of triphenyl phosphate (blue), phosphonoacetic acid (red), and tris(2-chloroethyl) phosphate (black). Note that the DMSO solvent and residual water signals appear at 2.5 ppm and 3.3 ppm in the 1H NMR spectra (Adapted with permission from [35], Springer, 2015). NMR = nuclear magnetic resonance.

Figure 2.
Schematic of the chromatography (EIC) procedure for (a) standard solution and (b) sample solution (Adapted with permission from [48], Elsevier, 2018).
Figure 2.
Schematic of the chromatography (EIC) procedure for (a) standard solution and (b) sample solution (Adapted with permission from [48], Elsevier, 2018).

Figure 3.
International System of Units (SI) traceability chain of a benzoic acid CRM (NIST PS1). Adapted with permission from [62], American Chemical Society, 2018.
Figure 3.
International System of Units (SI) traceability chain of a benzoic acid CRM (NIST PS1). Adapted with permission from [62], American Chemical Society, 2018.


Table 1.
Summary of reference materials analyzed by quantitative nuclear magnetic resonance (qNMR).
| Analyte | NMR Method | Standard | Comparison Method | Reference |
|---|---|---|---|---|
| Amino acids | 1H qNMR | KHP | [68] | |
| Arsenobetaine bromide | 1H qNMR | Benzoic acid | [69] | |
| Carbohydrates | 1H qNMR | Benzoic acid | Mass balance | [64] |
| Benzoic acid | 1H qNMR | Benzoic acid, 2,2- dimethylpropanedioic acid, dimethyl sulfone, 3,5-dinitrobenzoic acid, maleic acid | Mass balance | [62] |
| Internal standards | 1H qNMR | Benzoic acid, dimethyl sulfone, KHP, maleic acid, nitrobenzoic acid | [59] | |
| Internal standards | 1H qNMR | Benzoic acid, 1,4-bis(trimethylsilyl)benzene, BTFMBA, dimethyl sulfone, DMTP, KHP, maleic acid, | [61] | |
| Internal standards | 1H qNMR 31P qNMR 19F qNMR | Ammonium dihydrogen phosphate, benzoic acid, BTFMBA, KHP | [63] | |
| Pesticides | 1H qNMR | 1,4-dichlorobenzne, benzoic acid, dimethyl sulfone, 3-(trimethylsilyl)-1-propanesulfonic acid-d6, and 1,4-bis(trimethylsilyl)benzene-d4 | Differential Scanning Calorimetry | [65] |
| Phosphonoacetic acid, triphenyl phosphate | 1H qNMR | Ammoinum dihydrogen phosphate, benzoic acid, dimethyl terephtalate | [35] | |
| Protoberberine alkaloid | 1H qNMR | KHP | Mass balance | [70] |
| Pharmaceuticals | 1H qNMR PULCON | 3,5-dinitrobenzoic acid | [24] | |
| Thiopeptcin | 1H qNMR | Sulfadoxine | Mass balance | [71] |
| Macrolide antibiotics | 1H qNMR | 1,4-Dinitrobenzene, antracene | Mass balance | [72] |
| Nerve agents | 31P qNMR | Triethyl phosphate | [20] | |
| Persistent organic pollutants | 1H qNMR | Benzoic acid, Dimethyl sulfone | Differential Scanning Calorimetry, GC/FID | [73] |
Publisher’s Note: MDPI stays neutral with regard to jurisdictional claims in published maps and institutional affiliations. |
© 2021 by the authors. Licensee MDPI, Basel, Switzerland. This article is an open access article distributed under the terms and conditions of the Creative Commons Attribution (CC BY) license (http://creativecommons.org/licenses/by/4.0/).
Share and Cite
MDPI and ACS Style
Choi, K.; Myoung, S.; Seo, Y.; Ahn, S. Quantitative NMR as a Versatile Tool for the Reference Material Preparation. Magnetochemistry 2021, 7, 15. https://0-doi-org.brum.beds.ac.uk/10.3390/magnetochemistry7010015
AMA Style
Choi K, Myoung S, Seo Y, Ahn S. Quantitative NMR as a Versatile Tool for the Reference Material Preparation. Magnetochemistry. 2021; 7(1):15. https://0-doi-org.brum.beds.ac.uk/10.3390/magnetochemistry7010015
Chicago/Turabian StyleChoi, Kihwan, Sangki Myoung, Yejin Seo, and Sangdoo Ahn. 2021. "Quantitative NMR as a Versatile Tool for the Reference Material Preparation" Magnetochemistry 7, no. 1: 15. https://0-doi-org.brum.beds.ac.uk/10.3390/magnetochemistry7010015
Note that from the first issue of 2016, this journal uses article numbers instead of page numbers. See further details here.