Article

Influence of Magnetic Field on the Electrodeposition and Capacitive Performances of MnO2

1
Department of Engineering ‘Enzo Ferrari’, University of Modena and Reggio Emilia, Via Vivarelli 10, 41125 Modena, Italy
2
NOVAC S.r.l., Via Vivarelli 10, 41125 Modena, Italy
3
Chemistry Department ‘Ugo Schiff’, University of Florence, Via della Lastruccia 3, 50019 Sesto Fiorentino, Italy
*
Author to whom correspondence should be addressed.
Submission received: 18 December 2020 / Revised: 18 January 2021 / Accepted: 21 January 2021 / Published: 25 January 2021

Abstract

:
This study focuses on the influence of an applied external magnetic field on the electrodeposition process and capacitive performances of MnO 2 , as pseudo-capacitive active material for supercapacitors electrodes. MnO 2 was electrochemically deposited on Si/Au substrates in the presence and in the absence of a 0.5 T magnet, and its capacitive performance was tested via electrochemical characterization. The samples obtained in the presence of the magnetic field show a positive influence on the deposition process: the increase in deposition efficiency leads to more compact and uniform MnO 2 coatings, with a decrease in capacitance values for the samples produced with the magnetic field.

1. Introduction

Supercapacitors exhibit middle characteristics between batteries and conventional capacitors in terms of power vs energy density, placing themselves in between the two previous solutions. Their specific energy is lower than batteries, but considerable power spikes can be obtained for shorter times (a few seconds), making them an ideal profile as load-leveling systems. In the category of pseudocapacitors (a variety of supercapacitors), also the charge–discharge mechanism is intermediate between the two considered main systems, although it is still not completely defined. In fact, faradaic processes are involved, but they consist of particular pseudo-Redox reactions: they are very fast, reversible, and do not involve any bulk-phase change in the electrodes material (usually implying adsorption, chemisorption, and intercalation side processes).
Possible choices for pseudocapacitor-active electrode materials are heteroatom-modified carbon [1,2,3], conducting polymers [4,5] and both noble [6,7,8] and transition-metal oxides (preferable over the noble ones for their lower price), with these latter being particularly appreciated for their rich redox behavior, and their chemical and thermal stability [9]. Between the transition metal, manganese oxide ( M n O 2 ) has been reported to exhibit high specific capacitance, allowing to realize systems which range from 130 to 700 F/g in mild aqueous electrolytes [10]. In addition, Manganese has also low toxicity and it is an abundant element on Earth’s surface. The mechanism underlying the M n O 2 charge–discharge process is not completely defined yet. Among the different proposed models, a common feature is the passage between the III and the IV oxidation states of Mn, resulting in electron transfer at Mn sites. Different kinds of interfacial reactions are regarded as balancing this charge transfer. Toupin M. summarized the two main proposed solutions [9]: the first assesses the intercalation of H + protons or alkali metal Cations C + (such as L i + ) in the bulk of the material.
MnO 2 + H + + e MnOOH
MnO 2 + C + + e MnOOC
The second mechanism involves cations of the electrolyte solution adsorbed on the surface of M n O 2 (for example, C + = Na + is a plausible option in case of a Na 2 SO 4 electrolyte):
MnO 2 ( surface ) + C + + e ( MnO 2 C + ) ( surface )
These theorized solutions are consistent with the experimental dependency of the capacitance performance on the microstructure and on the thickness of the MnO 2 layer. In case of α MnO 2 thin films, specific capacitances up to 1380 F/g have been reported, in contrast with top values of only 200 F/g for bulk α MnO 2 and only 10 F/g for β MnO 2 [11].
In the first place, this trend is explained by the larger tunnel sizes in the crystal structure of α MnO 2 with respect to β MnO 2 . This allows to enhance ion diffusion and provides additional adsorption sites to accept cations.
Results obtained by Pang S.C. [10] lead to the same direction, highlighting a greater capacitive performance of MnO 2 thin-films electrodes after prolonged voltammetric cycling. In fact, the system tends to an ideal behavior (a rectangular shape with a quick and almost-vertical achievement of the saturation current in charge and discharge runs) as the forward and backward scans are cycled, i.e., an elevated number of cycles is performed. This is due to the transformation of the microstructure, from densely packed (at the beginning), to irregular and rough particles (50 cycles), and finally a petal-like structure (100 cycles), resulting in a macroporous morphology.
With the microstructure being a focal point of interest, in the context of electrochemical methods, an established way to affect the plating microstructure is the application of an external magnetic field. As reported by M. A. Monzon [12] and V. Gatard [13] the Lorentz Force arising from a static applied magnetic field can provide additional convection by affecting charged species and so increase mass transport. Therefore, the investigation on the capacitance difference between samples deposited with and without the presence of a magnet can be used to indirectly reveal the effects of the magnetic field on the M n O 2 microstructure.
In this study, we report a series of experimental results highlighting the influence of the magnetic field on electrodeposition of pseudo-capacitors M n O 2 active material. The presence of the magnet, placed outside the electrochemical cell, but in direct contact with the lower (non-plated) side of the Si-substrate, introduces a degree of turbulence acting on the current of charged species in solution. This affects the local hydrodynamic conditions and consequently modifies nucleation and growth of the electrodeposited active material, leading to a more dense and low-defected coating.

2. Results

2.1. Analysis of Deposition Curves

The M n O 2 reduction on the Au layer was obtained via electrochemical reduction in a Teflon 2-electrodes cell, using platinum as the counter electrode (CE). From the external, a negative potential (with respect to the CE) was applied to the system using the potentiostat. This resulted in a shift from the equilibrium potential and polarization of the electrodes: the working electrode (connected to the substrate of our interest) acted as the cathode and the counter electrode as the anode. The Au WE experienced a cathodic (negative) current: electrons flow from the electrode to the solution. The deposition bath was 0.4 M KMnO 4 (potassium permanganate). The potassium permanganate dissociation produces K + cations and [ MnO 4 ] anions. Each of these anions reacts with three electrons coming from the cathode at the electrode’s surface, taking the manganese oxidation state from 7 + to 4 + . This process allows to deposit M n O 2 on the Au surface, and it is described by the following reaction:
( MnO 4 ) + 4 H + + 3 e MnO 2 + 2 H 2 O
Figure 1a,b displays the M n O 2 electrochemical deposition curves in three different setups: without the presence of the magnet (NoB), in the presence of a 0.5 T “face-up” magnet in contact with the underside of the working electrode substrate (BUp configuration, with the magnetic field force lines perpendicular to the electroactive surface and pointing up), and with the same 0.5 T magnet but “face-down” (BDown configuration, B force lines perpendicular to the electroactive surface and pointing down).
Figure 1a shows that the procedure is carried out in a potentiostatic regime, imposing a constant value of −1.0 V for 750 s, while Figure 1b represents the galvanostatic depositions, obtained with a set current value of −1.0 mA for 600 s. In both electrochemical regimes, the specimens interacting with the magnetic field show a better efficiency compared to the experiments without the magnet. In fact, in the time interval roughly between 3 and 50 s, the BUp and BDown samples evidence a higher current (in absolute value) for equal fixed potential (Figure 1a) or undergo lesser potential (in absolute value) to maintain the same imposed current (Figure 1b). After this considered period of time, B and non-B curves are very close to each other and no differences can be noticed (excluding a marginal distinction for the BUp sample in Figure 1b). The deposition carries on until the settled end time, with a gradual increase of current or decrease of potential, a common trend of all the three considered samples.

2.2. GCD Analysis: Potentiostatic Electrodeposition

Galvanostatic charge–discharge cycles are performed on different samples of manganese dioxide electrode obtained with a potentiostatic electrodeposition process. A comparison between charge–discharge curves obtained at a constant current density of 1 mA/cm 2 is shown in Figure 2.
At a first glance, it is clear that samples electrodeposited with the exposition to the magnetic field show a lower energy content and different internal resistance, if compared to the NoB samples obtained without the presence of the magnet, because the latter has a longer discharge time, while is difficult to tell about ohmic drop differences using only this graph. Using Equation (10), the specific capacitance C G C D is calculated for the three samples at different current densities, ranging from 0.5 to 2.16 mA/cm 2 . Results are reported in Figure 3.
At a minimum current density of 0.5 mA/cm 2 , which allows slower charge accumulation phenomena to occur, NoB, BDown, and BUp reach a maximum capacitance of 9.72 , 8.62 , and 8.43 mF/cm 2 , respectively, as expected by a pseudo-capacitive material. These values are higher if compared to a typical EDLC carbon-based supercapacitor with high specific surface (∼1000 m 2 /g); in fact, a theoretical, specific capacitance of around 30 uF/cm 2 arise from simple calculations for double layer capacitance [14]. To further compare the obtained data with the scientific literature results, specific capacitance is expressed referring to the active material mass electrodeposited for each electrode; in this work, considering GCD gravimetric capacitance, we obtain C g ( N o B ) = 155.58 F / g ; C g ( B U p ) = 134.90 F / g ; C g ( B D o w n ) = 139.45 F / g recorded at 0.5 mA/cm 2 (average areal loading amount is 134.76 g/cm 2 ). These values are in agreement with other scientific research, which reports gravimetric capacitance ranging from 130 to 700 F / g [10].
In this study, we observe a general decrease of the specific capacitance of the samples constructed with the application of the magnetic field, with a downward shift of the capacitance curves. The values of the capacitance of the samples BUp and BDown are very close to each other, with a slight increase in values of BDown.
The compatible trend of the data is observed during the calculation of the internal resistance, as shown in Figure 4. Furthermore, in this case, there is a general difference of the data between BUp, BDown, and NoB, with the latter showing the lower internal resistance of 177.03 Ω · cm 2 at a current density of 0.5 mA/cm 2 . A difference in data trends between BUp and BDown showed up for the internal resistance calculation, while BDown resembles the trend of NoB but with higher resistance values, BUp has the highest resistance at low current density which tends to decrease faster than other samples.

2.3. CV Analysis

Figure 5 shows the Cyclic Voltammetries of the samples deposited without the magnetic field (NoB), with the magnetic field in up configuration (BUp) and with the magnet flipped (BDown). Each of the three specimens is tested in the same potential window between −0.1 V and 0.6 V vs SSCE. The different scan rates used are 10, 20, 50, and 100 mV/s. The plots show a consistent rectangular shape at positive potential, with just a sign of a downwards current tail at the early reduction potentials for lower scan rates. This confirms the charge storage and release processes to be capacitive. As explained in the introduction, the current flowing in the system is proportional to the linear variation rate of the voltage (scan rate, ν ), leading to larger outlined areas for higher scan rates. The capacitive behaviour results finest at lower scan rates (10 mV/s), where the plots evidence a more stable current saturation value (both in cathodic and anodic scan) and a quicker achievement of that saturation (with the current then remaining almost constant for an extended potential interval).
Figure 6 displays histograms of the three systems calculated capacitance values, comparing the differences between the absence and the presence of the magnet at the same scan rate. A lower capacitance is recorded for the samples deposited with the magnetic field, without any significant difference between the two orientations of the magnet.

2.4. EIS Analysis

Nyquist comparison of the three main samples NoB, BDown, and BUp obtained with potentiostatic electrodeposition are shown in Figure 7. The comparison plot of the three main samples show a typical high-frequency semi-circle with a near-vertical evolution at medium-low frequency, resembling the Nyquist curve of a capacitor and so determining a good pseudo-capacitive behavior of the constructed electrodes. A small difference can be noticed between depressed semicircles at higher frequencies, highlighted in the inset of the Figure 7, with the diameter higher for NoB than for BUp and BDown. While in the medium frequency region the three curves seem to perfectly overlay, at lower frequency, a deviation occurs with the tendency of BDown and BUp to acquire a worse behavior, reaching higher real impedance values at the same frequency, describing an increase in dissipation factors with respect to charge accumulation phenomena. This denotes the system’s tendency to deviate from an ideal capacitive behavior of a perfectly vertical line in the Nyquist plot, due to the presence of kinetically limiting phenomena which can be correlated to the electrode microstructure. Small differences are shown in tail height, indicating pseudo-capacitance values very similar to each other.
To better understand the behavior of samples using impedance data, fitting was performed using the equivalent circuit illustrated in Figure 8 associated with different interfaces expected to exist for the three kind of samples.
In the equivalent circuit shown in Figure 8, there are three main sections to divide different contributions to the total impedance spectrum of the samples:
  • Section A: there is only a resistance called R e s r , which describes all the dissipation factors due to the resistances of the current collector/active material and active material/electrolyte interfaces and also of the ohmic drops introduced by electrical contacts.
  • Section B: a capacitor C s r f coupled with resistance R s r f used to describe the charge accumulation phenomena and resistance existing at the MnO 2 / Au interface.
  • Section C: a CPE (Q) coupled with resistance R c t used to describe the pseudo-capacitive behavior of the active material and the resistance associated with the active-material/electrolyte interface.
Our interpretation seems to be in agreement with the most recent studies [15], which have been focused on analyzing the features of manganese dioxide (and of the whole category of pseudo-capacitors) by means of impedance spectroscopy. Results of the fitting procedure according to the equivalent circuit proposed are reported in Table 1. In the same table, pseudocapacitance values are calculated from Sec C fitting results and reported; data are obtained using Equation (7).

2.5. Optical Microscope Analysis

The surface of samples obtained with a constant current electrodeposition was analyzed by acquiring micrographs with an optical microscope. Three main pictures obtained at 200× magnification are shown in Figure 9. While a thin manganese dioxide film is expected to cover the whole surface, as the following section will confirm with SEM/EDS microscope analysis, different groups and clusters cover the surface in different amounts and dimensions depending on the sample exposition to the magnetic field. An example of the image analysis performed is shown in Figure 9d, while in Table 2, the results of the image analysis performed are reported, indicating the average number of clusters per unit area and their areal coverage percentage (with respect to the acquisition dimension). There is a clear increase in the number of particles per unit area observed in the case of the samples electrodeposited in the presence of magnetic field (BDown and BUp) if compared to NoB. Furthermore, an increase in the cluster dimension is reported, as the surface coverage percentage shows, with little difference between BDown and NoB.
Additionally, optical aspects are noticed to be different between BDown, BUp, and NoB electrodeposited with a potentiostatic procedure, as shown in Figure 10. While BUp and BDown show a uniform distribution of the active material with a blue/violet circular deposit, the surface of the NoB electrode shows a clear difference in the optical aspect of the inner from the outer circle, with brown/red colors of the deposit, indicating a less regular deposition of the manganese dioxide.

2.6. SEM Analysis

To further investigate microstructures and morphologies of electrodeposited manganese oxide electrodes, SEM analysis was performed. Three new samples, one for each magnetic field setup, were obtained with a 750 s potentiostatic electrodeposition in two electrode configurations. A comparison between images representing three main samples is shown in Figure 11.
Based on the number and average dimension of clusters on the surface, the uniformity and compactness aspects of the BUp and BDown samples are higher than the NoB sample. The number of detached manganese dioxide plates was slightly different between the samples, and it was related to the nucleation grade during the first stage of electrodeposition. Since from the deposition curves in Figure 1 the three coatings show major differences mostly in the first tens of seconds of electrodeposition, it is possible that the difference in the nucleation rate exercises an influence on the adhesion performance of the coating; BUp and BDown, with higher nucleation rates, show fewer detachments than NoB in equivalent observation areas.
For this reason, and to highlight the difference existing between the three deposition methods during the first instants of growth of the coating, three new samples were constructed using a constant potential electrodeposition procedure with a two-electrode configuration for a duration of only 30 s; the deposition parameters and the mode of exposure to the magnetic field remained unchanged. The SEM images in comparison are shown in Figure 12.
In this case, the results clearly show an increase in number of clusters of manganese dioxide for the samples obtained with the magnetic field (BUp and BDown), resembling the results of Table 2, confirming an increase of nucleation rates for BUp and BDown.

3. Discussion

We investigated the influence of the magnet on the deposition and on the capacitive performance of an M n O 2 
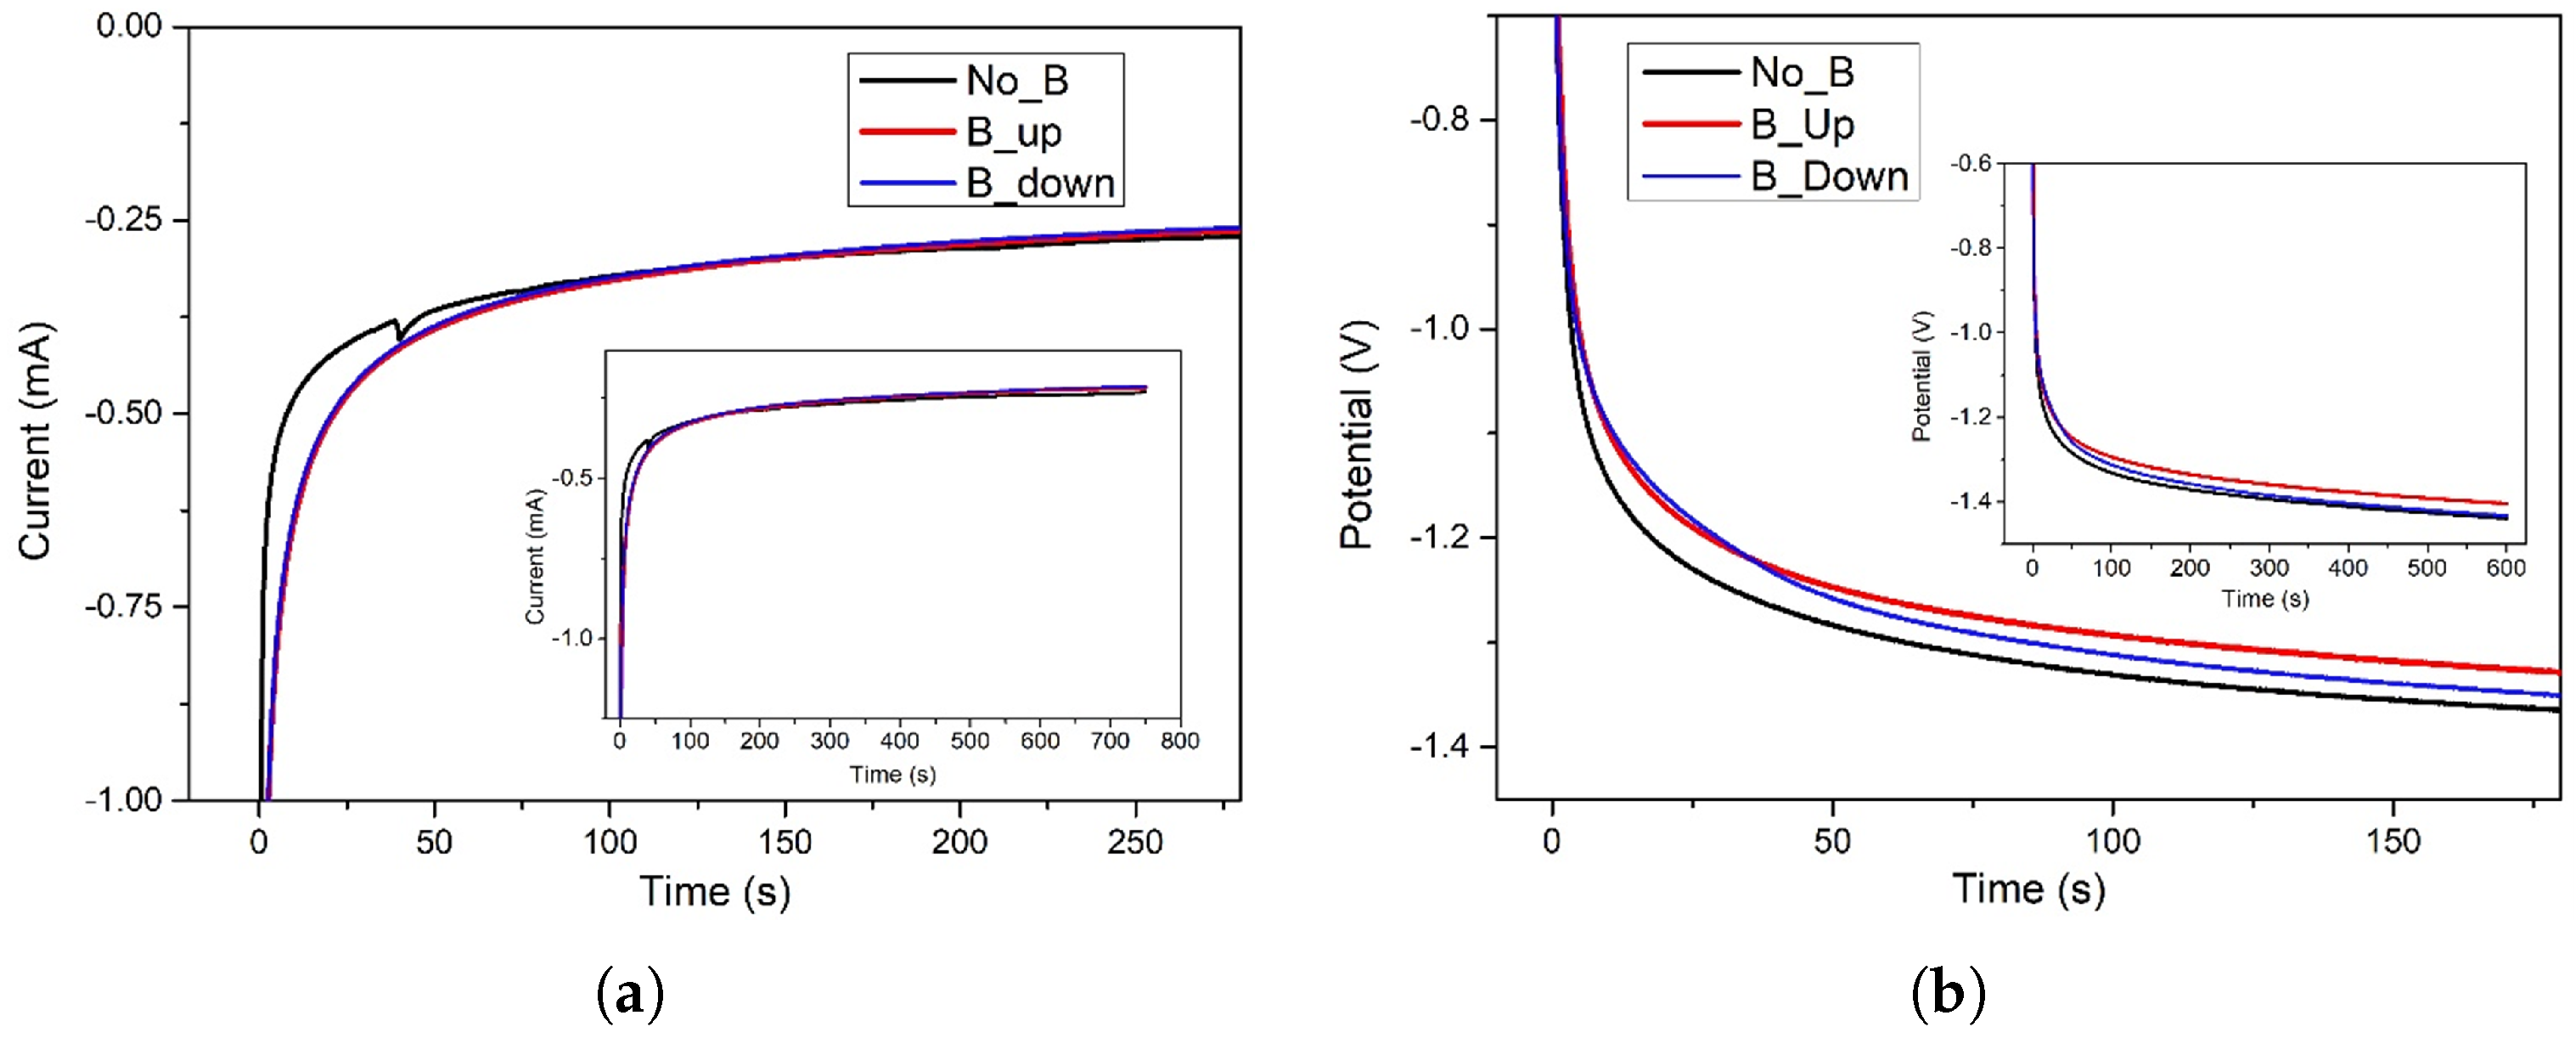
electrode for pseudocapacitors. Potentiostatic and galvanostatic deposition curves (Figure 1a,b) have been presented in Section 2.1 and show a significant difference in the first 50 seconds of the procedure. The presence of the magnetic field enhances the electrochemical efficiency, leading to higher currents for equal potentials or lower potentials with the same current. The reason behind this experimental effect lies in the convection provided by the Lorentz force in the electrochemical cell, which is addressed as the magnetohydrodynamic (MHD) effect in the literature [12]. Charged species in solution interact with the magnetic field and are so affected by an additional local perturbation, which results in a magnetic stirring action.
F L o r e n t z = q v × B = j × B
Equation (1) describes the Lorentz force acting on moving charged particles (or equivalently on a current), where B is the magnetic field, q is the charge of the species affected by F L o r e n t z , v is the velocity, and so j is the current density. Clearly, the Lorentz force is largest when j and B are perpendicular, and null when they are parallel. Even though the axis of the magnetic field is parallel to the assumed flow of ions in our experimental set-up, local interactions are still to be accounted for because of the bending of the field’s force lines.
This kind of local interaction manifests most where j is greater, for example at the edges of the electrode and around the surface morphological asperities or growing nuclei, and leads to a vortice-like motion of the charged species with different benefits with respect to a macroscopic large-scale convection made by mechanical agitation [12]. In fact, the most general trajectory for a charged particle in a uniform magnetic field is helical, with the axis of the helix parallel to the direction of the magnetic field [16]. This statement is the result of the general resolution of the differential Equation (2) (2nd equation of motion):
F = m a = q v × B m d v d t = q B 0 v × k
with the condition of the field B directed along the cartesian z-axis, as in our case (versor k ^ ). The resolution leads to trajectory parameters of Equation (3):
x = R c o s ( Ω t ) y = R s i n ( Ω t ) z = V t
V = v z is a constant (since d v z d t = 0 , then the component of velocity parallel to the magnetic field is constant), R is an arbitrary constant, and Ω is called cyclotron frequency (it’s independent of the velocity of the charged particle). Because of this helical motion, MHD causes a mass transport increase through the electrolyte by reducing the diffusion layer.
Secondly, these magnetic effects ensure a lower impact of H 2 bubbles at the cathode surface, which are the product of hydrogen reduction parasite reaction and tend to occlude the electrode surface, deforming local current density [12]. MHD opposes this unfavorable condition, both leading to more uniform current densities at the electrode’s interface (which traduces to smaller H 2 bubbles) and physically sweeping those bubbles away, clearing the electroactive surface. In general, this is beneficial during electrodeposition, as the M n O 2 film grows tidier and less porous. The overall efficiency increase (obtained by the presence of the magnet) is mostly evident in the early stages of the process, when the diffusion effects are still small (Figure 1a,b). In fact, after about 50 s, the Nernst diffusion layer extends and the nature of the substrate surface changes radically, switching from flat and very conductive metallic Au to more disordered M n O 2 . These latter effects increase their influence more and more as the process continues, hiding the benefits of the MHD.
Indeed, the M n O 2 deposition process can be reliably fitted by the Cottrell diffusion model, described by Equation (4):
i ( t ) = n F A C 0 D 0 π t
In order to prove this, the cathodic current obtained in the potentiostatic regime (Figure 1a) can be plotted vs 1 t , and a linear trend is obtained (Figure 13). The i-t behavior under Cottrell conditions is a marker of diffusive control over electrolysis [17].
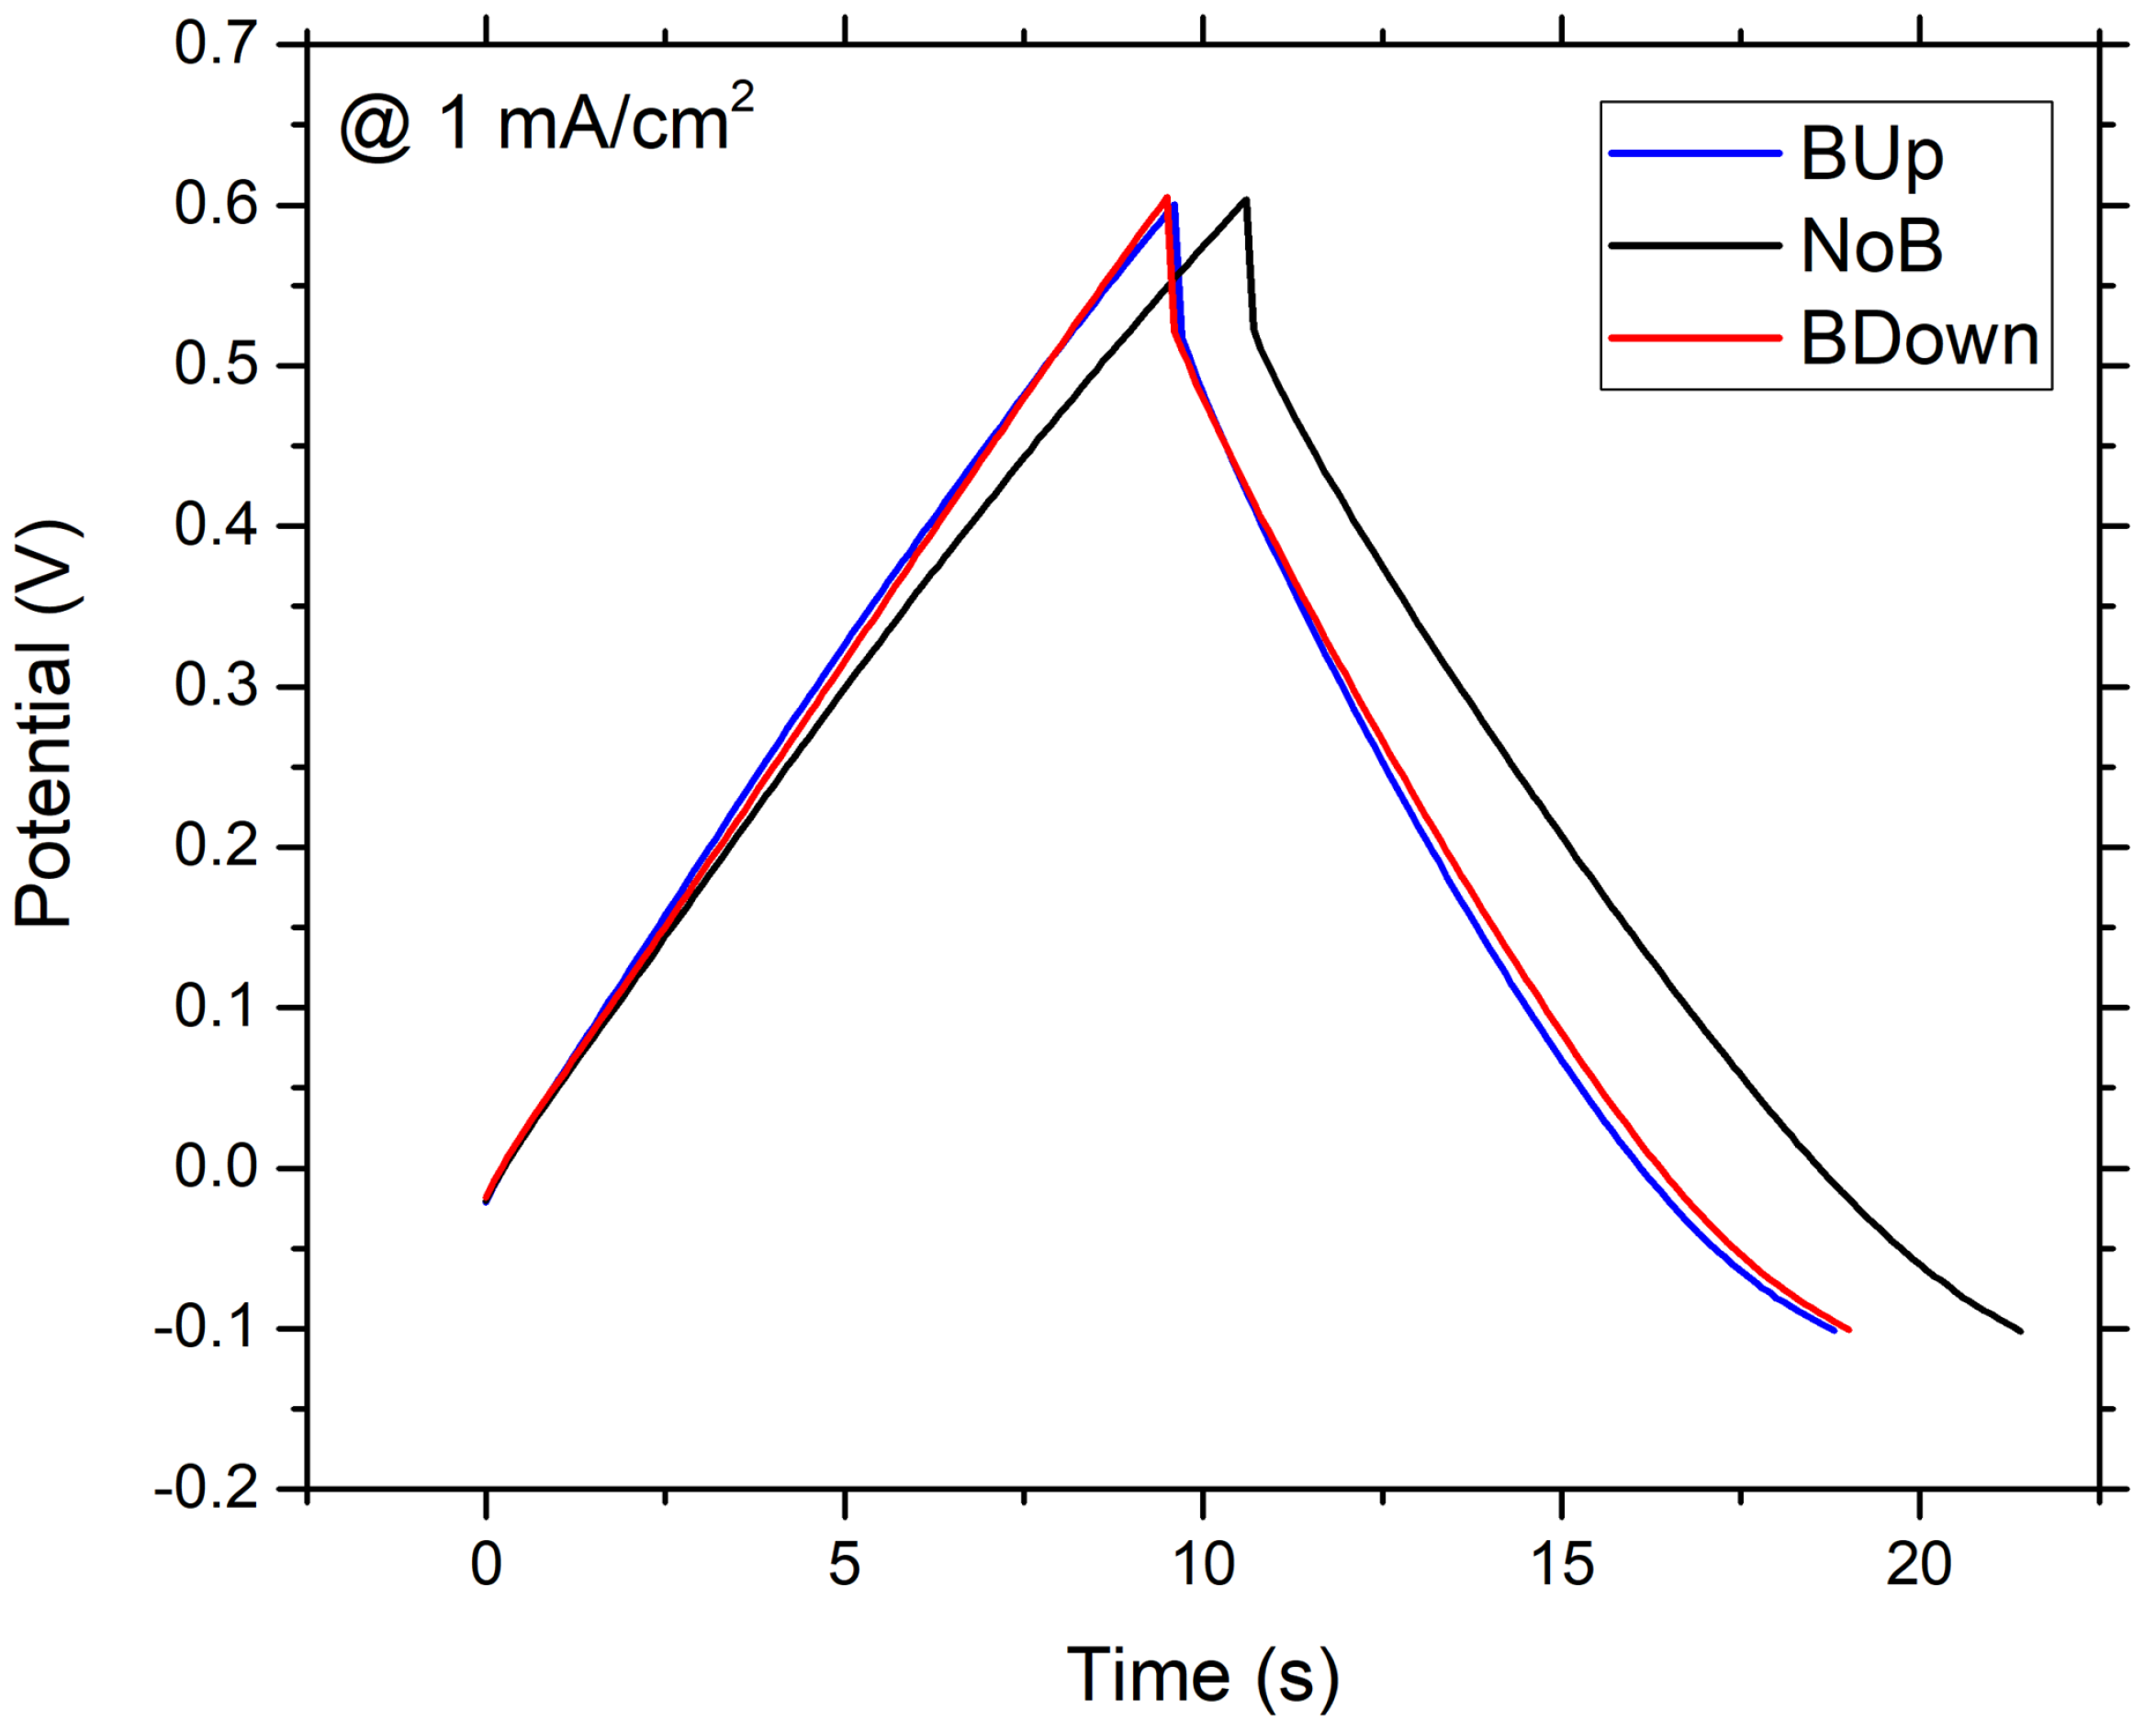
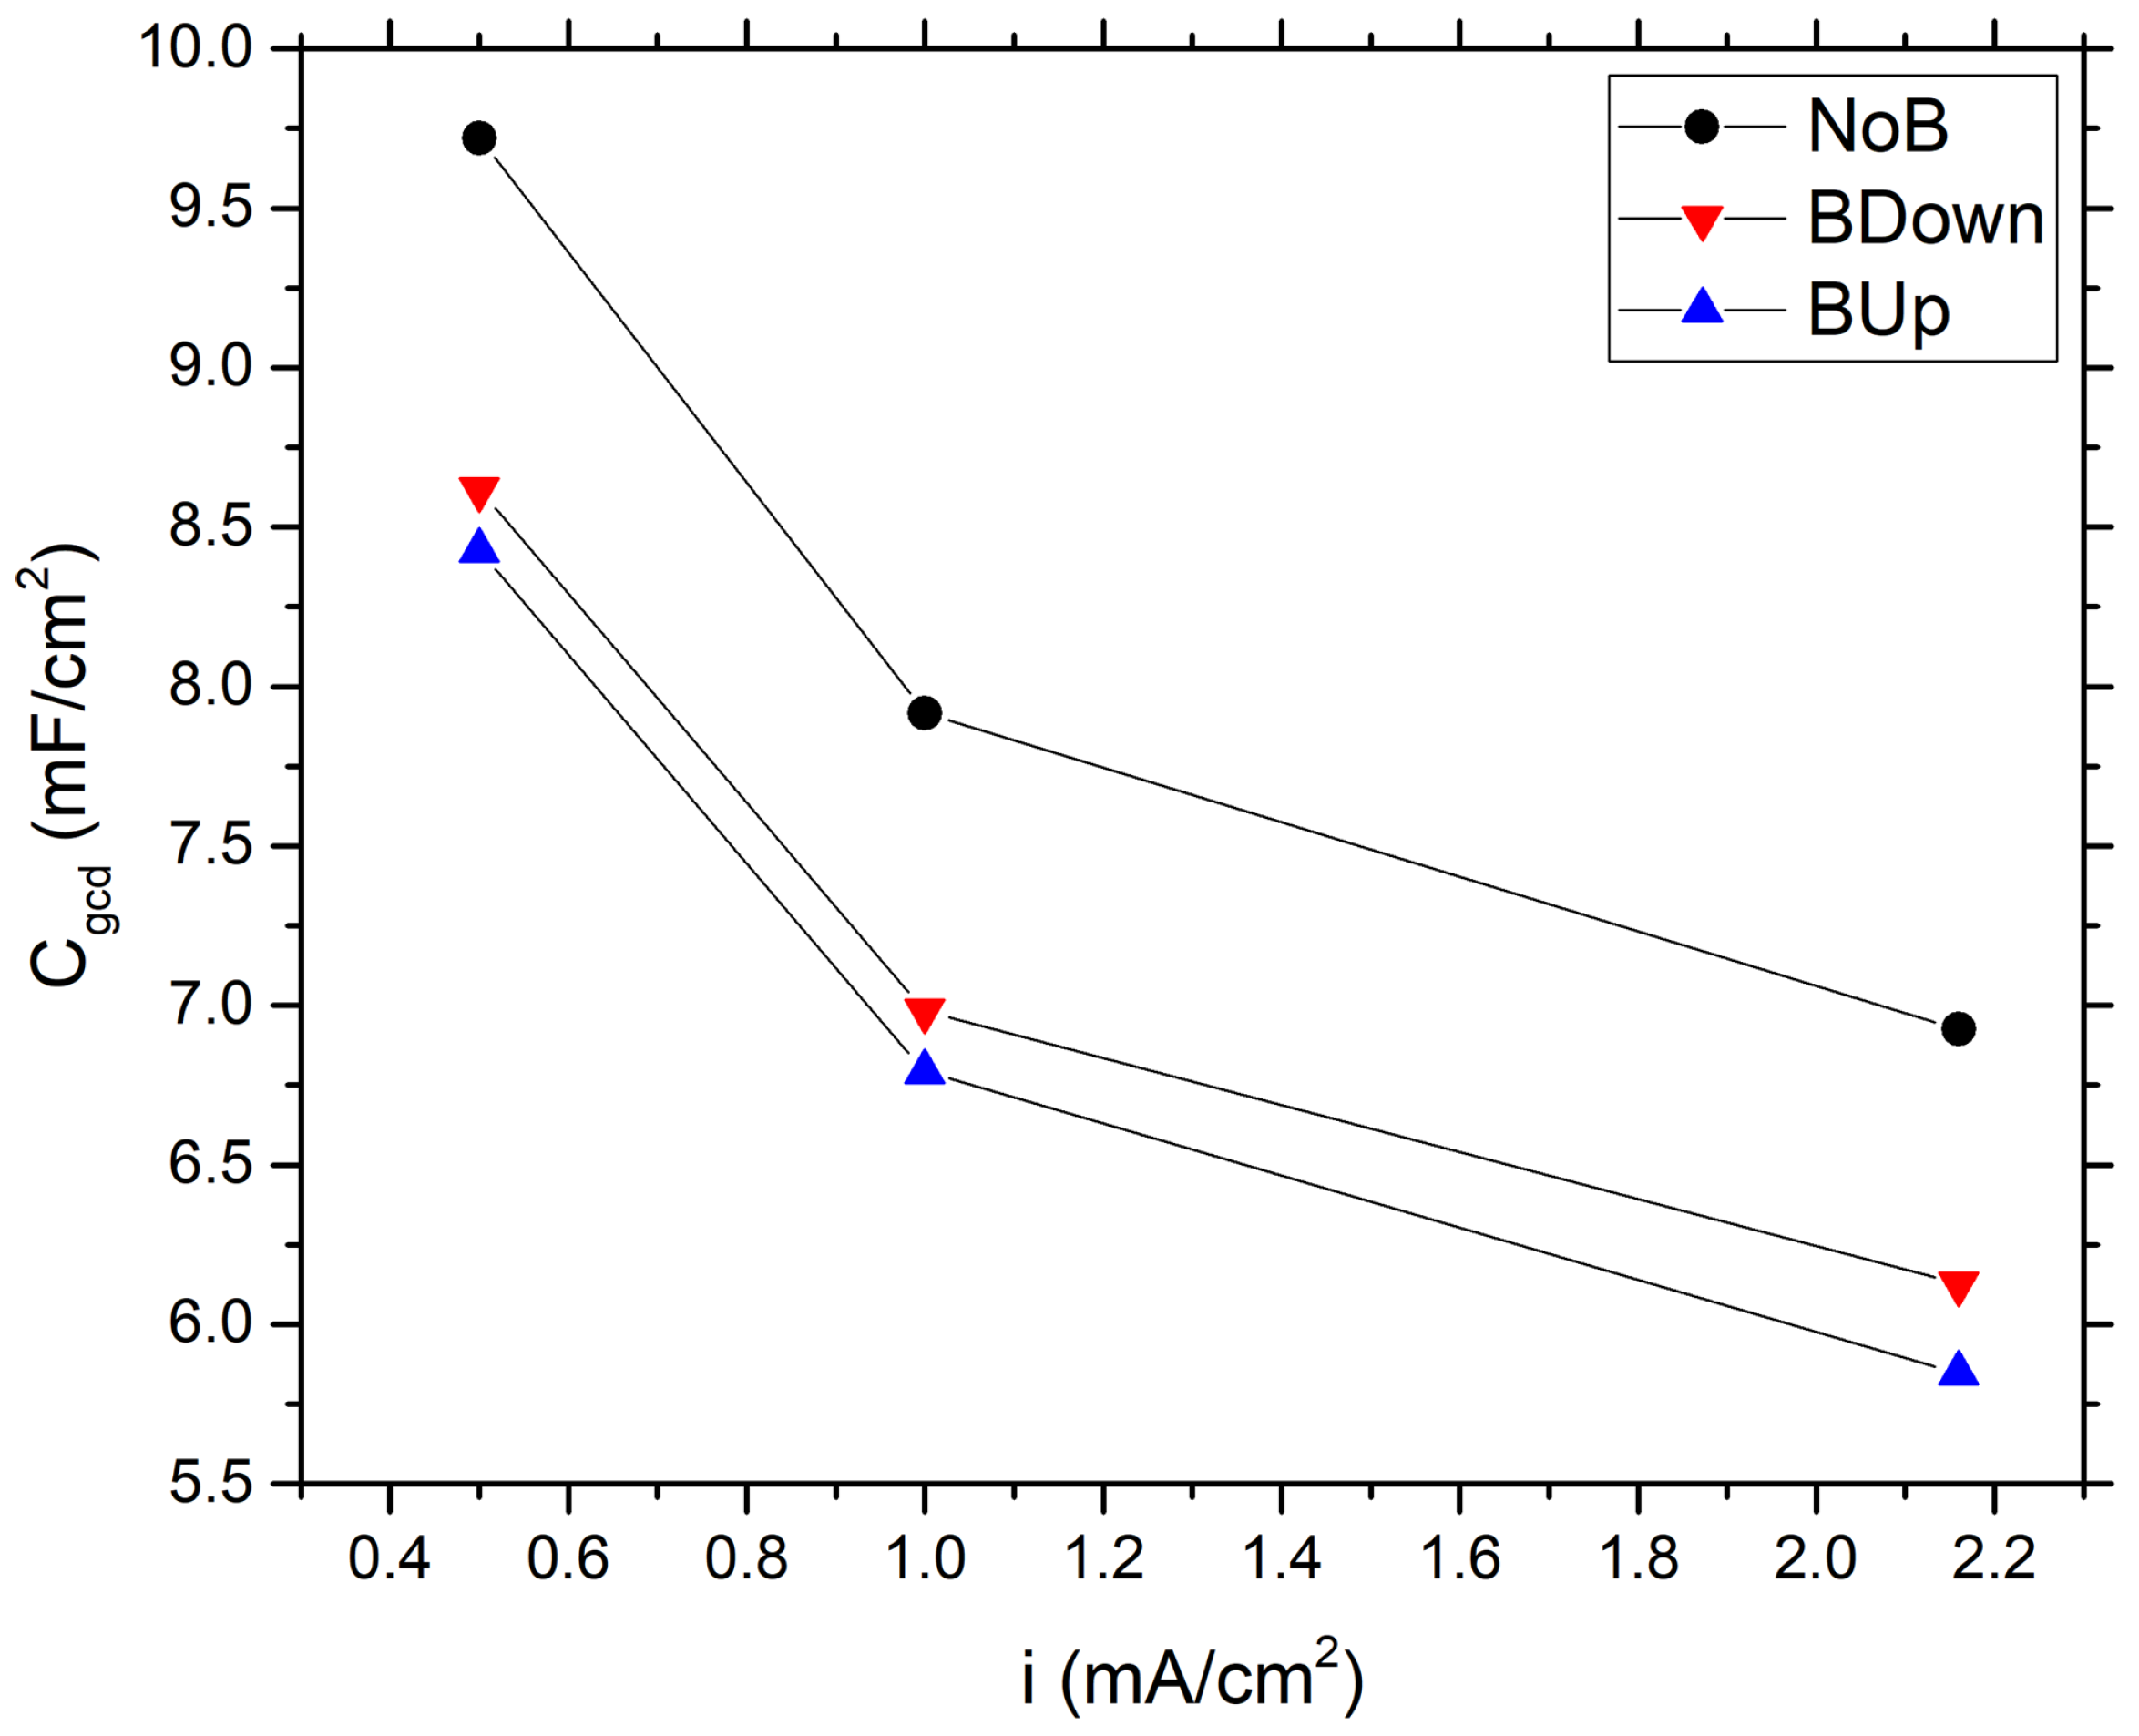
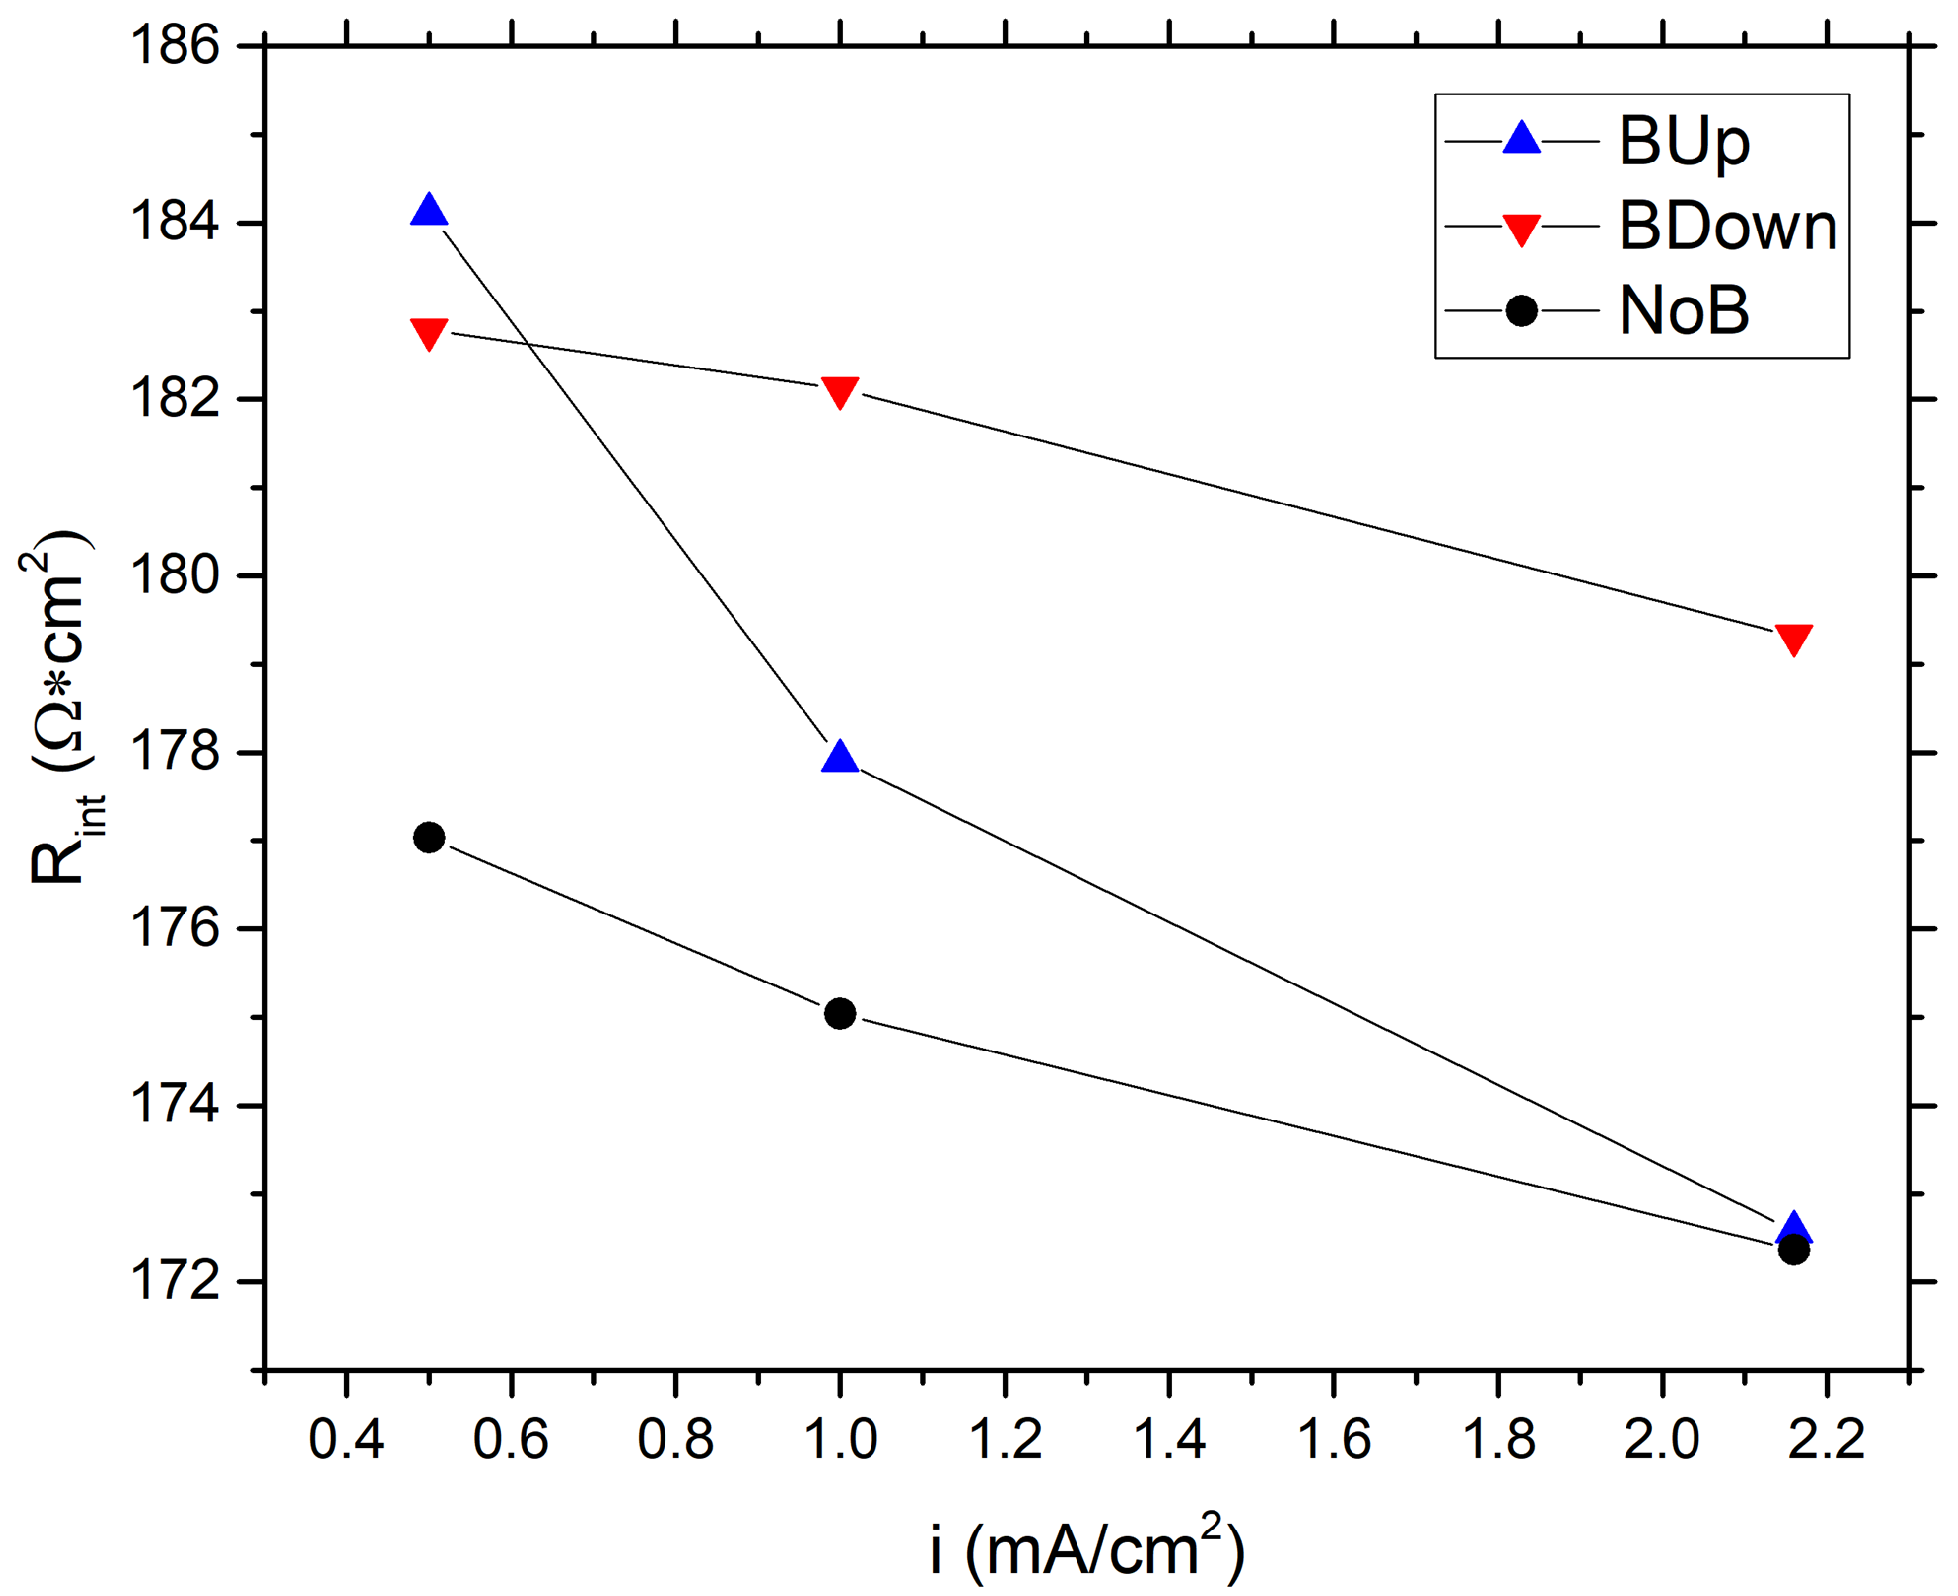
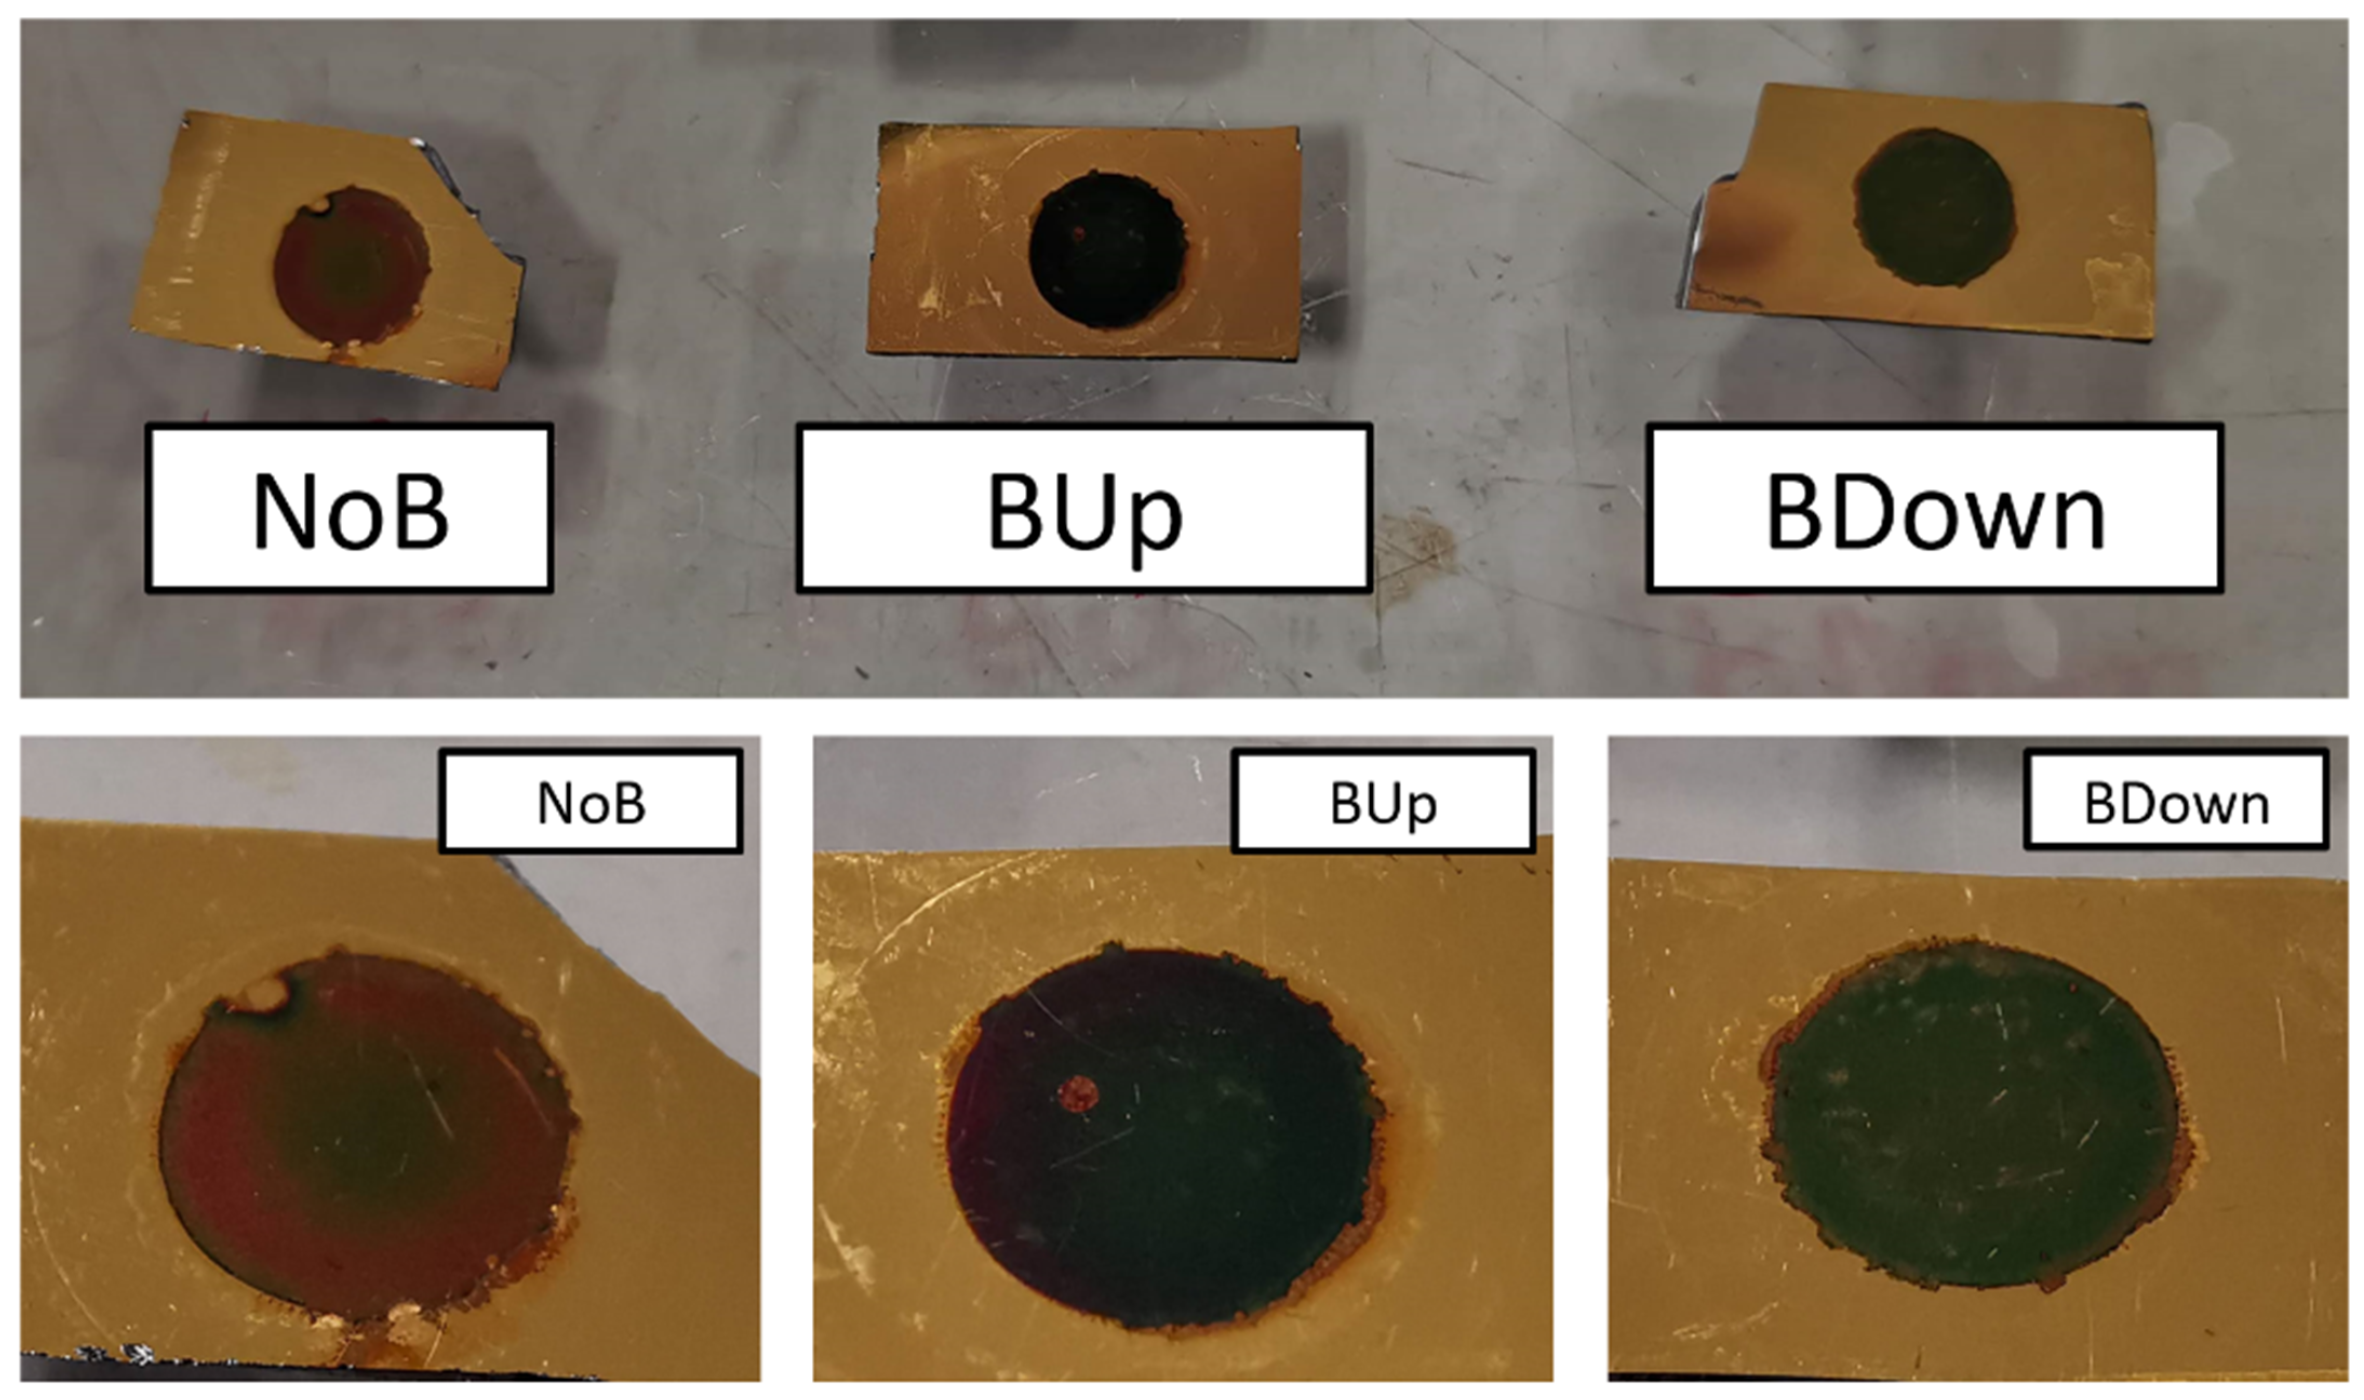
The obtained characterization results are consistent with the model proposed for the explanation of the manganese dioxide deposition. GCD analysis shows a net fade in specific capacitance for the samples BDown and BUp, which are the ones exposed to the magnetic field in the North and South direction, respectively. This decrease in capacitance is due to the microstructure that becomes more compact and uniform in presence of the magnet. Furthermore, the internal resistance of the devices follow the expected trend, with higher values for BDown and BUp and the lowest internal resistance of the NoB sample; besides, a less roughness and lower average thickness could be correlated to this result for NoB.
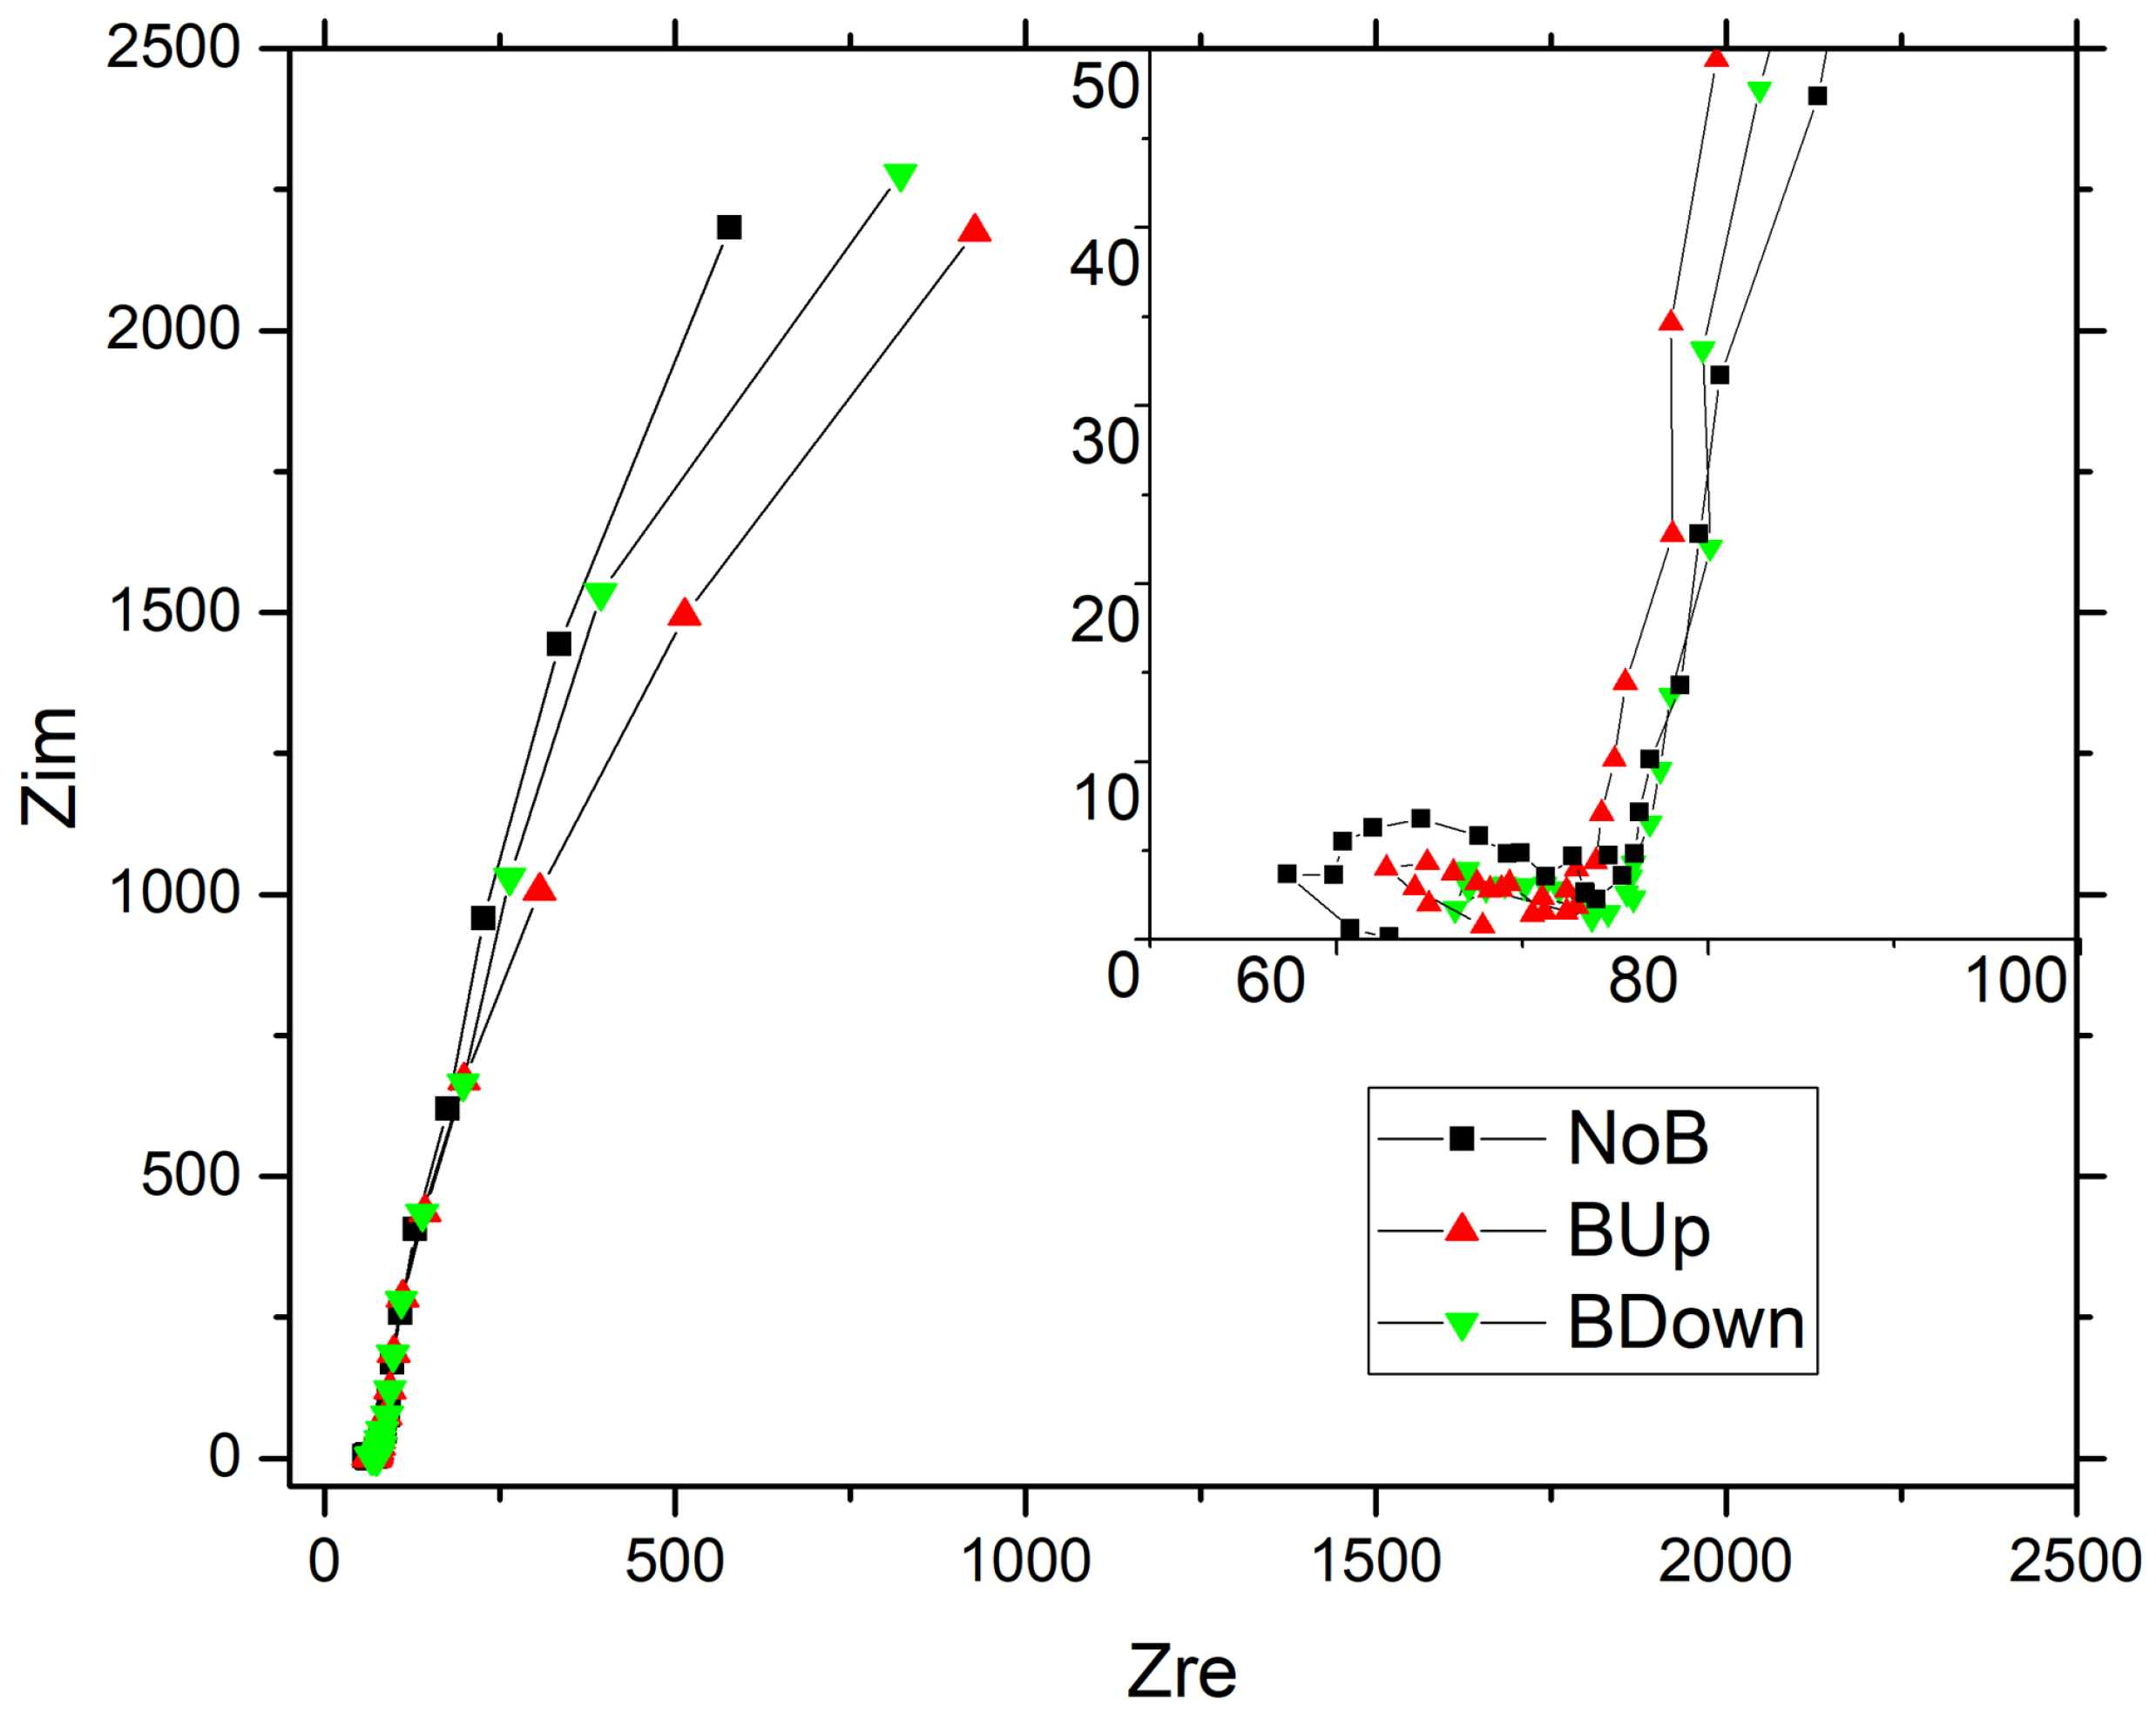
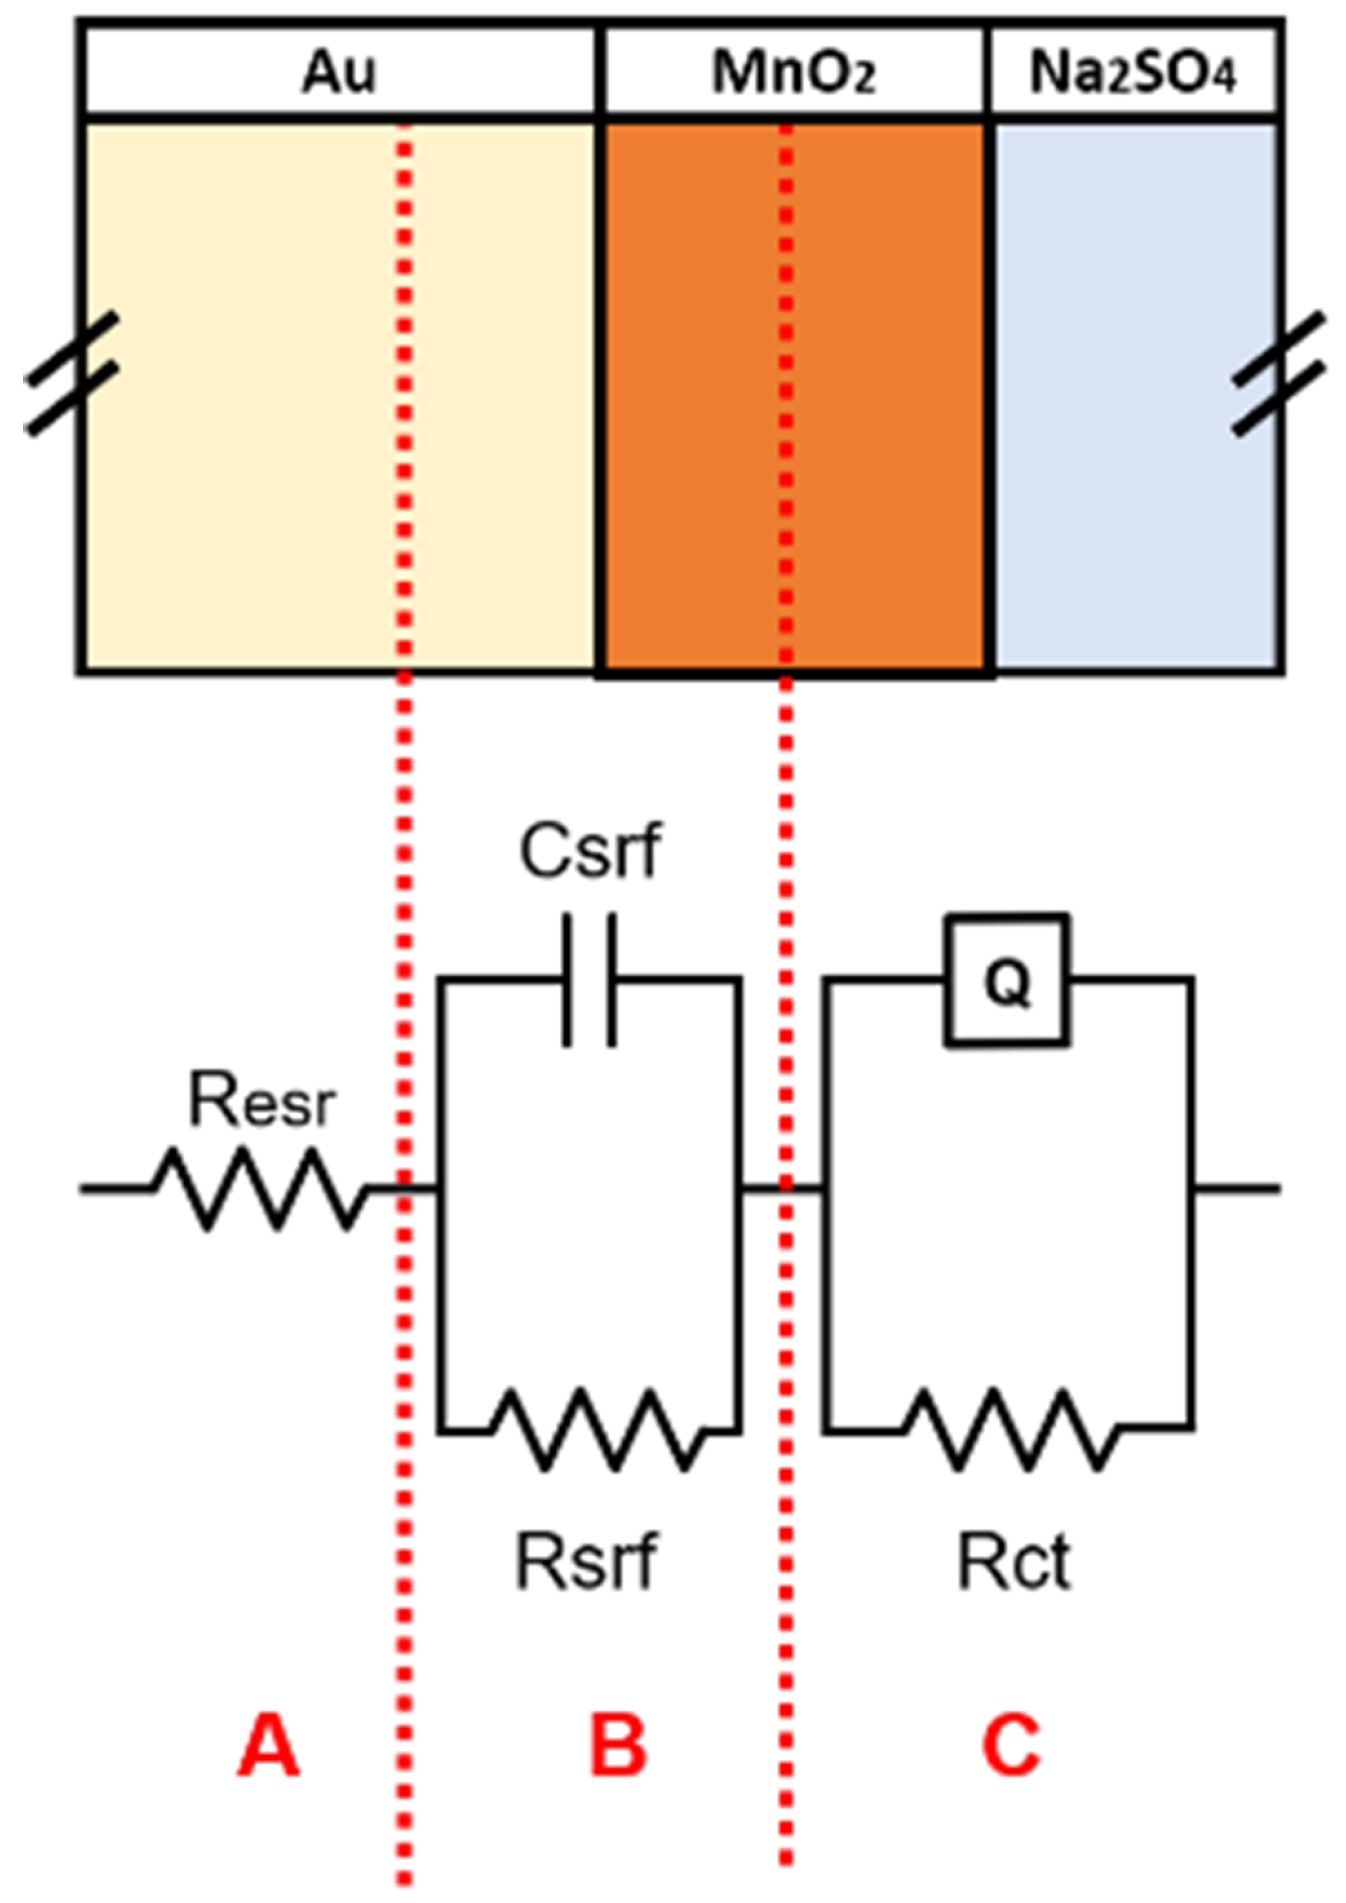
Electrochemical Impedance Spectroscopy characterization interestingly shows small differences in two separated regions; at a high frequency region, a depressed semicircle appears, associated with the interface between the active material and the substrate. NoB shows the highest R s r f (Table 1), while BDown and BUp show lower values closer to each other, thus indicating a possible difference in packing density (higher for samples constructed with the magnet) but also in nucleation and growing rates. The latter, in fact, are influenced by the presence of the magnetic field during the first stages of deposition and growth (first seconds of electrodeposition), and in this study, it is demonstrated a large influence of the magnet on the deposition curves. At low frequency the pseudo-capacitive response dominates the Nyquist plot, again no substantial difference exists between BDown and BUp, which present similar pseudo-capacitance and charge-transfer resistance, the latter indicating similar microstructures. The highest pseudocapacitance and charge transfer resistance is recorded for NoB(∼9 mF).
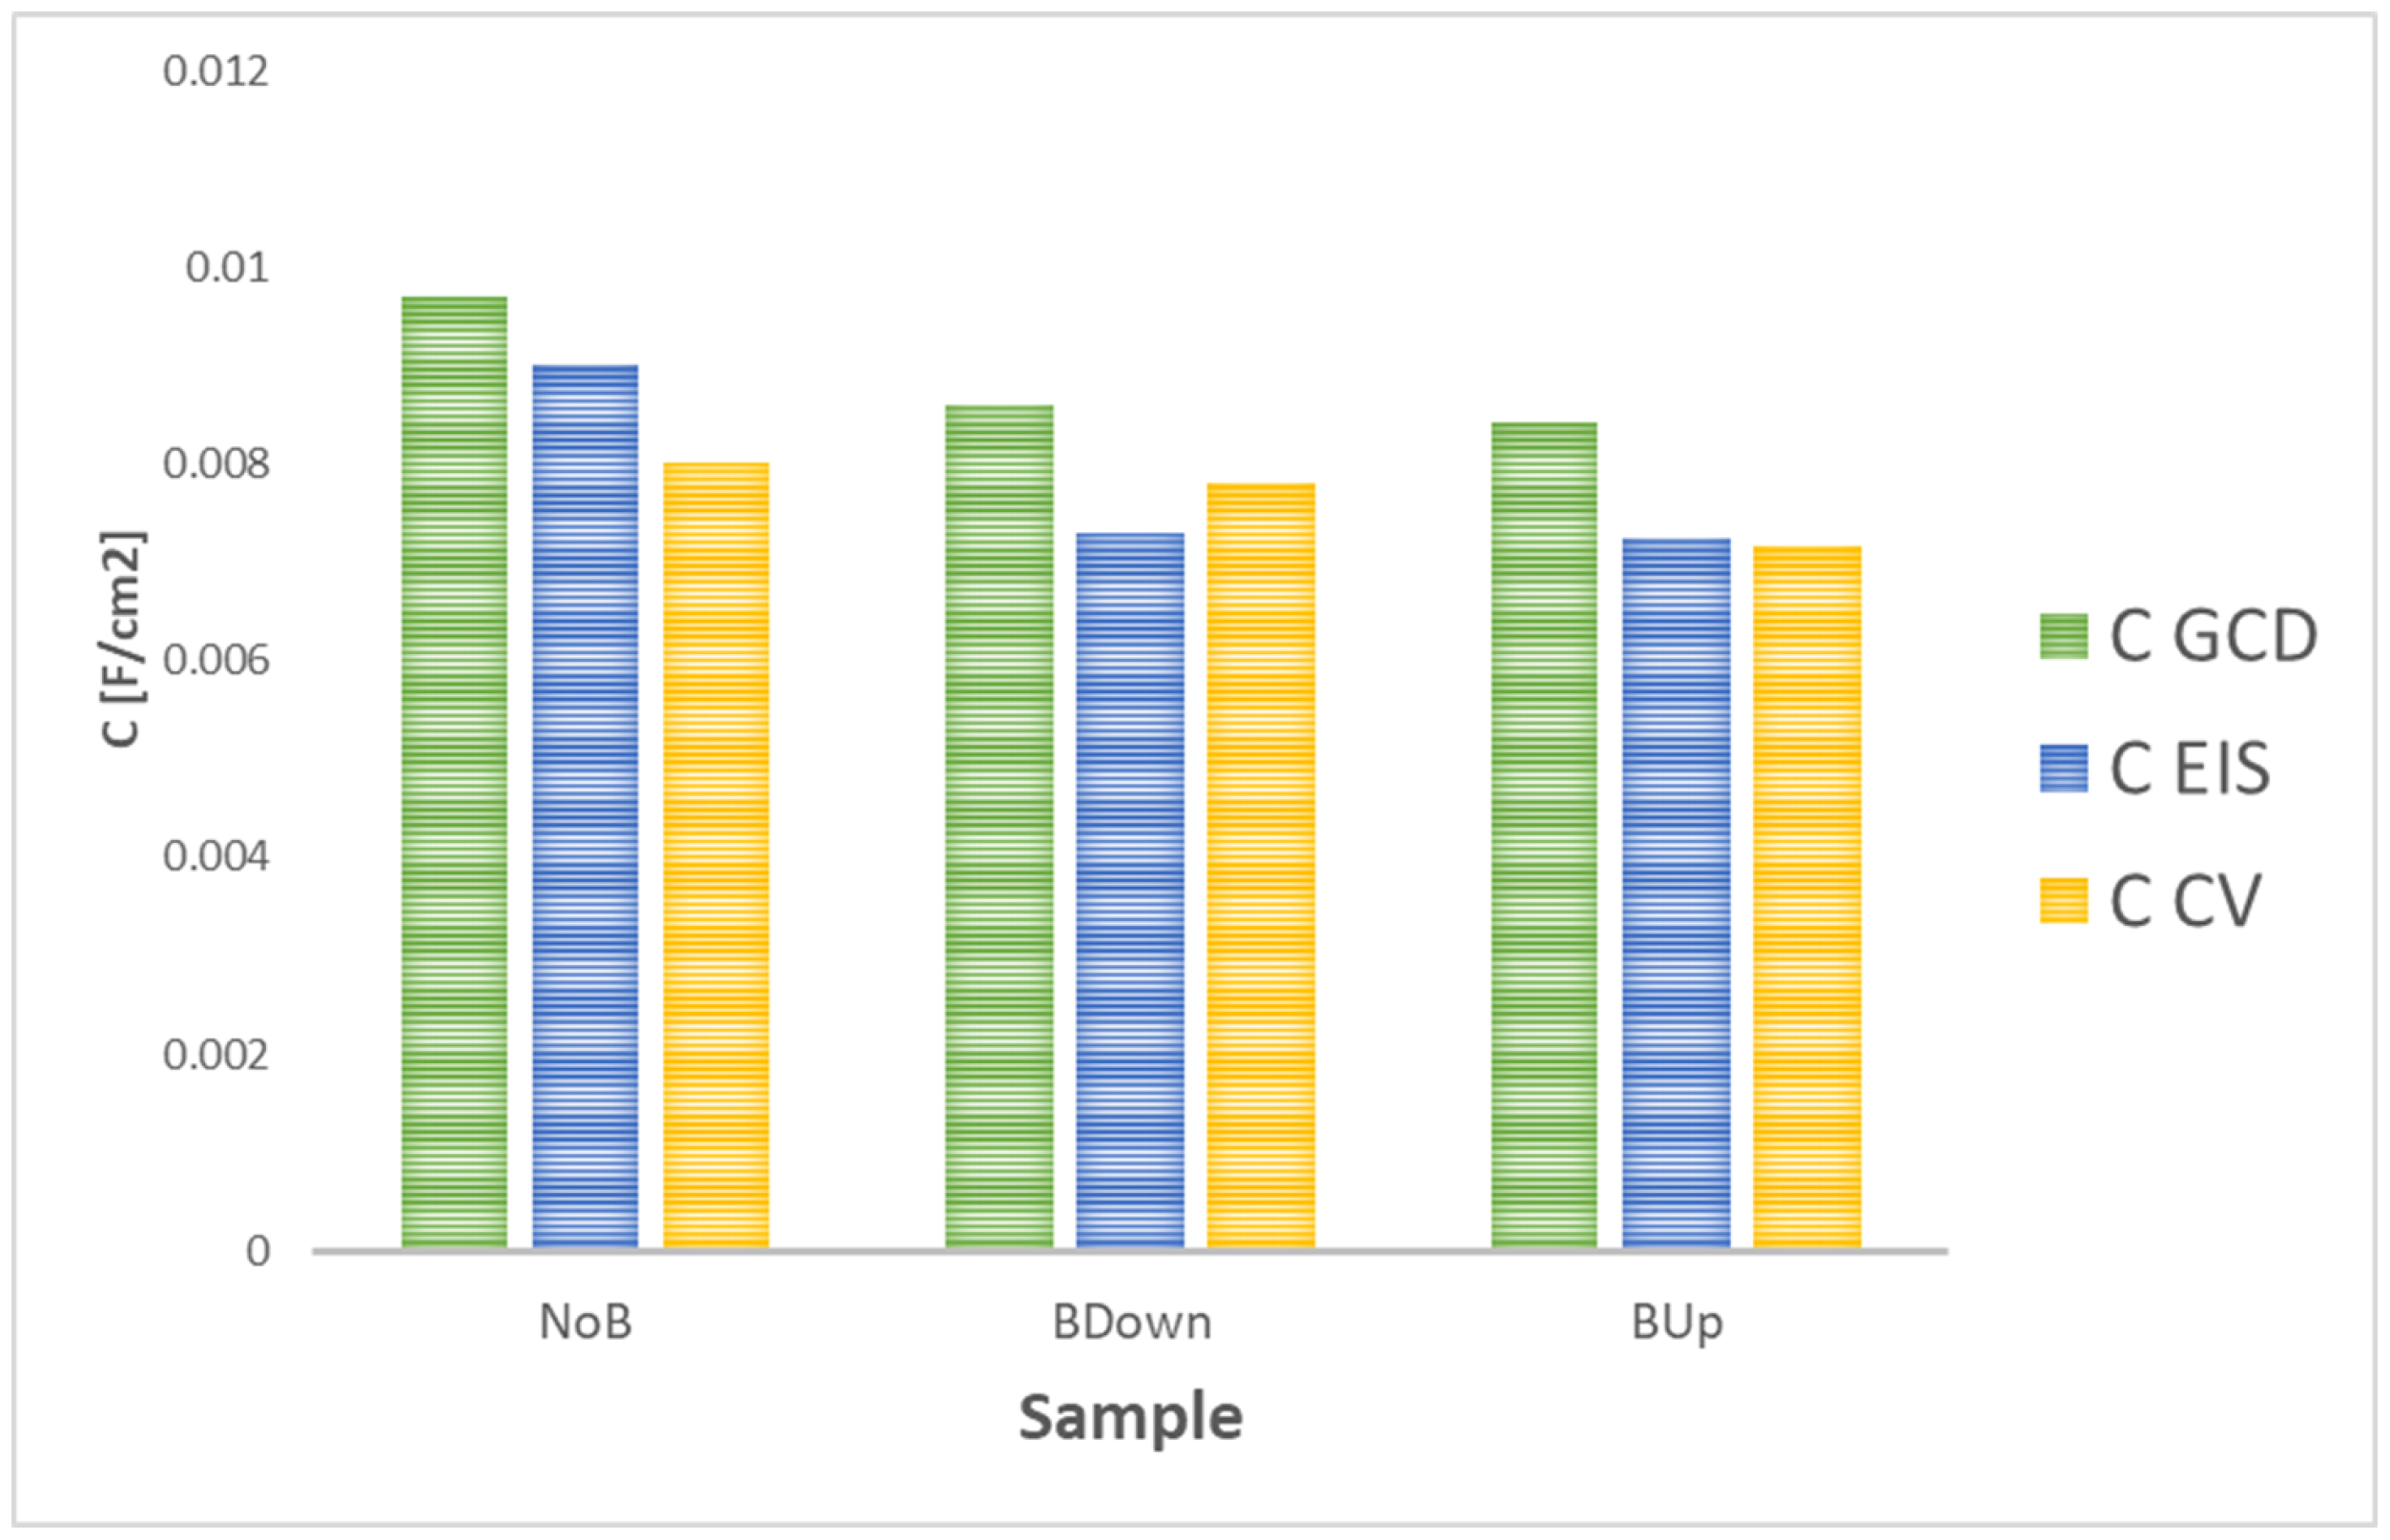
Finally, data obtained from other characterization techniques confirm the model proposed for the electrodeposition and the growth of the electrode material. CV and EIS analyses capacitance further confirm the results of GCD with the same trend, as shown in Figure 14, where capacitance obtained at 0.5 mA/cm 2 current density (for GCD) and 20 mV/s scan rate (for CV) are chosen for best comparison.
The comparison of the results with values obtained with GCD tests shows a matching general trend of the capacitance values. Results are not expected to match perfectly, as they are obtained with different kind of characterization techniques; while during EIS, there is no polarization of the sample and the voltage tends to be changed sinusoidally in a pseudo-equilibrium state, in galvanostatic charge–discharge, the charge accumulation and charge transfer phenomena are forced by the imposition of a constant current. Finally, in the CV test, the potential is swept between two extreme values at different scan rates. In addition, in this work, GCD are performed after a series of preliminary characterization tests, as CV, so an increase in capacitance is expected as typical behavior of the manganese dioxide [10].
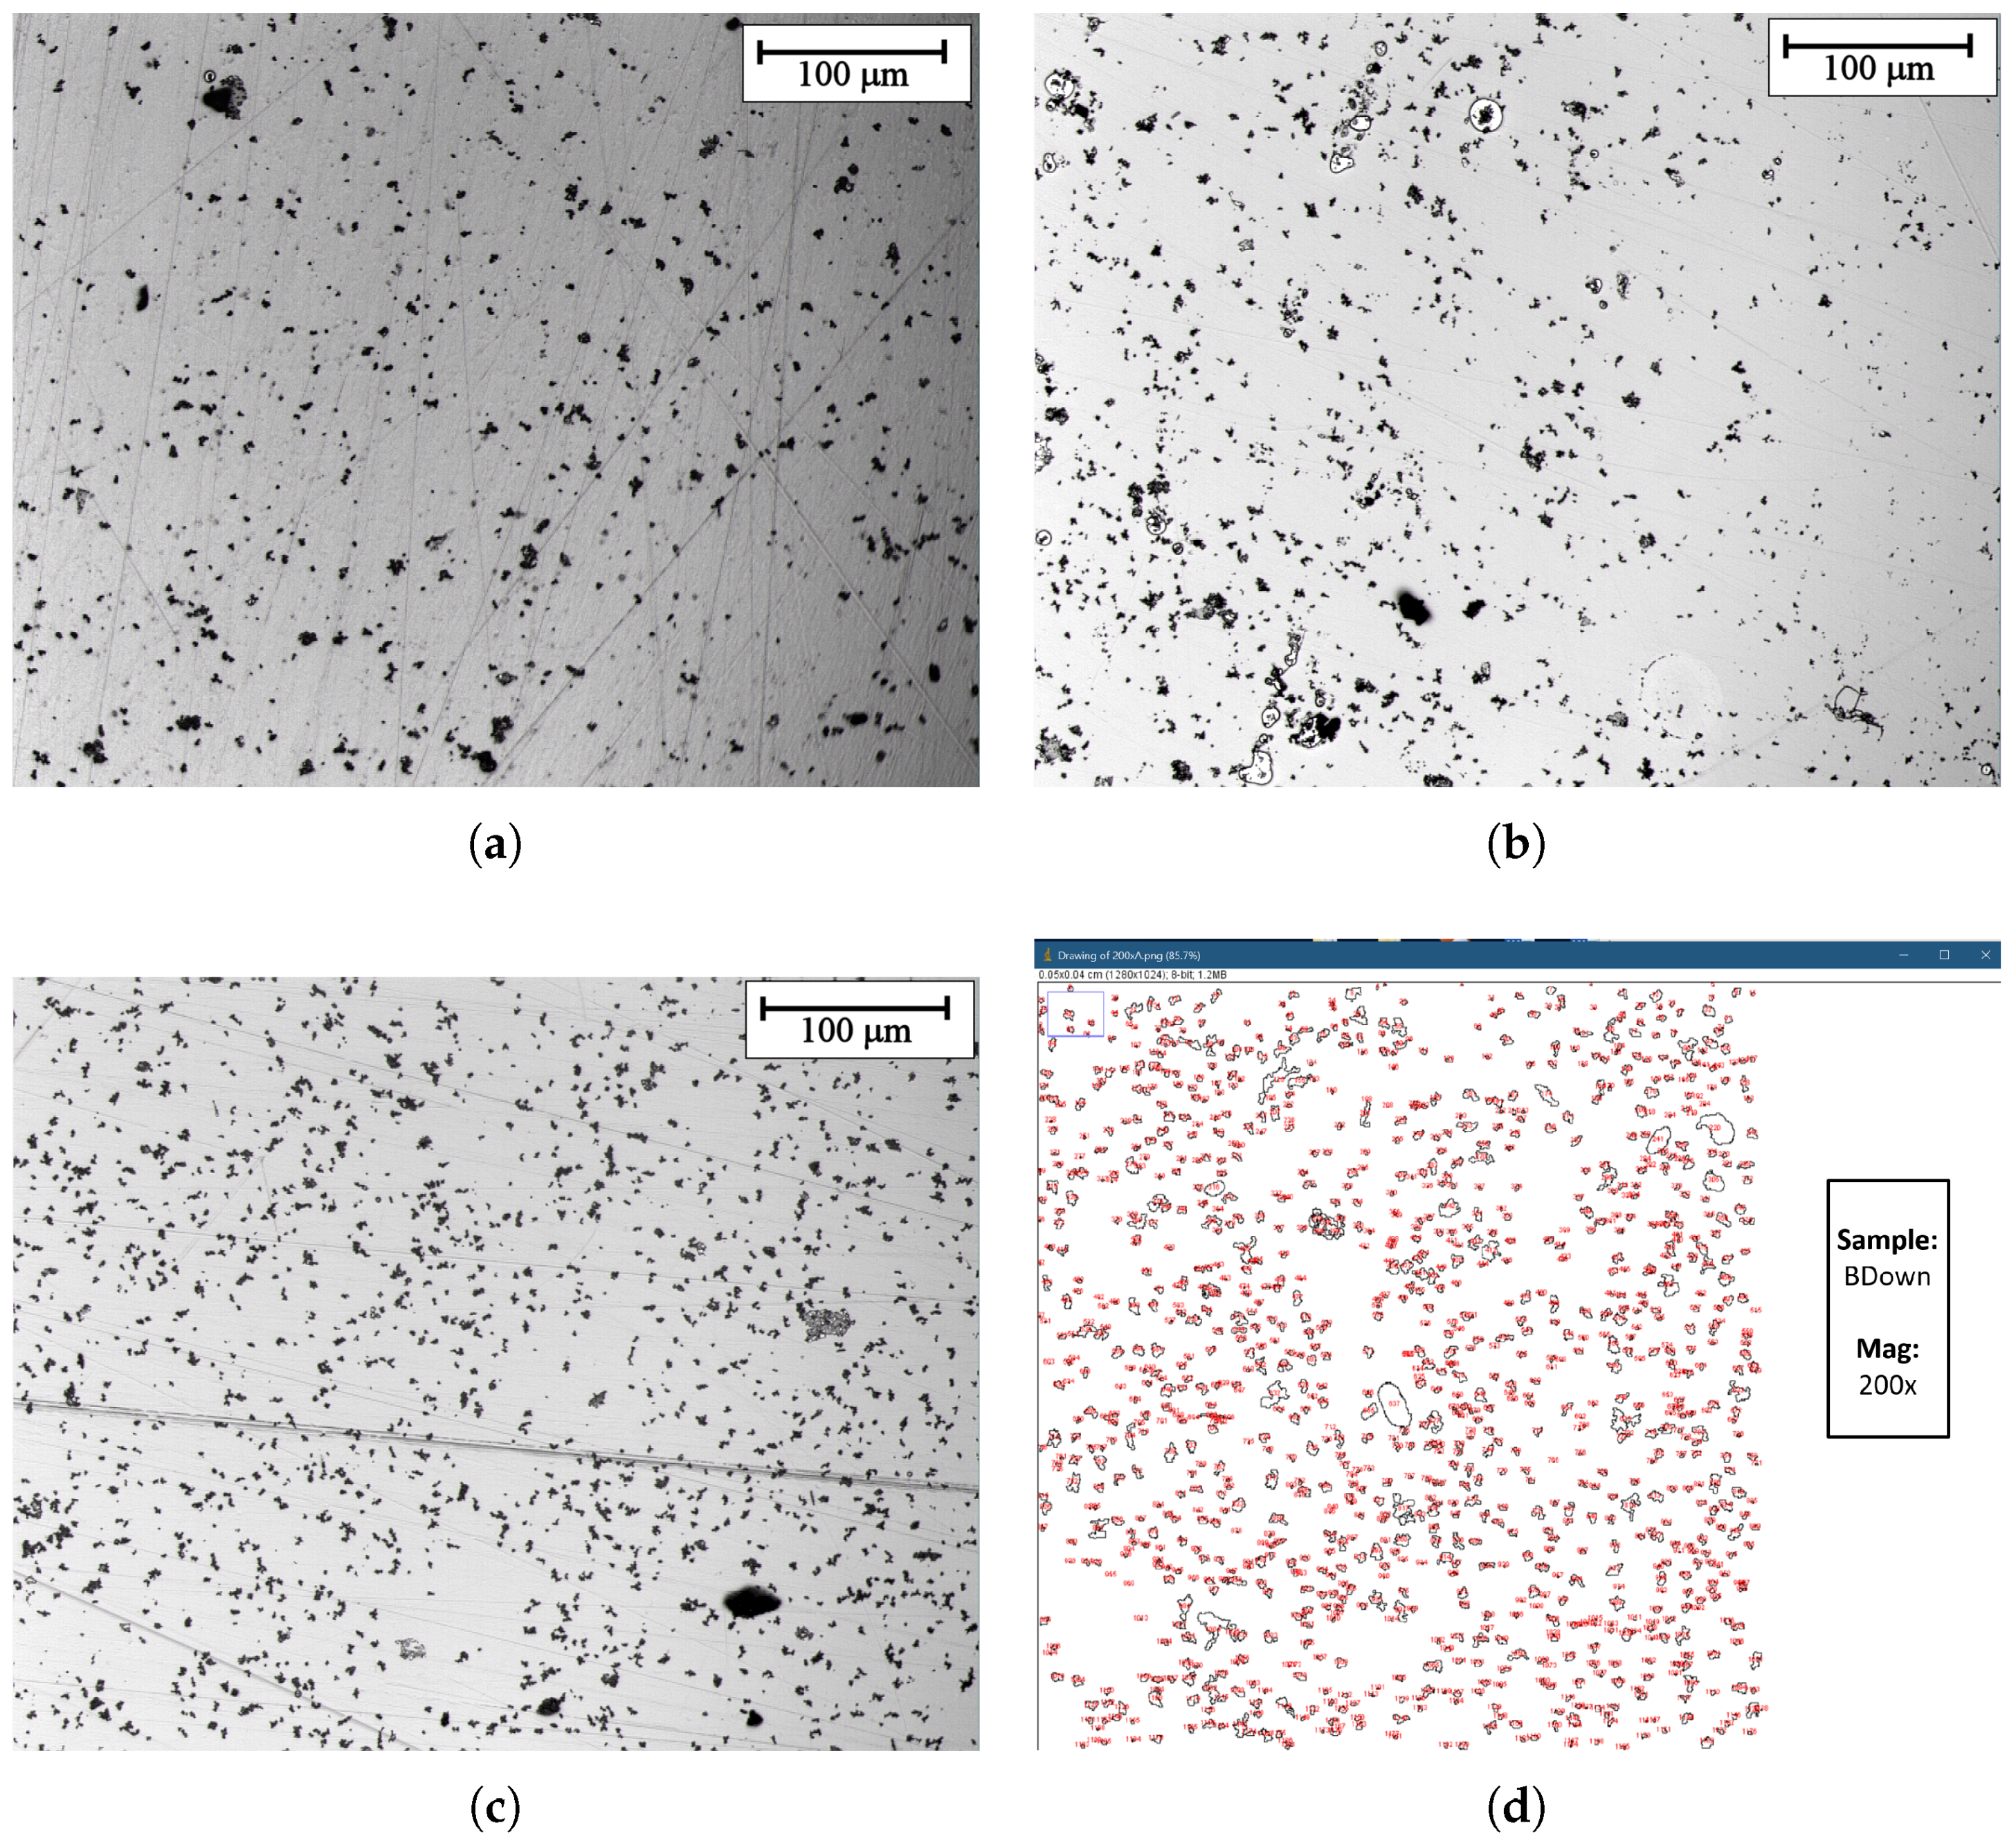
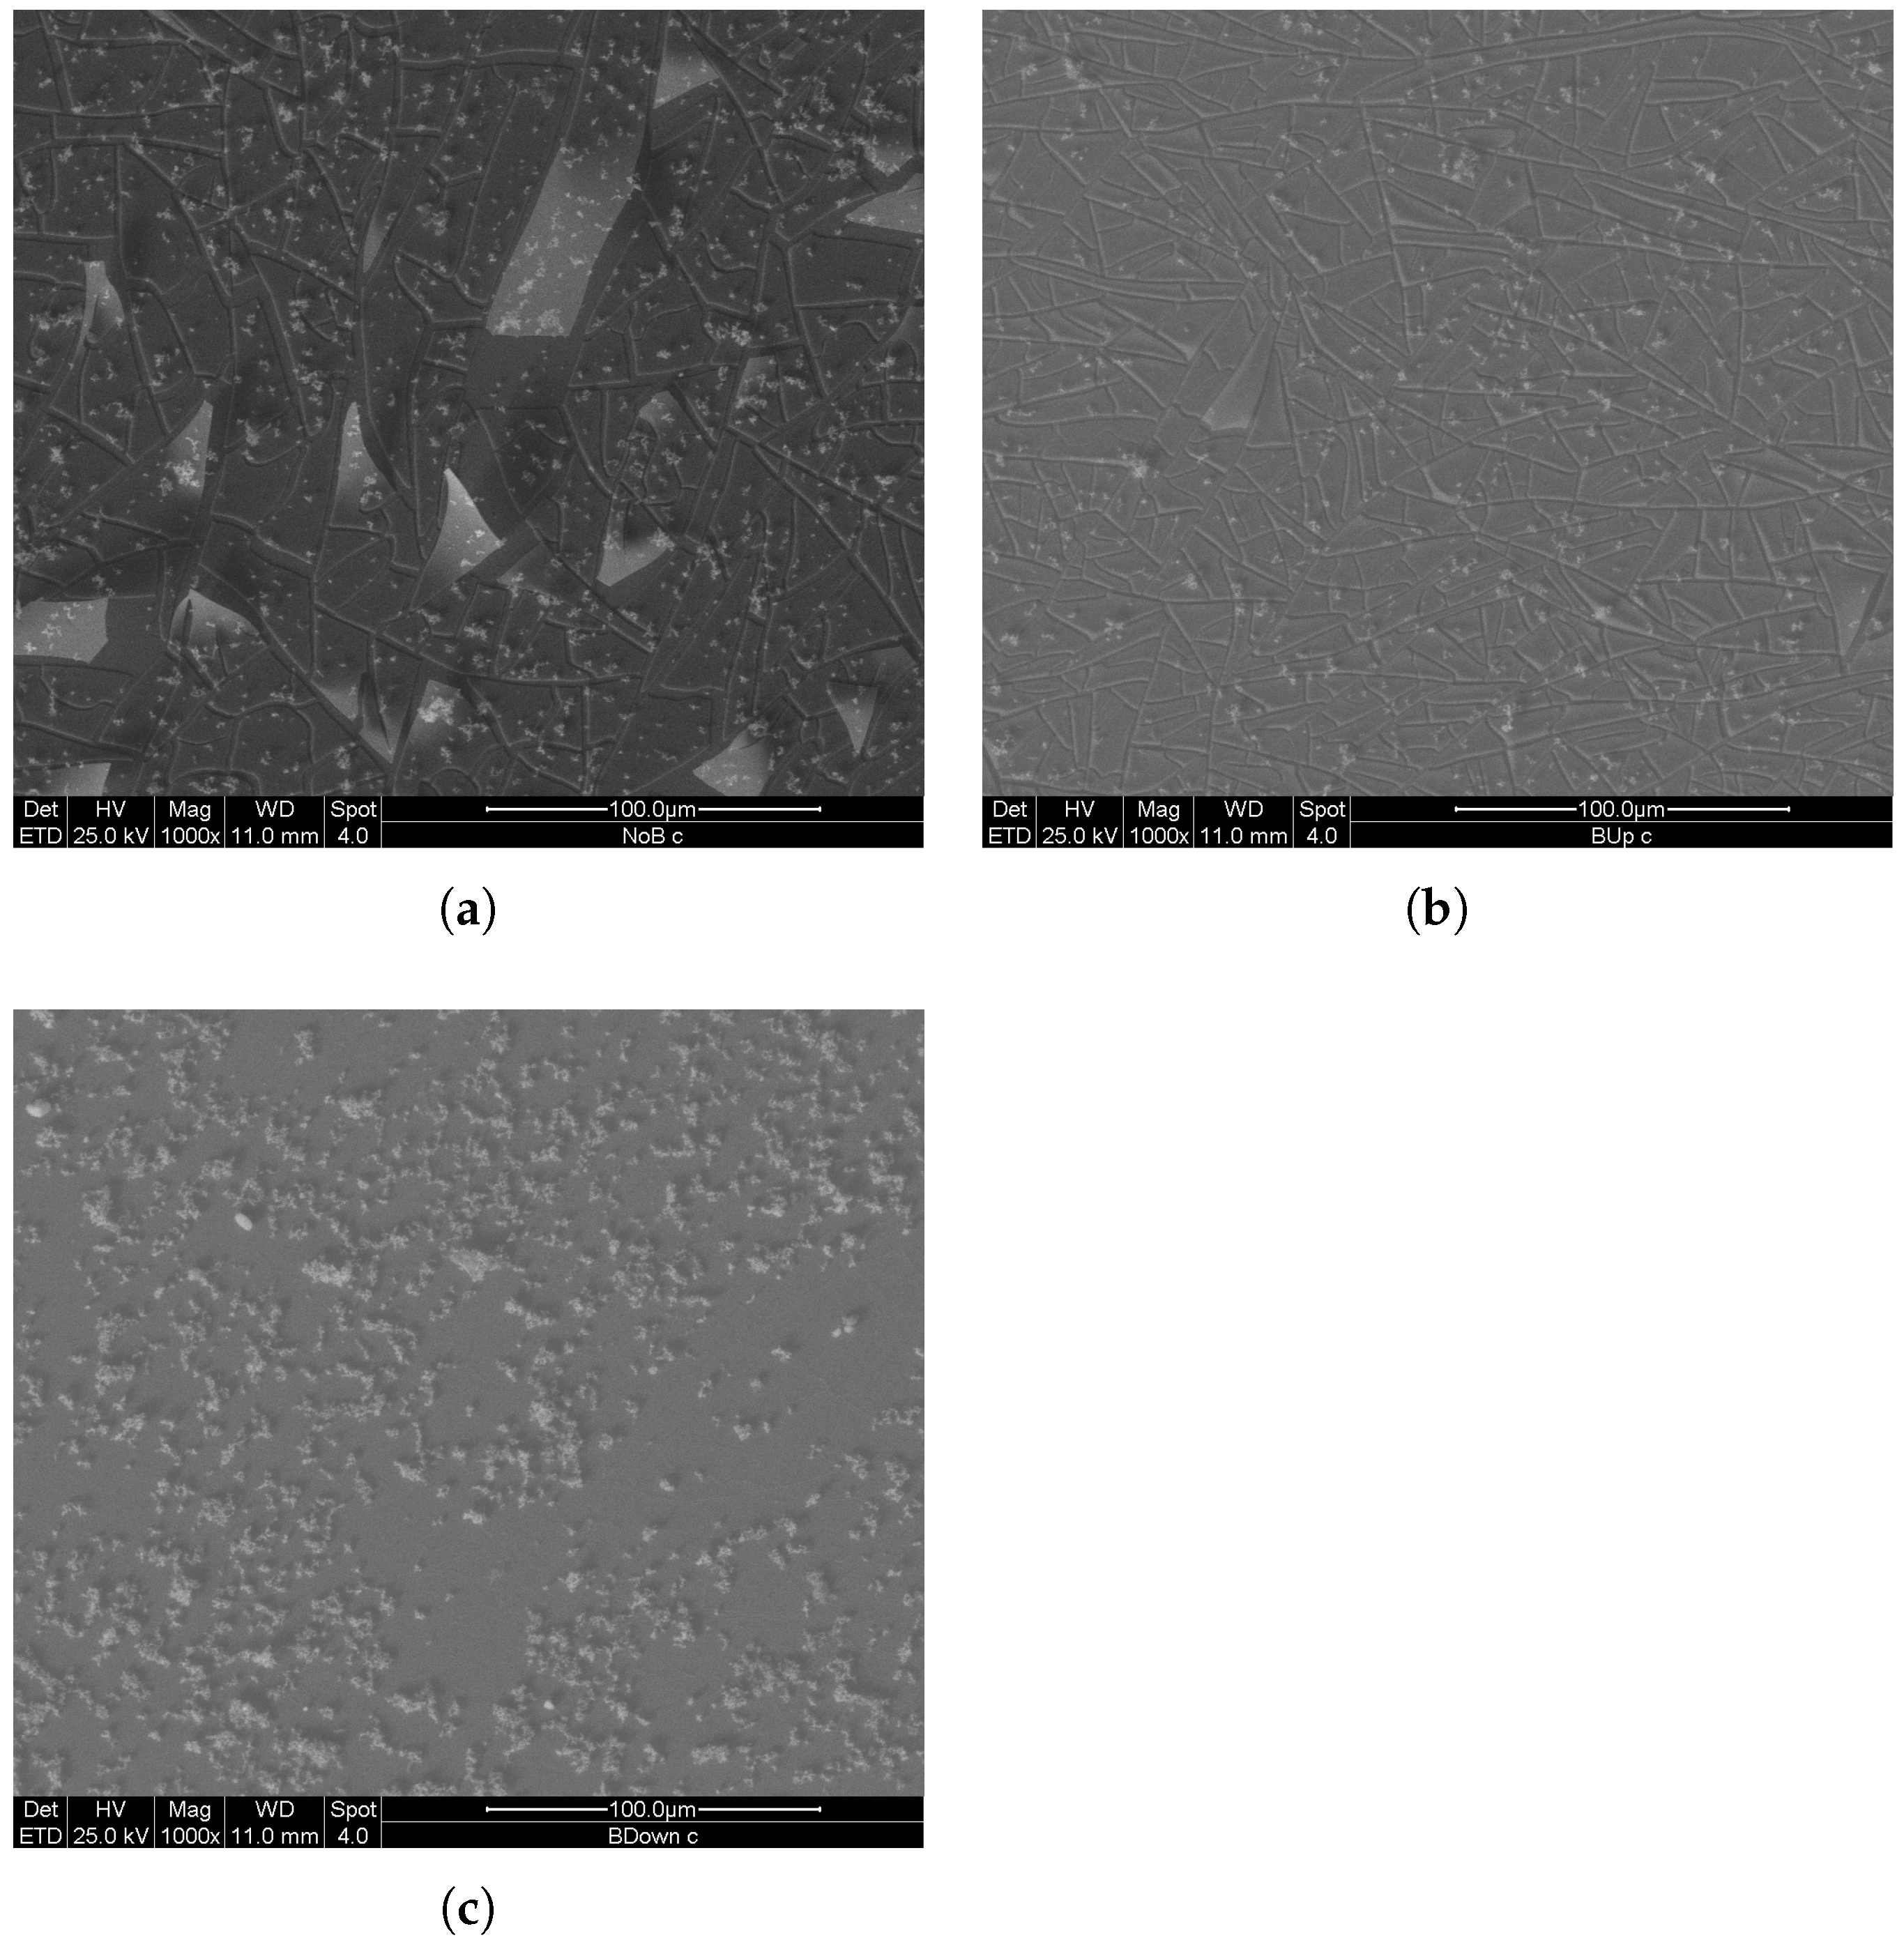
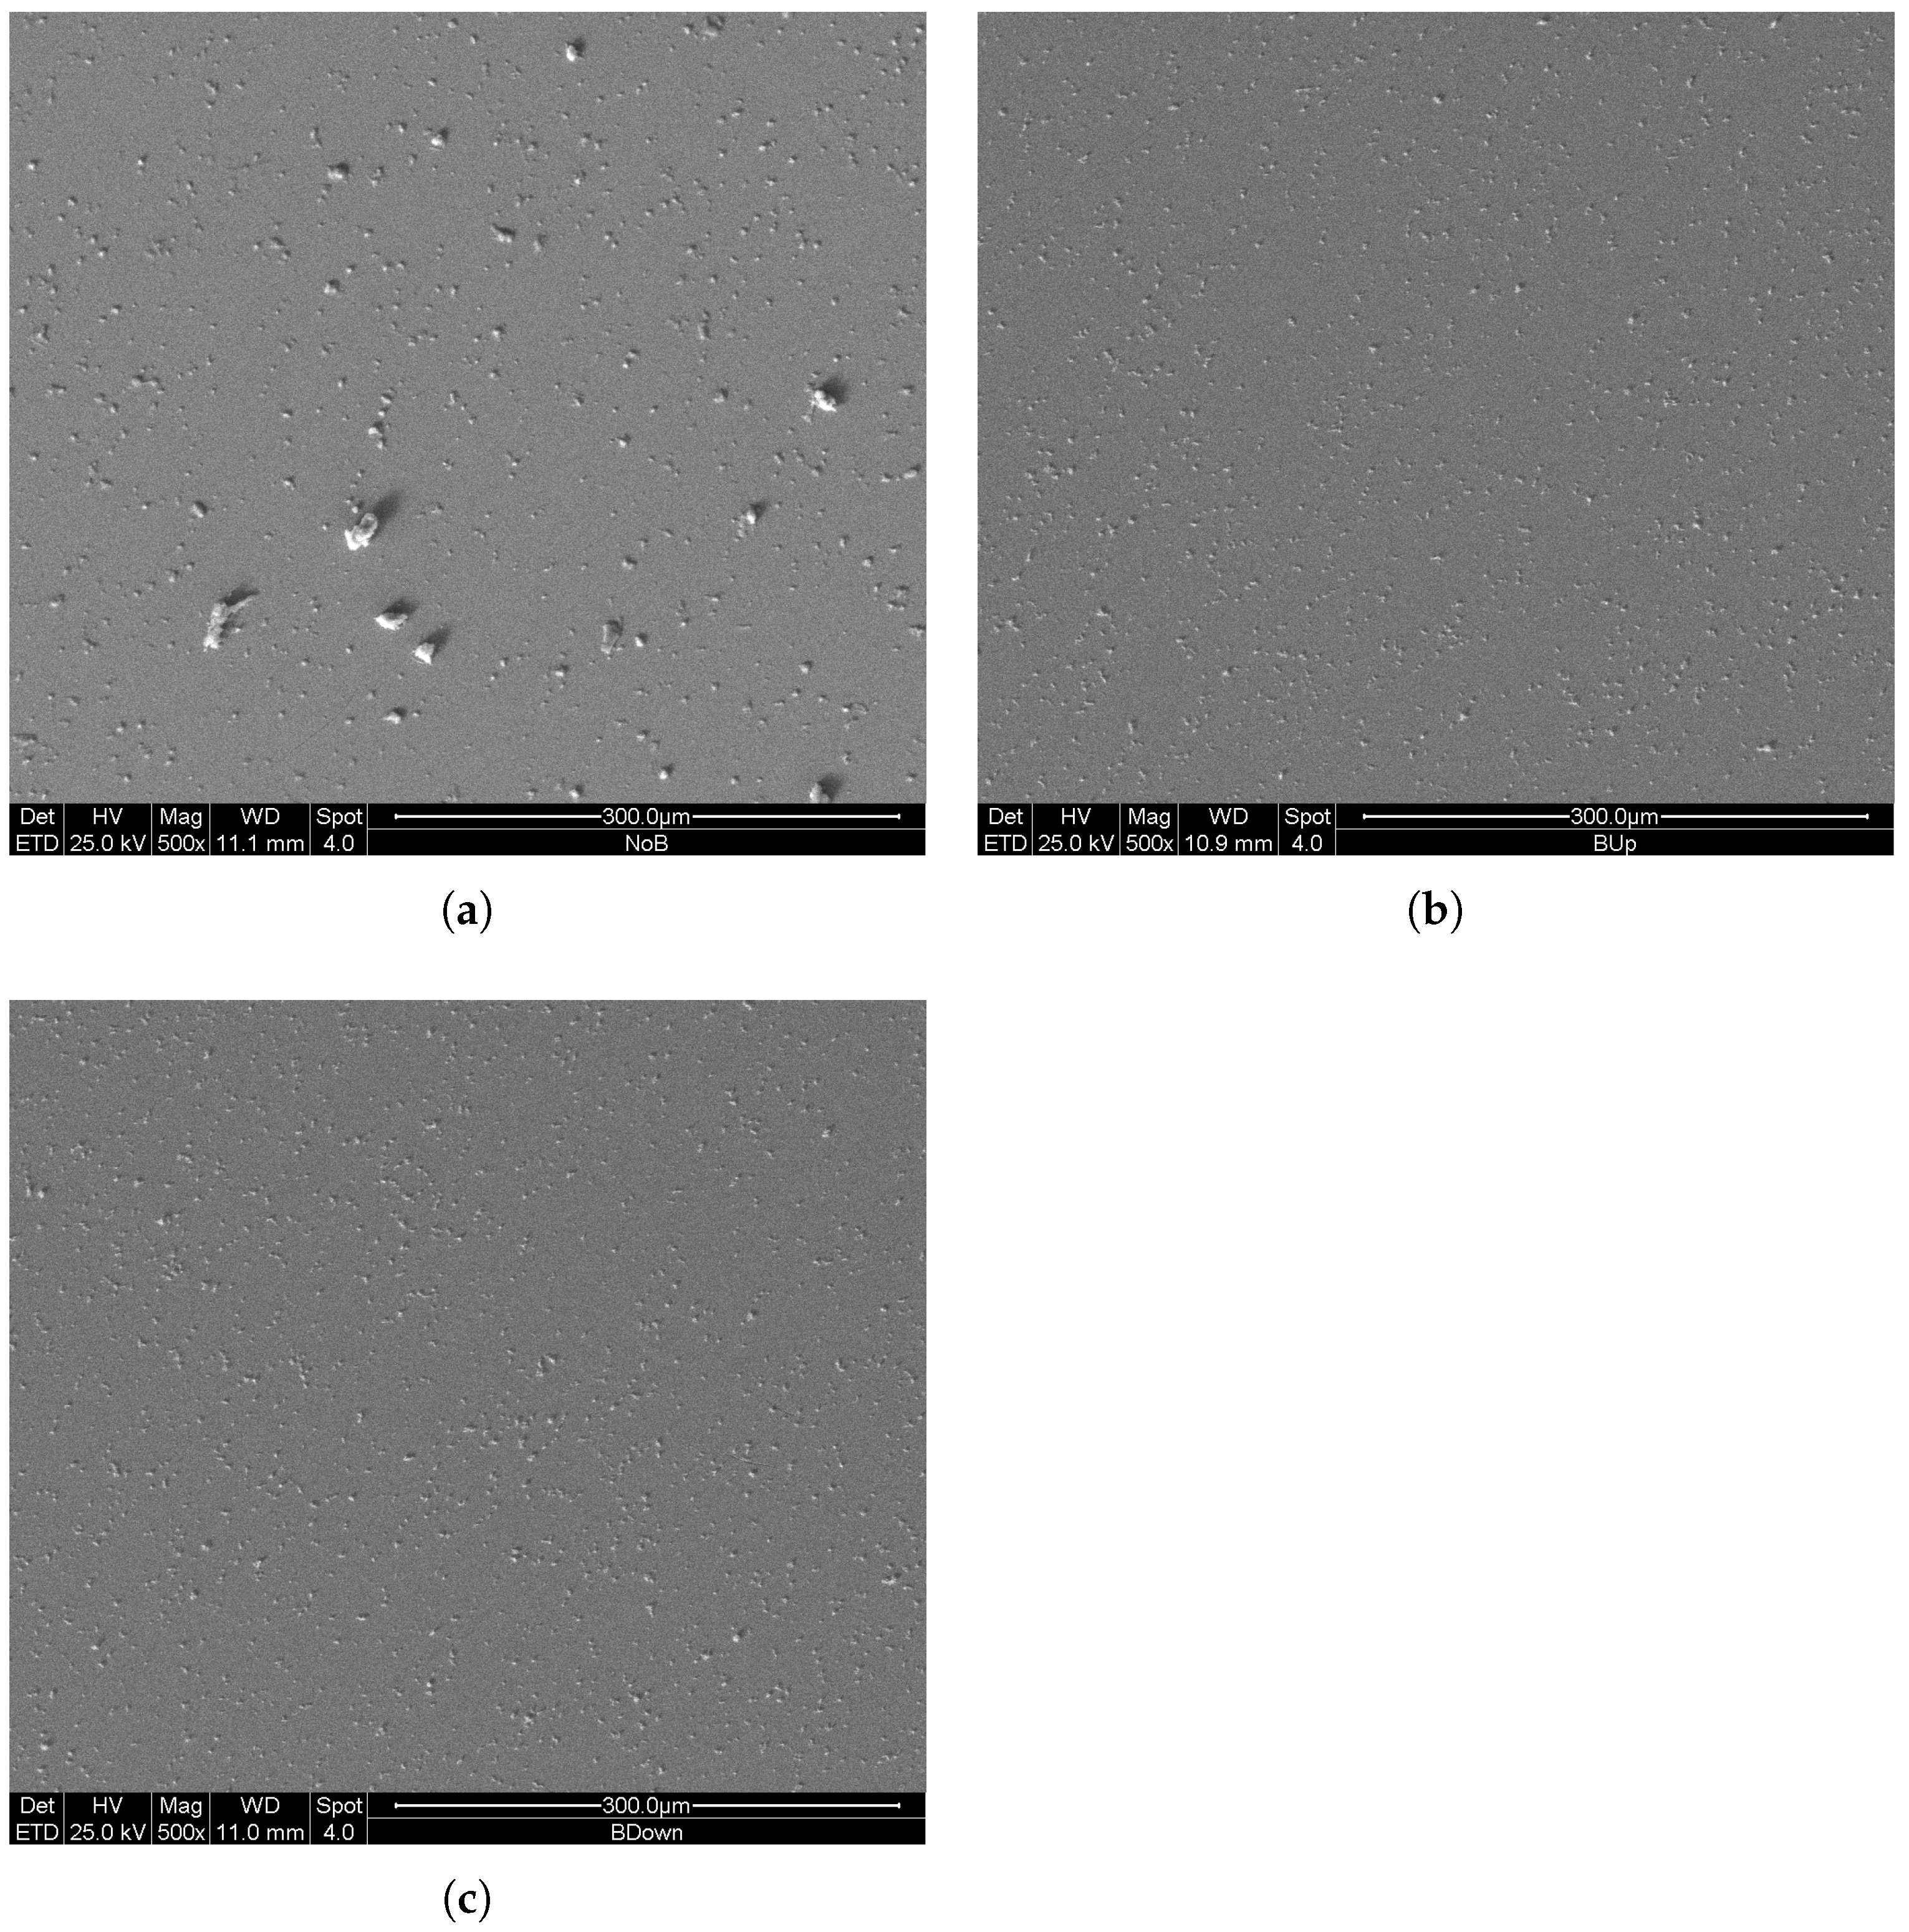
Finally, micrographs and optical image analysis confirm the hypothesis that the presence of the magnetic field introduces a convection and different hydrogen reduction kinetic and bubbling, which directly influences the nucleation and growth of the electrodeposited material. The number of nuclei counted in BDown and BUp is higher and bigger in dimensions, with a more uniform distribution over the whole surface. This is the effect expected for the setup used for the electrodeposition: while the magnetic field decreases the diffusion layer thickness, thanks to a local convection effect [18], the limiting current of the reduction reaction is increased, the nucleation rate consequently increases. Also due to the forced convection, H 2 bubbles tend to detach from the surface before coalescing with other bubbles that are forming nearby, favoring nucleation on new free sites and lowering the actual current density, thus leading the pre-existing deposit to grow in size and to create clusters that occupy a greater surface area. SEM analysis, performed on two new sets of samples, further confirms our previous hypothesis, showing an increase of uniformity and compactness of BUp and BDown samples and adding the possibility to analyze the first instants of electrodeposition, further underlining the difference between electrodes obtained with and without a magnetic field exposition, showing that nucleation sites increase greatly for BUp and BDown.

4. Materials and Methods

4.1. Setup

Electrodepositions were performed using a Teflon electrochemical cell in two or three electrode configurations (with SSCE, i.e., Saturated Silver Chloride Electrode, as reference electrode). Electrochemical characterization was performed in three electrode configuration with SSCE as the reference electrode. Two and three-electrode configurations are better explained in Figure 15. Electrodeposition and electrochemical characterization were conducted with a potenziostat/galvanostat VersaSTAT 3 (Princeton Applied Research). Electrode samples were always connected as the working electrode, while the counter electrode was chosen between copper or platinum wires according to the specific space requirement of the cell’s configuration. For each setup, the magnet was positioned outside the deposition cell, with the pole of interest in close contact with the substrate functioning as a working electrode. The setup was to always guarantee the same positioning distance of the magnet from the gold layer involved in the electrodeposition.

4.2. The Preparation of Manganese Dioxide Electrodes

For the preparation of manganese dioxide electrodes, two main procedures were used, galvanostatic deposition and potentiostatic electrodeposition. Galvanostatic electrodeposition of manganese dioxide was obtained starting from 0.4 M KMnO 4 (Carlo Erba) and gold-coated silicon substrates. The geometrical area of the substrate (connected as working electrode) was 0.332 cm 2 . At first, substrates were cleaned with deionized water and treated in ultrasonic-bath for 10 min, then degreased using acetone. Each substrate was mounted in the deposition cell with copper wire as the counter electrode. Electrodeposition was carried out at room temperature and at a constant current density between 1–3 mA/cm 2 for a duration of 750 s.
Two of the samples were exposed to different spatial configurations of a magnetic field of 0.5 T during the electrodeposition process, using a magnet in the North direction (Down configuration) and South direction (Up configuration). Designation of the samples obtained in this study in correlation with the pole sign of the magnet in direct contact with the substrate in this phase are reported in Table 3. After the electrodeposition process, each sample was rinsed several times with deionized water to assure that no trace of potassium permanganate remained on the electrode surface.
To further examine differences in reduction curves between the samples obtained with different directional exposures of the magnetic field, the potentiostatic deposition was used. The same pre-treatment, post-cleaning, and deposition setup are applied on gold-coated silicon substrate, with an increase of the deposition area to 0.462 cm 2 . Electrodeposition of M n O 2 was obtained starting from a 0.4 M KMnO 4 (Carlo Erba) solution at room temperature using the deposition cell. The reduction potential was selected after a linear scan voltammetry test to ensure that its value was lower than the reduction peak level, and a constant voltage of −1.0 V vs. counter electrode was applied for 750 s. Also in this phase, different directional expositions of the sample to the 0.5 T magnet during the deposition was used. Once the depositions were completed, the samples were removed from the cell, washed with de-ionised water, and left to dry in a heater at 60 C.

4.3. The Characterization of Manganese Dioxide Electrodes

After the electrodeposition, electrodes were mounted in the flat cell for electrochemical characterization as the working electrode, with platinum as the counter electrode and a SSCE as the reference electrode. A neutral electrolyte was used during the characterization phase, so a 0.1 M Na 2 SO 4 solution was prepared and introduced during the electrochemical testing. To assess differences between different magnetic field expositions of electrodeposited electrodes, a first electrochemical characterization was performed on samples obtained with galvanostatic electrodeposition, and after on potentiostatic electrodeposition samples.
Cyclic Voltammetry (CV) was performed to determine kinetic properties, a working potential window, and the specific capacitance of the electrodes using 0.1 M Na 2 SO 4 and four different scan rates (10, 20, 50, and 100 mV/s). The capacity was calculated using the voltammetric charge Q C V , integrated from the cyclic voltammograms (Equation (5)):
Q C V = i dE ν
where Q C V is the charge exchanged during the CV, i is the current, E is the potential, and ν is the scan rate. It is possible then to obtain the capacity C, dividing Q C V by two times the investigated potential window Δ E , see Equation (6):
C = Q C V 2 Δ E
Electrochemical Impedance Spectroscopy (EIS) was used to evaluate the impedance response of the sample, using the same electrolyte at room temperature. Fitting of the impedance spectra was performed using the equivalent circuit of Figure 8 with ZSimpWin software, and then the obtained parameters were compared with Nyquist and Bode graphs, and other characterization technique results. Fundamental parameters, in this case, are the Equivalent Series Resistance (ESR), which describes the main dissipation factors, and the capacitances assigned to different expected phenomena as double-layer capacitance and the pseudo-capacitance of M n O 2 . The latter is calculated using the following equation:
C p s = ( Y 0 R ) 1 n R [ F ]
where R is the resistance coupled with the CPE, Y 0 and n are parameters of the Constant Phase Element (CPE) used to fit the pseudocapacitive branch defined as:
Q = 1 Y 0 ( j ω ) n
Finally, Galvanostatic Charge Discharge (GCD) was performed, to evaluate the DC response of the samples, which better describes the real behavior of the material during real working conditions. During this phase, the internal resistance of the samples ( R i n t ) and specific capacitance ( C G C D ) were calculated as:
R i n t = ( V B V A ) i A [ Ω · c m 2 ]
C G C D = i ( t 2 t 1 ) A ( V C V B ) [ F / c m 2 ]
where, for Equation (9), ( V B V A ) is the potential drop observed at the inversion (charge–discharge), due to internal resistance, also called ohmic drops, at a specific current density i; A is the electrode sample area. Regarding Equation (10), i is the constant current density of the discharge section, ( V C V B ) the potential drop observed during the time ( t 2 t 1 ) , A is the electrode sample area. Data obtained from GCD were compared to other results to confirm general trends; direct quantitative comparison could not be performed, as different perturbations were applied to the system.
Optical microscope analysis of the samples was performed to obtain surface micrographs. Then, particles individuation, counting, and areal coverage evaluation were applied (using the ImageJ software) to different sites of interest on the surface of the samples, acquiring and analyzing multiple images to obtain representative values. A scanning electron microscope was used for further morphological and microstructural investigations.

5. Conclusions

In this work, we have described the preparation and characterization of M n O 2 on Au/Si electrodes, in the view of their possible use in supercapacitor devices. The M n O 2 plating and capacitive performance has been studied and compared between three different deposition conditions: in the absence of the magnetic field and in the presence of a upwards or downwards axial magnetic field, the latter is applied by placing a permanent magnet underneath the working electrode surface. GCD, EIS, and CV electrochemical techniques are used to characterize the physical and chemical properties of our samples. On the one hand, the experimental results show that the obtained M n O 2 electrodes show capacitance values which are consistent with results already reported in the literature for pseudocapacitive systems [10].
The highest capacitive performance is recorded for the sample obtained without the presence of the magnetic field during the electrodeposition process. Other samples, obtained with the presence of a magnetic field during the electrodeposition process, showed lower capacitance values.
This result can be rationalized in combination with the study of the deposition curves, the optical microscope and scanning electron microscope outcome, all of these results strongly suggest the beneficial influence of the magnetic field on the electrochemical efficiency of the deposition. In fact, the MHD effects lead to a more dense, packed, and ordered M n O 2 microstructure, which is a less synergic environment for pseudocapacitive charge–discharge mechanisms. The use of the M n O 2 on Au/Si electrodes here obtained, in combination with surface functionalization using organic polymers and a spin-dependent electrochemistry effect, paves the way to new developments in the field of magneto-electrochemistry systems [19,20,21].

Author Contributions

Conceptualization, C.F.; data curation, A.G. and A.S.; formal analysis, A.S.; investigation, A.G.; methodology, A.G.; project administration, C.F. and R.G.; resources, R.G.; supervision, C.F. and R.G.; validation, A.S.; writing—original draft, A.G. and A.S.; writing—review and editing, M.I., C.F. and R.G. All authors have read and agreed to the published version of the manuscript.

Funding

This research received no external funding.

Data Availability Statement

The data presented in this study are available on request from the corresponding author.

Conflicts of Interest

The authors declare no conflict of interest.

Abbreviations

The following abbreviations are used in this manuscript:
BSEBackscattered Electrons
CECounter Electrode
CPEConstant Phase Element
CVCyclic Voltammetry
EISElectrochemical Impedance Spectroscopy
ESREquivalent Series Resistance
GCDGalvanostatic Charge–Discharge
MHDMagneto Hydro-Dynamic effect
REReference Electrode
SESecondary Electrons
SEMScanning Electron Microscope
SSCESaturated Silver Chloride Electrode
WEWorking Electrode

References

  1. Frackowiak, E.; Beguin, F. Carbon materials for the electrochemical storage of energy in capacitors. Carbon 2001, 39, 937–950. [Google Scholar] [CrossRef]
  2. Lin, C.; Popov, B.N.; Ploehn, H.J. Modeling the Effects of Electrode Composition and Pore Structure on the Performance of Electrochemical Capacitors. J. Electrochem. Soc. 2002, 149, A167–A175. [Google Scholar] [CrossRef] [Green Version]
  3. Abbas, Q.; Raza, R.; Shabbir, I.; Olabi, A.G. Heteroatom doped high porosity carbon nanomaterials as electrodes for energy storage in electrochemical capacitors: A review. J. Sc. Adv. Mater. Dev. 2019, 4, 341–352. [Google Scholar] [CrossRef]
  4. Villers, D.; Jobin, D.; Soucy, C.; Cossement, D.; Chahine, R.; Breau, L.; Belanger, D. The Influence of the Range of Electroactivity and Capacitance of Conducting Polymers on the Performance of Carbon Conducting Polymer Hybrid Supercapacitor. J. Electrochem. Soc. 2003, 150, A747. [Google Scholar] [CrossRef]
  5. Fusalba, F.; Ho, H.A.; Breau, L.; Belanger, D. Poly(Cyano-Substituted Diheteroareneethylene) as Active Electrode Material for Electrochemical Supercapacitors. Chem. Mater. 2000, 9, 2581–2589. [Google Scholar] [CrossRef]
  6. Zheng, J.P.; Jow, T.R. A new charge storage mechanism for electrochemical capacitors. J. Electrochem. Soc. 1995, 142, L6. [Google Scholar] [CrossRef]
  7. Soudan, P.; Gaudet, J.; Guay, D.; Belanger, D.; Schulz, R. Electrochemical Properties of Ruthenium-Based Nanocrystalline Materials as Electrodes for Supercapacitors. Chem. Mater. 2002, 14, 1210. [Google Scholar] [CrossRef]
  8. Conway, B.E.; Birss, V.; Wojtowicz, J. The role and utilization of pseudocapacitance for energy storage by supercapacitors. J. Power Sources 1997, 66, 1–14. [Google Scholar] [CrossRef]
  9. Toupin, M.; Brousse, T.; Belanger, D. Charge Storage Mechanism of MnO2 Electrode Used in Aqueous Electrochemical Capacitor. Chem. Mater. 2004, 16, 3184–3190. [Google Scholar] [CrossRef]
  10. Pang, S.C.; Wee, B.H.; Chin, S.F. The Capacitive Behaviors of Manganese Dioxide Thin-Film Electrochemical Capacitor Prototypes. Int. J. Electrochem. 2011, 2011. [Google Scholar] [CrossRef] [Green Version]
  11. Young, M.; Holder, A.M.; George, S.M.; Musgrave, C.B. Mechanism of Pseudocapacitive Charge Storage in MnO2. Available online: www.researchgate.net (accessed on 30 June 2014).
  12. Monzon, L.M.A.; Coey, J.M.D. Magnetic fields in electrochemistry: The Lorentz force. A mini-review. Electrochem. Commun. 2014, 42, 38–41. [Google Scholar] [CrossRef]
  13. Gatard, V.; Deseure, J.; Chatenet, M. Use of magnetic fields in electrochemistry: A selected review. Current Opin. Electrochem. 2020, 23, 96–105. [Google Scholar] [CrossRef]
  14. Conway, B.E. Electrochemical Supercapacitors-Scientific Fundamentals and Technological Applications; Springer: Boston, MA, USA, 1999. [Google Scholar]
  15. Allison, A.; Andreas, H.A. Minimizing the Nyquist-plot semi-circle of pseudocapacitive manganese oxides through modification of the oxide-substrate interface resistance. J. Power Sources 2019, 426, 93–96. [Google Scholar] [CrossRef]
  16. Gregory, R.D. Classical Mechanics; Cambridge University Press: Cambridge, UK, 2006. [Google Scholar]
  17. Bard, A. Electrochemical Methods: Fundamentals and Applications; John Wiley and Sons: Hoboken, NJ, USA, 1980. [Google Scholar]
  18. Hinds, G.; Spada, F.E.; Coey, J.M.D.; Ní Mhíocháin, T.R.; Lyons, M.E.G. Magnetic Field Effects on Copper Electrolysis. J. Phys. Chem. B 2001, 39, 9487–9502. [Google Scholar] [CrossRef]
  19. Kumar, A.; Capua, E.; Vankayala, K.; Fontanesi, C.; Naaman, R. Magnetless Device for Conducting Three-Dimensional Spin-Specific Electrochemistry. Angew. Chem. Int. Ed. 2017, 56, 14587–14590. [Google Scholar] [CrossRef] [PubMed]
  20. Morvillo, P.; Parenti, F.; Diana, R.; Fontanesi, C.; Mucci, A.; Tassinari, F.; Schenetti, L. A novel copolymer from benzodithiophene and alkylsulfanyl-bithiophene: Synthesis, characterization and application in polymer solar cells. Sol. Energy Mater. Sol. Cells 2012, 104, 45–52. [Google Scholar] [CrossRef]
  21. Marcaccio, M.; Paolucci, F.; Fontanesi, C.; Fioravanti, G.; Zanarini, S. Electrochemistry and spectroelectrochemistry of polypyridine ligands: A theoretical approach. Inorg. Chim. Acta 2007, 360, 1154–1162. [Google Scholar] [CrossRef]
Figure 1. (a) Electrochemical potentiostatic deposition of MnO 2 on Au/Si WE. Pt was used as counter electrode in a 2-electrodes cell. 0.4 M KMnO 4 aqueous solution was used as electrodeposition bath. Imposed potential of −1.0 V for 750 s. No magnet exposed to the sample (black curve), 0.5 T magnet brought into contact with the bottom of the WE in “up” configuration (red curve); “down” configuration (blue curve). The main plot shows the area of interest, while the inset displays the full procedure. (b) Electrochemical galvanostatic deposition of MnO 2 on Au/Si WE. Pt was used as counter electrode in a 2-electrodes cell. 0.4 M KMnO 4 aqueous solution was used as electrodeposition bath. Imposed current of −1.0 mA for 600 s. No magnet exposed to the sample (black curve), 0.5 T magnet brought into contact with the bottom of the WE in “up” configuration (red curve); “down” configuration (blue curve).
Magnetochemistry 07 00019 g001
Figure 2. GCD of MnO 2 / Au / Si WEs. Galvanostatic Charge Discharge (GCD) recorded at 1 mA/cm 2 current density, in a 3-electrodes flat cell, with Pt as counter electrode and Saturated Silver Chloride Electrode (SSCE) as reference electrode; 0.1 M Na 2 SO 4 aqueous solution was used as electrodeposition bath. MnO 2 deposited without the magnet (black curve), MnO 2 deposited with a 0.5 T magnet brought into contact with the bottom of the WE in up configuration (blue curve); down configuration (red curve).
Magnetochemistry 07 00019 g002
Figure 3. Comparison between specific capacitance values of different samples, calculated using GCD experiments data, as a function of the current density.
Magnetochemistry 07 00019 g003
Figure 4. Comparison between internal resistance values of different samples, calculated using GCD experiments data, as a function of the current density.
Magnetochemistry 07 00019 g004
Figure 5. Cyclic voltammetry curves recorded on a MnO 2 / Au / Si WE. NoB: MnO 2 previously deposited in absence of the magnet. BUp and BDown: MnO 2 previously deposited in the presence of the magnet respectively in “up” and in “down” configuration. All the Cyclic Voltammetry (CV)s are recorded in a 3-electrodes flat cell, with Pt as counter electrode and SSCE. 0.1 M Na 2 SO 4 aqueous solution was used as electrodeposition bath. Different scan-rates used: 10 (black curves), 20 (red curves), 50 (blue curves), 100 (magenta curves) mV/s.
Magnetochemistry 07 00019 g005
Figure 6. Histogram displacing the comparison between capacitance values (expressed in Farads, on the y-axis) of the MnO 2 / Au / Si electrodes. The capacitance is calculated from the previous CV measurements. MnO 2 deposited without the magnet (black columns), MnO 2 deposited with the magnet in up configuration (red columns), MnO 2 deposited with the magnet in down configuration (blue columns).
Magnetochemistry 07 00019 g006
Figure 7. Nyquist plot (Zim vs. Zre) from the Electrochemical Impedance Spectroscopy (EIS) of MnO 2 on Au/Si WE. EIS recorded in a 3-electrodes flat cell, with Pt as counter electrode and SSCE as reference electrode; 0.1 M Na 2 SO 4 aqueous solution was used as electrodeposition bath. MnO 2 deposited without the magnet (black squares curve), MnO 2 deposited with a 0.5 T magnet brought into contact with the bottom of the WE in up configuration (upwards red triangles curve); down configuration (downwards green triangles curve).
Magnetochemistry 07 00019 g007
Figure 8. Equivalent circuit applied to fit EIS data. Each branch can be assigned to te response of different region of the electrodes.
Magnetochemistry 07 00019 g008
Figure 9. MnO 2 (obtained in galvanostatic regime) optical microscope images at 200× magnification. (a) MnO 2 previously deposited in the absence of the magnet. (b,c) MnO 2 previously deposited in the presence of the magnet in up and in down configuration respectively. (d) Optical microscope image analysis with ImageJ. Sample: BDown MnO 2 deposited in galvanostatic regime.
Magnetochemistry 07 00019 g009
Figure 10. Aspect comparison between three main samples. Pictures were taken after cycling, washing in DIW, and drying at 60 deg C.
Magnetochemistry 07 00019 g010
Figure 11. SEM (SE) images of MnO 2 deposits at 1000× magnification, obtained with 750 s potentiostatic electrodeposition in two electrode configuration. (a) MnO 2 previously deposited in the absence of the magnet. (b,c) MnO 2 previously deposited in the presence of the magnet in up and in down configuration respectively.
Magnetochemistry 07 00019 g011
Figure 12. SEM (SE) images of MnO 2 deposits at 500× magnification, obtained with 30 s potentiostatic electrodeposition in two electrode configurations. (a) MnO 2 previously deposited in the absence of the magnet. (b,c) MnO 2 previously deposited in the presence of the magnet in up and in down configuration, respectively.
Magnetochemistry 07 00019 g012
Figure 13. Current recorded during electrodeposition in function of time, showing a linear correletion as expected under Cottrell conditions, marker of diffusive control over electrolysis.
Magnetochemistry 07 00019 g013
Figure 14. Comparison between capacitance values of three main samples obtained in this study for different characterization techniques.
Magnetochemistry 07 00019 g014
Figure 15. Schematic representation of 2-electrode and 3-electrode electrochemical cells.
Magnetochemistry 07 00019 g015
Table 1. Results of the fitting procedure according to the equivalent circuit proposed. Pseudo-capacitance values were calculated using Equation (7) and are reported in the last column.
Sec ASec BSec CPseudocapacitance
Sample ID R esr [ Ω ] C srf [ F ] R srf [ Ω ] Y 0 Q [ S sec n ] n Q R ct [ Ω ] C ps [ mF ]
NoB 5.96 × 10 1 1.01 × 10 5 1.52 × 10 1 5.66 × 10 3 9.16 × 10 1 2.75 × 10 4 9.02
BUp 6.35 × 10 1 1.33 × 10 5 9.19 × 10 0 5.28 × 10 3 9.24 × 10 1 9.31 × 10 3 7.26
BDown 6.74 × 10 1 2.08 × 10 5 8.27 × 10 0 5.38 × 10 3 9.32 × 10 1 1.24 × 10 4 7.30
Table 2. Results of the image analysis process of three main samples, obtained with ImageJ software.
Sample IDN/cm 2 avgSurface cov. %
NoB 531 , 667 4.57%
BUp 741 , 392 5.59%
BDown 753 , 667 8.09%
Table 3. Definitions of samples’ ID according to the magnetic field and direction exposition during electrodeposition.
Sample IDB [T]Pole
NoB0x
BUp 0.5 South
BDown 0.5 North
Publisher’s Note: MDPI stays neutral with regard to jurisdictional claims in published maps and institutional affiliations.

