
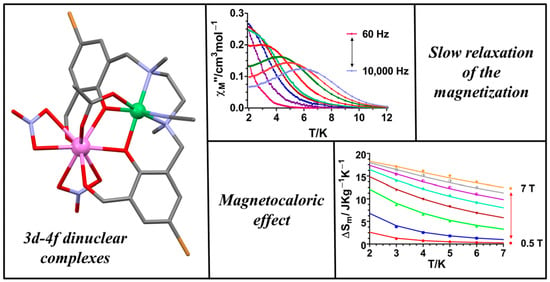
Synthesis, Structural Features and Physical Properties of a Family of Triply Bridged Dinuclear 3d-4f Complexes

 , , , ,
Abstract
:
1. Introduction
2. Results
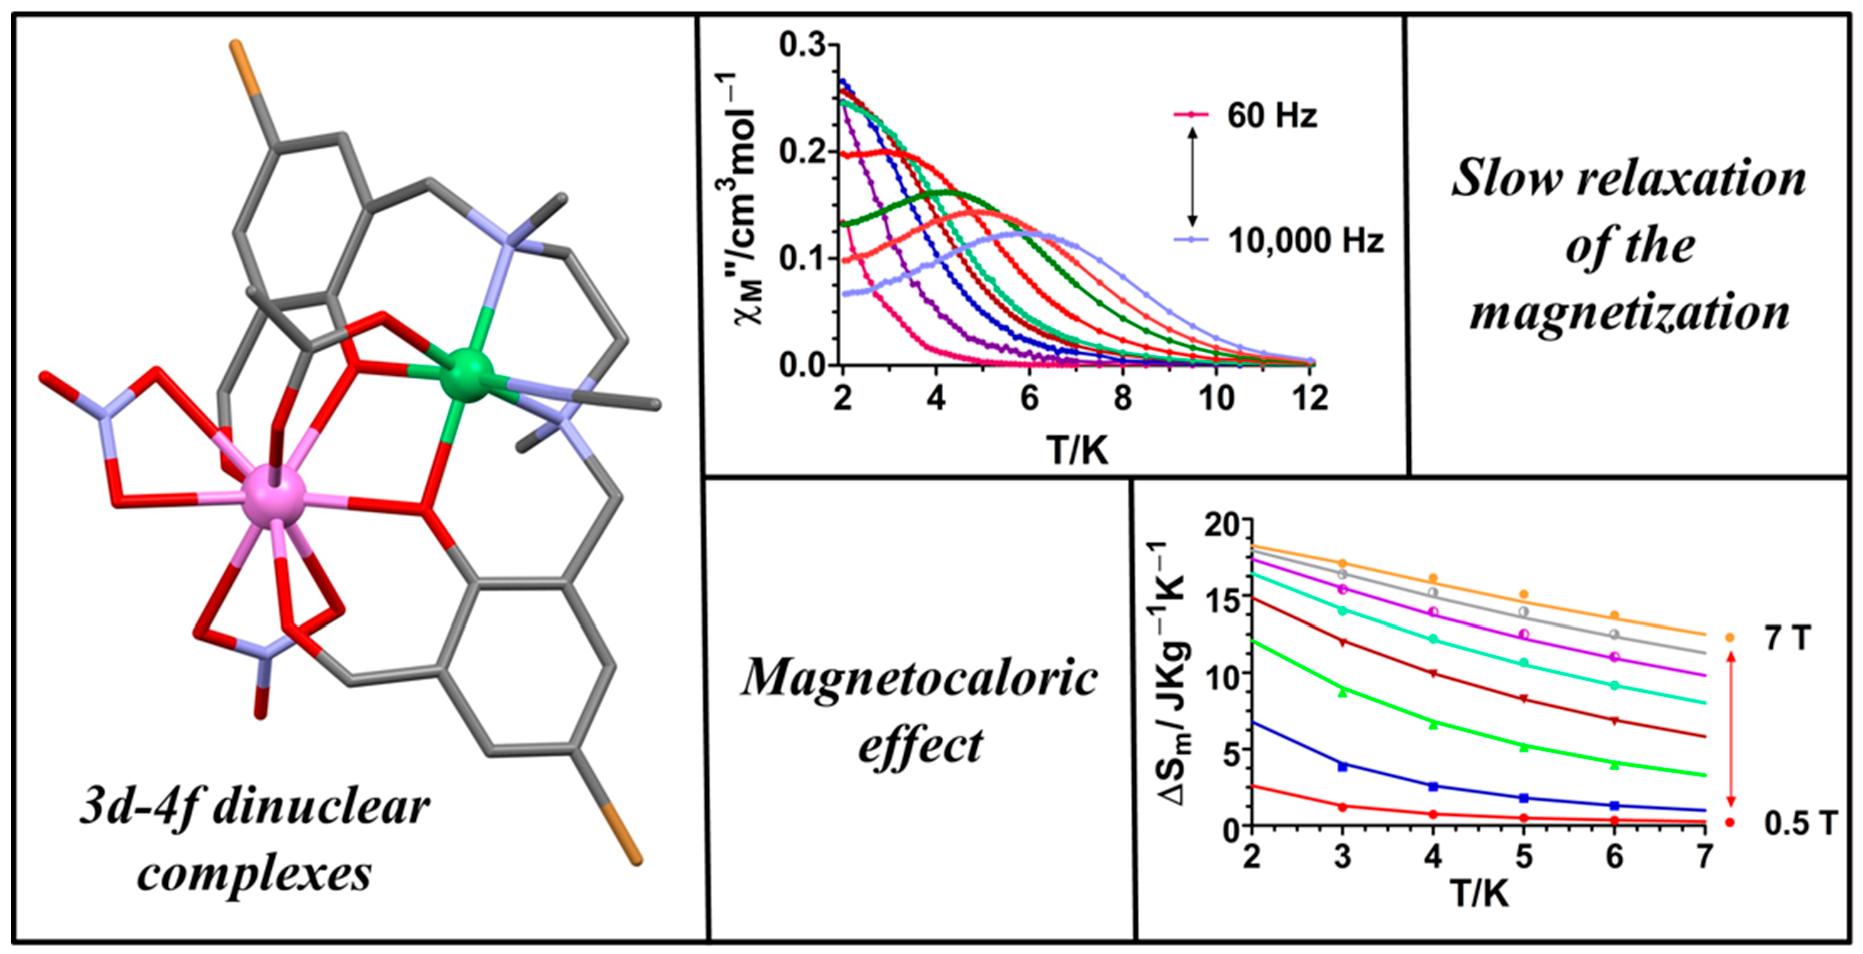
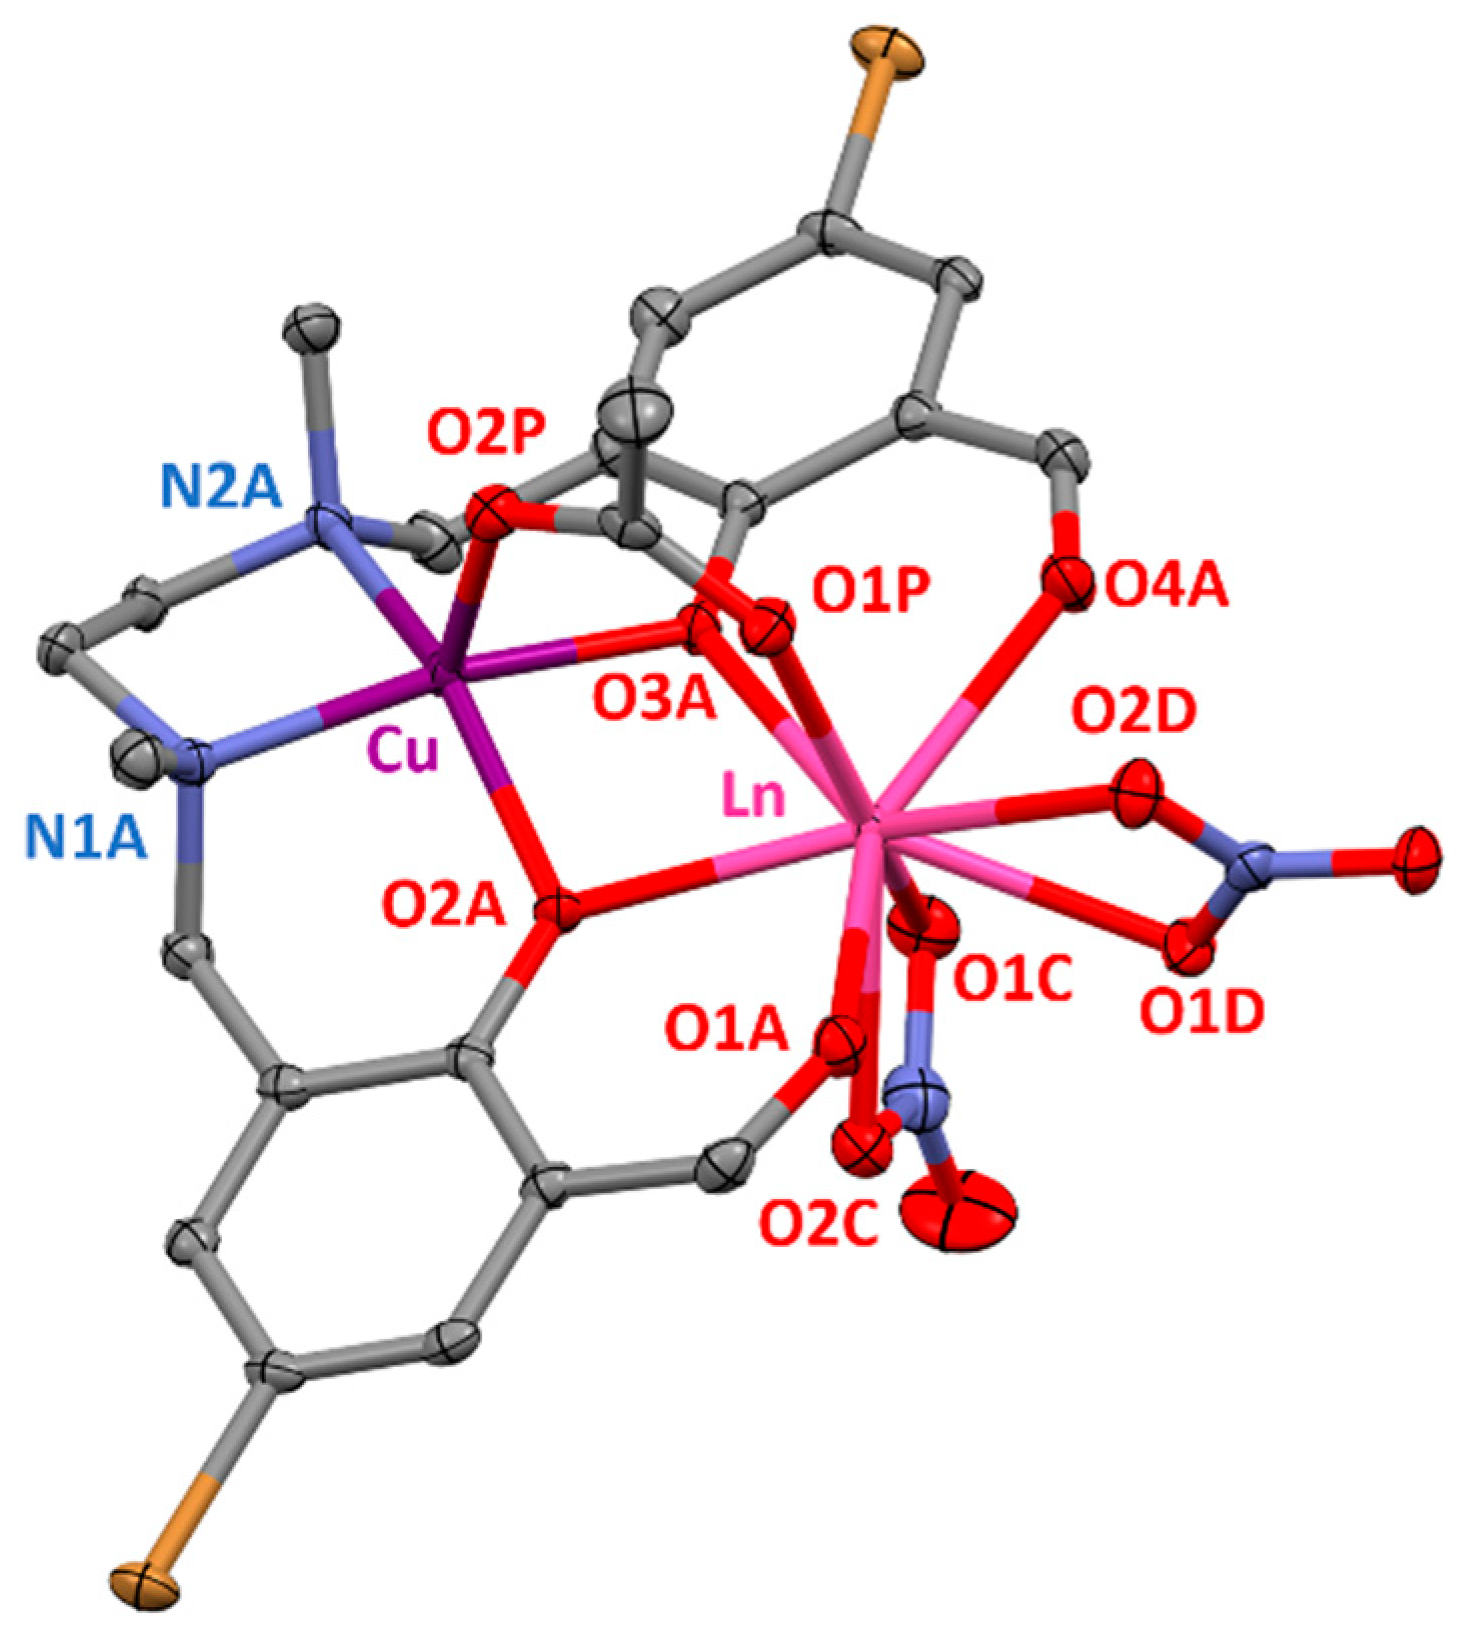
Crystal Structures
3. Discussion
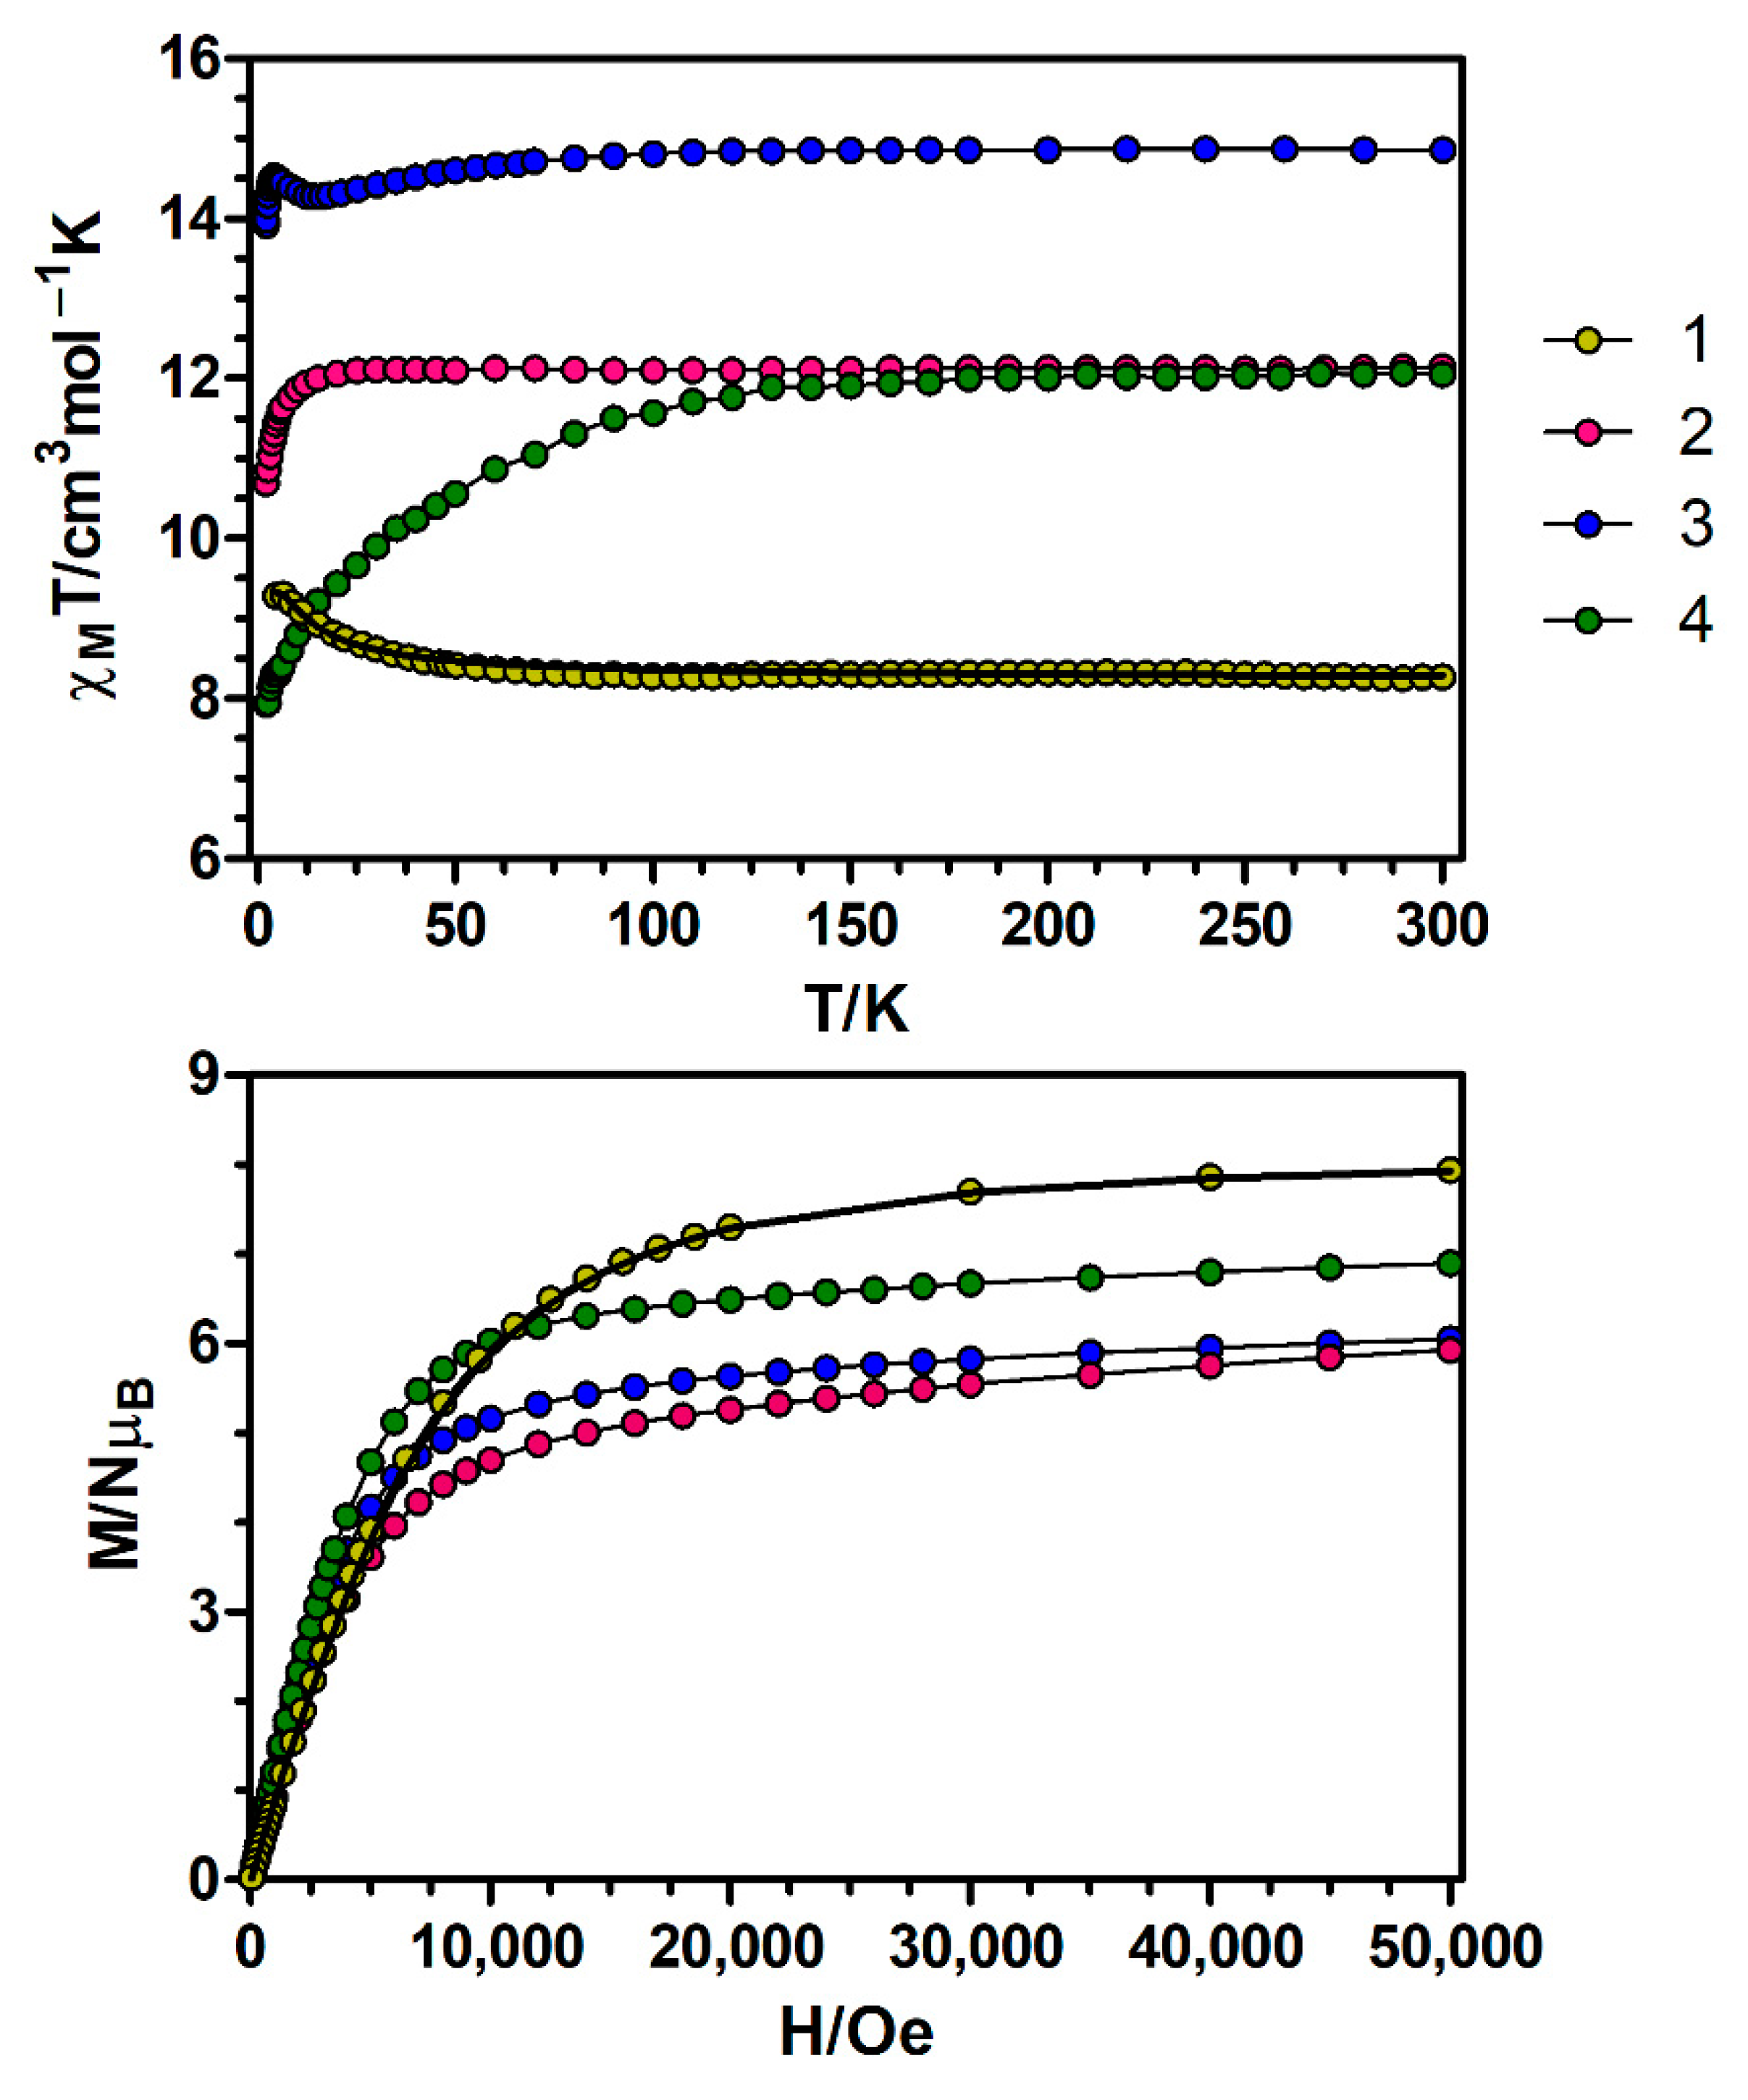
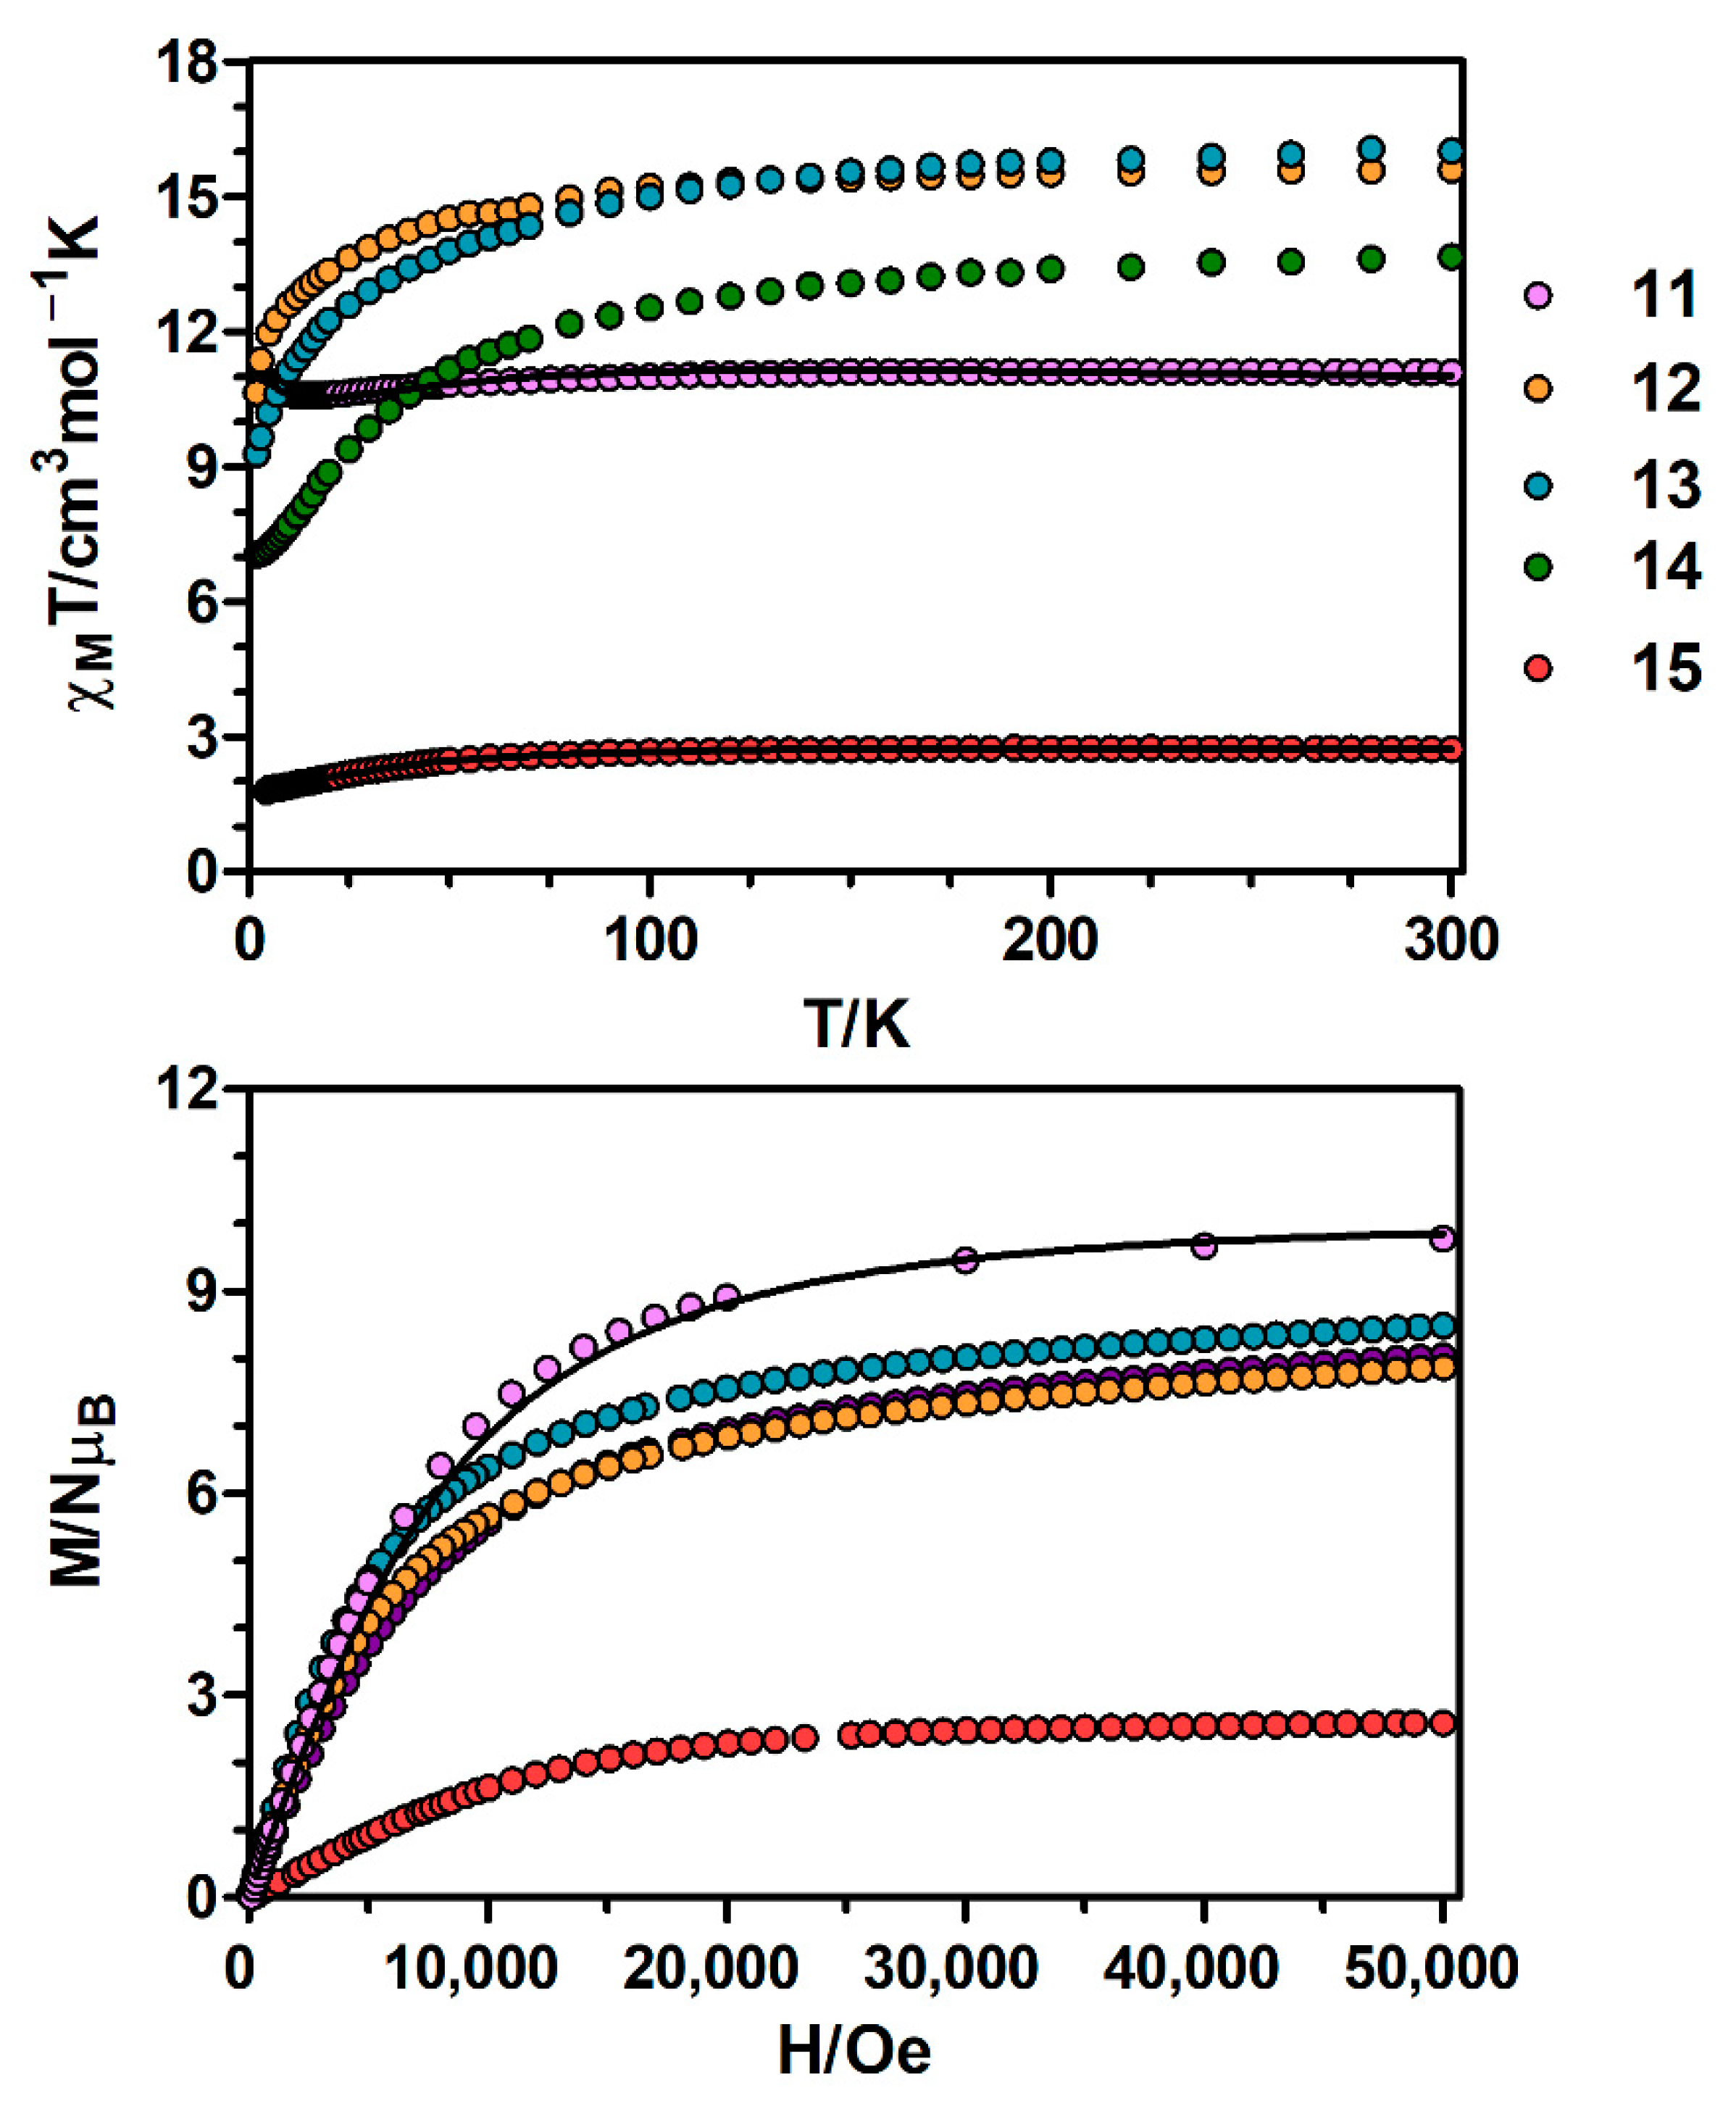
3.1. Magnetic Properties
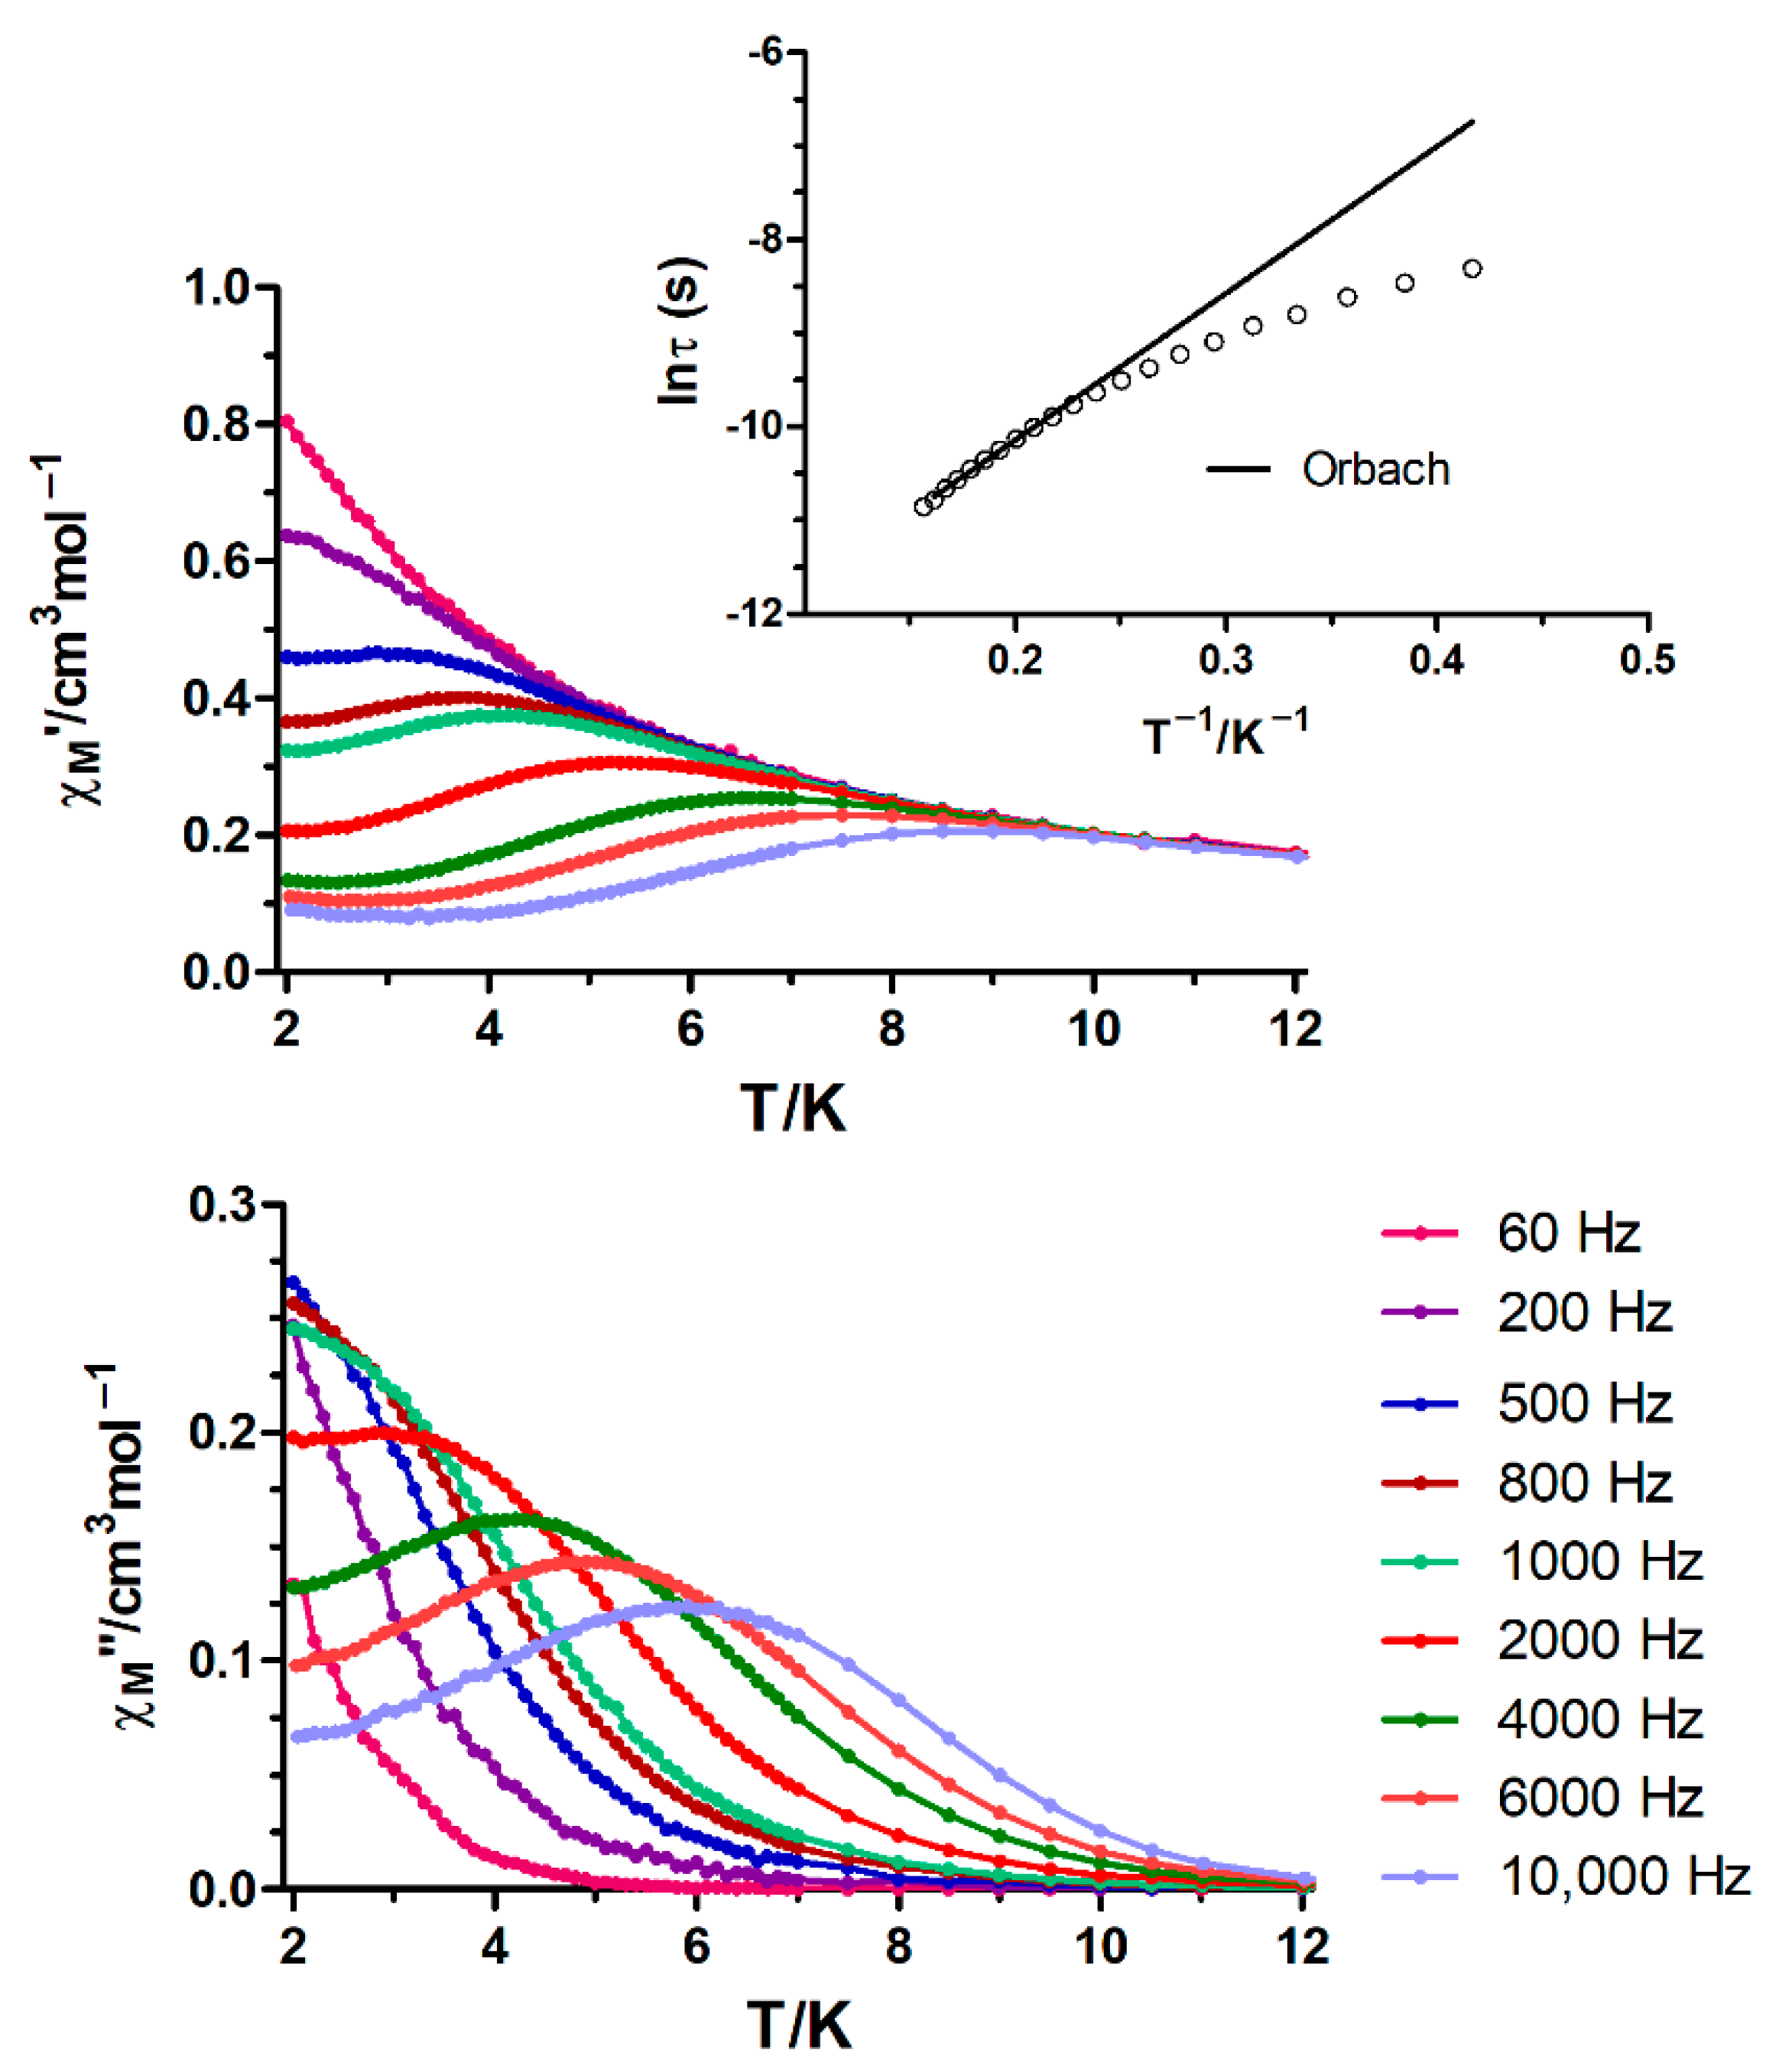
3.2. Dynamic Magnetic Properties
3.3. Magneto-Thermal Properties
4. Materials and Methods
4.1. General Procedures
4.2. Preparation of Complexes
4.3. Physical Measurements
4.4. Single-Crystal Structure Determination
4.5. Computational Details
5. Conclusions
Supplementary Materials
Author Contributions
Funding
Data Availability Statement
Acknowledgments
Conflicts of Interest
References
- Katoh, K.; Komeda, T.; Yamashita, M. The frontier of molecular spintronics based on multiple-decker phthalocyaninato TbIII single-molecule magnets. Chem. Rec. 2016, 16, 987–1016. [Google Scholar] [CrossRef] [PubMed]
- McAdams, S.G.; Ariciu, A.-M.; Kostopoulos, A.K.; Walsh, J.P.S.; Tuna, F. Molecular single-ion magnets based on lanthanides and actinides: Design considerations and new advances in the context of quantum technologies. Coord. Chem. Rev. 2017, 346, 216–239. [Google Scholar] [CrossRef] [Green Version]
- Feng, M.; Tong, M.L. Single ion magnets from 3d to 5f: Developments and strategies. Chem. Eur. J. 2018, 24, 7574–7594. [Google Scholar] [CrossRef]
- Layfield, R.A. Organometallic single-molecule magnets. Organometallics 2014, 33, 1084–1099. [Google Scholar] [CrossRef]
- Woodruff, D.N.; Winpenny, R.E.P.; Layfield, R.A. Lanthanide single-molecule magnets. Chem. Rev. 2013, 113, 5110–5148. [Google Scholar] [CrossRef]
- Escalera-Moreno, L.; Baldoví, J.J.; Gaita-Ariño, A.; Coronado, E. Spin states, vibrations and spin relaxation in molecular nanomagnets and spin qubits: A critical perspective. Chem. Sci. 2018, 9, 3265–3275. [Google Scholar] [CrossRef] [Green Version]
- Gatteschi, D.; Sessoli, R.; Villain, J. Molecular Nanomagnets; Oxford University Press: Oxford, UK, 2007. [Google Scholar]
- Clérac, R.; Winpenny, R.E.P. Single-molecule magnets and related phenomena. Struct. Bond. 2016, 172, 35–48. [Google Scholar] [CrossRef]
- Lanthanides and Actinides in Molecular Magnetism; Layfield, R.A.; Murugesu, M. (Eds.) Wiley-VCH: Weinheim, Germany, 2015. [Google Scholar]
- Tang, J.; Zhang, P. Lanthanide Single Molecule Magnets; Springer: Berlin/Heidelberg, Germany, 2015. [Google Scholar]
- Langley, S.K.; Wielechowski, D.P.; Vieru, V.; Chilton, N.F.; Moubaraki, B.; Abrahams, B.F.; Chibotaru, L.F.; Murray, K.S. A {CrIII2DyIII2} single-molecule magnet: Enhancing the blocking temperature through 3d magnetic exchange. Angew. Chem. Int. Ed. 2013, 52, 12014–12019. [Google Scholar] [CrossRef]
- Langley, S.K.; Wielechowski, D.P.; Vieru, V.; Chilton, N.F.; Moubaraki, B.; Chibotaru, L.F.; Murray, K.S. Modulation of slow magnetic relaxation by tuning magnetic exchange in {Cr2Dy2} single molecule magnets. Chem. Sci. 2014, 5, 3246–3256. [Google Scholar] [CrossRef]
- Chandra Mondal, K.; Sundt, A.; Lan, Y.; Kostakis, G.E.; Waldmann, O.; Ungur, L.; Chibotaru, L.F.; Anson, C.E.; Powell, A.K. Single-molecule magnets coexistence of distinct single-ion and exchange-based mechanisms for blocking of magnetization in a CoII2DyIII2 single-molecule magnet. Angew. Chem. Int. Ed. 2012, 51, 7550–7554. [Google Scholar] [CrossRef]
- Gupta, T.; Beg, M.F.; Rajaraman, G. Role of single-ion anisotropy and magnetic exchange interactions in suppressing zero-field tunnelling in {3d-4f} single molecule magnets. Inorg. Chem. 2016, 55, 11201–11215. [Google Scholar] [CrossRef] [PubMed]
- Reis, M.S. Magnetocaloric and barocaloric effects of metal complexes for solid state cooling: Review, trends and perspectives. Coord. Chem. Rev. 2020, 417, 213357. [Google Scholar] [CrossRef]
- Oyarzabal, I.; Artetxe, B.; Rodríguez-Diéguez, A.; García, J.Á.; Seco, J.M.; Colacio, E. A family of acetato-diphenoxo triply bridged dimetallic ZnIILnIII complexes: SMM behavior and luminescent properties. Dalton Trans. 2016, 45, 9712–9726. [Google Scholar] [CrossRef] [PubMed]
- Llunell, M.; Casanova, D.; Cirera, J.; Bofill, J.M.; Alemany, P.; Alvarez, S.; Pinsky, M.; Avnir, D. SHAPE; v1.1b; Universitat de Barcelona: Barcelona, Spain, 2005. [Google Scholar]
- Chilton, N.F.; Anderson, R.P.; Turner, L.D.; Soncini, A.; Murray, K.S. PHI: A powerful new program for the analysis of anisotropic monomeric and exchange-coupled polynuclear d- and f-block complexes. J. Comput. Chem. 2013, 34, 1164–1175. [Google Scholar] [CrossRef]
- Rajeshkumar, T.; Annadata, H.V.; Evangelisti, M.; Langley, S.K.; Chilton, N.F.; Murray, K.S.; Rajaraman, G. Theoretical studies on polynuclear {CuII5GdIIIn} clusters (n = 4, 2): Towards understanding their large magnetocaloric effect. Inorg. Chem. 2015, 54, 1661–1670. [Google Scholar] [CrossRef]
- Rajaraman, G.; Totti, F.; Bencini, A.; Caneschi, A.; Sessoli, R.; Gatteschi, D. Density functional studies on the exchange interaction of a dinuclear Gd(III)–Cu(II) complex: Method assessment, magnetic coupling mechanism and magneto-structural correlations. J. Chem. Soc. Dalton Trans. 2009, 3153–3161. [Google Scholar] [CrossRef]
- Mahapatra, P.; Koizumi, N.; Kanetomo, T.; Ishida, T.; Ghosh, A. A series of CuII-LnIII complexes of an N2O3 donor asymmetric ligand and a possible CuII-TbIII SMM candidate in no bias field. New J. Chem. 2019, 43, 634–643. [Google Scholar] [CrossRef]
- Costes, J.P.; Dahan, F.; Dupuis, A.; Laurent, J.-P. Nature of the magnetic interaction in the (Cu2+, Ln3+) pairs: An empirical approach based on the comparison between homologous (Cu2+, Ln3+) and (NiLS2+, Ln3+) complexes. Chem. Eur. J. 1998, 4, 1616–1620. [Google Scholar] [CrossRef]
- Costes, J.P.; Dahan, F.; Vendier, L.; Shova, S.; Lorusso, G.; Evangelisti, M. NiII-LnIII complexes with: O -vanillin as the main ligand: Syntheses, structures, magnetic and magnetocaloric properties. Dalton Trans. 2018, 47, 1106–1116. [Google Scholar] [CrossRef] [PubMed]
- Colacio, E.; Ruiz, J.; Mota, A.J.; Palacios, M.A.; Cremades, E.; Ruiz, E.; White, F.J.; Brechin, E.K. Family of carboxylate- and nitrate-diphenoxo triply bridged dinuclear NiIILnIII complexes (Ln = Eu, Gd, Tb, Ho, Er, Y): Synthesis, experimental and theoretical magneto-structural studies, and single-molecule magnet behavior. Inorg. Chem. 2012, 51, 5857–5868. [Google Scholar] [CrossRef] [Green Version]
- Roy, S.; Oyarzabal, I.; Vallejo, J.; Cano, J.; Colacio, E.; Bauza, A.; Frontera, A.; Kirillov, A.M.; Drew, M.G.B.; Das, S. Two polymorphic forms of a six-coordinate mononuclear cobalt(II) complex with easy-plane anisotropy: Structural features, theoretical calculations, and field-induced slow relaxation of the magnetization. Inorg. Chem. 2016, 55, 8502–8513. [Google Scholar] [CrossRef]
- Chandrasekhar, V.; Dey, A.; Mota, A.J.; Colacio, E. Slow magnetic relaxation in Co(III)–Co(II) mixed-valence dinuclear complexes with a CoIIO5 X (X = Cl, Br, NO3) distorted-octahedral coordination sphere. Inorg. Chem. 2013, 52, 4554–4561. [Google Scholar] [CrossRef] [PubMed]
- Modak, R.; Mondal, B.; Sikdar, Y.; Banerjee, J.; Colacio, E.; Oyarzabal, I.; Cano, J.; Goswami, S. Slow magnetic relaxation and water oxidation activity of dinuclear CoIICoIII and unique triangular CoIICoIICoIII mixed-valence complexes. Dalton Trans. 2020, 49, 6328–6340. [Google Scholar] [CrossRef]
- Colacio, E.; Ruiz, J.; Mota, A.J.; Palacios, M.A.; Ruiz, E.; Cremades, E.; Hänninen, M.M.; Sillanpää, R.; Brechin, E.K. CoIILnIII dinuclear complexes (LnIII = Gd, Tb, Dy, Ho and Er) as platforms for 1,5-dicyanamide-bridged tetranuclear CoII2LnIII2 complexes: A magneto-structural and theoretical study. C. R. Chim. 2012, 15, 878–888. [Google Scholar] [CrossRef] [Green Version]
- Basak, D.; van Leusen, J.; Gupta, T.; Kögerler, P.; Bertolasi, V.; Ray, D. Unusually distorted pseudo-octahedral coordination environment around CoII from thioether Schiff base ligands in dinuclear [CoLn] (Ln = La, Gd, Tb, Dy, Ho) complexes: Synthesis, structure, and understanding of magnetic behavior. Inorg. Chem. 2020, 59, 2387–2405. [Google Scholar] [CrossRef]
- Costes, J.P.; Dahan, F.; Dupuis, A.; Laurent, J.P. Une famille originale de complexes hétérodinucléaires Co(II)-Ln(III): Synthèse et étude magnétostructurale. C. R. Acad. Sci. Ser. IIc Chem. 1998, 1, 417–420. [Google Scholar] [CrossRef]
- Costes, J.-P.; Dahan, F.; Garcìa-Tojal, J. Dinuclear CoII/GdIII and CoIII/GdIII complexes derived from hexadentate Schiff bases: Synthesis, structure, and magnetic properties. Chem. Eur. J. 2002, 8, 5430–5434. [Google Scholar] [CrossRef]
- Zhao, X.Q.; Wang, J.; Bao, D.X.; Xiang, S.; Liu, Y.J.; Li, Y.C. The ferromagnetic [Ln2Co6] heterometallic complexes. Dalton Trans. 2017, 46, 2196–2203. [Google Scholar] [CrossRef]
- Watanabe, A.; Yamashita, A.; Nakano, M.; Yamamura, T.; Kajiwara, T. Multi-path magnetic relaxation of mono-dysprosium(III) single-molecule magnet with extremely high barrier. Chem. Eur. J. 2011, 17, 7428–7432. [Google Scholar] [CrossRef] [PubMed]
- Kajiwara, T.; Nakano, M.; Takahashi, K.; Takaishi, S.; Yamashita, M. Structural design of easy-axis magnetic anisotropy and determination of anisotropic parameters of LnIII-CuII single-molecule magnets. Chem. Eur. J. 2011, 17, 196–205. [Google Scholar] [CrossRef]
- Maeda, M.; Hino, S.; Yamashita, K.; Kataoka, Y.; Nakano, M.; Yamamura, T.; Kajiwara, T. Correlation between slow magnetic relaxation and the coordination structures of a family of linear trinuclear Zn(II)-Ln(III)-Zn(II) complexes (Ln = Tb, Dy, Ho, Er, Tm and Yb). Dalton Trans. 2012, 41, 13640–13648. [Google Scholar] [CrossRef] [PubMed]
- Liu, J.L.; Chen, Y.C.; Zheng, Y.Z.; Lin, W.Q.; Ungur, L.; Wernsdorfer, W.; Chibotaru, L.F.; Tong, M.L. Switching the anisotropy barrier of a single-ion magnet by symmetry change from quasi-D5h to quasi-Oh. Chem. Sci. 2013, 4, 3310–3316. [Google Scholar] [CrossRef]
- Titos-Padilla, S.; Ruiz, J.; Herrera, J.M.; Brechin, E.K.; Wersndorfer, W.; Lloret, F.; Colacio, E. Dilution-triggered SMM behavior under zero field in a luminescent Zn2Dy2 tetranuclear complex incorporating carbonato-bridging ligands derived from atmospheric CO2 fixation. Inorg. Chem. 2013, 52, 9620–9626. [Google Scholar] [CrossRef] [Green Version]
- Colacio, E.; Ruiz, J.; Ruiz, E.; Cremades, E.; Krzystek, J.; Carretta, S.; Cano, J.; Guidi, T.; Wernsdorfer, W.; Brechin, E.K. Slow magnetic relaxation in a CoII-YIII single-ion magnet with positive axial zero-field splitting. Angew. Chem. Int. Ed. 2013, 52, 9130–9134. [Google Scholar] [CrossRef] [PubMed] [Green Version]
- Palacios, M.A.; Titos-Padilla, S.; Ruiz, J.; Herrera, J.M.; Pope, S.J.A.; Brechin, E.K.; Colacio, E. Bifunctional ZnIILnIII dinuclear complexes combining field induced SMM behavior and luminescence: Enhanced NIR lanthanide emission by 9-anthracene carboxylate bridging ligands. Inorg. Chem. 2014, 53, 1465–1474. [Google Scholar] [CrossRef]
- Evangelisti, M.; Brechin, E.K. Recipes for enhanced molecular cooling. Dalton Trans. 2010, 39, 4672–4676. [Google Scholar] [CrossRef] [PubMed] [Green Version]
- Sharples, J.W.; Collison, D. Coordination compounds and the magnetocaloric effect. Polyhedron 2013, 54, 91–103. [Google Scholar] [CrossRef]
- Liu, J.-L.; Chen, Y.-C.; Guo, F.-S.; Tong, M.L. Recent advances in the design of magnetic molecules for use as cryogenic magnetic coolants. Coord. Chem. Rev. 2014, 281, 26–49. [Google Scholar] [CrossRef]
- Zheng, Y.Z.; Zhou, G.J.; Zheng, Z.; Winpenny, R.E.P. Molecule-based magnetic coolers. Chem. Soc. Rev. 2014, 43, 1462–1475. [Google Scholar] [CrossRef]
- Pavlishchuk, A.V.; Pavlishchuk, V.V. Principles for Creating “Molecular refrigerators” derived from gadolinium(III) coordination compounds: A review. Theor. Exp. Chem. 2020, 56, 1–25. [Google Scholar] [CrossRef]
- Colacio, E.; Ruiz, J.; Lorusso, G.; Brechin, E.K.; Evangelisti, M. A ferromagnetically coupled diphenoxo-bridged Gd3+–Mn2+ dinuclear complex with a large magneto-caloric effect. Chem. Commun. 2013, 49, 3845–3847. [Google Scholar] [CrossRef] [Green Version]
- Dinca, A.S.; Ghirri, A.; Madalan, A.M.; Affronte, M.; Andruh, M. Dodecanuclear [CuII6GdIII6] Nanoclusters as Magnetic Refrigerants. Inorg. Chem. 2012, 51, 3935–3937. [Google Scholar] [CrossRef]
- Liu, J.-L.; Lin, W.-Q.; Chen, Y.-C.; Gómez-Coca, S.; Aravena, D.; Ruiz, E.; Leng, J.-D.; Tong, M.-L. CuII-GdIII cryogenic magnetic refrigerants and Cu8Dy9 single-molecule magnet generated by in situ reactions of picolinaldehyde and acetylpyridine: Experimental and theoretical study. Chem. Eur. J. 2013, 19, 17567–17577. [Google Scholar] [CrossRef]
- Zheng, Y.-Z.; Evangelisti, M.; Winpenny, R.E.P. Large magnetocaloric effect in a Wells–Dawson type {Ni6Gd6P6} cage. Angew. Chem. Int. Ed. 2011, 50, 3692–3695. [Google Scholar] [CrossRef] [Green Version]
- Wang, P.; Shannigrahi, S.; Yakovlev, N.L.; Hor, T.S.A. Facile self-assembly of intermetallic [Ni2Gd2] cubane aggregate for magnetic refrigeration. Chem. Asian J. 2013, 8, 2943–2946. [Google Scholar] [CrossRef]
- Yonemura, M.; Matsumura, Y.; Ohba, M.; Okawa, H.; Fenton, D.E. Template synthesis of phenol-based heterodinucleating macrocycles with dissimilar N(amine)2O2 and N(imine)2O2 metal-binding sites. Chem. Lett. 1996, 25, 601–602. [Google Scholar] [CrossRef]
- CrysAlisPro Software System; Agilent Technologies UK Ltd.: Oxford, UK, 2012.
- Saint Software; Bruker AXS Inc.: Madison, WI, USA, 2009.
- Sheldrick, G.M. SADABS Program for Empirical Adsorption Correction; University of Göttingen: Göttingen, Germany, 1996. [Google Scholar]
- Sheldrick, G.M. SHELXTL Program for the Solution of Crystal of Structures; University of Göttingen: Göttingen, Germany, 1993. [Google Scholar]
- Astheimer, H.; Haase, W. Direct theoretical ab initio calculations in exchange coupled copper (II) dimers: Influence of structural and chemical parameters in modeled copper dimers. J. Chem. Phys. 1985, 85, 1427–1432. [Google Scholar] [CrossRef]
- Noodleman, L. Valence bond description of antiferromagnetic coupling in transition metal dimers. J. Chem. Phys. 1981, 74, 5737–5743. [Google Scholar] [CrossRef]
- Noodleman, L.; Li, J.; Zhao, X.G.; Richardson, W.H. Density Functional Studies of Spin Coupled Transition Metal Dimer and Tetramer Complexes. In Density Functional Methods: Applications in Chemistry and Materials Science; Springborg, M., Ed.; John Wiley and Sons: New York, NY, USA, 1997; pp. 149–188. [Google Scholar]
- Becke, A.D. Density-functional thermochemistry. III. The role of exact exchange. J. Chem. Phys. 1993, 98, 5648–5652. [Google Scholar] [CrossRef] [Green Version]
- Lee, C.; Yang, W.; Parr, R.G. Development of the Colle-Salvetti correlation-energy formula into a functional of the electron density. Phys. Rev. B 1988, 37, 785–789. [Google Scholar] [CrossRef] [Green Version]
- Vosko, S.H.; Wilk, L.; Nusair, M. Accurate spin-dependent electron liquid correlation energies for local spin density calculations: A critical analysis. Can. J. Phys. 1980, 58, 1200–1211. [Google Scholar] [CrossRef] [Green Version]
- Stephens, P.J.; Devlin, F.J.; Chabalowski, C.F.; Frisch, M.J. Ab Initio calculation of vibrational absorption and circular dichroism spectra using density functional force fields. J. Phys. Chem. 1994, 98, 11623–11627. [Google Scholar] [CrossRef]
- Frisch, M.J.; Trucks, G.W.; Schlegel, H.B.; Scuseria, G.E.; Robb, M.A.; Cheeseman, J.R.; Scalmani, G.; Barone, V.; Mennucci, B.; Petersson, G.A.; et al. Gaussian 09 Revision D.01; Gaussian, Inc.: Wallingford, CT, USA, 2009. [Google Scholar]
- Hurley, M.M.; Pacios, L.F.; Christiansen, P.A.; Ross, R.B.; Ermler, W.C. Ab initio relativistic effective potentials with spin-orbit operators. II. K through Kr. J. Chem. Phys. 1986, 84, 6840–6853. [Google Scholar] [CrossRef]
- Pritchard, B.P.; Altarawy, D.; Didier, B.; Gibson, T.D.; Windus, T.L. New Basis Set Exchange: An Open, Up-to-date Resource for the Molecular Sciences Community. J. Chem. Inf. Model. 2019, 59, 4814–4820. [Google Scholar] [CrossRef]
- Ruiz, E.; Cano, J.; Alvarez, S.; Alemany, P. Broken symmetry approach to calculation of exchange coupling constants for homobinuclear and heterobinuclear transition metal complexes. J. Comput. Chem. 1999, 20, 1391–1400. [Google Scholar] [CrossRef]
- Ruiz, E.; Alvarez, S.; Rodriguez-Fortea, A.; Alemany, P.; Pouillon, Y.; Massobrio, C. Magnetism: Molecules to Materials; Miller, J.S., Drillon, M., Eds.; Wiley-VCH: Weinheim, Germany, 2001; Volume 2, p. 5572. [Google Scholar]
- Ruiz, E.; Rodríguez-Fortea, A.; Cano, J.; Alvarez, S.; Alemany, P. About the calculation of exchange coupling constants in polynuclear transition metal complexes. J. Comput. Chem. 2003, 24, 982–989. [Google Scholar] [CrossRef]
- Ruiz, E.; Alvarez, S.; Cano, J.; Polo, V. About the calculation of exchange coupling constants using density-functional theory: The role of the self-interaction error. J. Chem. Phys. 2005, 123, 164110. [Google Scholar] [CrossRef]


| Complex | ST | J (cm−1) | −ΔSm Max (J·kg−1·K−1) | T/K |
|---|---|---|---|---|
| 1 | 4 | +2.3 | 17.1 | 3 |
| 6 | 9/2 | +0.7 | 17.4 | 3 |
| [Mn(CH3OH)(μ-L1)Gd(NO3)3] a | 6 | +0.99 | 23.5 | 2.7 |
Publisher’s Note: MDPI stays neutral with regard to jurisdictional claims in published maps and institutional affiliations. |
© 2021 by the authors. Licensee MDPI, Basel, Switzerland. This article is an open access article distributed under the terms and conditions of the Creative Commons Attribution (CC BY) license (http://creativecommons.org/licenses/by/4.0/).
Share and Cite
Oyarzabal, I.; Echenique-Errandonea, E.; San Sebastián, E.; Rodríguez-Diéguez, A.; Seco, J.M.; Colacio, E. Synthesis, Structural Features and Physical Properties of a Family of Triply Bridged Dinuclear 3d-4f Complexes. Magnetochemistry 2021, 7, 22. https://0-doi-org.brum.beds.ac.uk/10.3390/magnetochemistry7020022
Oyarzabal I, Echenique-Errandonea E, San Sebastián E, Rodríguez-Diéguez A, Seco JM, Colacio E. Synthesis, Structural Features and Physical Properties of a Family of Triply Bridged Dinuclear 3d-4f Complexes. Magnetochemistry. 2021; 7(2):22. https://0-doi-org.brum.beds.ac.uk/10.3390/magnetochemistry7020022
Chicago/Turabian StyleOyarzabal, Itziar, Estitxu Echenique-Errandonea, Eider San Sebastián, Antonio Rodríguez-Diéguez, José Manuel Seco, and Enrique Colacio. 2021. "Synthesis, Structural Features and Physical Properties of a Family of Triply Bridged Dinuclear 3d-4f Complexes" Magnetochemistry 7, no. 2: 22. https://0-doi-org.brum.beds.ac.uk/10.3390/magnetochemistry7020022