Article

Deciphering the Structural Characterization, Hirshfeld Surface Analysis, Raman Studies, and Temperature-Dependent Magnetodielectric Properties of BiMn2O5

1
Applied Physics Laboratory, Faculty of Sciences of Sfax, University of Sfax, B.P. 1171, 3000 Sfax, Tunisia
2
LIBPhys-UC, Departement of Physic, University of Coimbra, P-3004-516 Coimbra, Portugal
3
Regroupement Québécois sur les Matériaux de Pointe et Institut Quantique, Département de Physique, Université de Sherbrooke, Sherbrooke, QC J1K 2R1, Canada
4
Centre Énergie, Matériaux et Télécommunications, Institut National de la Recherche Scientifique, 1650, Boulevard Lionel-Boulet, Varennes, QC J3X 1S2, Canada
*
Author to whom correspondence should be addressed.
Submission received: 3 March 2021 / Revised: 10 May 2021 / Accepted: 12 May 2021 / Published: 16 May 2021
(This article belongs to the Special Issue Advanced Materials for Magnetic Cooling)

Abstract

:
We investigate the structural, Hirshfeld surface, magnetic, and magnetodielectric properties of BiMn2O5. The sample can be indexed with an orthorhombic phase associated with space group Pbam, with crystallographic parameters a = 7.54946 Å, b = 8.54962 Å and c = 5.753627 Å. The Hirshfeld surface analysis, associated with 2D fingerprint plots, was used to visualize and explore the significant intermolecular interactions in the crystal structure quantitatively. The Raman spectra, measured from 6 to 300 K in a frequency range between 250 and 750 cm−1, exhibit good agreement between the SHELL model calculations and the experimental measurement of the proximity of the phonon frequencies for our sample. Furthermore, magnetic measurements show that BiMn2O5 becomes antiferromagnetic below the Néel temperature (TN)—the temperature above which an antiferromagnetic material becomes paramagnetic (TN = 31 K). The relaxation at intermediate temperatures (200–300 K) can be attributed to the polar jump process at two charge transfer sites between the Mn3+ and Mn4+ ions, which, in combination with the special arrangement of the Mn3+/Mn4+ ions, is likely to produce the strong intrinsic magnetodielectric effect (MD) in the same temperature range.

1. Introduction

One of the most promising approaches to creating novel materials is the combination of different physical properties in one material in order to achieve rich functionality. Attempts to combine both ferromagnetic and ferroelectric (FE) properties in one system started in the 1960s, predominantly by two teams in the Soviet Union: the team of Smolenskii in St. Petersburg (then Leningrad) [1], and that of Venevtsev in Moscow [2]. Materials combining these different “ferroic” [3] properties were later called “multiferroics” [4]. Several new multiferroic systems were discovered [5,6,7,8] with rather spectacular properties, in particular very strong coupling between the ferroelectric and magnetic degrees of freedom. These also brought the much broader realization that with these new technical facilities, and with novel materials, one can think of many interesting and very promising applications, such as controlling magnetic memory by electric field or vice versa, new types of attenuators, etc. Multiferroic materials displaying intriguing magnetoelectric (ME) effects near room temperature are the focus of current interest, owing to their rich potential technological influence, along with noteworthy multifunctional device applications [9,10,11,12,13]. ME coupling offers additional degrees of freedom, wherein electric as well as magnetic polarization can be tailored, as it is sensitive to both the magnetic and electric fields [14]. However, the energy scales for controlling the magnetic and electrical properties are different. Coupling between dielectric and magnetic properties is possible in a material in which an optical phonon mode authorized by Raman exists [15]. In our work, we report on the determination of the vibration modes and the investigation of the coupling between the electric and magnetic orders using the magnetodielectric effect (MD) measurement of BiMn2O5.

2. Experimental Section

The BiMn2O5 was obtained as polycrystalline powder starting from precursors previously synthesized via a sol gel method using high-grade starting materials, according to the stoichiometric proportions of (Bi(NO3)3.5H2O) and (Mn2(NO3)2.4H2O). The precursors were dissolved in stoichiometric quantities in distilled water, and then we added the citric acid solution. Next, we added a few drops of ethylene glycol in order to homogenize the reaction. Using a hot plate equipped with a magnetic stirrer, the assembly was heated to 80 °C until the formation of a gel. Next, we heated the formed gel at 180 °C until we obtained a black powder. Then, the studied sample was repeatedly ground and heated for 24 h at 800 °C. After grinding, the powder was heated again for 24 h at 850 °C [16,17]. The room temperature X-ray diffraction (XRD) measurement was carried out using a Philips diffractometer with Cu K-alpha radiation. The diffraction patterns were refined using the Rietveld refinement method [18,19]. Dielectric measurements were performed using impedance spectroscopy, with the temperature and magnetic field regulated by the SQUID (Superconduction Quantum Interference Device) magnetometer installed at the Néel Institute in Grenoble. This magnetometer made it possible to carry out magnetization measurements from 2.2 to 400 K. The BiMn2O5 sample was placed on the cold finger of a microhelium Janis cryostat, and the Raman spectra were measured between 300 and 6 K. The exciting laser (632.8 nm) was forwarded through a 50× objective with weak intensity—less than 0.8 mW—in order to avoid local heating [20].

3. Results and Discussion

Figure 1 shows the XRD patterns of BiMn2O5 at room temperature. BiMn2O5 is of single phase with no detectable secondary phases. The Rietveld refinement of the XRD peaks was indexed to the single-phase orthorhombic perovskite system associated with space group Pbam [16,17,18]. The lattice parameters obtained from the Rietveld refinement were a = 7.54946 Å, b = 8.54962 Å, and c = 5.753627 Å, within which the following parameter relation was observed: b > a > c/√2. This relation indicates a static Jahn–Teller (J–T) distortion [21].
The Hirshfeld surfaces (HS) and the associated 2D fingerprint plots of the title compound were calculated using the Crystal Explorer 3.1 [22] program, which accepts a structure input file in the CIF format. The Hirshfeld surface enclosing a molecule is clarified by points where the contribution to the electron density from the molecule of interest is equal to the contribution from all of the other molecules. The Hirshfeld surface of BiMn2O5 is displayed in Figure 2, showing the surface that has been mapped over dnorm. The Hirshfeld surface surrounding the asymmetric unit is constructed based on the electron distribution calculated as the sum of the spherical atom electron densities. For each point on that isosurface, two distances appeared: the first one corresponds to de, representing the distance from the point to the nearest nucleus external to the surface; while the second one corresponds to di, representing the distance to the nearest nucleus internal to the surface. The normalized contact distance (dnorm), based on both de and di, as well as the van der Waals (vdw) radius of the atom, is obtained from Equation (1):
d n o r m = d i r i v d W r i v d W + d e r e v d W r e v d W
The value of dnorm is positive/negative when intermolecular contacts are longer/shorter than vdw separations, enabling the identification of the regions of particular interest in relation to intermolecular interactions. Graphical plots of the molecular Hirshfeld surface mapped with dnorm use the blue–white–red color scheme, with blue indicating the longer contact distances, white showing the contacts around the vdw separation, and red highlighting the shorter intermolecular contacts [23]. The shape index is the most sensitive to very subtle changes in surface shape; the information conveyed by the shape index is consistent with the 2D fingerprint plots. Curvedness is the measurement of ’’how much shape’’—the flat areas of the surface correspond to low values of curvedness, while sharp curvature areas correspond to high values of curvedness—and usually tends to divide the surface into patches, indicating interactions between neighboring molecules. The 2D fingerprint plots can be decomposed in order to highlight particular atom pair close contacts. This decomposition enables the separation of contributions from different interaction types, which overlap in the full fingerprint [24]. The surface has been mapped over a dnorm range of −0. 934–0.357 Å, and is presented in transparent mode to allow for the visualization of the molecular finasteride moiety. The Hirshfeld surface mapped to dnorm for our compound shows a larger red surface than the blue surface, and the value of dnorm is negative. Therefore, the intermolecular interactions are shorter range. The combination between di and de in the form of a two-dimensional fingerprint plot provides a concise summary of the intermolecular contacts within the crystal (Figure 3). Visible complementary regions are visible in the fingerprint plots, wherein one molecule acts as a donor (de > di) and the other as an acceptor (de < di). The analysis of the fingerprint plots reveals that the significant interactions that contributed to crystal packing within the BiMn2O5 were Bi–Mn (0.1%), Bi–O (23.7%), O–Mn (54.2%), and O–O (22.1%). In fact, the O–Mn interactions are predominant in our compound, with the greatest contributions at 54.2%. Each point on the 2D fingerprint plots corresponds to a unique (de, di) pair, and the color of each point corresponds to the relative area of the surface of that (de, di) pair. Points on the plots with no contribution to the surface are left uncolored, and points with a contribution to the surface are colored blue for a small contribution, through green, to red for the points with the greatest contribution. All of the fingerprint plots are colored on the same relative scale, so some of the fingerprint plots (including naphthalene, right) do not have any red points.
The BiMn2O5 crystallizes at room temperature in its orthorhombic phase, whose point group associated with this symmetry is D2h, depending on the BiMn2O5 symmetry. The different atomic locations of the optical modes are identified and associated with the different phonons of symmetry—Ag, B1g, B2g, and B3g—for the active modes in Raman. The Ag modes are obtained when the polarization of the scattered light is parallel to that of the incident light (xx, yy, or zz), while the B1g, B2g, and B3g modes are obtained when the polarization of the scattered light is perpendicular to that of incident light xy, xz, and yz, respectively (Table 1). Three of these modes—B1u, B2u, and B3u—are acoustic modes, while the A1u modes are optically inactive (silent) [25].
Factor group analysis for the Pbam symmetry of the paraelectric phases of these oxides yields a total of 48 Raman-active modes ( τ R a m a n = 13 A g + 13 B 1 g + 11 B 2 g + 11 B 3 g ) [26].
Figure 4 shows the Raman spectra of BiMn2O5 measured in the temperature range from 6 to 300 K for frequencies between 250 and 750 cm−1. From our Raman measurements, we noted that the positions of the Raman phonons on the same surface do not change from one point to another, and that their width at half height is of the order of a few units of measurement (cm−1). This indirectly ensures the homogeneity and very good crystalline quality of the BiMn2O5. To clearly assign the active Raman modes, w deconvoluted the Raman spectra of our sample at all temperatures. We used Fityk software with the Lorentzian function (Lorentzian A). At room temperature, we determined the vibration modes (Figure 5).
The Raman modes of BiMn2O5 at room temperature are classified in Table 2. Their energies are comparable with those obtained for theoretical calculations by Livintchuk et al. [27]. This comparison is very important in order to identify the symmetry and the nature of the movement of octahedra for the different Raman-active modes [28]. The most intense peaks (610–723) are the phonons that mainly involve the movement of oxygen atoms, while the intermediate peaks are the phonons that involve the movement of the oxygen and manganese atoms.
The SHELL model calculations are consistent with the measurements of the phonon frequencies in our sample. Figure 6 shows the evolution of the most intense Raman frequencies of Ag phonons as a function of temperature. In this analysis, we limit ourselves only to the most intense phonons (613 and 661 cm−1), which are easy to follow as a function of temperature. The frequencies of both of these phonons deviates from their regular anharmonic behavior, and hardens below T* ~ 65 K. According to previous studies [30], T* is a characteristic temperature attributed to the short magnetic correlations often observed just above the Néel transition temperature. Below T*, the modes studied show a clear change in behavior, with an abnormal softening on cooling up to TN = 31 K. Below TN, the modes show another change in behavior—the softening that appears during cooling up to TFE = 15 K represents the ferroelectric transition temperature. Figure 7a shows the DC magnetization of BiMn2O5 as a function of temperature in three different measurement protocols—zero-field cooled (ZFC), field-cooled cooling (FCC), and field-cooled warming (FCW)—with the conditions measured under an applied magnetic field of 0.5 kOe. TN = 31 K shows AFM coupling between Mn-spins corresponding to the temperature of divide between the ZFC and FCC measurements [17]. In the low-temperature AFM phase, there exist various magnetic interactions in BiMn2O5. The Mn4+ ions in the Mn4+O6 octahedra are linked to Mn3+O5 pyramids either through their pyramidal base corners (J3) or through the pyramid apex (J4), and the pyramids are linked to each other by their base edges (J5) (Figure 7b). The Mn3+/Mn4+ ions with AFM coupling along the a-axis form a zigzag chain, and the stacking of these chains along the b-axis leads to five nearest-neighbor magnetic interactions in the ab plane: Mn4+–Mn3+–Mn3+–Mn4+–Mn3+. These competing interactions give rise to the complex magnetic structure and the small FE polarization along the b-axis below TN in BiMn2O5 [31]. As shown in Figure 7c, the paramagnetic region obeys the Curie–Weiss law χ = C T Ө p , where C is the molar Curie constant and Өp is the paramagnetic Curie temperature. The paramagnetic Curie temperature Өp is found to be −210.59 K, implying the dominant antiferromagnetic interactions in BiMn2O5. The M–H curve at 5 K (Figure 7d) also exhibits nearly linear behavior with a small coercive field, implying that the magnetic ground state of BiMn2O5 may be antiferromagnetic along with the weak ferromagnetic interaction. In addition, the weak ferromagnetism may be due to the spin-canting AFM structure, via the Dzyaloshinskii–Moriya (DM) interaction, due to the distorted crystal structure with the octahedral tilting between the adjacent Mn–O octahedra [32]. Actually, the distorted crystal structure leading to the canted spin structure due to DM interaction may play an important role in multiferroic perovskites [33].
The MD coupling in multiferroic materials can be verified by probing the variation of dielectric parameters with the application of different static magnetic fields [34]. Temperature dependence tests of the dielectric parameters, such as dielectric constant (ε) and loss tangent (tan δ) measurements under different static magnetic fields (H = 0T and H = 3T), were performed at four frequencies—1, 10, and 100 kHz, and 1 MHz—for BiMn2O5 (Figure 8 and Figure 9). A significant and systematic decrease in the dielectric constant and loss tangent, coupled with an increase in the magnetic field (Figure 10a,b), implies the existence of magnetodielectric coupling. It was also found that the magnitude and dispersion of the dielectric constant remain nearly constant up to 95 K, and thereafter increase with the increase in temperature. The dielectric constant and loss tangent are sensitive to probe frequencies, where low frequencies (<10 kHz) significantly influence the nature and magnitude of the dielectric constant with an increase in temperature. In general, the dielectric constant in solids is mainly due to four types of polarizations: (1) space charge/interfacial polarization at grain boundaries and electrodes; (2) dipolar polarization; (3) atomic polarization; and (4) electronic polarization [35]. The interfacial and dipolar polarizations are strongly temperature dependent under the present probe range of frequencies. Figure 8 shows that the dielectric constant and the loss tangent initially decrease rapidly with increasing frequency [36]. We can see in Figure 9 that a peak with a high maximum is observed at frequencies below 1 MHz. Such peaks shift towards higher temperature as frequency increases. This behavior is typical of relaxor ferroelectrics [37]. At higher frequencies (1 MHz), the negative loss tangent is observed above a certain temperature. The negative dielectric loss may indicate that more energy is emitted than absorbed [38]. Because of the need to comply with the principle of energy conservation, there must be some mechanism in the material that allows energy to be stored and then released only at certain temperatures or/and frequencies. The negative dielectric loss may therefore be associated with the existence of uncompensated charges in the material. These charges can accumulate inside the material on the pores’ surfaces, and be anchored by the orbitals.
Based on the dielectric constants (ε) measured at H = 0T and H = 3T, we plotted the MD effect described by:
M D = ε ( H ) ε ( 0 ) ε ( 0 )
Figure 11 shows the magneto-dielectric (MD) effect at different frequencies. An important feature is that the MD curves at different frequencies exhibit a peak near 300 K. Moreover, the peak temperature of the MD curves increases and the maximum values of the MD effect vary from −10.5 to −9% upon increasing the frequency from 1 kHz to 1 MHz (i.e., this peak moves systematically with decreasing frequencies towards higher temperatures). The maximum MD effect is weak, which indicates the presence of a dipole relaxation induced by the field [39]. In addition, the maximum MD effect and the relaxation dependent on the magnetic field are in the same temperature region, indicating a close relationship between them. Considering this, the special arrangement of the Mn3+/Mn4+ ions in the ab plane—i.e., Mn4+–Mn3+–Mn3+–Mn4+–Mn3+—could play a similar role in BiMn2O5 [18]. The strong MD effect in BiMn2O5 likely comes from the special arrangement of the manganese ions correlated to the electron jump process between Mn3+ and Mn4+. More studies are still needed in order to understand the nature of the strong MD effect in BiMn2O5 [18].

4. Conclusions

In summary, the Raman spectra were investigated, measured from 6 to 300 K in a frequency range between 250 and 750 cm−1. The calculations in the SHELL model are consistent with the experimental measurement of the proximity of the phonon frequencies for our sample. The dielectric relaxation and the strong intrinsic MD effect were detected in the BiMn2O5 sample. The relaxation at intermediate temperatures (200–300 K) can be attributed to the polar jump process at two charge transfer sites between the Mn3+ and Mn4+ ions, which, in combination with the special arrangement of the Mn3+/Mn4+ ions, probably produces the strong intrinsic MD effect in the same temperature range.

Author Contributions

Conceptualization, H.F., E.D. and M.S.; Methodology, H.F., S.M., E.D., J.M. and M.S.; Investigation, E.D. and M.S.; Writing—original draft preparation, H.F.; Writing—review and editing, H.F. and M.S. All authors have read and agreed to the published version of the manuscript.

Funding

M.S. acknowledges funding from the Tunisian National Ministry of Higher Education, Scientific Research and Technology.

Data Availability Statement

The study did not report any data.

Conflicts of Interest

The authors declare no conflict of interest. The funders had no role in the design of the study; in the collection, analyses, or interpretation of data; in the writing of the manuscript, or in the decision to publish the results.

References

  1. Smolenskii, G.A.; Chupis, I.E. Ferroelectromagnets. J. Sov. Phys. Uspekhi 1982, 25, 475. [Google Scholar] [CrossRef]
  2. Venevtsev, Y.N.; Gagulin, V.V. Search, design and investigation of seignettomagnetic oxides. J. Ferroelectr. 1994, 162, 23. [Google Scholar] [CrossRef]
  3. Aizu, K. Possible Species of Ferromagnetic, Ferroelectric, and Ferroelastic Crystals. J. Phys. Rev. B 1970, 2, 754. [Google Scholar] [CrossRef]
  4. Schmid, H. Multi-ferroic magnetoelectrics. J. Ferroelectr. 1994, 162, 317. [Google Scholar] [CrossRef]
  5. Kimura, T.; Goto, T.; Shintani, H.; Ishizaka, K.; Arima, T.; Tokura, Y. Magnetic control of ferroelectric polarization. J. Nat. 2003, 426, 55. [Google Scholar] [CrossRef]
  6. Hur, N.; Park, S.; Sharma, P.A.; Ahn, J.S.; Guha, S.; Cheong, S.-W. Electric polarization reversal and memory in a multiferroic material induced by magnetic fields. J. Nat. 2004, 429, 392. [Google Scholar] [CrossRef]
  7. Lawes, G.; Harris, A.B.; Kimura, T.; Rogado, N.; Cava, R.J.; Aharony, A.; Entin-Wohlman, O.; Yildirim, T.; Kenzelmann, M.; Broholm, C.; et al. Magnetically Driven Ferroelectric Order in Ni3V2O8. J. Phys. Rev. Lett. 2005, 95, 087205. [Google Scholar] [CrossRef] [Green Version]
  8. Kimura, T.; Lawes, G.; Ramirez, A.P. Electric Polarization Rotation in a Hexaferrite with Long-Wavelength Magnetic Structures. J. Phys. Rev. Lett. 2005, 94, 137201. [Google Scholar] [CrossRef] [PubMed]
  9. Erenstein, W.; Mathur, N.D.; Scott, J.F. Multiferroic and magnetoelectric materials. J. Nat. 2006, 442, 759. [Google Scholar] [CrossRef]
  10. Hill, N.A. Why Are There so Few Magnetic Ferroelectrics. J. Phys. Chem. B 2000, 104, 6694. [Google Scholar] [CrossRef]
  11. Spaldin, N.A.; Cheong, S.-W.; Ramesh, R. Multiferroics: Past, present, and future. J. Phys. Today 2010, 63, 38. [Google Scholar] [CrossRef] [Green Version]
  12. Khomskii, D. Classifying multiferroics: Mechanisms and effects. Physics 2009, 2, 20. [Google Scholar] [CrossRef] [Green Version]
  13. Zhao, H.J.; Ren, W.; Yang, Y.; Íñiguez, J.; Chen, X.M.; Bellaiche, L. Near room-temperature multiferroic materials with tunable ferromagnetic and electrical properties. J. Nat. Commun. 2014, 5, 4021. [Google Scholar] [CrossRef] [PubMed]
  14. Dey, K.; Indra, A.; De, D.; Majumdar, S.; Giri, S. Magnetoelectric Coupling, Ferroelectricity, and Magnetic Memory Effect in Double Perovskite La3Ni2NbO9. ACS Appl. Mater. Interfaces 2016, 8, 12901. [Google Scholar] [CrossRef] [PubMed]
  15. Katsufuji, T.; Takagi, H. Coupling between magnetism and dielectric properties in quantum paraelectric EuTiO3. J. Phys. Rev. B 2001, 64, 054415. [Google Scholar] [CrossRef]
  16. Felhi, H.; Lahouli, R.; Smari, M.; Rahmouni, H.; Khirouni, K.; Dhahri, E. Study of the structural, electric and dielectric proprieties of Bi1-xNdxMn2O5 (x=0, x=0.1 and x=0.2). J. Mol. Strut. 2019, 1179, 1. [Google Scholar] [CrossRef]
  17. Felhi, H.; Smari, M.; Bajorek, A.; Nouri, K.; Dhahri, E.; Bessais, L. Controllable synthesis, XPS investigation and magnetic property of multiferroic BiMn2O5 system: The role of neodyme doping. J. Prog. Nat. Sci. Mater. 2019, 29, 178. [Google Scholar] [CrossRef]
  18. Yin, L.H.; Yuan, B.; Chen, J.; Zhang, D.M.; Zhang, Q.L.; Yang, J.; Dai, J.M.; Song, W.H.; Sun, J.Y.P. Dielectric relaxations and magnetodielectric response in BiMn2O5 single crystaApp. J. Phys. Lett. 2013, 103, 152908. [Google Scholar]
  19. Muñoz, A.; Alonso, J.A.; Casais, M.T.; MartínezLopez, M.J.; Martínez, J.L.; Fernadez-Díaz, M.T. Magnetic structure and properties ofBiMn2O5oxide: A neutron diffraction study. J. Phys. Rev. B 2002, 65, 1444423. [Google Scholar] [CrossRef] [Green Version]
  20. Mansouri, S.; Jandl, S.; Balli, M.; Fournier, P.; Ishii, Y.; Kimura, H.; Orlita, M.; Chaker, M. Origin of the enhanced ferroelectricity in multiferroic SmMn2O5. J. Phys. Rev. B 2019, 100, 085147. [Google Scholar] [CrossRef]
  21. Hemberger, J.; Lobina, S.; von Nidda, H.A.K.; Ivanov, V.Y.; Mukhin, A.A.; Balbashov, A.M.; Loidl, A. Complex interplay of 3d and 4f magnetism inLa1−xGdxMnO3. J. Phys. Rev. B 2004, 70, 024414. [Google Scholar] [CrossRef] [Green Version]
  22. Wolff, S.K.; Grimwood, D.J.; McKinnon, J.J.; Turner, M.J.; Jayatilaka, D.; Spackman, M.A. Crystal Explorer Version 3.1; University of Western Australia: Perth, Australia, 2012. [Google Scholar]
  23. Koenderink, J.J.; van Doorn, A.J. Surface shape and curvature scales. J. Image Vis. Comput. 1992, 557, 10. [Google Scholar] [CrossRef]
  24. Hajbi, M.; Abdi, M.; Loukil, M. Synthesis, crystal structure, Hirshfeld surface analysis, spectroscopic studies, electric and dielectric properties of the new Hg(II) complex with N,N-dimethy-p-toluidine ligand: [C9H14N]HgCl3. J. Ion. 2018, 24, 2355. [Google Scholar] [CrossRef]
  25. Nuzhnyy, D.; Petzelt, J.; Kamba, S.; Marti, X.; Cechal, T.; Brooks, C.M.; Schlom, D.G. Infrared phonon spectroscopy of a compressively strained (001) SrTiO3 film grown on a (110) NdGaO3 substrate. J. Phys. Condens. Matter 2011, 23, 045901. [Google Scholar] [CrossRef] [PubMed]
  26. Rousseau, D.L.; Bauman, R.P.; Porto, S.P.S. Normal mode determination in crystals. J. Raman Spectrosc. 1981, 10, 253. [Google Scholar] [CrossRef]
  27. Litvinchuk, A.P. Spin-phonon study of EuMn2O5 nanorods. J. Magn. Magn. Mater. 2009, 321, 2373. [Google Scholar] [CrossRef]
  28. Choi, Y.J.; Zhang, C.L.; Lee, N.; Cheong, S.-W. Cross-Control of Magnetization and Polarization by Electric and Magnetic Fields with Competing Multiferroic and Weak-Ferromagnetic Phases. J. Phys. Rev. Lett. 2010, 105, 097201. [Google Scholar] [CrossRef] [Green Version]
  29. Kumar, M.; Yadav, K.L. Study of dielectric, magnetic, ferroelectric and magnetoelectric properties in the PbMnxTi1−xO3 system at room temperature. J. Phys. Condens. Matter 2007, 19, 242202. [Google Scholar] [CrossRef] [PubMed]
  30. Garcia-Flores, A.F.; Granado, E.; Martinho, H.; Urbano, R.R.; Rettori, C.; Golovenchits, E.I.; Sanina, V.A.; Oseroff, S.B.; Park, S.; Cheong, S.-W. Anomalous phonon shifts in the paramagnetic phase of multiferroic RMn2O5 (R=Bi, Eu, Dy): Possible manifestations of unconventional magnetic correlations. J. Phys. Rev. B 2006, 73, 104411. [Google Scholar] [CrossRef] [Green Version]
  31. Chapon, L.C.; Blake, G.R.; Gutmann, M.J.; Park, S.; Hur, N.; Radaelli, P.G.; Cheong, S.W. Structural Anomalies and Multiferroic Behavior in Magnetically Frustrated TbMn2O5. Phys. Rev. Lett. 2004, 93, 177402. [Google Scholar] [CrossRef] [Green Version]
  32. Dzyaloshinsky, I. A thermodynamic theory of “weak” ferromagnetism of antiferromagnetics. J. Phys. Chem. Solids 1958, 4, 241. [Google Scholar] [CrossRef]
  33. Sergienko, A.; Dagotto, E. Role of the Dzyaloshinskii-Moriya interaction in multiferroic perovskites. J. Phys. Rev. B 2006, 73, 094434. [Google Scholar] [CrossRef] [Green Version]
  34. Pradhan, D.K.; Sahoo, S.; Barik, S.K.; Puli, V.S.; Misra, P.; Katiyar, R.S. Studies on magnetoelectric coupling in PFN-NZFO composite at room temperature. J. Appl. Phys. 2014, 115, 194105. [Google Scholar] [CrossRef]
  35. Kittel, C. Introduction to Solid State Physics, 8th ed.; John Wiley & Sons, Inc.: East Suite Bridgewater, NJ, USA, 2004. [Google Scholar]
  36. Fier, I.; Walmsley, L.; Souza, J.A. Relaxor behavior in multiferroic BiMn2O5 ceramics. J. Appl. Phys. 2011, 110, 084101. [Google Scholar] [CrossRef] [Green Version]
  37. Peliz-Barranco, A.; Caldern-Piar, F.; Garca-Zaldvar, O.; Gonzlez-Abreu, Y. Relaxor behaviour in ferroelectric ceramics. In Advances in Ferroelectrics; InTech: Rijeka, Croatia, 2012. [Google Scholar]
  38. Axelrod, E.; Puzenko, A.; Haruvy, Y.; Reisfeld, R.; Feldman, Y. Negative dielectric loss phenomenon in porous sol–gel glasses. J. Non Cryst. Solids 2006, 352, 4166. [Google Scholar] [CrossRef]
  39. Chandrasekhar, K.D.; Das, A.K.; Venimadhav, A. Spin glass behaviour and extrinsic origin of magnetodielectric effect in non-multiferroic La2NiMnO6 nanoparticles. J. Phys. Condens. Matter 2012, 24, 376003. [Google Scholar] [CrossRef] [PubMed]
Figure 1. XRD pattern of BiMn2O5.
Magnetochemistry 07 00068 g001
Figure 2. Hirshfeld surface analysis of BiMn2O5 dnorm, shape-index, and curvedness.
Magnetochemistry 07 00068 g002
Figure 3. Schematic of creating the fingerprint plots from a Hirshfeld surface. For each location on the surface, the distance to the nearest atom inside the surface (di) and the distance to the nearest atom outside the surface (de) are calculated. These (di, de) pairs are then binned into a two-dimensional histogram to form the fingerprint plots.
Magnetochemistry 07 00068 g003aMagnetochemistry 07 00068 g003b
Figure 4. Raman spectra of BiMn2O5 for different temperatures.
Magnetochemistry 07 00068 g004
Figure 5. Deconvolution of the Raman spectrum of our sample for T = 300 K.
Magnetochemistry 07 00068 g005
Figure 6. Evolution of the most intense Raman frequencies of Ag phonons as a function of the temperature between 6 and 300 K.
Magnetochemistry 07 00068 g006
Figure 7. (a) Temperature dependence of magnetization for BiMn2O5 in the FC, FCC, and ZFC modes. (b) The structure and AFM zigzag spin chains (dashed yellow lines) for BiMn2O5. (c) Temperature-dependent magnetization and inverse susceptibility. The solid line denotes the best fit to the data based on the Curie–Weiss law. (d) Field dependence of magnetization at 5 K.
Magnetochemistry 07 00068 g007
Figure 8. (a) Variation of ε as a function of the temperature for the BiMn2O5 sample in the absence of a magnetic field. (b) Variation of ε in the presence of a magnetic field (H = 3 tesla) at different frequencies.
Magnetochemistry 07 00068 g008
Figure 9. (a) Variation of tan δ as a function of temperature for the BiMn2O5 sample in the absence of a magnetic field. (b) Variation of tan δ in the presence of a magnetic field (H = 3 tesla) at different frequencies.
Magnetochemistry 07 00068 g009
Figure 10. (a) and (b) The zoom part of the dielectric constant and the loss tangent at a frequency of 1kHz, for 0T and 3T, respectively.
Magnetochemistry 07 00068 g010
Figure 11. Effects of MD (magnetodielectric) properties at different frequencies.
Magnetochemistry 07 00068 g011
Table 1. D2h Group.
Table 1. D2h Group.
D2hEC2 (z)C2 (y)C2 (x)iσ (xy)σ (xz)σ (yz)
Ag1111111  1       x 2 , y 2 , z 2
B1g11−1−111−1−1    R z     xy
B2g1−11−11−11−1    R y     xz
B3g1−1−111−1−1  1    R x     yz
Au1111−1−1−1−1
B1u11−1−1−1−11  1    x
B2u1−11−1−11−1  1    y
B3u1−1−11−111−1    z
Table 2. Experimental and theoretical frequencies of the Raman phonons of BiMn2O5 [29].
Modes Ag (cm−1)Modes B1g (cm−1)Modes B2g (cm−1)Modes B3g (cm−1)
CalcExp (300 K)CalcExp (300 K)CalcExp (300 K)CalcExp (300 K)
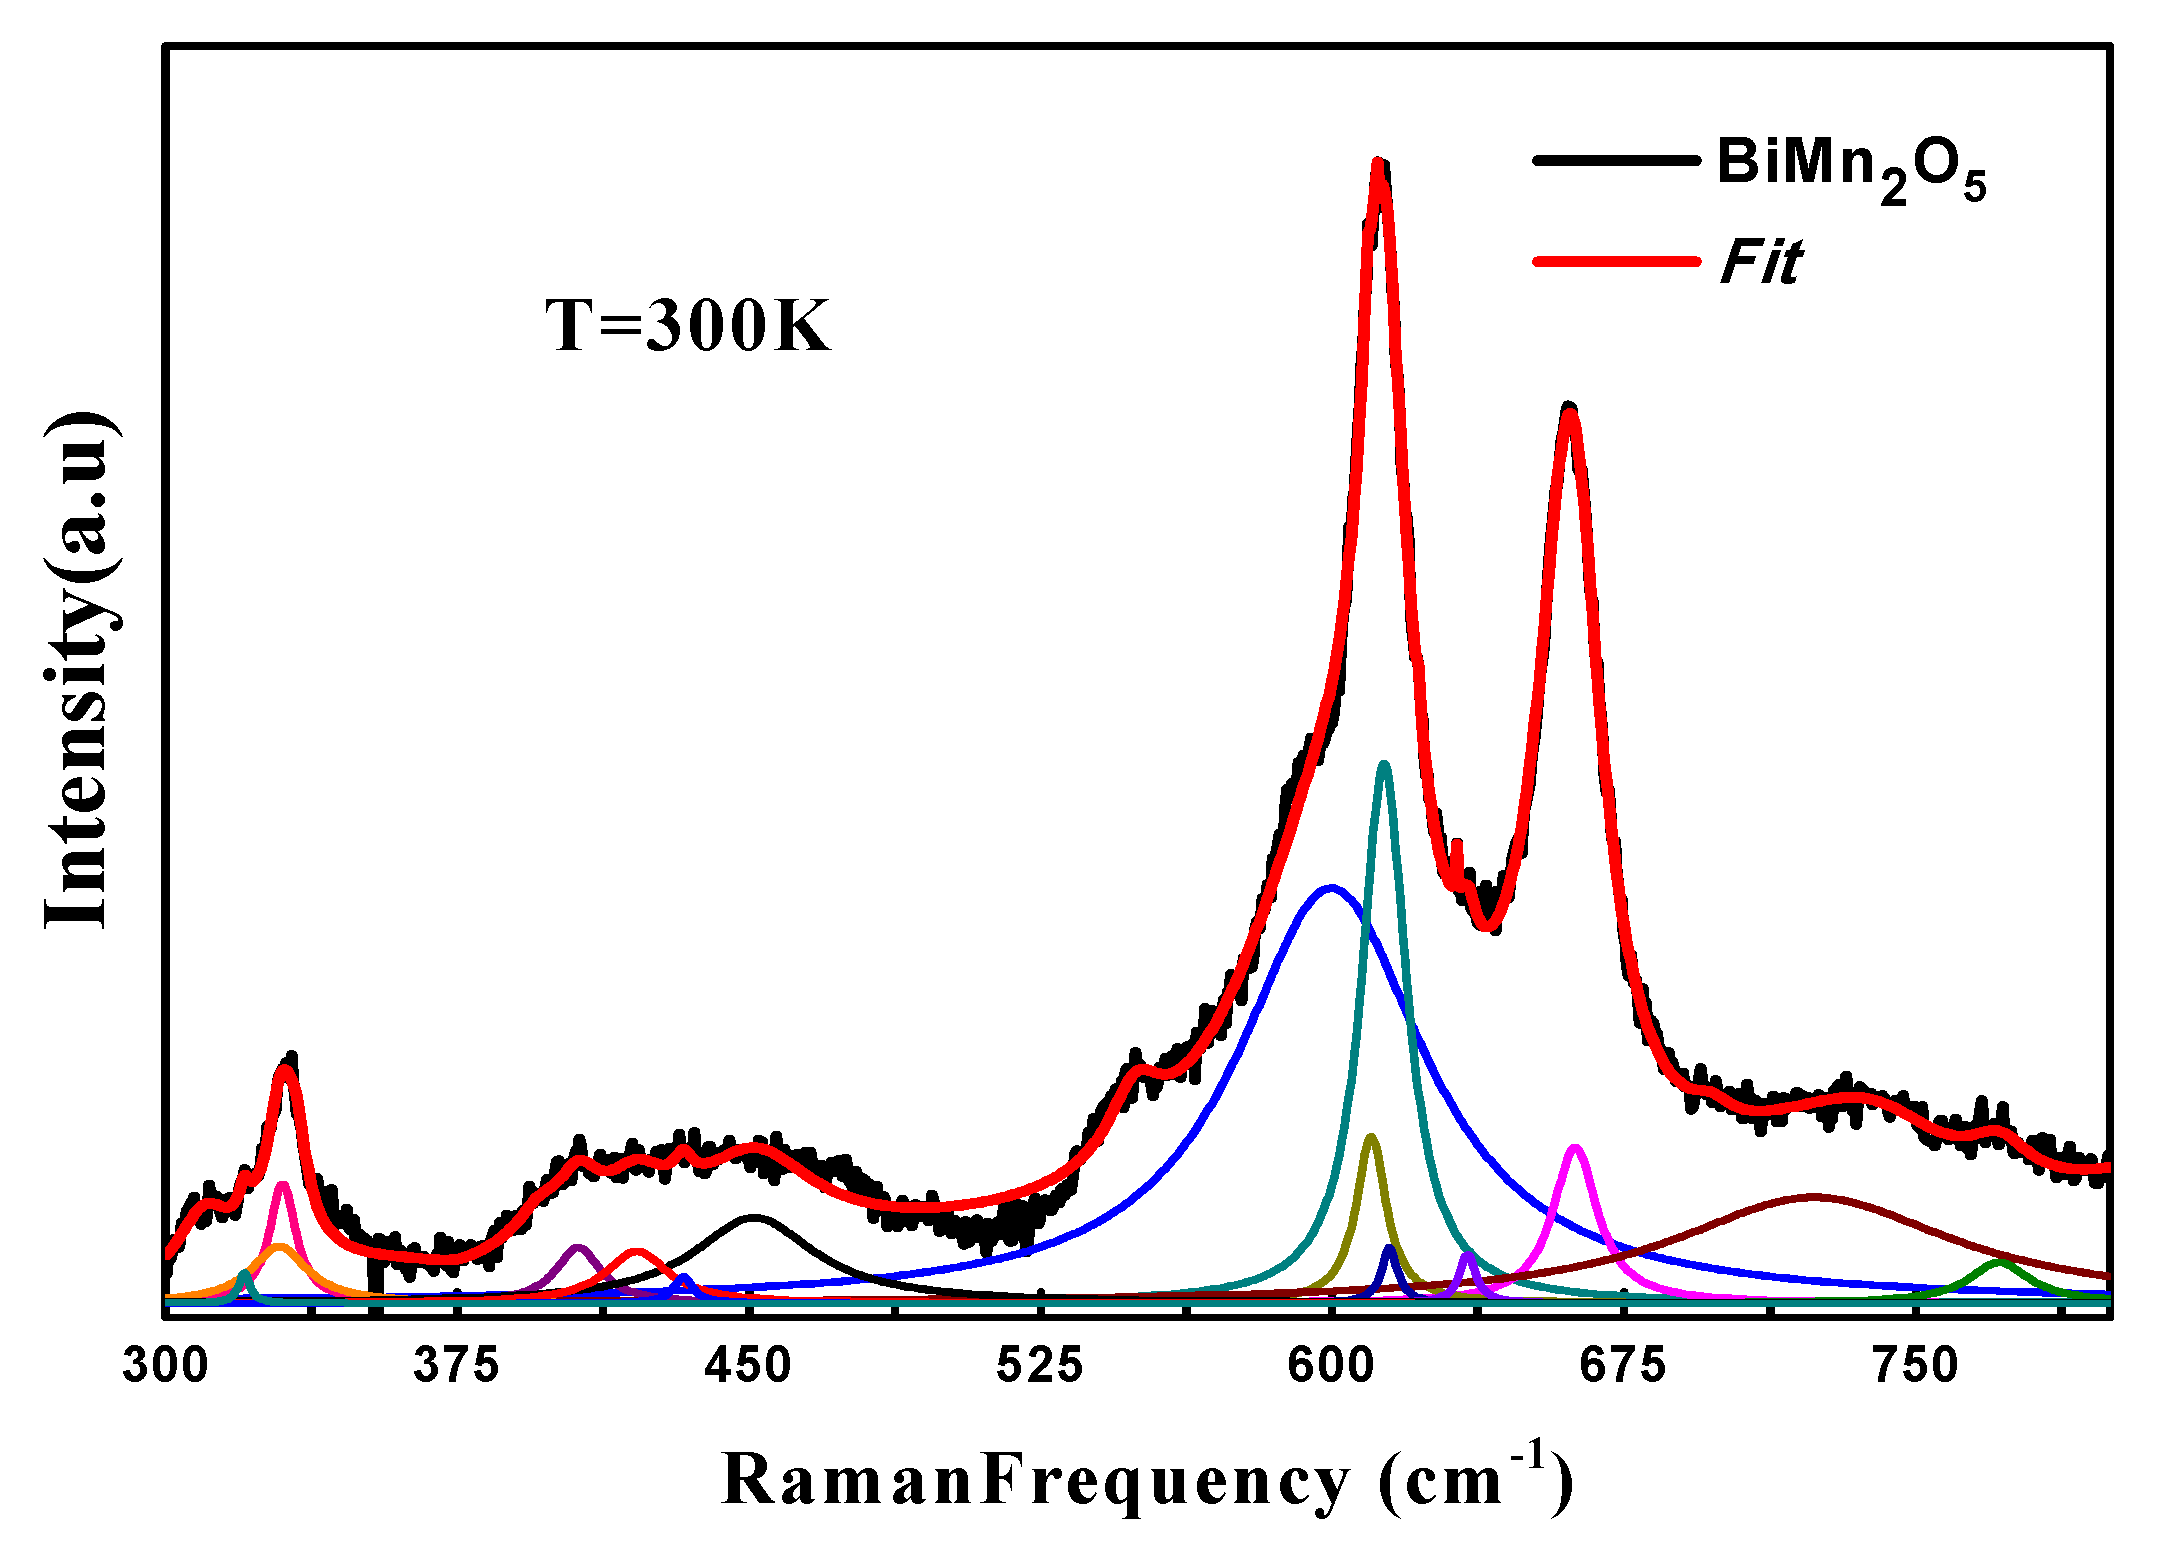
175
193
198
279
348
415
442
523
565
610
657
708
754
414
566
612
661
137
174
213
292
331
411
443
467
508
597
608
700
750
330
406
433
599
609
697
723
72
179
221
259
322
332
416
455
471
536
577
320
339
421
451
534
63
177
225
262
283
367
412
431
476
546
573
379
433
549
Publisher’s Note: MDPI stays neutral with regard to jurisdictional claims in published maps and institutional affiliations.

