Article

An Improved Transmissive Method of Stress Nondestructive Measurement Based on Inverse Magnetostrictive Theory for the Ferromagnetic Material

College of Intelligence Science and Technology, National University of Defense Technology, Changsha 410073, China
*
Author to whom correspondence should be addressed.
Submission received: 26 May 2021 / Revised: 9 July 2021 / Accepted: 13 July 2021 / Published: 19 July 2021

Abstract

:
In order to meet the technical requirements of non-destructive measurement for the internal stress of ferromagnetic materials represented by cold-rolled steel sheets during the rolling control process, the paper presents a novel method for the nondestructive measurement of ferromagnetic materials based on inverse magnetostrictive principle. By improving the traditional U-shaped sensor, a transmissive quadrapole layout is proposed. The corresponding excitation module and fast signal processing system for dynamic measurement were developed and the test system for detecting innerstress of ferromagnetic material was constructed in the laboratory. The relationship between the magnetic flux with the principal stress was found by experimental investigation and the sensitive correlation of the two was verified under the laboratory measurement conditions without strong electromagnetic interference. The influence of measurement results by sensor parameters such as sensor angle, amplitude of excitation current, variation of air gap were discussed in detail and a method was proposed to decrease the power supply instability caused by the change of the airgap. The experimental results show that the transmission quadrupole layout makes the test system exhibit a good linear response to the internal stress in the specimen. The feasibility of the magnetic detection method of internal stresses in ferromagnetic material was verified through the experiment.

1. Introduction

Ferromagnetic materials represented by high-performance steel are widely used in various fields of industrial production due to the characteristics of good mechanical properties and cost-effectiveness. Plate and strip are the main product of the iron and steel industry. The serious uneven deformation and residual stress of the steel plate generated during plastic pressure processing and heat treatment are the root causes of various flatness defects of the steel plate [1,2]. Therefore, the accurate measurement for internal stress distribution of the steel strip has become a fundamental and crucial technology for the effective control of steel strip products with excellent shape and quality [3]. The current mainstream products of flatness gauges for cold-rolled strip steel often use contact pressure detection split rollers, whose design structure is complicated, processing cost is expensive and the mass is large [4].Excessive inertia can easily cause slippage, which can scratch the steel strip in the contact measurement mode. Therefore, the high-precision non-destructive measurement technology is deemed to be the core technical during the production of thin-plate industrial ferromagnetic materials [5].
The magnetic measurement method for stress is a nondestructive testing method widely used in recent years, which possesses the advantages of high measurement speed, no radiation risk, non-contact measurement, etc. [6,7]. The magnetic method uses the influence of stress on the magnetic permeability, hysteresis effect and Barkhausen noise of the material [8]. Meanwhile, the magnetic measurement technology of stress can be used to identify defect for ferromagnetic material [9,10]. Magnetic measurement technology for stress can well overcome the defect of traditional contact pressure detection solutions [11]. The magnetoelastic sensors have shown promise to meet the requirements of stress monitoring of steel structural components, because they possess distinct advantages of actual stress measurement, noncontact monitoring and long service life [12]. Magnetoelastic characteristics of constructional steel indicate strong correlation between applied mechanical stress and magnetic parameters of the material. This correlation is strong enough to create a possibility of application presented magnetoelastic based methodology of non-destructive testing in stress assessment of constructional steel elements [13]. Meanwhile the magnetoelastic sensors have been demonstrated to monitor stresses in steel tendons and cables for more than a decade [14].
Based on the principle of inverse magnetostriction, the paper introduces a new method for the evaluation of stress in steel plate samples. By improving the traditional U-shaped sensor, a transmissive quadrapole layout is proposed, which is applied to ferromagnetic materials stress detection. A prototype model of the innovative method is designed, further with experimental studies being carried out.

2. Stress Detection Principle

2.1. The Detection Method Based on Inverse Magnetostrictive Theory

Magnetoelasticity stress measurement technology based on inverse magnetostrictive effect has been in-depth researched and applied successfully in force surveillance for structural parts and welding residual stress measurement [15,16]. However, the original unilateral magnetic measurement methods cannot meet the needs of the experimental test for online testing of internal stress in ferromagnetic materials such as sheet steel. By improving the traditional U-shaped sensor, a transmissive quadrapole layout based on inverse magnetostrictive theory is proposed.

2.2. Basic Idea of Detection Method for the Internal Stress

The magnetic detecting technique in this paper is different from conventional unilateral measurement method. The traditional detection approach of unilateral four magnetic sensors is changed to contralateral transmissive layout, which is introduced to the sheet steel detection system in this paper. There are two advantages of this arrangement method. First, the traditional unilateral sensor is generally formed by winding a coil with two U-shaped magnetic cores or a multi-pole magnetic core. When the two U-shaped magnetic cores are on the same side, in order to maintain the direction of the two magnetic cores at a certain angle, the two are very prone to mechanical contact, so the size or specifications of the magnetic cores will be limited. The multi-pole magnetic core has the problems of magnetic circuit mixing and coil winding difficulty. However, arranging the excitation sensor and the detection sensor on both sides of the steel plate to be tested can avoid these problems. Second, since the ferromagnetic material under the alternating excitation magnetic field will generate eddy current on the surface close to the excitation magnetic field side, the transmission type can reduce the influence of the eddy current on the magnetoelastic measurement method used in this paper. Figure 1 shows the arrangement of the sensors. The excitation coil applies a sinusoidal voltage with an amplitude of E and then an induction voltage with an amplitude of L will be obtained in the induction coil.
Depending on whether an excitation magnetic field is applied, magnetic detection method for stress could be classified into active and passive measurements. Active measurement method applied magnetic excitation field in the tested structure and determined the magnitude and distribution of stress in the components according to the changes of magnetic parameters or induction signal caused by the stress [17]. In order to detect stress and residual stress deep strip, AC excitation needs to be exploited to generate a large enough magnetic field and form a magnetic circuit. For these reasons, active magnetic measurement method was chosen in this experiment. Ignoring the effect of magnetic field leakage and other factors, when an alternating voltage E with a fixed frequency is applied to both ends of the excitation coil, alternating magnetic field will appear in the magnetic core, so will do on the surface of objects being tested. When objects being tested are acted by external forces or internal residual stresses, the magnetic permeability of ferromagnetic material will change by stresses. Depending on whether the material is positive magnetostrictive material and negative magnetostrictive material, the effect will be different. In addition, this will lead to distortion in magnetic field generated by the excitation coil, as a result, the detection coil is no longer located in the equal strength magnetic potential line. When the changing magnetic flux flows through the detection coil, an induced electromotive force will be generated, thus generating a voltage signal with a certain proportion to stress.

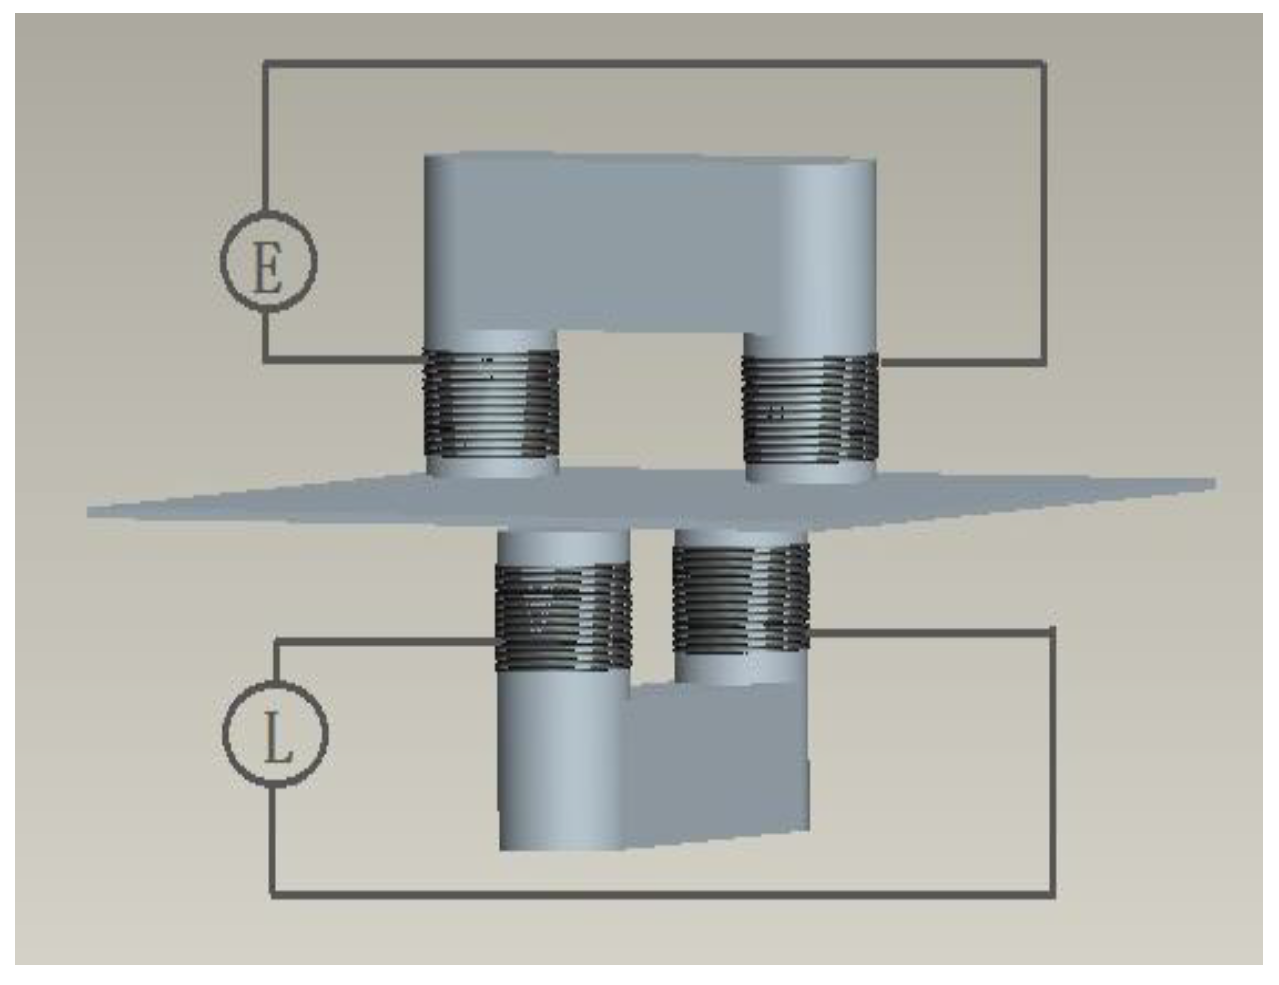
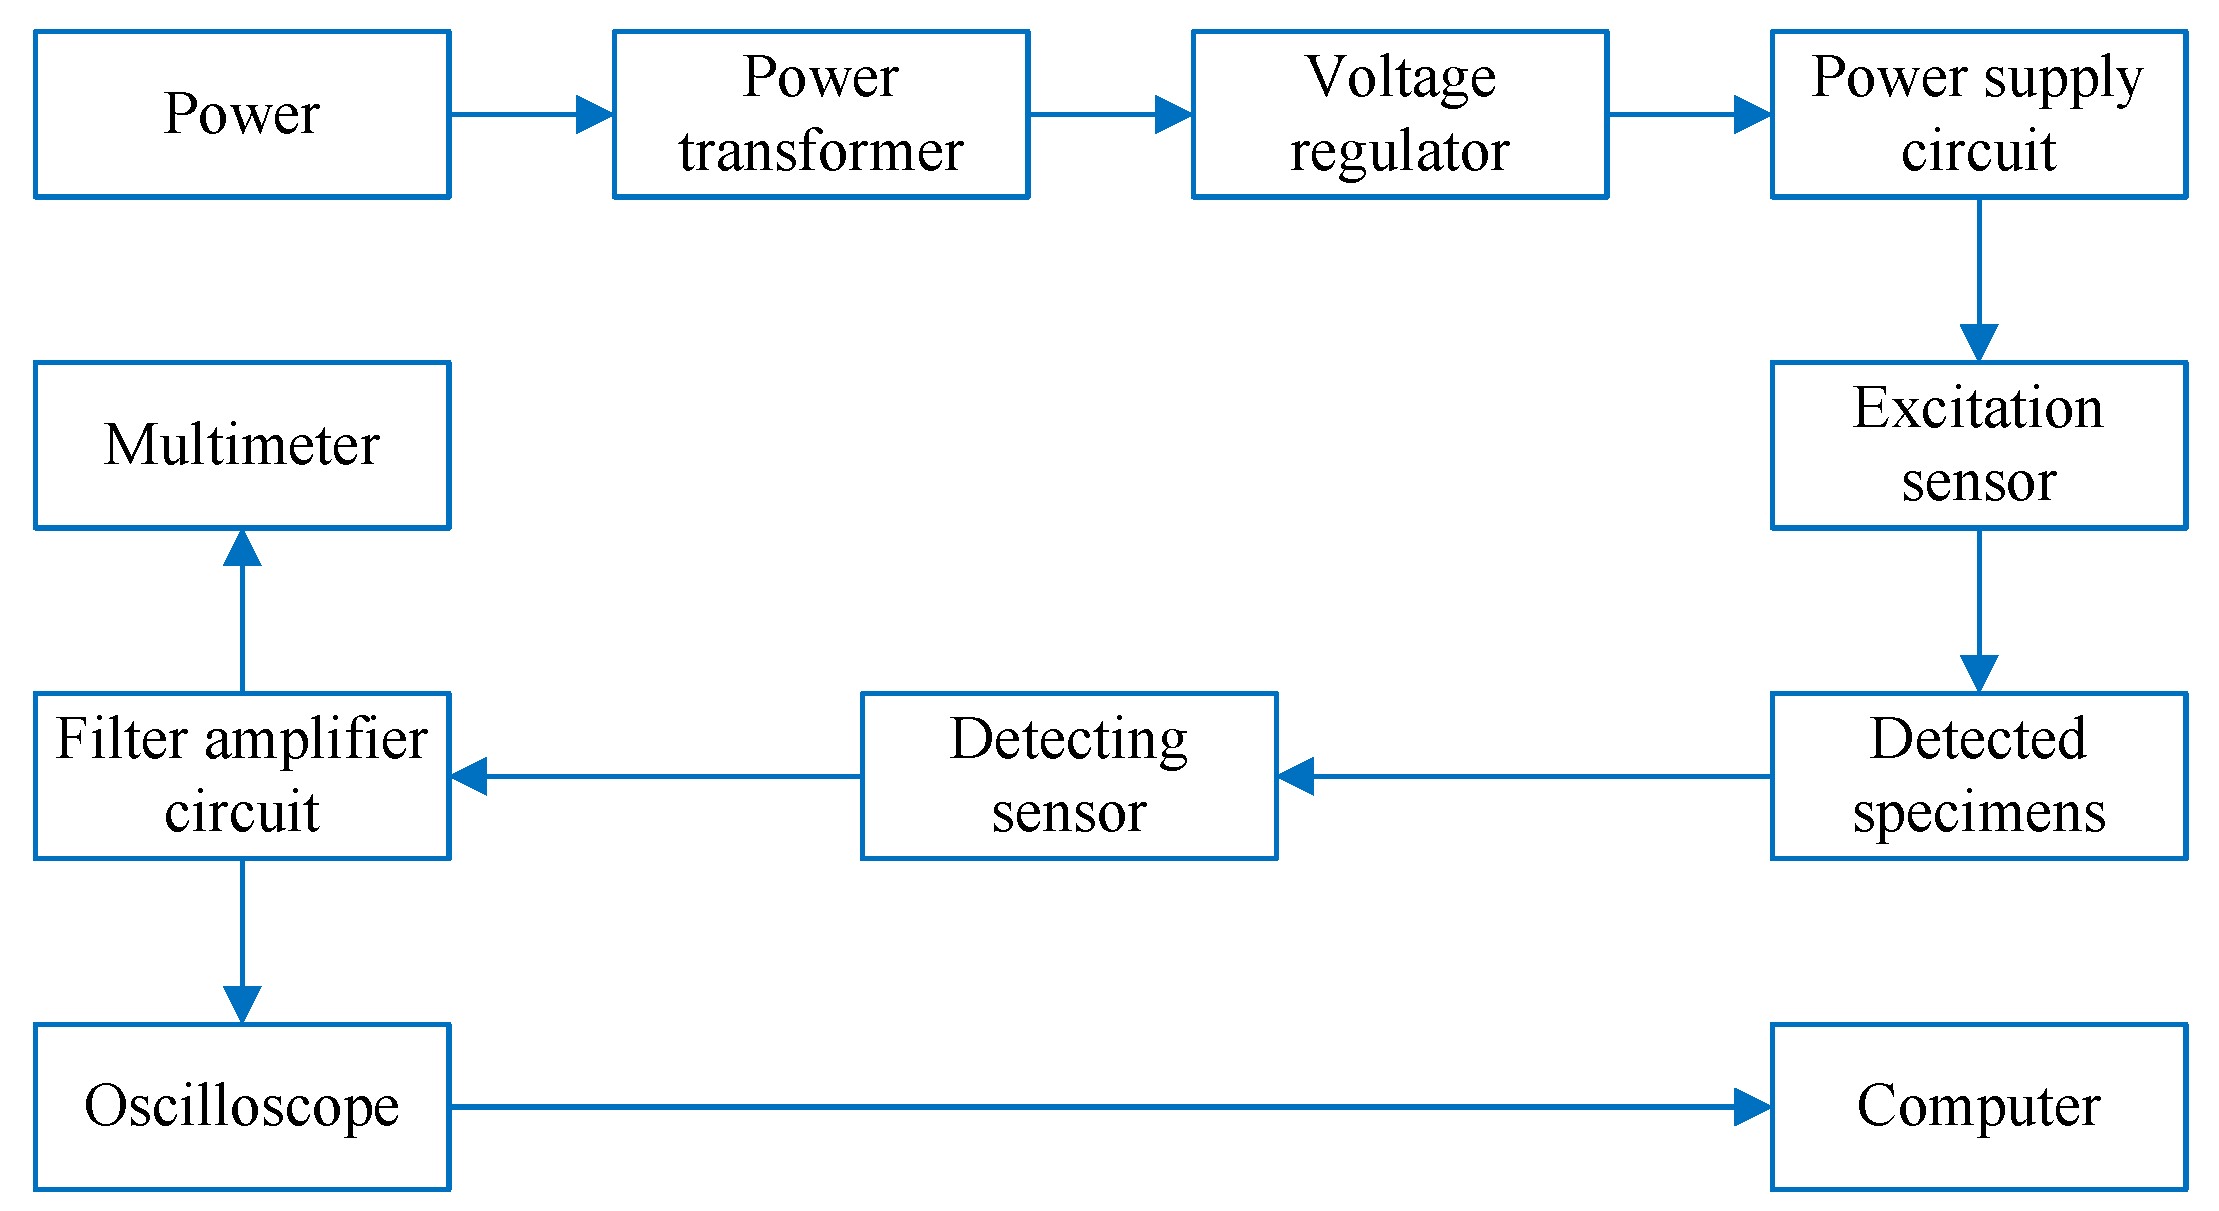
2.3. Specific Implementing Scheme of the Detection System

In order to obtain a sufficiently strong magnetic field and form a magnetic circuit, the iron core used in the experiment requires good permeability characteristics. The materials with good magnetic properties mainly include ferrite, silicon steel sheets, amorphous alloy, permeability alloy, etc. [18]. Soft magnetic ferrite is magnetic ferrous oxide, whose component is mainly Fe2O3. The soft ferrite produced by the powder metallurgy method is a ferrimagnetic oxide with Fe2O3 as the main component. There are Mn-Zn, Cu-Zn, Ni-Zn and other types. The ferrite, which might be a good material for the core of magnetoelastic sensor, considering its relatively high magnetostriction coefficient [19]. Under weak magnetic field conditions, the magnetic properties of ferrite materials such as saturation magnetic induction, permeability and operating frequency can meet the design requirements of stress sensors. Therefore, the ferrite material is selected as the magnetic core material of the sensor probe and its main technical parameters are as follows: curie temperature θ   =   120   ° C , initial permeability μ i = 2300 ± 25 % , saturated magnetostriction coefficient λ s = 27 × 10 - 6 , saturated magnetic induction intensity B s = 0 .41   T , density σ = 4.8   g / cm 3 , resistivity ρ = 6.5   Ω · m .
According to the principle of magnetic stress measurement, the measurement effect of the system is directly related to the strength and change of the magnetic field around the sensor and the strength of the magnetic field mainly depends on the number of turns of the exciting coil and the current through the coil. The intensity of magnetic field mainly depends on the number of turns of excitation coil and current through it. When the range of the intensity of magnetic field in experiments is determined, the number of excitation coil can be roughly calculated by the following equation:
N e = H l I e
In the equation, N e is the number of turns of excitation coil, H is the designed intensity of magnetic field, I e is the excitation current, l is the average length of magnetic circuit.
At the same time, the number of turns of excitation coil and detection coil also has a pronounced influence on the sensitivity. Based on the experiment, the influence of the number of turns on the sensor output characteristic is studded. The number of turns of excitation coil in experiments is 200–500.
Normally under the precondition of the same current, the more number of the turns of the coil is, the stronger the magnetic field is. To increase the number of turns, high strength enameled wire with small cross-sectional area can be chosen. Generally, enameled wire, the diameter of which between 0.05–2.5 mm is selected, the current density of copper conductor is allowed to be 2–5 A/mm2.For copper enameled wire, the number of conductor maximum load flow can be calculated by the empirical formula:
I e = σ · S = σ · 0.25 π d 2
In this experiment, the RLC parallel resonant circuit is used as the excitation circuit. The power supply consists of a power transformer and a voltage regulator with a frequency of 50 Hz. The frequency of the parallel resonance circuit can be calculated:
f 0 = 1 2 π L C × 1 - C R 2 L
Generally, the resistance of the inductance coil is too small to be considered in the computing of Formula (3). Hence, C R 2 / L = 0 , Q >> 1. Then, the oscillation frequency can be obtained as:
f 0 = 1 2 π L C
The resonance of the circuit is generated under the premise that the adjustable parameters of the circuit are satisfying the formular (4). In this experimental progress, the parallel resonance circuit is paralleled with a capacitance and animpedancecascaded by controllable impedance and excitation sensor.
External factors can easily interfere with the detected signals in the experimental progress. As harmonic waves except the fundamental impose a strong interference effect on the detected signals, so this paper introduces active second order band-pass filter consisting of operational amplifier and RC network as the signal processing circuit in the signal receiving terminal. The multi-loop band-pass filter has advantages of few elements and low output impedance. The band-pass filter is adopted in this paper, with center frequency of 50 Hz and bandwidth of 10 Hz, was tested to better meet the design requirements.

3. Magnetic Circuit Analysis

3.1. Inverse Magnetostrictive Effect of Ferromagnetic Materials

The phenomenon in which the change in the magnetization state of the ferromagnetic material is accompanied by the change in the material size is called the magnetostrictive effect of the material. On the contrary, the ferromagnetic material is deformed under the action of external force such as tensile force, torsion force, etc. and the phenomenon that the magnetization will change accordingly is called the inverse magnetostrictive effect (or magnetoelastic effect or pressure magnetic effect) of ferromagnetic material [20,21].
In this case, the material shows anisotropic. Therefore, the change of strain or stress state will cause a change with magnetic permeability or magnetic resistance of ferromagnetic material. By providing a constant MMF for magnetic anisotropy sensor, the magnetic reluctance variation causes a change in magnetic flux, which will be detected by the altering of the sensor coil induced EMF [22]. The hysteresis loop of the material can be obtained by recording the voltage of excitation coil and the current value of induction coils under different stress conditions, which can determine the relationship between internal stress and magnetic parameters of material [23,24]. Then, the non-electrical quantity as stress and strain can be converted into an electrical signals (such as voltage) to meet the stress test purpose. This is the basic principle of the measurement of stress by the inverse magnetostrictive effect, whose transformation process can be expressed as: F Δ σ Δ μ Δ R m Δ V , where Δσ is the stress variation; Δμ is the magnetic permeability variation of ferromagnetic material; ΔRm is the magnetic resistance variation; ΔV is the sensor output voltage variation.

3.2. Magnetomechanical Model of the Permeability and Stress

The ferromagnetic material under the effect of mechanical force will produce strain within it, thus producing stress σ resulting to the change of permeability μ. It will produce stress under the external force as well [25,26,27]. When the ferromagnetic material produces stress because of the stretch during magnetization (due to any reason), there must be magnetoelastic energy E σ inside. The analysis indicates that E σ is in proportion to the product of λ m and σ and is related to the angle between the magnetization direction and the stress direction. λ m means magnetostrictive coefficient. The magnetization direction will change due to E σ . On the basis of the effect of stress on the magnetic properties and the achievement of relevant researchers [28], the magnetomechanical model can be developed for the ferromagnetic material from the perspective of magnetoelastic energy, describing the relation between the change of relative permeability and the stress in the simple stress states.
Assuming the ferromagnetic material in the absence of effect from external loads, the ferromagnet with B 1 magnetic induction intensity is magnetized by the external magnetic field intensity of which is H. At this point the permeability μ 1 = B 1 H 2 ; thus, the magnetic energy W 1 of ferromagnetic is equal to:
W 1 = B 1 H 2
While the ferromagnetic material in the effect from external loads and the ferromagnet with B 2 magnetic induction intensity, the permeability μ 2 will be μ 2 = B 2 H 2 ; thus, the magnetic energy W 2 of ferromagnetic is equal to:
W 2 = B 2 H 2
The incremental energy of ferromagnet is:
Δ W = W 1 W 2 = ( B 1 B 2 )   H 2
The Piezomagnetic energy per unit Δ W 1 is:
Δ W 1 = σ Δ l l = σ λ
where σ is the stress.
The criterion of energy conservation is used to derive the variation of magnetization energy per unit volume Δ W equal to the unit magnetic energy product Δ W 1 caused by mechanical force, Δ W = Δ W 1 , ( B 1 - B 2 )   H / 2 = σ H , then:
( μ 2 H μ 1 H )   H = 2 σ λ
Δ μ H 2 = 2 σ λ
Δ μ   ( B 1 μ 1 ) 2 = 2 σ λ
Magnetostrictive coefficient:
λ = λ m B 2 B m 2
where B m is the saturation flux density.
From (11) and (12):
Δ μ μ 1 2 B 1 2 = 2 σ λ m B 1 2 B m 2
Derivation shows: B Δ μ / μ 1 = f ( μ , B m ) . When properties of ferromagnetic materials λ m and B m are not sensitive to stress, the value of λ m / B m 2 can be approximated by a constant, It can be seen that there is a good linear relationship between Δ μ and stress σ , which shows the feasibility of detecting stress based on magneto-elastic effect [29,30].

3.3. Simulation Model of Finite Element

In order to observe the magnetic field line distribution in the magnetic circuit and the magnetic induction intensity distribution of the surface layer of the sample material, a simulation study was made with a visual numerical simulation technique, using the FEM software ANSYS Maxwell. The simulation model is shown in Figure 2. The model mainly consists of a pair of U-shaped magnetic cores, excitation coils, detection coils and the steel plates to be tested. The material properties are set as follows: the magnetic core is set to carbon structural steel and the excitation coil is made of Copper, the material to be tested is set to carbon steel. The solution boundary is set to the air domain boundary. The gap between the sensor probe and the sample is set to air to be closer to the actual test environment. The geometric parameters of the excitation coil and specimen are listed in Table 1 and Table 2.
An alternating current having an amplitude of 0.5 A is applied to the exciting coil. The magnetic field line distribution in the magnetic circuit and the magnetic induction intensity distribution of the surface layer of the sample material are observed. The magnetization effect is illustrated in Figure 3, which shows the magnetic induction distribution of the sample. It can be seen from the figure that in the case where the sample is not under tension, the alternating electromagnetic field in the middle of the steel plate is uniformly and symmetrically distributed and the magnetic induction intensity gradually decreases from the central portion to the periphery. Therefore, the induced magnetic field distribution in the built model satisfies the law of electromagnetic induction and the applied excitation can excite the test piece.

4. Results and Discussion

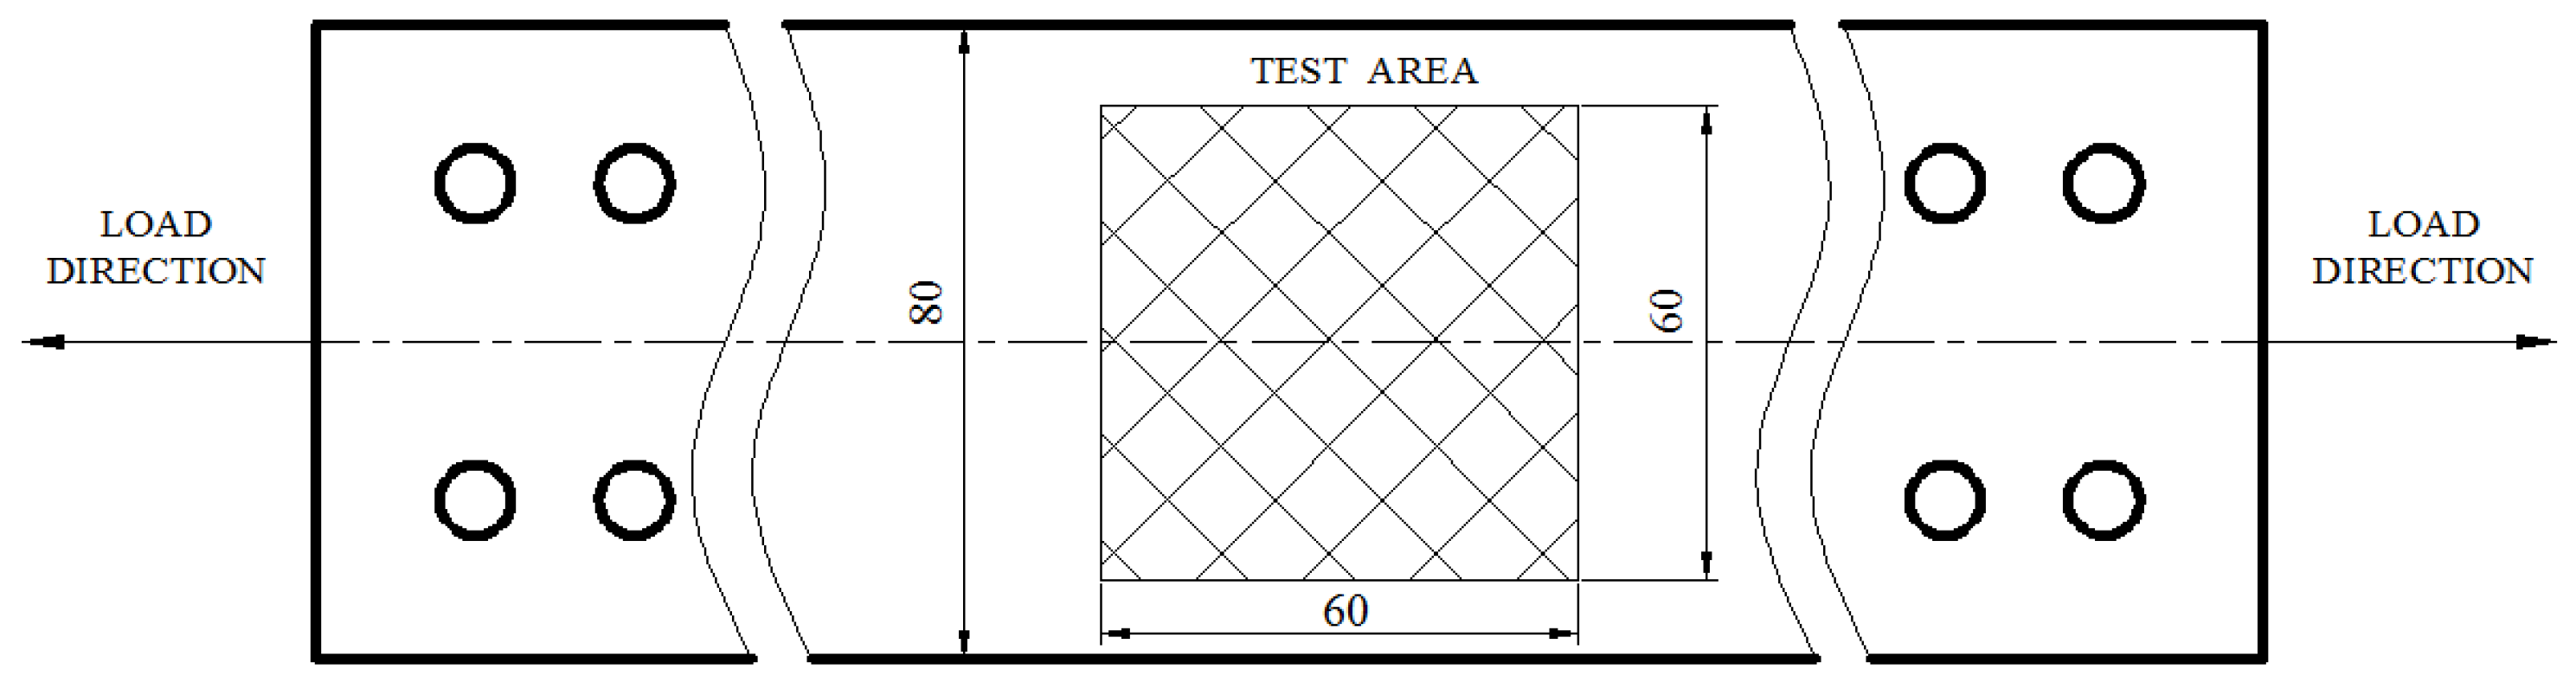
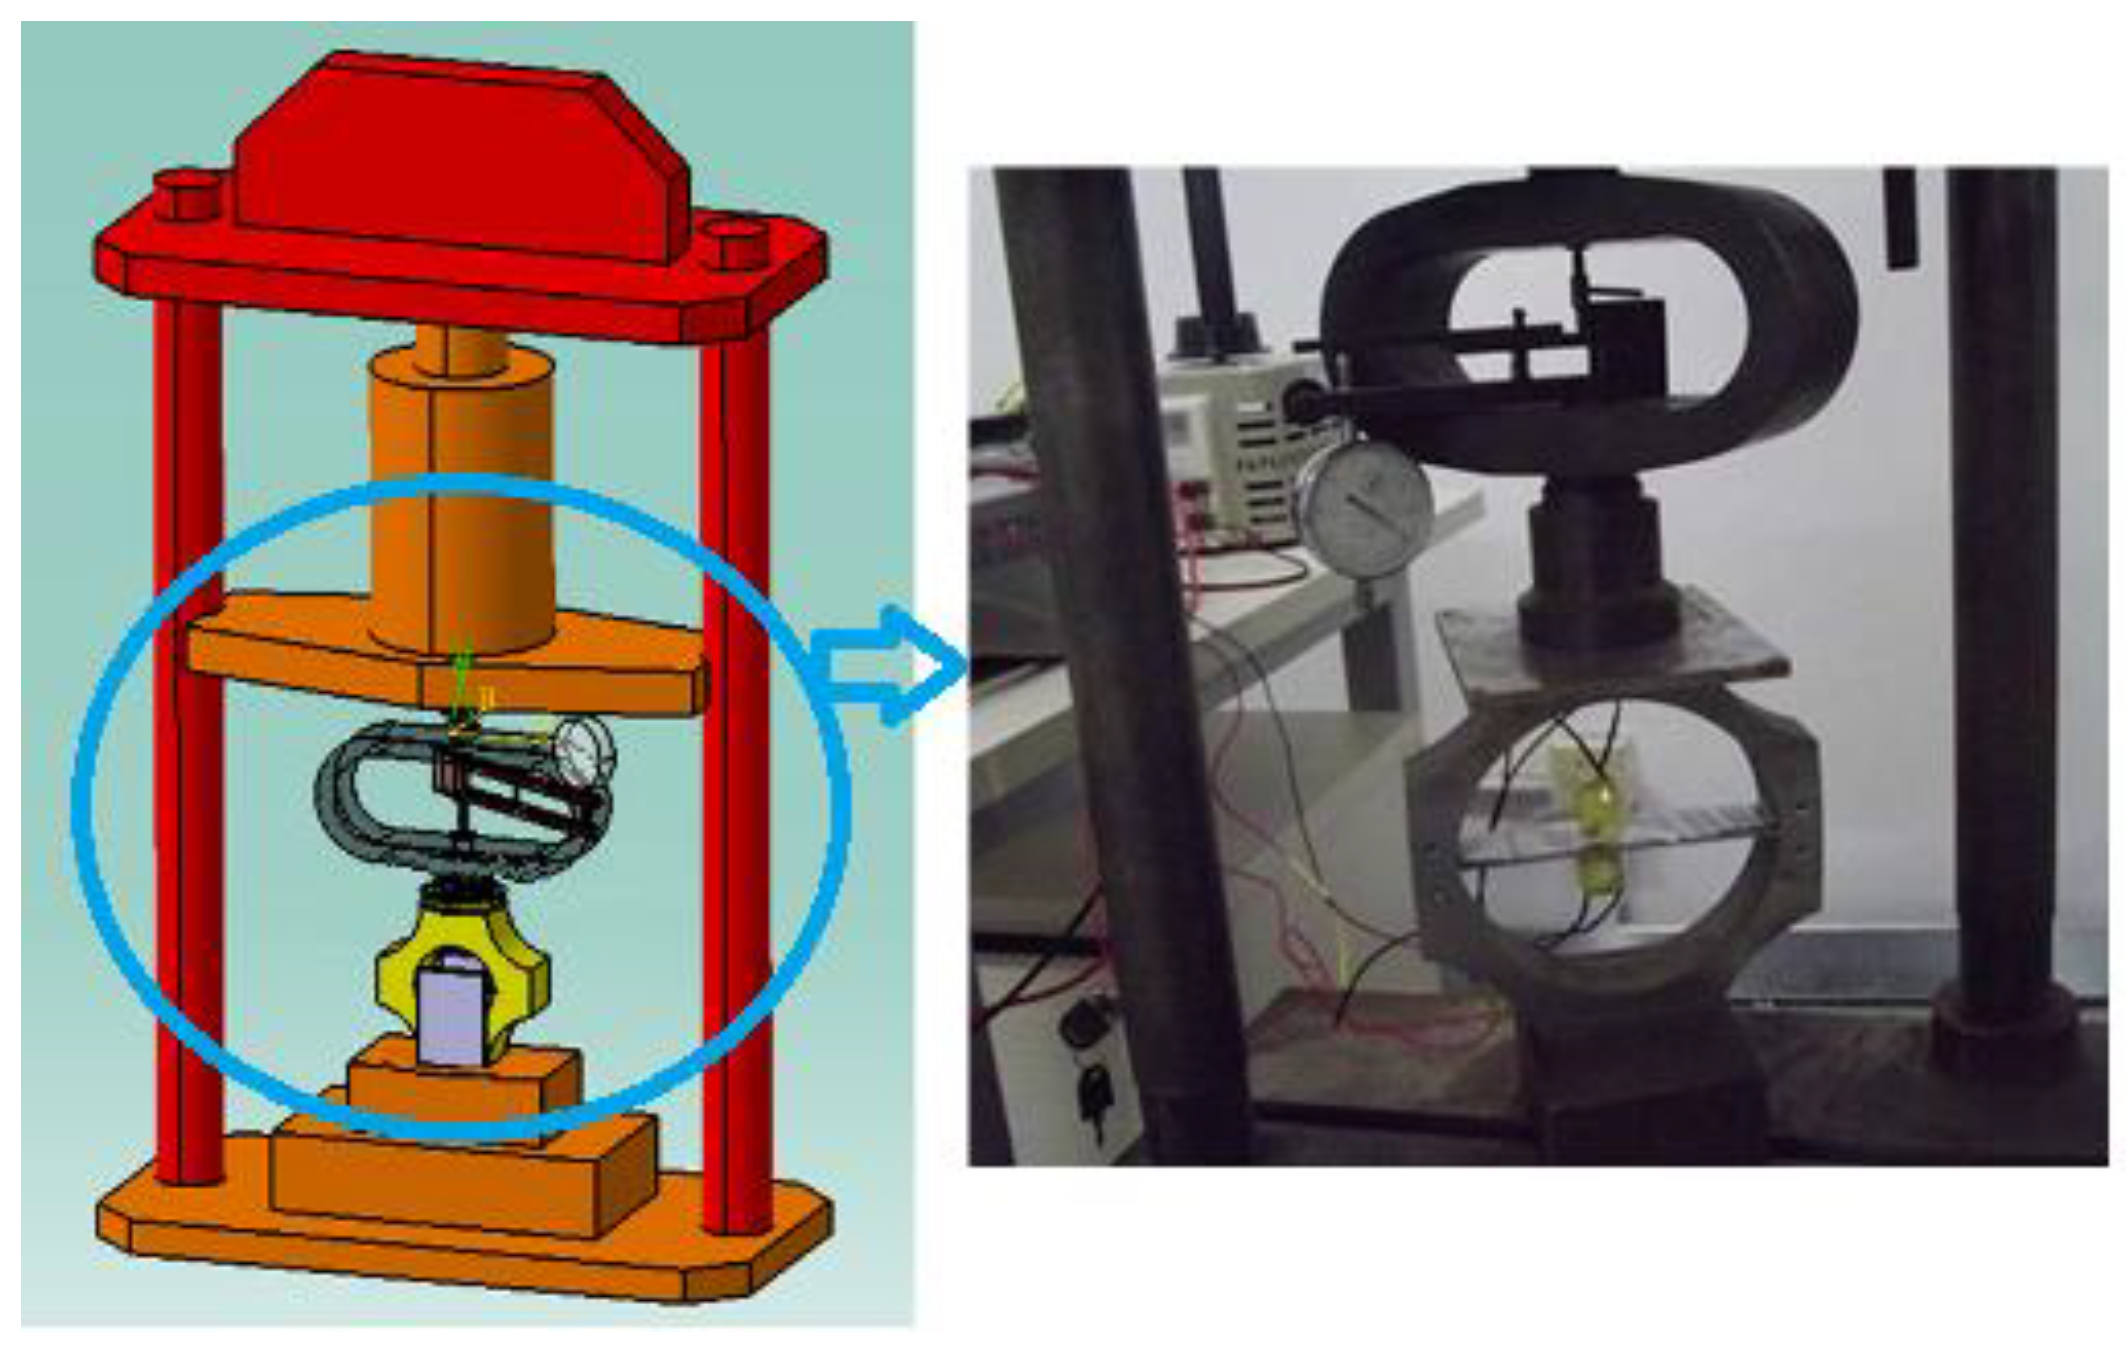
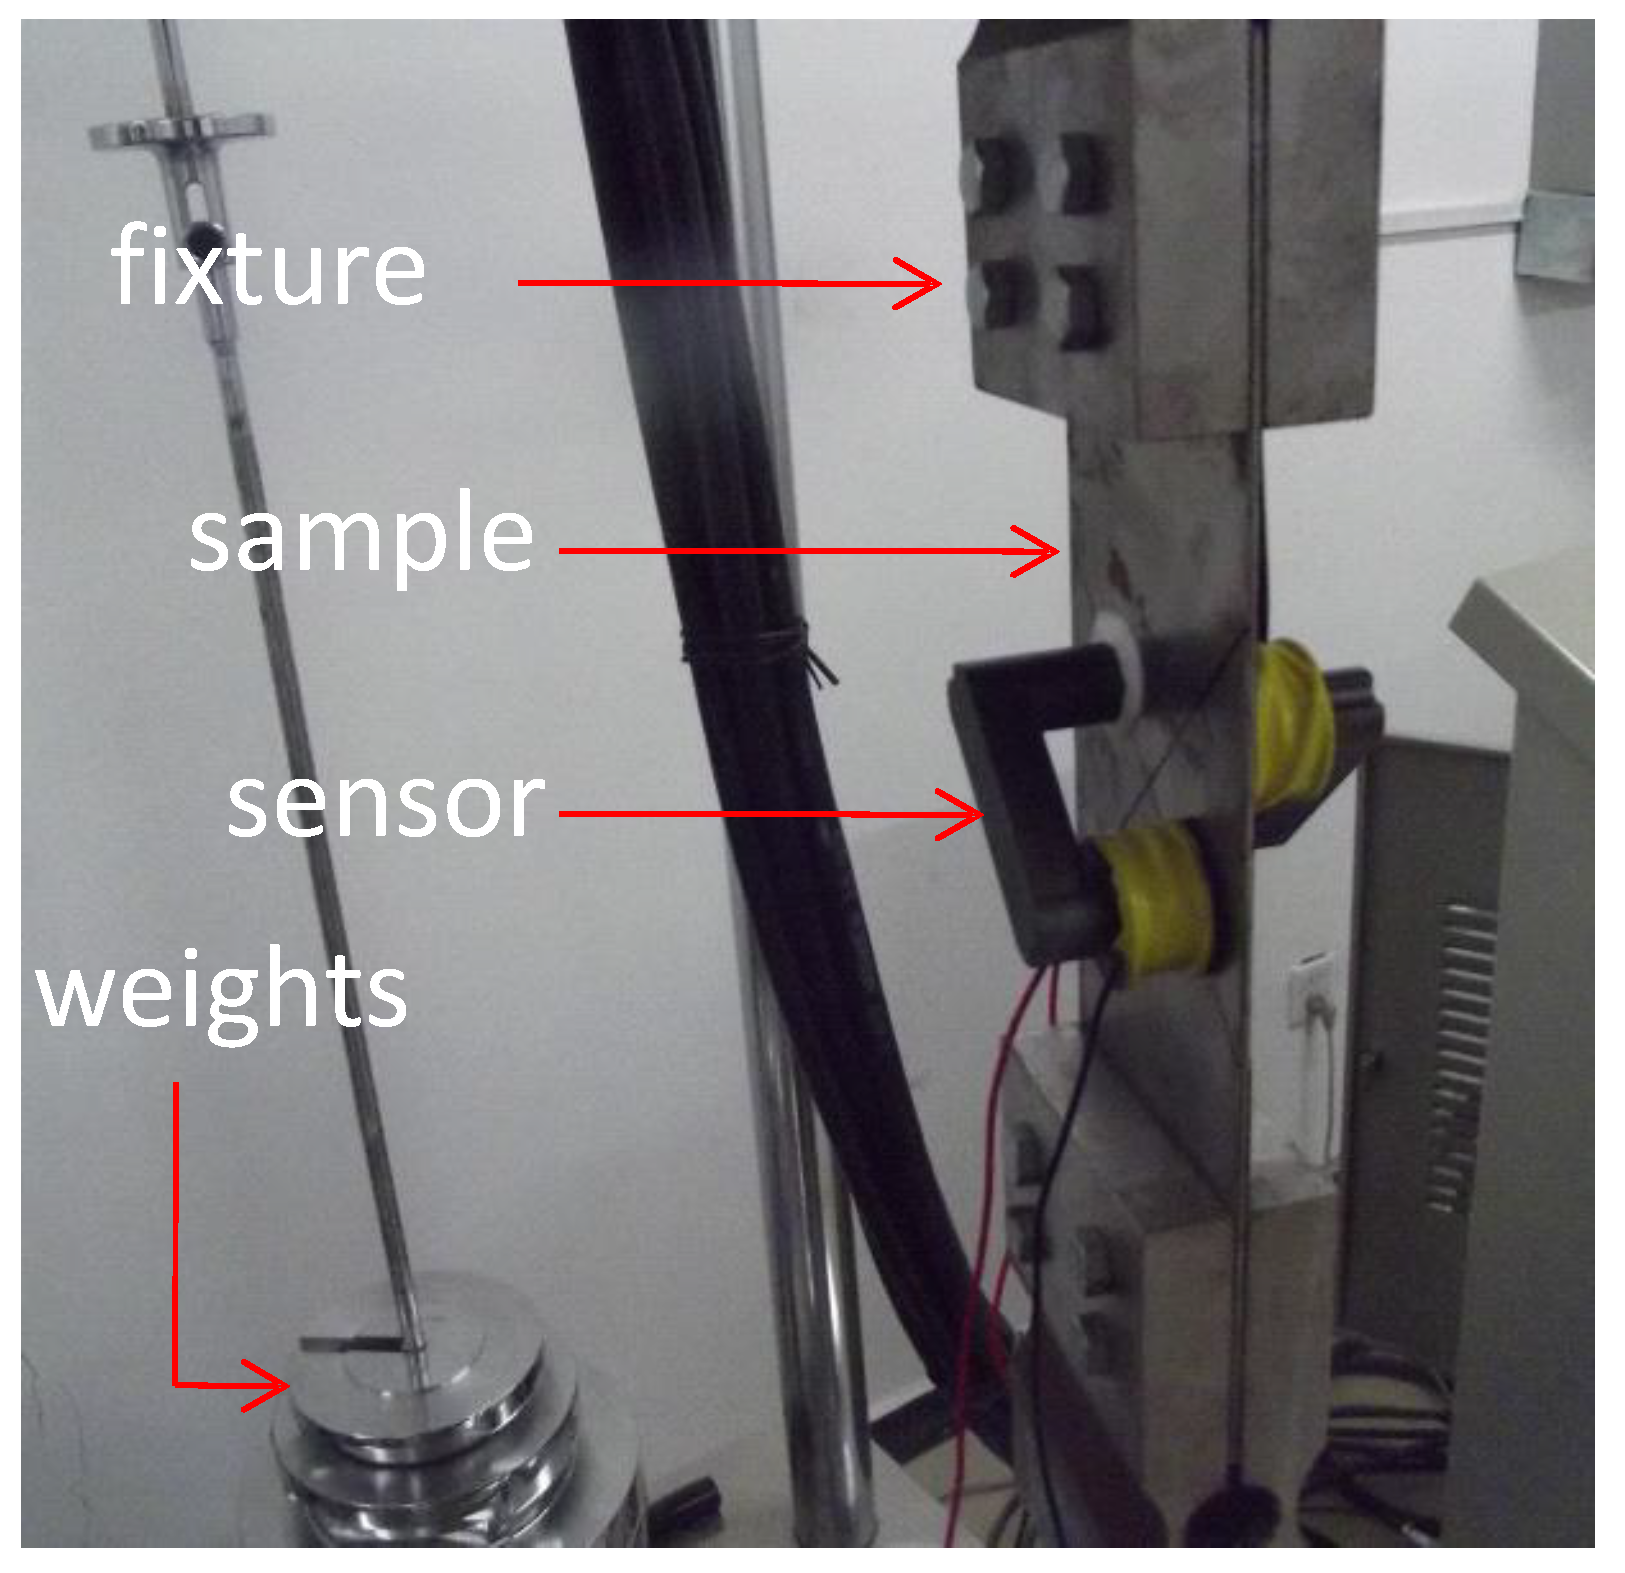
4.1. Specimen Preparation and Electromagnetic Testing System

Testing material used was Q235 low-carbon steel which is widely used in industrial production. Figure 4 illustrates the shape and size of the 2 mm thick tensile specimens used in the experiments. The specimens were fixed on the tensile machine which can provides maximum tension 30 kN by hanging poises loaded statically. The diagram of electromagnetic testing system adopted in this paper is shown in Figure 5. Power supply uses 220 V, 50 Hz AC. which access primary transformer voltage whose output is 36 V. The secondary variable transformer adjusts the voltage into 0~36 V. Silicone rubber is used to fix detect sensor and excitation sensor to the test specimens. Voltage signal detected by the sensor is display and output by oscilloscope waveform monitor after been filtered and amplified during the experiment. The variation of waveform amplitude and phase display by oscilloscope are simultaneously recorded by a computer. After the experiment starts, 1 kN tensile force is loaded in sequence, the output signal of the detection system is recorded and the test results of the induced voltage of the induction coil and the tensile stress of the sheet are obtained.

4.2. Qualitative Stress Measurement Using Electromagnetic Method

The correlation of the received signal and the stress must be obtained before the measurement of stress using electromagnetic method, which means that, first of all, the qualitative stress experiment based on electromagnetic method must be conducted before the measurement of the stress. After getting the changing relationship between the received signal and the internal stress of materials, the on-line detection of distribution of residual stress and will be realized by some methods such as calibration. The test specimen adopted in the experiment is made of Q235 and can be loaded repeatedly, as shown in Figure 6. The thickness along the direction of the measurement in the middle part of the steel plate is 4 mm. The fundamental calibration experiment of quadrapole transmissive layout is carried out in this paper.
The excitation coil and the detecting coil are located at different sides of the measured steel plate in transmissive layout. Both the distances between the sensor probe and the measured steel plate are about 0.3–0.5 mm. The angle between the length direction of the magnetic core of the excitation sensor and the length direction of the measured steel plate is 45°. The excitation coil is perpendicular to the detecting coil, as shown in Figure 4.
The excitation currents are respectively50 mA, 100 mA and 150 mA. The coil of the excitation sensor is winded by high strength enameled wire, of which the diameter is 0.4 mm and the number of turns is 200. The magnetic core of the excitation sensor is made of Mn-Zn ferrite. The detecting coil is winded by high strength enameled wire, of which the diameter is 0.2mm and the number of turns is 1000. The magnetic core is the same with the one of excitation coil. Increase the tension by 1 kN each time and at the same time the output signal of the detection system is recorded. After the tension is accumulatively loaded to 9 kN, a variation curve of the induction signal is obtained as shown in Figure 7. The initial change shown in Figure 7 was weakened by the mechanical resistance of the loading device designed in the experiment. The magnetic field generated by the coil is relatively weak when the current is 50 mA. Under this circumstance, the influence on the magnetic survey signal by the stress can hardly be detected. The reason is that the magnetizing current is too weak. According to the magnetization theory, it can be easily deduced that the magnetization intensity of the steel plate is very weak and the magnetic flux generated along the steel plate is very small in the whole magnetic circuit. In addition, the weak current results in the low penetrability of the magnetic field generated by the excitation coil. Therefore, the influence on the detection signal by the variation of magnetic characteristic along the magnetic circuit of the steel plate is very small. When the magnetizing currents are increased to 100 mA and 150 mA, the variation of magnetic survey signal is obvious. At this time, the magnetization intensity reaches to an area within which the slope is relatively high on the magnetizing curve and the influence on the magnetic survey signal by the stress is much more obvious. The variation trend of the stress state curves at the points where the currents are 100 mA and 150 mA is basically accord with the ones of previous experiment of resistance strain gauge. This experiment proves that the magnetic survey method proposed in this paper is feasible in the measurement of stress.

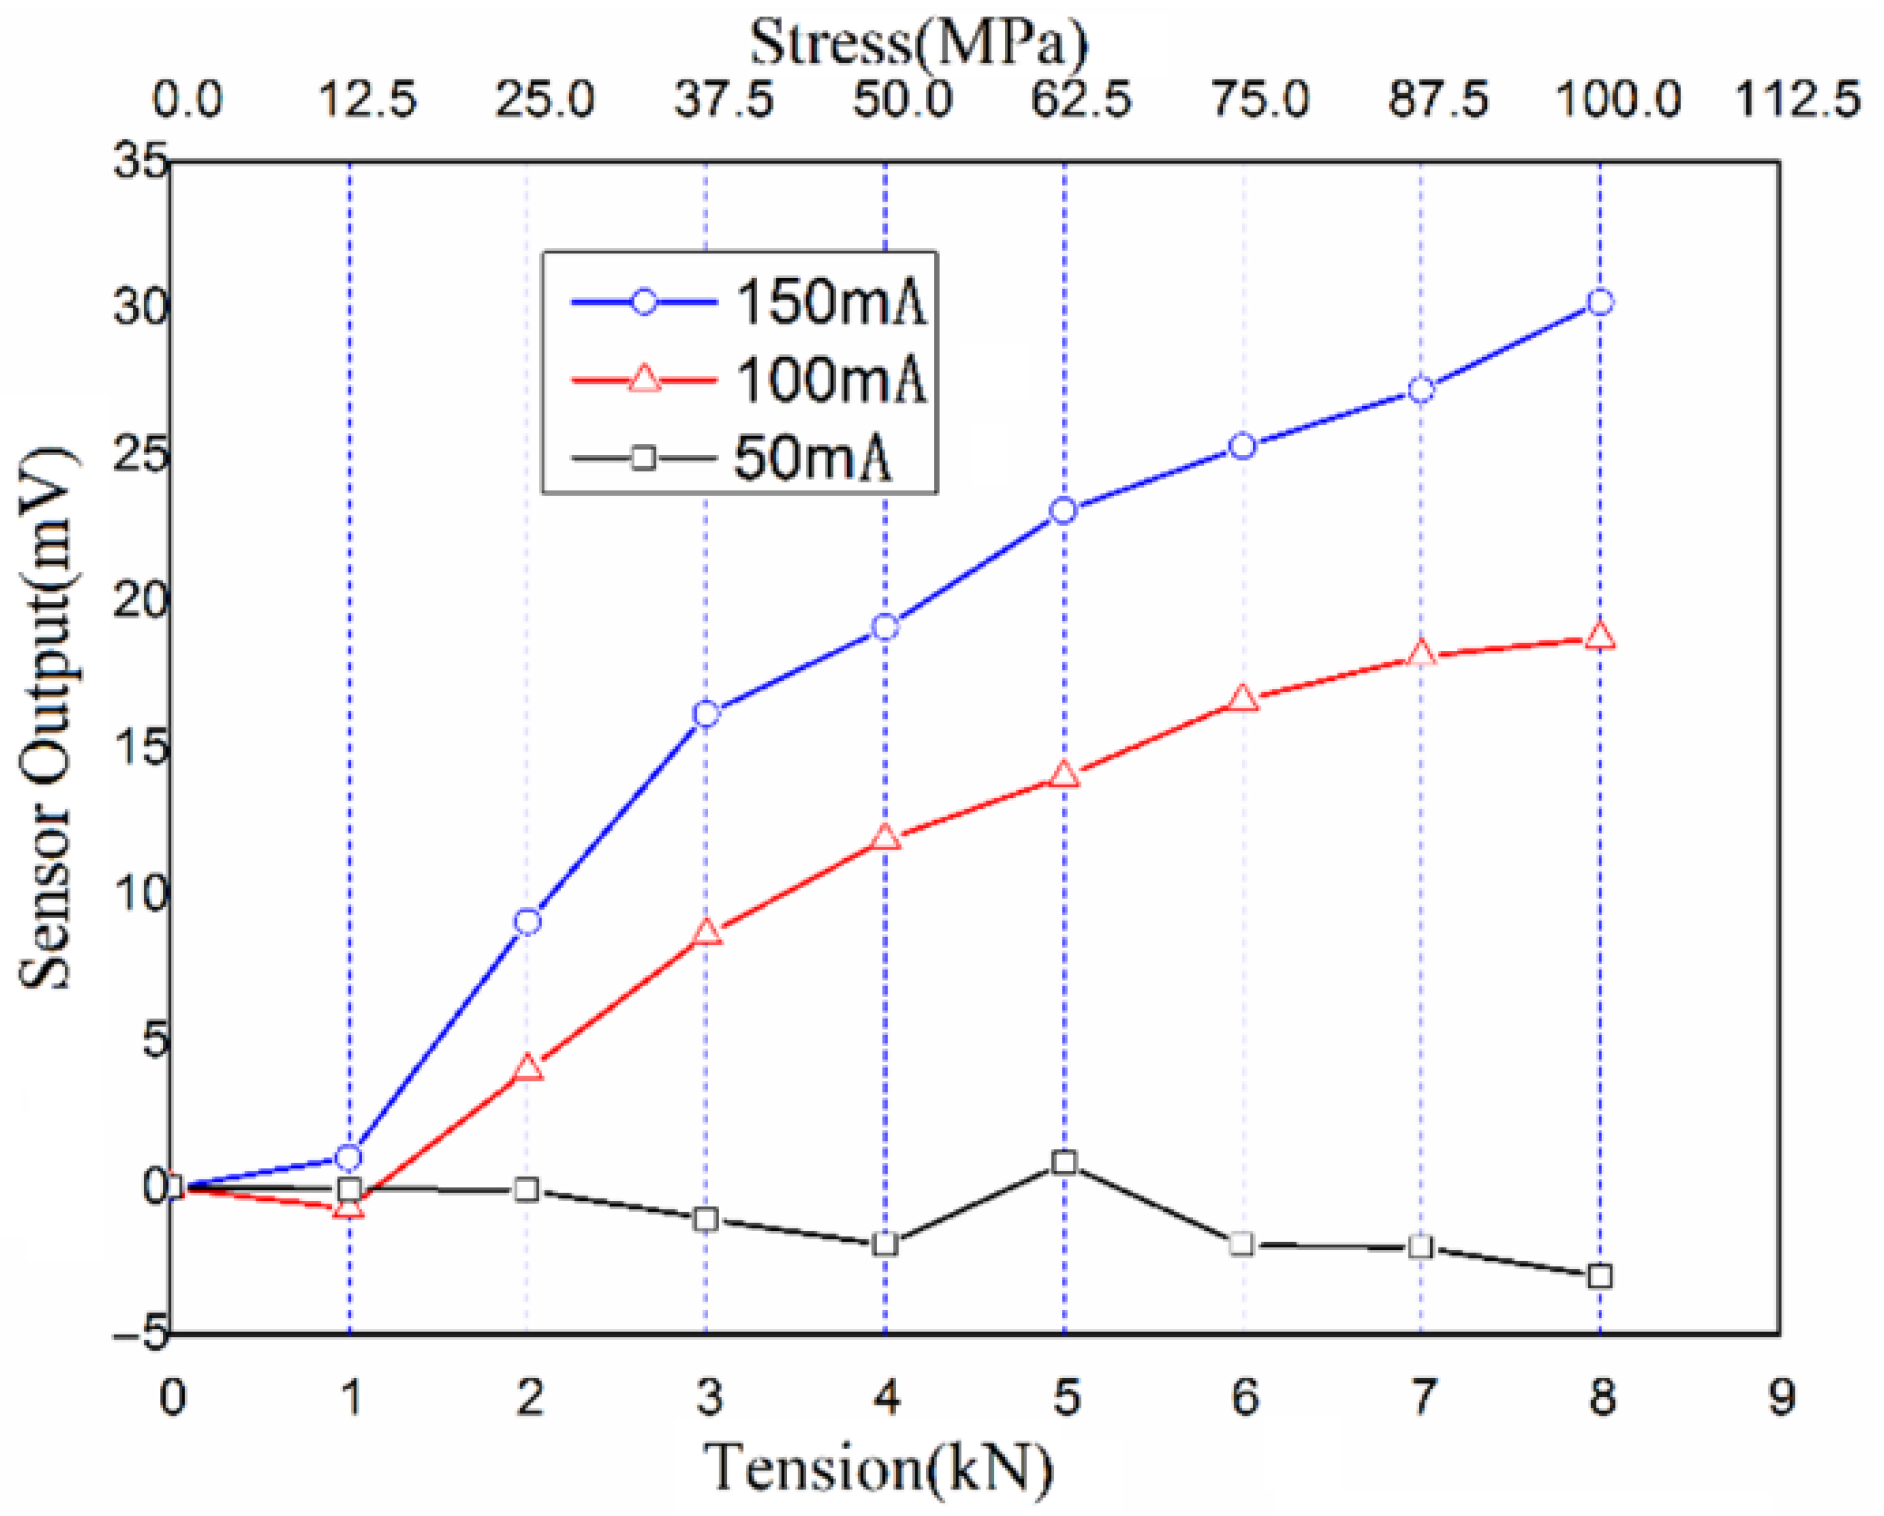
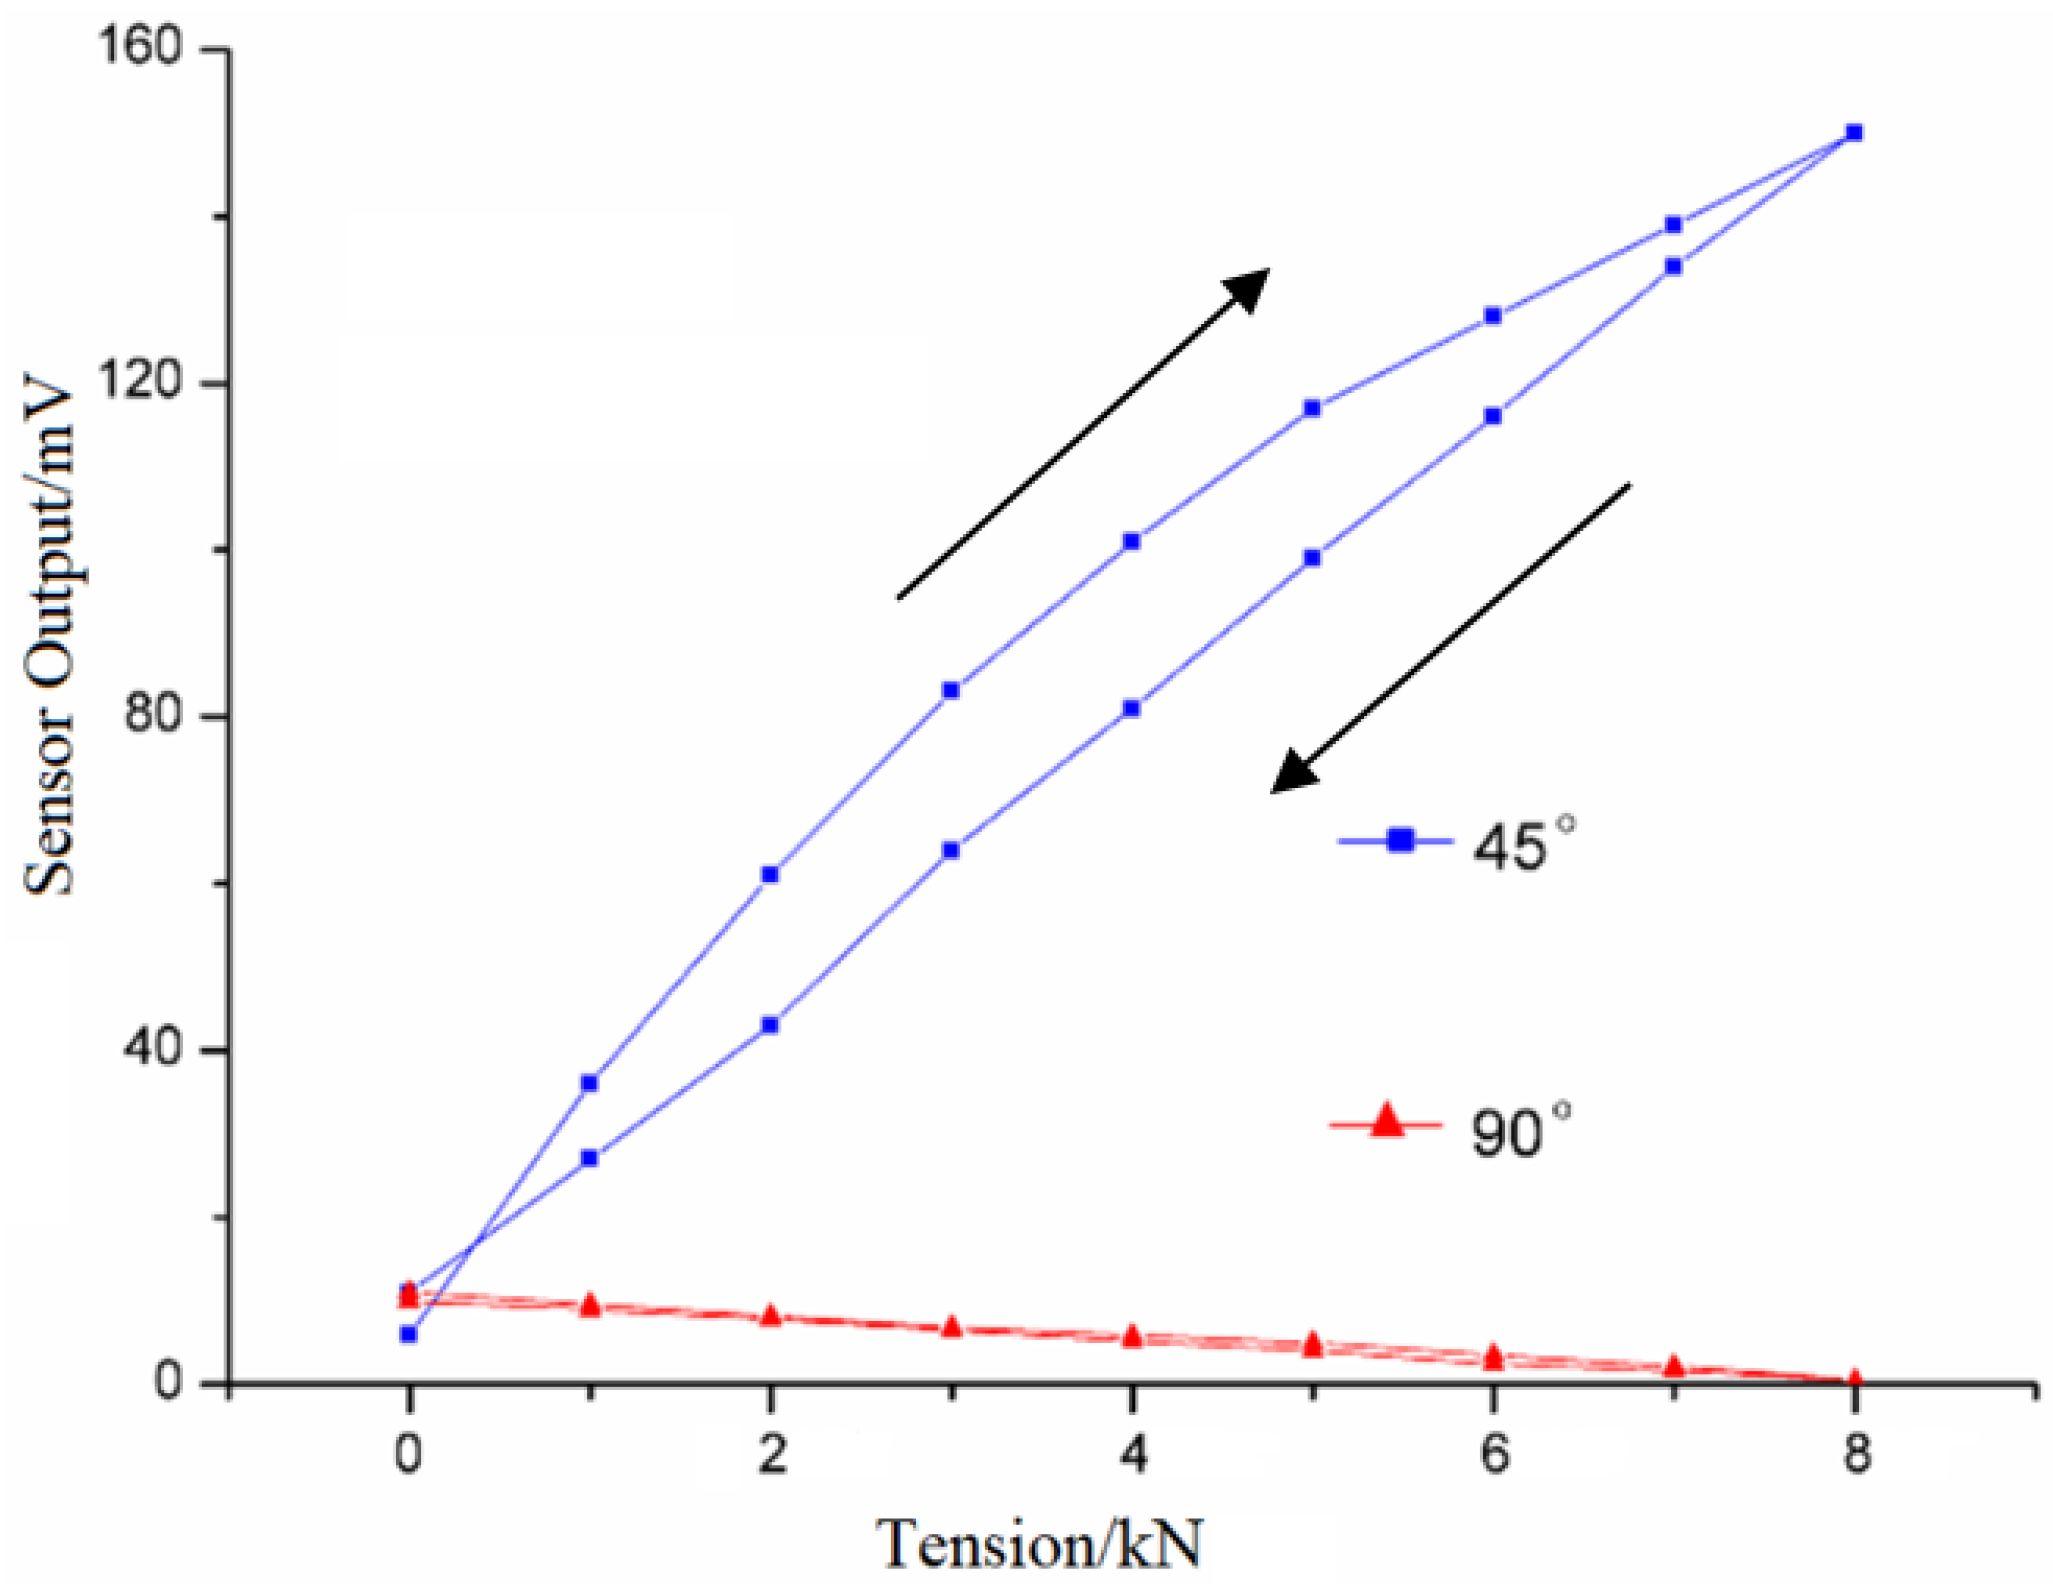
4.3. The Output Characteristic Changes of Sensor Voltage during the Process of Static Load-Unload under Different Experimental Conditions

Static load-unload experiment using tensile testing machine as the experimental device, the machine can provide maximum 30 kN tensile and the loading method was static load weight type.
The exciting sensor probe and detecting sensor probe were bonded on both sides of the steel plate to be tested with silicone rubber. The distance of both sensor probe and steel plate are equal to about 0.3–0.4 mm. The angle between detection probe and tensile principal stress of the sample is 45 degree and the exciting sensor probe is perpendicular to the detection probe. The installation effect is shown in Figure 8.
After the excitation field strength is determined, the number of turns of the coil is determined based on the available current. Since the required magnetic field strength is a range, there is bound to be a better magnetic field strength that is more suitable for our electromagnetic stress detection. In addition, then adjusting the current size to determine which within the scope of the magnetic field intensity is more suitable for our needs. In order to detection sensor under low current working status of thin strip test object testing effect, the Q235 steel plate was machine shaped to standard specimen with thickness of 2 mm and width of 80 mm. Excitation sensor and testing sensor were placed on both sides of the plate. With the sensor probe at a distance of 0.3~0.5 mm of steel plate. The incentive sensor magnetic core length direction and sample by drawing direction Angle of 45 degrees. Meanwhile the incentives sensor and testing sensor are perpendicular to each other and the excitation coil turn is 250, detecting coil turns is 600. Induction signal obtained is shown in Figure 5, the curves can be seen in Figure 9. Under different current strength, not only detect the signal amplitude is different, but also the sensitivity. The sense signal curve with stress variation of different current intensity as shown in Figure 9.

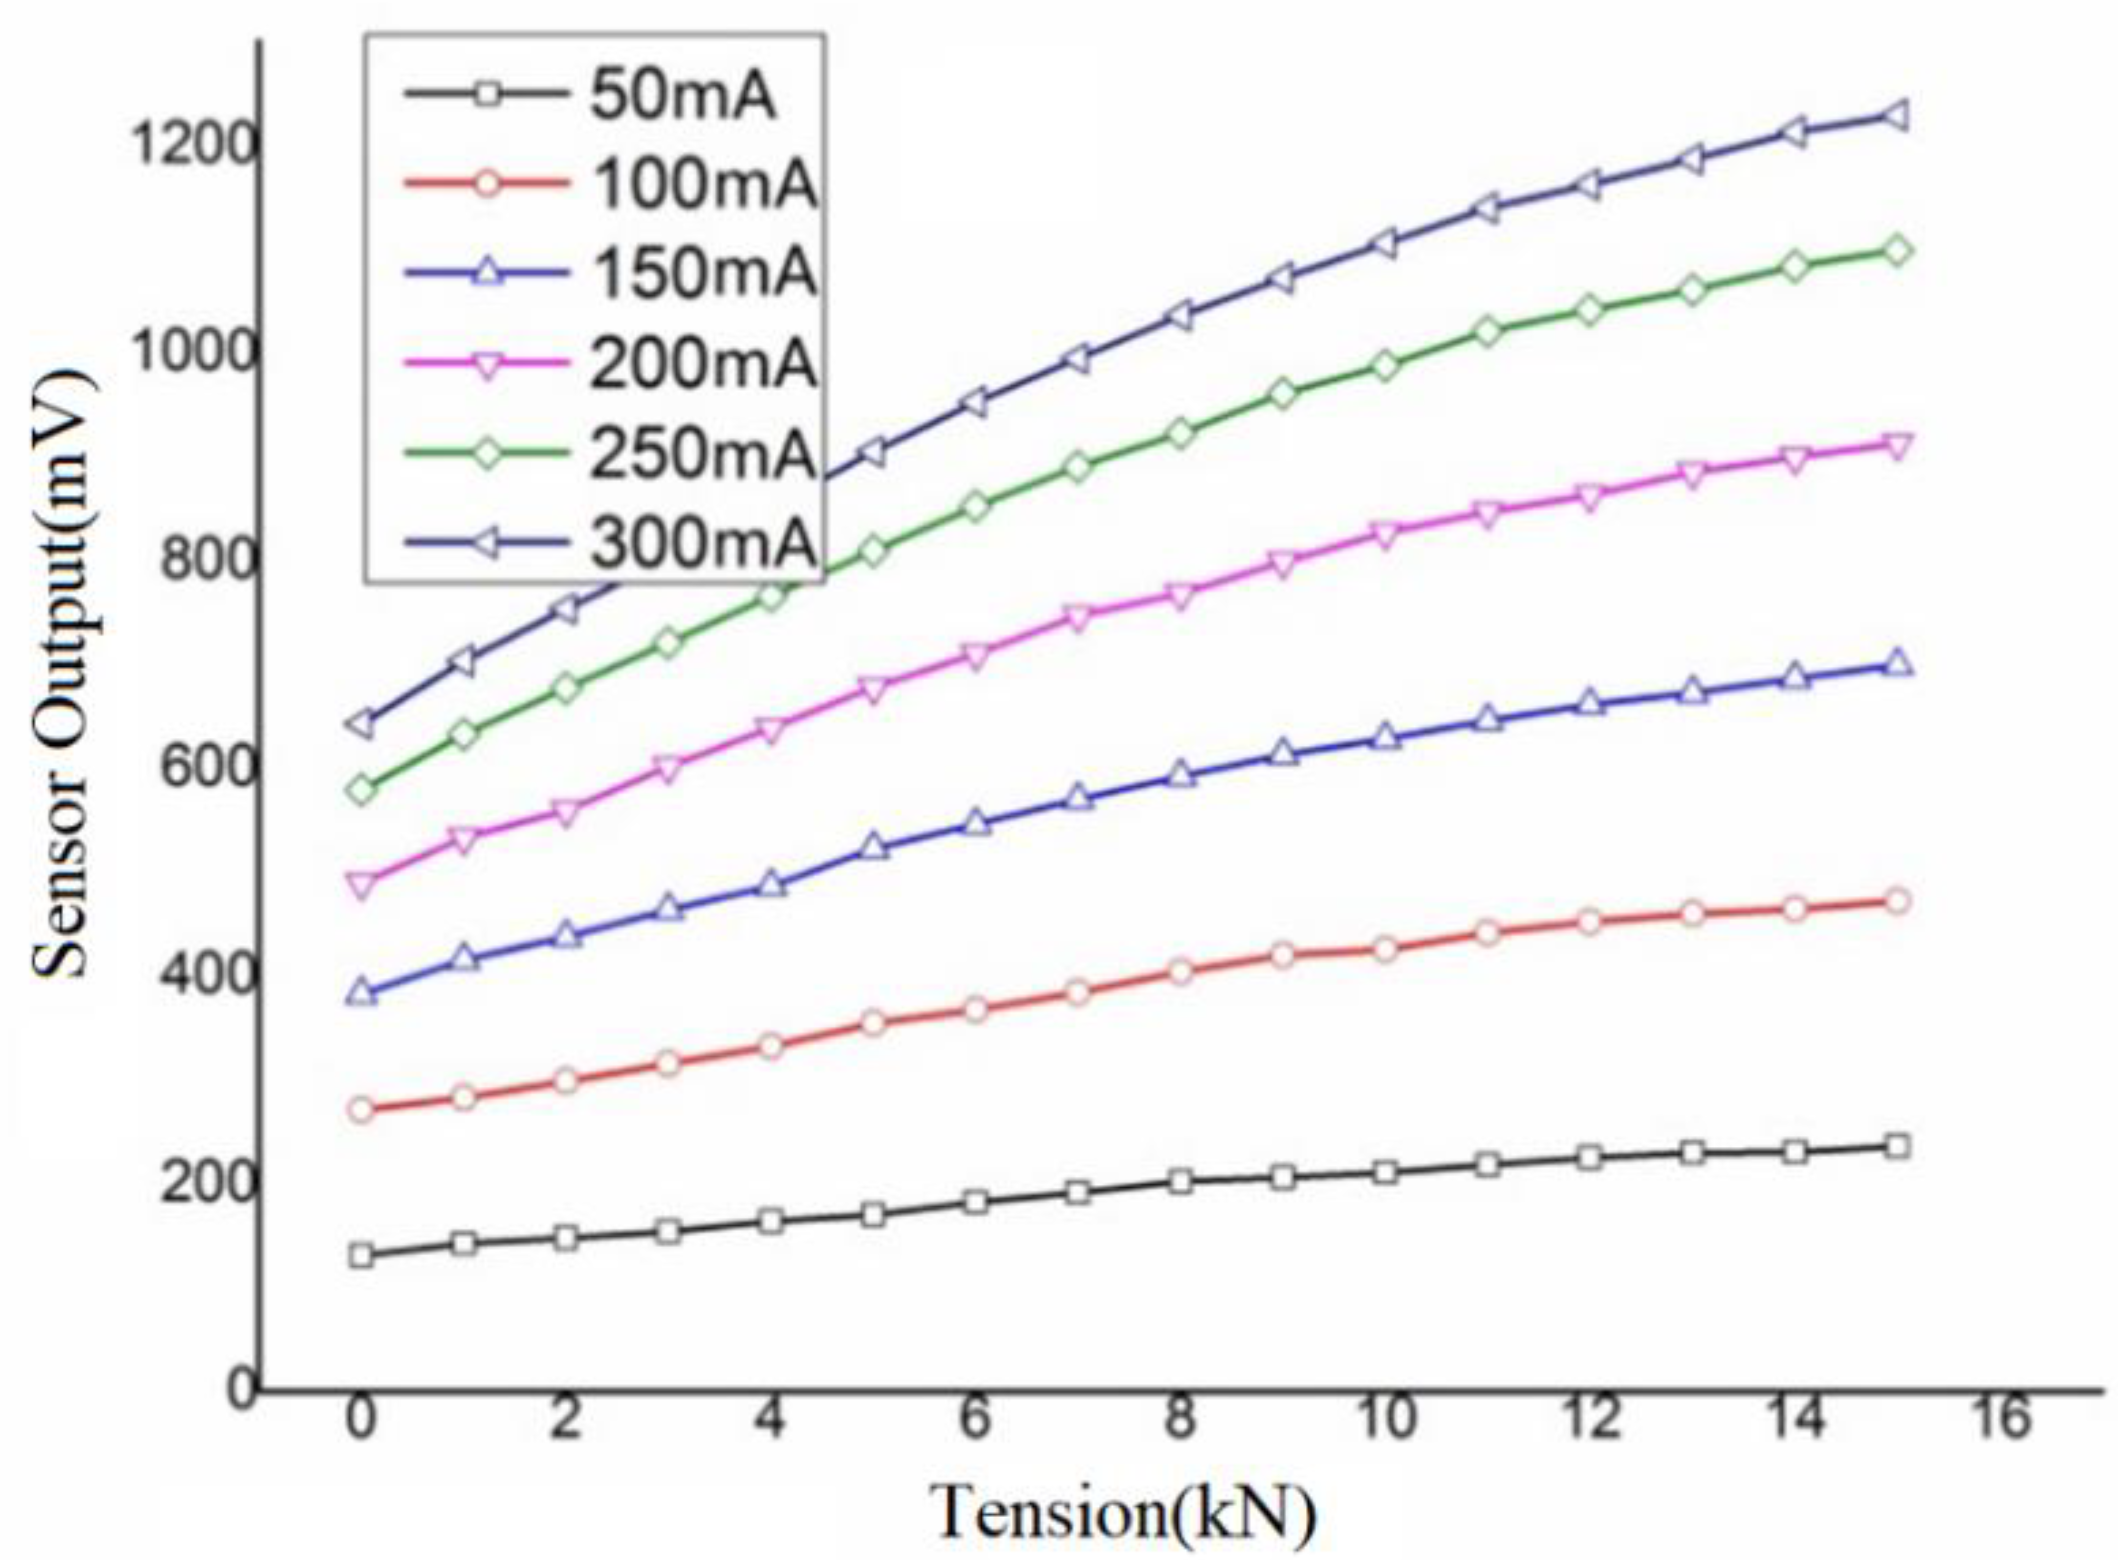
4.4. The Analysis of Sensor Parameters on the Experimental Results

In order to verify the experimental program that the angle between sensors and the principal stress of specimen is 45 degree was reasonable or not, the contrast verification experiment was carried out. The excitation sensor was adjusted to be consistent with the direction of principal stress, the angle between measurement coil and the principal stress is 90 degree, so that the relative angle between the excitation sensor and the measurement sensor is still of 90 degree. The experimental results under the same experimental conditions at different angles were compared. In order to compare the two experimental results, the starting point of the test curve measured at 45 degrees and 90 degrees has been moved to the same initial value. The experimental results shown in Figure 10, with the arrows added to indicate the loading method.
As can be seen when the excitation sensor is consistent with the principal stress direction (that is loading and unloading curve), the detection sensitivity is very low, variation of stresses almost cannot be detected. This also confirmed that the angle between sensor and principal stress direction is 45 degree is reasonable. The main reason is not the stress did not lead to changes in the magnetic permeability and the magnetic flux, but this time the changes of magnetic flux in the detecting coil exactly equal in both directions. So, no matter how much the stress in the steel sheet changes, magnetic permeability changes uniformly in the principal stress direction, this make the detection coil in an equal magnetomotive force point and this is also the reason why the detection sensitivity is very small.

4.5. Experiment on Fixed Material Loading and Unloading Correspond with Flux Changes

Because the output of tested specimen using the same material under different stress states are consistent or not is one of the important aspects of this article concerned about, so the tensile stress experiments on the thickness of 2 mm steel plate specimen were done repeatedly.
In the case of the excitation current of 150 mA, loading and unloading a steel plate of 2 mm repeatedly, 11 times; the curve of experimental result is shown in Figure 11. As can be seen from the figure, detection signal increased linearly with stress during loading procedure. According to the basic principle of electromagnetic stress measurement, that permeability increases gradually in stretching direction. As can be seen in the curve and the repeatability of the experimental results are satisfactory, which meets the requirements of technical indicators of producing site.

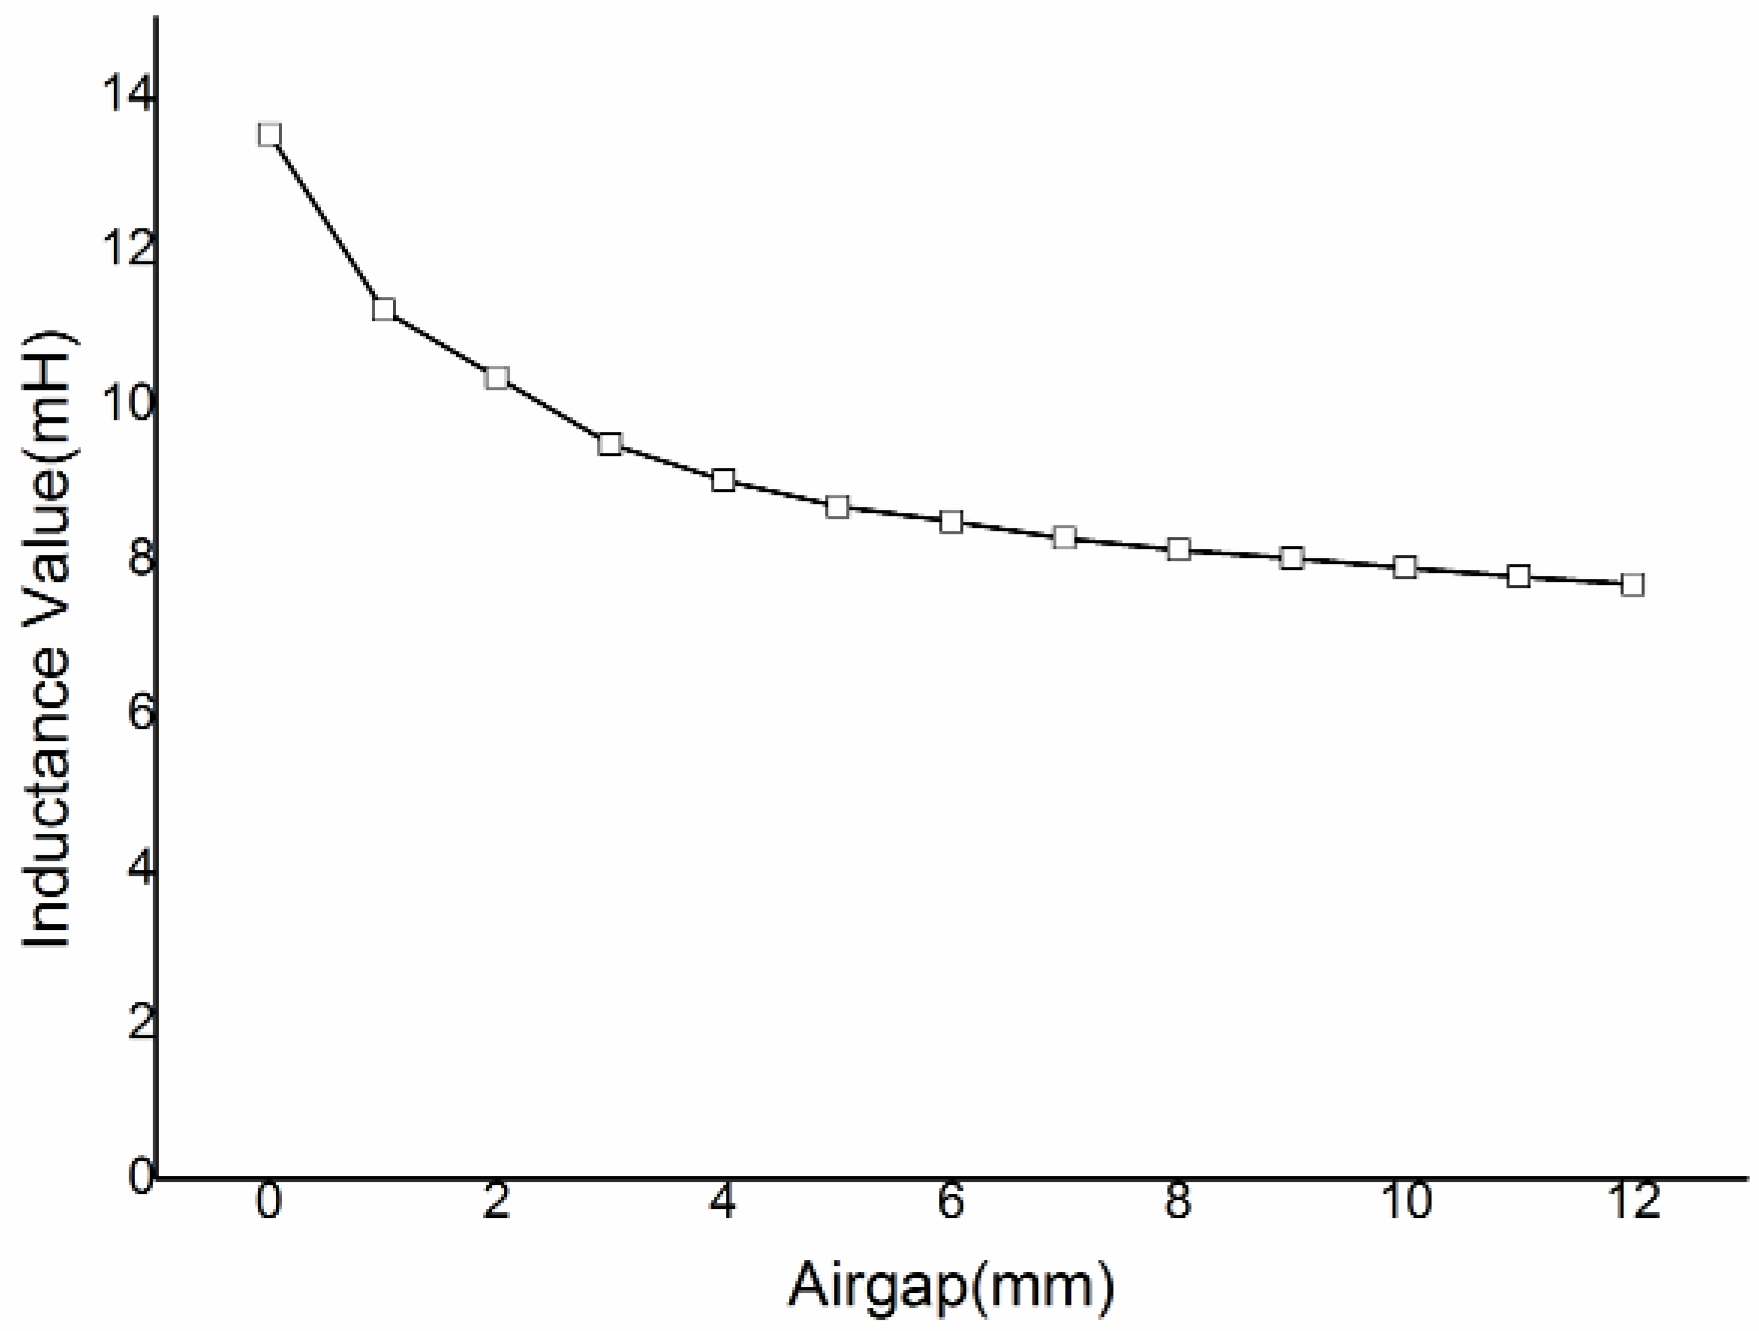
4.6. Experiment on Factors Affecting the Results of Air Gap Change between the Sensor and the Plate and Lift-Off Effect

When there is an air gap or other medium between the probe and the test piece, the magnetic resistance of the entire magnetic circuit will be affected, thereby affecting the output of the magnetic signal. When the stress measurement is used in the production site, due to the high-speed movement of the strip, the sensor probe must be kept at a certain distance from the strip. It is not permitted to use silicone rubber to bond the excitation probe and the detection probe to both sides of the steel plate. At the same time, because when the changing electromagnetic field acts on the conductor, an eddy current is generated in the conductor. The intensity of the eddy current changes with the distance between the electromagnetic field and the conductor. The test method designed in this experiment may be affected by the above two factors, making the problem more prominent. Therefore, it is necessary to conduct a detailed study on the basic law of the influence of the magnetic gap. This paper believes that different air gaps and different excitation conditions on the excitation side and the detection side have a great influence on the relationship between the magnetic output and the voltage value detection. Starting from the different air gaps on the excitation side and the detection side, the experiment on the influence of the magnetic gap is carried out.

4.6.1. Experiment on Relationship of Excitation End Gap Change of Fixed Probe Spacing and Initial Response of Sensor

First, the excitation probe and the detection probe are fixed, keeping the distance between the two probes at 10 mm. Then, move the sample so that it gradually moves between the two probes. The output signal of the detection coil is recorded as the distance between the sample and the detection probe changes.
In Figure 12, the curve D1 represents the change in the amplitude of the output signal of the detection coil when the sample gradually moves away from the excitation probe. The curve D2 represents the change in the amplitude of the output signal of the detection coil when the sample gradually moves away from the detection probe. It can be seen from the figure that the closer the sample is to the detection probe, the larger the output signal of the detection coil; the farther the sample is from the detection probe, the smaller the output signal of the detection coil. Therefore, when the sensor is installed, the distance between the steel plate to be tested and the detection coil can be made as small as possible within the allowable range of conditions to increase the strength of the detection signal.

4.6.2. Experiment of the Corresponding Relationship between the Detection Signal and the Tensile Force under Different Air Gap Conditions

First, the air gap on both sides is maintained at 2.2 mm and the 1 kN tensile force is sequentially loaded and the output signal of the detection system is recorded. Then, gradually increase the air gap on the side of the induction sensor and record the output signal of the detection system. The curve shown in Figure 13 was obtained.
The five curves shown by L1–L5 in the figure are the hysteresis loops when the air gap between the sensor probe and the tested sample is 2.2, 4.4, 6.6, 8.8 and 13.2 mm. It can be observed that when the air gap is small, the sensor sensitivity is high and linearly decreases with the increase of the air gap. When it exceeds a certain distance, the sensor sensitivity decreases sharply due to the effect of magnetic leakage.
Then, the induction side air gap was fixed at 2.2 mm, with the amount of air gap of field sensors on one side increasing gradually and the induction signal curve was obtained as shown in Figure 14.
The curves in the figure were hysteresis loops when the air gap amount between excitation sensor probe and the sample were 2.2, 4.4, 6.6, 8.8, and 13.2 mm, respectively. The decrease of the sensor sensitivity caused by the reduced sensor sensitivity caused by the enlarged lateral air gap is more apparent than the lateral induction, the sensor sensitivity decreased with lateral excitation air-gap increased sharply, when exceeded a certain distance, because of the influence of magnetic flux leakage, the test data was unstable.
The two experiments above shown that the effect of the air gap testing signal and sensor initial response value is very obvious: the greater the air gap is, the lower induction voltage is, the more significantly sensor sensitivity decreases. With the air gap increasing, the voltage change effect caused by magnetic permeability will be covered by the influence of air gap, eventually result in the unsteadiness of the test data.
During the early sensor excitation side’s air gap change experiments, we found that abnormal sensitivity of the sensor changes, while increasing the gap of the excitation side, the initial value of the output signal increases and loading and unloading of data records displays the change of the signal voltage caused by the same amount of change in the stress is greater than before, which is described in contrary to the law that the air gap increasing will lead to reduction of the sensor’s sensitivity. After the test and signal processing systems were checked, an unexpected experimental phenomenon was found, that the changes in the air gap between the sensor and the measured excitation ferromagnetic material samples will cause the change of the state of the resonant excitation power supply circuit and eventually lead to the sensor test data substantial drift.
The most direct expression of this phenomenon is that the current of the resonant excitation supply circuit branch increase or decrease significantly with increasing air gap. The essence of reason is that the inductance of access resonant circuit has changed, while the gap between the excitation sensor and the measured ferromagnetic material samples changed. When the U-shaped magnetic probe selected in this experiment approaches the steel plate, the steel plate intervenes in the excitation sensor and makes the resonant inductor of the t excitation circuit to increase. The corresponding relation curve which the inductance values of excitation sensor change with the air gap is shown in Figure 15. In the circuit including the resistance, inductance and capacitance, the ideal resonance state appears when the capacitance XC equals the inductance XL. In this case, the phase of voltage U and current I in the circuit is same, the imaginary part of the total input admittance in the parallel circuit is zero, the impedance of the circuit satisfies the relation Z = R 2 + X C X L = R , the total impedance of circuit is the minimum and the resonant current reaches the maximum value.
In this experiment, the capacitance and inductance that is accessed to resonance circuit can be derived by Formula (14). In other words, when the product of inductance and capacitance meet the relationship L C = 1 / 2 π f 0 , the circuit will achieve the resonance state theoretically. However, there is a certain degree of error with the capacitor chosen in this experiment, as a result, the circuit cannot realize the ideal resonance state, when the U-shaped magnetic probe is close to the measured steel, the product of inductance and capacitance is greater than the calculated value. As the air gap on the excitation side increases, the inductance of the circuit decreases, which makes the excitation circuit closer to the resonance condition. Then, the resonance current increases, so the phenomenon in above experiment appears, that the air gap increases, the initial value of the output signal increases and the sensor sensitivity improves.
When the stress of the ferromagnetic materials in production field is measured, because there is a certain amount of floating with the ferromagnetic materials in the vertical direction, the gap amount between the excitation sensor probe and steel strip cannot maintain a fixed state. As a result of that, the resonance state of the system cannot be kept at a stable state. For the purpose of solving this problem, the parameters of the resonance circuit are adjusted, inductance is made of a self-made adjustable inductance and two fixed inductance in series. The total inductance is adjustable between 400 mH and 550 mH. The inductance of sensor is commonly 13.5 mH. The capacitor is made up of two iron shell paper non-polar capacitors in parallel. The 50 Hz power was used as excitation source in the experiment. By adjusting the electric inductance value the inductance reaches resonance state and the parameter values are: total inductance is 507 Mh, capacitance is 20 μF, resonant frequency is 50 Hz. After the change the total amount of inductance access to the circuit increases, the proportion of the inductance change due to air gap changes decreases, the current fluctuation supplied by the circuit decreases and the system stability improves.

5. Conclusions

The article proposes a novel method of stress nondestructive testing on sheet strip ferromagnetic material based on principle of inverse magnetostriction. Magnetic detecting technique bases on fundamental principles of inverse magnetostriction and magnetic anisotropy can fulfill the internal stress detection of sheet strip ferromagnetic material.
In order to realize the non-contact detection of internal stress of sheet strip, the magnetic stress measurement technology based on the principle of inverse magnetostrictive effect is applied to the detection of the steel plate internal stress and the magnetic mechanics model of relationship between magnetic permeability and stress was established. A principal verification experimental system for internal stress detection of ferromagnetic materials was designed. Under the experimental conditions shown in this paper, the magnetic permeability of Q235 low carbon steel shows a good correspondence with its stress change during the alternating magnetic treatment process. The effect of sensor parameters on the measurement is discussed. Three main factors affecting the sensor output with the stress of thin steel plate are compared experimentally: sensor angle, magnitude of excitation current, variation of air gap. Stress detection experiments under different turns of the coil show that increasing the number of excitation coil turns is an important way to improve the sensitivity of the sensor. The sensor angle contrast test confirms the rationality of the sensor at 45° angle to the principal stress direction. The reason for the power supply instability of the excitation circuit caused by the change of the air gap is discussed and comparative experiments are carried out.
In this paper, the experimental research on the electromagnetic detection technology of the internal stress of the steel plate verifies the feasibility of the electromagnetic detection technology in the internal stress detection of ferromagnetic materials. The author believes that the results presented in this study are promising and the current work deserves further development. The focus of the research should be on improving sensor measurement accuracy and enhancing resistance to air gap interference to meet the needs of high precision measurement.

Author Contributions

J.Z. is responsible for research ideas and analyzed the experimental data and wrote the manuscript. Y.X. is responsible for the language and expression. S.L. contributed to write the paper. Z.L. provide ideas for the platform construction conceived the idea, coordinated and supervised the entire work. All authors have read and agreed to the published version of the manuscript.

Funding

This work is supported by National Key R&D Program of China (No.2016YFB1200602-19).

Institutional Review Board Statement

The study did not involve humans or animals.

Informed Consent Statement

Informed consent was obtained from all subjects involved in the study.

Data Availability Statement

The study did not report any data.

Conflicts of Interest

The authors declare no conflict of interest.

References

  1. Fischer, F.D.; Rammerstorfer, F.G.; Friedl, N. Residual Stress-Induced Center Wave Buckling of Rolled Strip Metal. J. Appl. Mech. 2003, 70, 84–90. [Google Scholar] [CrossRef]
  2. Borghesi, M.; Chiozzi, G. Shape Control through Tension Distribution Control in Cold Strip Rolling. In Proceedings of the International Conference on Steel Rolling, Tokyo, Japan, 29 September–4 October 1980. [Google Scholar]
  3. Guan, B.; Zang, Y.; Han, X. Cold-Rolled Strip Steel Stress Detection Technology Based on a Magnetoresistance Sensor and the Magnetoelastic Effect. Sensors 2018, 18, 1638. [Google Scholar] [CrossRef] [Green Version]
  4. Liu, L.; Ding, S.; Gao, J. Adaptive Nonsingular Terminal Sliding Mode Backstepping Control for the Speed and Tension System of the Reversible Cold Strip Rolling Mill Using Disturbance Observers. IEEE Access 2019, 7, 171246–171259. [Google Scholar] [CrossRef]
  5. Zeng, J.W.; Zhang, Q.D.; Miao, C.X. Stress nondestructive testing of strip steel based on transmissive magnetoelastic effect. Chin. J. Eng. 2015, 37, 12–17. [Google Scholar]
  6. Jiles, D.C. Magnetic properties and microstructure of AISI 1000 series carbon steels. J. Phys. D Appl. Phys. 1988, 21, 1186. [Google Scholar] [CrossRef]
  7. Jiles, D.C.; Thoelke, J.B. Theory of ferromagnetic hysteresis: Determination of model parameters from experimental hysteresis loops. IEEE Trans. Magn. 1989, 25, 3928–3930. [Google Scholar] [CrossRef]
  8. Withers, P.J.; Turski, M.; Edwards, L.; Bouchard, P.J.; Buttle, D.J. Recent advances in residual stress measurement. Int. J. Press. Vessel. Pip. 2008, 85, 118–127. [Google Scholar] [CrossRef]
  9. Kalita, V.M.; Lozenko, A.F.; Ryabchenko, S.M. The role of defects in the formation of the multidomain state of easy-plane antiferromagnets with magnetoelastic interaction. J. Exp. Theor. Phys. 2004, 99, 1054–1064. [Google Scholar] [CrossRef]
  10. Stampfli, R.; Huynh, N.U.; Youssef, G. Long-term converse magnetoelectric response of actuated 1–3 multiferroic composite structures. Magnetochemistry 2021, 4, 55. [Google Scholar] [CrossRef]
  11. Augustyniak, B.; Degauque, J. Magneto-mechanical properties evolution of Fe-C alloy during precipitation process. Mater. Sci. Eng. A 2004, 37, 76–80. [Google Scholar] [CrossRef]
  12. Duan, Y.F.; Zhang, R.; Zhao, Y. Steel stress monitoring sensor based on elasto-magnetic effect and using magneto-electric laminated composite. J. Appl. Phys. 2012, 111, 07E516. [Google Scholar] [CrossRef] [Green Version]
  13. Jackiewicz, D.; Kachniarz, M.; Bieńkowski, A. Possibilities of application of the magnetoelastic effect for stress assessment in construction elements made of steel considering Rayleigh region. In Proceedings of the International Conference on Systems 2016, Warsaw, Poland, 20–21 May 2016; Springer: Cham, Switzerland, 2016; pp. 689–697. [Google Scholar]
  14. Sumitro, S.; Kurokawa, S.; Shimano, K. Monitoring based maintenance utilizing actual stress sensory technology. Smart Mater. Struct. 2005, 3, 68. [Google Scholar] [CrossRef]
  15. Chady, T.; Sikora, R.; Psuj, G.; Enokizono, M.; Todaka, T. Fusion of electromagnetic inspection methods for evaluation of stress-loaded steel samples. IEEE Trans. Magn. 2005, 41, 3721–3723. [Google Scholar] [CrossRef]
  16. Kwun, H.; Bartels, K.A. Magnetostrictive sensor technology and its applications. Ultrasonics 1998, 36, 171–178. [Google Scholar] [CrossRef]
  17. Wilson, J.W.; Gui, Y.T.; Simon, B. Residual magnetic field sensing for stress measurement. Sens. Actuators A Phys. 2006, 135, 381–387. [Google Scholar] [CrossRef]
  18. Nlebedim, I.C.; Hadimani, R.L.; Prozorov, R. Structural, magnetic, and magnetoelastic properties of magnesium substituted cobalt ferrite. J. Appl. Phys. 2013, 113, 8608. [Google Scholar] [CrossRef] [Green Version]
  19. Kachniarz, M.; Salach, J. Characterization of magnetoelastic properties of Ni-Zn ferrite in wide range of magnetizing fields for stress sensing applications. Measurement 2020, 168, 108301. [Google Scholar] [CrossRef]
  20. Grimes, C.A.; Roy, S.C.; Rani, S. Theory, Instrumentation and Applications of Magnetoelastic Resonance Sensors: A Review. Sensors 2011, 11, 2809–2844. [Google Scholar] [CrossRef]
  21. Tang, J.; Green, S.R.; Gian, Y.B. Miniature Wireless Magnetoelastic Resonant Motor with Frequency Selectable Bidirectional Rotation. J. Microelectromechanical Syst. 2013, 22, 730–738. [Google Scholar] [CrossRef]
  22. Wen, X.Q.; Ning, X.M.; Zhang, Y.Z. Development of technology and application for magnetostrictive sensor. J. Transducer Technol. 2003, 22, 1–4. [Google Scholar]
  23. Bulte, D.; Langman, R.A. Origins of the magnetomechanical effect. J. Magn. Magn. Mater. 2002, 251, 229–243. [Google Scholar] [CrossRef]
  24. Bulte, D. The Pursuit of Hysteresis in Polycrystalline Ferromagnetic Materials under Stress. IEEE Trans. Magn. 2009, 45, 83–87. [Google Scholar] [CrossRef]
  25. Jiles, D.C.; Atherton, D.L. Theory of the magnetization process in ferromagnets and its application to the magnetomechanical effect. J. Phys. D Appl. Phys. 2000, 17, 1265–1281. [Google Scholar] [CrossRef]
  26. Atherton, D.L.; Jiles, D.C. Effects of stress on magnetization. NDT Int. 1986, 19, 15–19. [Google Scholar] [CrossRef]
  27. Liorzou, F.; Phelps, B.; Atherton, D.L. Macroscopic models of magnetization. IEEE Trans. Magn. 2000, 36, 418–428. [Google Scholar] [CrossRef]
  28. Langman, R. Some comparisons between the measurement of stress in mild steel by means of Barkhausen noise and rotation of magnetization. NDT Int. 1987, 20, 93–99. [Google Scholar] [CrossRef]
  29. Langman, R. Measurement of mechanical stress in mild steel by means of rotation of magnetic field strength. NDT Int. 1981, 14, 255–262. [Google Scholar] [CrossRef]
  30. Mohammed, S. Constitutive relations for magnetomechanical hysteresis in ferromagnetic materials. Int. J. Eng. Sci. 1995, 33, 1233–1249. [Google Scholar]
Figure 1. Schematic representation for the transmissive layout of magnetic measurement method.
Magnetochemistry 07 00106 g001
Figure 2. Simulation model for excitation device.
Magnetochemistry 07 00106 g002
Figure 3. B-vector map of the sample.
Magnetochemistry 07 00106 g003
Figure 4. Experimental sample.
Magnetochemistry 07 00106 g004
Figure 5. Block diagram of electromagnetic testing system.
Magnetochemistry 07 00106 g005
Figure 6. Tension test calibration device and the installation of contralateral sensor with quadrapole.
Magnetochemistry 07 00106 g006
Figure 7. Sense signal curve with stress variation on qualitative measurement.
Magnetochemistry 07 00106 g007
Figure 8. Sensor installation effect diagram.
Magnetochemistry 07 00106 g008
Figure 9. Sense signal curve with stress variation of different current intensity.
Magnetochemistry 07 00106 g009
Figure 10. Sense signal curve with stress variation and the principal stress direction at different angles.
Magnetochemistry 07 00106 g010
Figure 11. Sense signal change curve with pulling force of 2 mm thick steel plate.
Magnetochemistry 07 00106 g011
Figure 12. Sense signal curve with gaps variation of the excitation sensor and the steel plate.
Magnetochemistry 07 00106 g012
Figure 13. Sense signal curve with gaps variation of the inductive sensor.
Magnetochemistry 07 00106 g013
Figure 14. Sense signal curve with gaps variation of the excitation sensor.
Magnetochemistry 07 00106 g014
Figure 15. Inductance variation curve with air gap variation of the excitation sensor and the steel plate.
Magnetochemistry 07 00106 g015
Table 1. Properties of the excitation coil.
TurnsCross-Section
Shape
MaterialCurrent
Source
200RectangularStandard Copper
(Permeability = 1 Mu;
Conductivity = 5.8 × 10⁷ S/m)
0.5A
(Strand; Total)
Table 2. Dimension and properties of the conductive sample.
Width
(mm)
Thickness
(mm)
Cross-Section
Shape
Material
802RectangularIron(Permeability = 4000,
having B-H curve)
Publisher’s Note: MDPI stays neutral with regard to jurisdictional claims in published maps and institutional affiliations.

