Article

Use of Time Domain Nuclear Magnetic Resonance Relaxometry to Monitor the Effect of Magnetic Field on the Copper Corrosion Rate in Real Time

by
Cirlei Igreja Nascimento Mitre
1,
Bruna Ferreira Gomes
2,*,
Elaine Paris
3,
Carlos Manuel Silva Lobo
4,
Christina Roth
2 and
Luiz Alberto Colnago
3
1
Instituto de Química de São Carlos, Universidade de São Paulo, Av. Trab. São Carlense, 400-Parque Arnold Schimidt, São Carlos 13566-590, SP, Brazil
2
Chair of Electrochemical Process Engineering, Faculty of Engineering, University of Bayreuth, Universitätsstraße 30, 95447 Bayreuth, Germany
3
Embrapa Instrumentação, R. 15 de Novembro, 1452-Centro, São Carlos 13560-970, SP, Brazil
4
Institute of Technical Chemistry, University of Stuttgart, Keplerstraße 7, 70174 Stuttgart, Germany
*
Author to whom correspondence should be addressed.
Submission received: 20 February 2022 / Revised: 28 March 2022 / Accepted: 1 April 2022 / Published: 6 April 2022

Abstract

:
The corrosion of metals is a major problem of modern societies, demanding new technologies and studies to understand and minimize it. Here we evaluated the effect of a magnetic field (B) on the corrosion of copper in aqueous HCl solution under open circuit potential. The corrosion product, Cu2+, is a paramagnetic ion and its concentration in the solution was determined in real time in the corrosion cell by time-domain NMR relaxometry. The results show that the magnetic field (B = 0.23 T) of the time-domain NMR instrument reduces the corrosion rate by almost 50%, in comparison to when the corrosion reaction is performed in the absence of B. Atomic force microscopy and X-ray diffraction results of the analysis of the corroded surfaces reveal a detectable CuCl phase and an altered morphology when B is present. The protective effect of B was explained by magnetic forces that maintain the Cu2+ in the solution/metal interface for a longer time, hindering the arrival of the new corrosive agents, and leading to the formation of a CuCl phase, which may contribute to the rougher surface. The time-domain NMR method proved to be useful to study the effect of B in the corrosion of other metals or other corrosive liquid media when the reactions produce or consume paramagnetic ions.

Graphical Abstract

1. Introduction

Metal corrosion can be defined as the deterioration of a metal due to its electrochemical reaction with its environment [1], which is a major problem for modern societies as it can frequently result in costly and catastrophic outcomes [2,3]. Since this problem is one that can’t be eliminated, numerous technologies have been proposed to mitigate it instead [4]. An important parameter of corrosion reactions is the reaction rate, which allows us to understand and predict corrosion processes [5,6]. Metallic corrosion has been previously studied using several physical and chemical methods by directly measuring the corrosion of the metal, as well as indirectly through the products released to the environment [7,8,9,10,11]. Copper, in particular, has been the focus of several investigations [12,13,14,15,16] due to its numerous applications in electronics, communications, electrical power lines for domestic and water utilities, and more.
It is well known a magnetic field, B, can affect charged particles, like those involved in corrosion processes. However, its effect is not well understood, and several authors have shown contradictory results, whereby B can reduce, accelerate, or even have no effect on the corrosion rate [17,18,19,20,21,22,23]. For this reason, more studies are needed to fully comprehend the effect of B on corrosion processes to assess whether it could be used as a tool to control or mitigate corrosion processes. To address this knowledge gap, here, we evaluate the effect of B on the corrosion of copper in an aqueous HCl solution.
The corrosion of copper in the presence of B but without an applied electrical potential has seldom been investigated. In one study, Sagawa [19] showed that a B perpendicular to the copper electrode surface has a protective effect against corrosion, when the electrode was treated with nitric acid solution prior to the reaction taking place. In another study, Ang et al. [23] observed an increase in the corrosion rate when the copper electrode surface, parallel to B, was treated with HCl and NaOH, but no effect was observed when it was treated with a NaCl solution. More recently, Mitre et al. [24] studied the corrosion of a copper clad laminate disc with FeCl3 aqueous solution, in the presence of B. They observed that a homogenous and a non-homogeneous B reduces and increases in corrosion rate, respectively, when compared to the reaction in the absence of B.
The oxidation process of the copper corrosion involves two steps. First the Cu0 is oxidized to Cu+ forming the water insoluble CuCl. The CuCl is then oxidized in a second step to the water-soluble product Cu2+ [16,25,26]. As Cu2+ is a paramagnetic ion; its concentration [Cu2+] can be determined in real time and directly in the reaction cell using time domain NMR (TD-NMR) relaxometry [27,28,29]. TD-NMR relaxometry was used because it is a simple and rapid, non-destructive method to measure the concentration, [c], of paramagnetic ions like Cu2+ in aqueous solution [30,31] directly in the corrosion cell. The longitudinal (T1) and transverse (T2) relaxation time constants of hydrogen nuclei of the water molecules are strongly dependent on the [c] of paramagnetic ions in solution and it has a linear correlation with the longitudinal relaxation rate (R1 = 1/T1) [32,33,34].
A linear correlation between [c] of paramagnetic ions and transversal relaxation rate (R2 = 1/T2) has also been demonstrated [27,28,29,30,31,33,34,35,36]. The calibration curve [c] vs R2, has been widely used because T2 can be measured much faster than T1 [27,28,29,30,31,33,34,35,36]. The transverse relaxation time, T2, is normally measured with the Carr–Purcell–Meiboom–Gill (CPMG) pulse sequence that yields the full relaxation curve in a single scan experiment [37,38] and is much faster (lasting just a few seconds) than the classical methods to measure T1, such as the inversion recovery, progressive saturation, or saturation recovery pulse sequences [39]. These T1 sequences acquire a single data point per measurement, which is not ideal since it is necessary to repeat the experiment several times before the full relaxation curve can be obtained [38]. Recently, faster methods to measure T1 have been proposed [40], but they have not been used for this application because they have a lower signal-to-noise ratio than CPMG and provide essentially the same information. Therefore, TD-NMR relaxometry using T2 has been used as a simple, rapid, and non-destructive method to quantify [c] of paramagnetic ions in solution, and its detection and quantification limits, precision, and accuracy were demonstrated to be comparable to the more sophisticated inductively coupled plasma atomic emission spectroscopy (ICP-OES) [34].
One of the applications of TD-NMR in magnetoelectrochemistry has been in the in situ study of copper electrodeposition [27,28,29,30]. In these experiments the electrochemical cell containing an aqueous solution of CuSO4 is placed inside the NMR probe. The amount of copper that is deposited on the working electrode can be monitored in situ as the relaxation rate of the water in the solution decreases linearly with the diminishing copper concentration. Another consequence of the use of TD-NMR to monitor copper electrodeposition in situ is the manifestation of the magnetoelectrolysis phenomenon. This phenomenon is observed when the electrochemical reaction is performed in the presence of B, which increases the convection rate and consequently the reaction rate [27,28,29,30,35]. The major forces induced by B are: the magnetohydrodynamic force (FB), or magnetic force (the magnetic component of Lorentz’s force), given by the cross product between the current density, j, and B (Equation (1)); the Kelvin force (F B) (Equation (2)), which results from the B gradient; and the paramagnetic concentration force (F P) (Equation (3)), which results from the interaction between the magnetic field and the concentration gradient of paramagnetic species [41].
F B = j × B
F B = χ m B B μ 0
F P = χ m B c 2 μ 0
where j is the current density, χ m is the magnetic susceptibility of the solution, B is the magnetic field gradient, c is the paramagnetic species concentration gradient, and μ 0 is the magnetic permeability of free space.
Therefore, TD-NMR can be a useful method to study the effect of B on copper corrosion in real time and within the corrosion cell. To the best of our knowledge, this is the first study describing the use of TD-NMR relaxometry to monitor the corrosion rate.

2. Materials and Methods

Figure 1 shows a schematic diagram of the experimental procedures used to study the effect of the 0.23 T TD-NMR spectrometer magnet on copper corrosion. The copper release in the corrosive solution in the presence (B > 0) and absence (B = 0) of the magnetic field was measured in real time by TD-NMR relaxometry and by atomic absorption (AA), at the end of the experiments. The corroded metal surface was analyzed by atomic force microscopy (AFM) and X ray diffraction (XRD) to observe the effects of B on surface morphology and composition.

2.1. Corrosion Cell

The corrosion reaction in the presence (B > 0) and absence (B = 0) of B were performed using a 6.3 mm diameter copper cylinder with a purity of 99% acquired from a local manufacturer. The cylinder was embedded in Teflon (Figure 2A) leaving one end face of the copper rod exposed. The electrode was inserted in a cylindrical cell of 30 and 28 mm of external and internal diameter, respectively, and 30 mm in height (Figure 2B) containing 8 mL of a 1 mol L−1 HCl aqueous solution. Before each reaction, the copper surface was polished to 2500 grit, defatted, and dried. For the experiment in the presence of B, the corrosion cell was inserted in the NMR probe, as shown in Figure 2C, and the reaction was monitored for 24 h. The direction of B was parallel to the surface of the copper electrode. For the experiments without B, the same procedures described for B > 0 were used, but the reactions were performed outside of the NMR instrument. Both corrosion experiments were performed in a 1 mol L−1 HCl aqueous solution and triplicates were made. The cell was not de-aired prior to experiments.

2.2. TD-NMR Measurements

For the B > 0 experiments, the cell with electrode and corrosive solution were placed in the NMR probe of a 0.23 T SLK 100 spectrometer (Spinlock, Cordoba, Ar), Figure 2C. The corrosion process was monitored for a period of 24 h, with the transversal relaxation time, T2, of the corrosive solution being measured regularly using CPMG pulse sequence. For the corrosion in the absence of B (B = 0), the same procedure was performed outside the NMR instrument. The cell was transferred to the NMR probe, only for a few seconds, to measure the CPMG signal of the solution.
The CPMG signals were acquired using a π/2 flip angle of 6.2 μs and the π flip angle pulses were 10.6 μs long; the echo time (τ) was 3 ms, 500 echoes, a recycle delay of 1.5 s, and 2 scans. The measurements lasted less than 90 s per sampling. The T2 values were determined by fitting the data with a mono-exponential curve. The linear correlation between the [Cu2+] and the transverse relaxation rate (R2 = 1/T2) was obtained using CuSO4 solutions prepared with concentrations ranging from 1 × 10⁻⁵ to 1 × 10⁻² mol L−1 in a 1 mol L−1 HCl aqueous solution (Figure 3). The linear equation obtained by linear fitting is shown in Equation (4). All experiments were performed at 28 °C.
R 2 = ( 0.413 ± 0.002 ) s 1 + ( 1288 ± 8 ) s 1 mol 1 L × [ Cu 2 + ] molL 1

2.3. Atomic Absorption Analysis

To validate the Cu2+ concentration values obtained by TD-NMR the corrosive solution was also analyzed by atomic absorption (AA) at the end of each experiment. The AA analyses were made using a flame atomic absorption spectrometer from PerkinElmer model PinAAcle 900T at 324.75 nm (Cu).

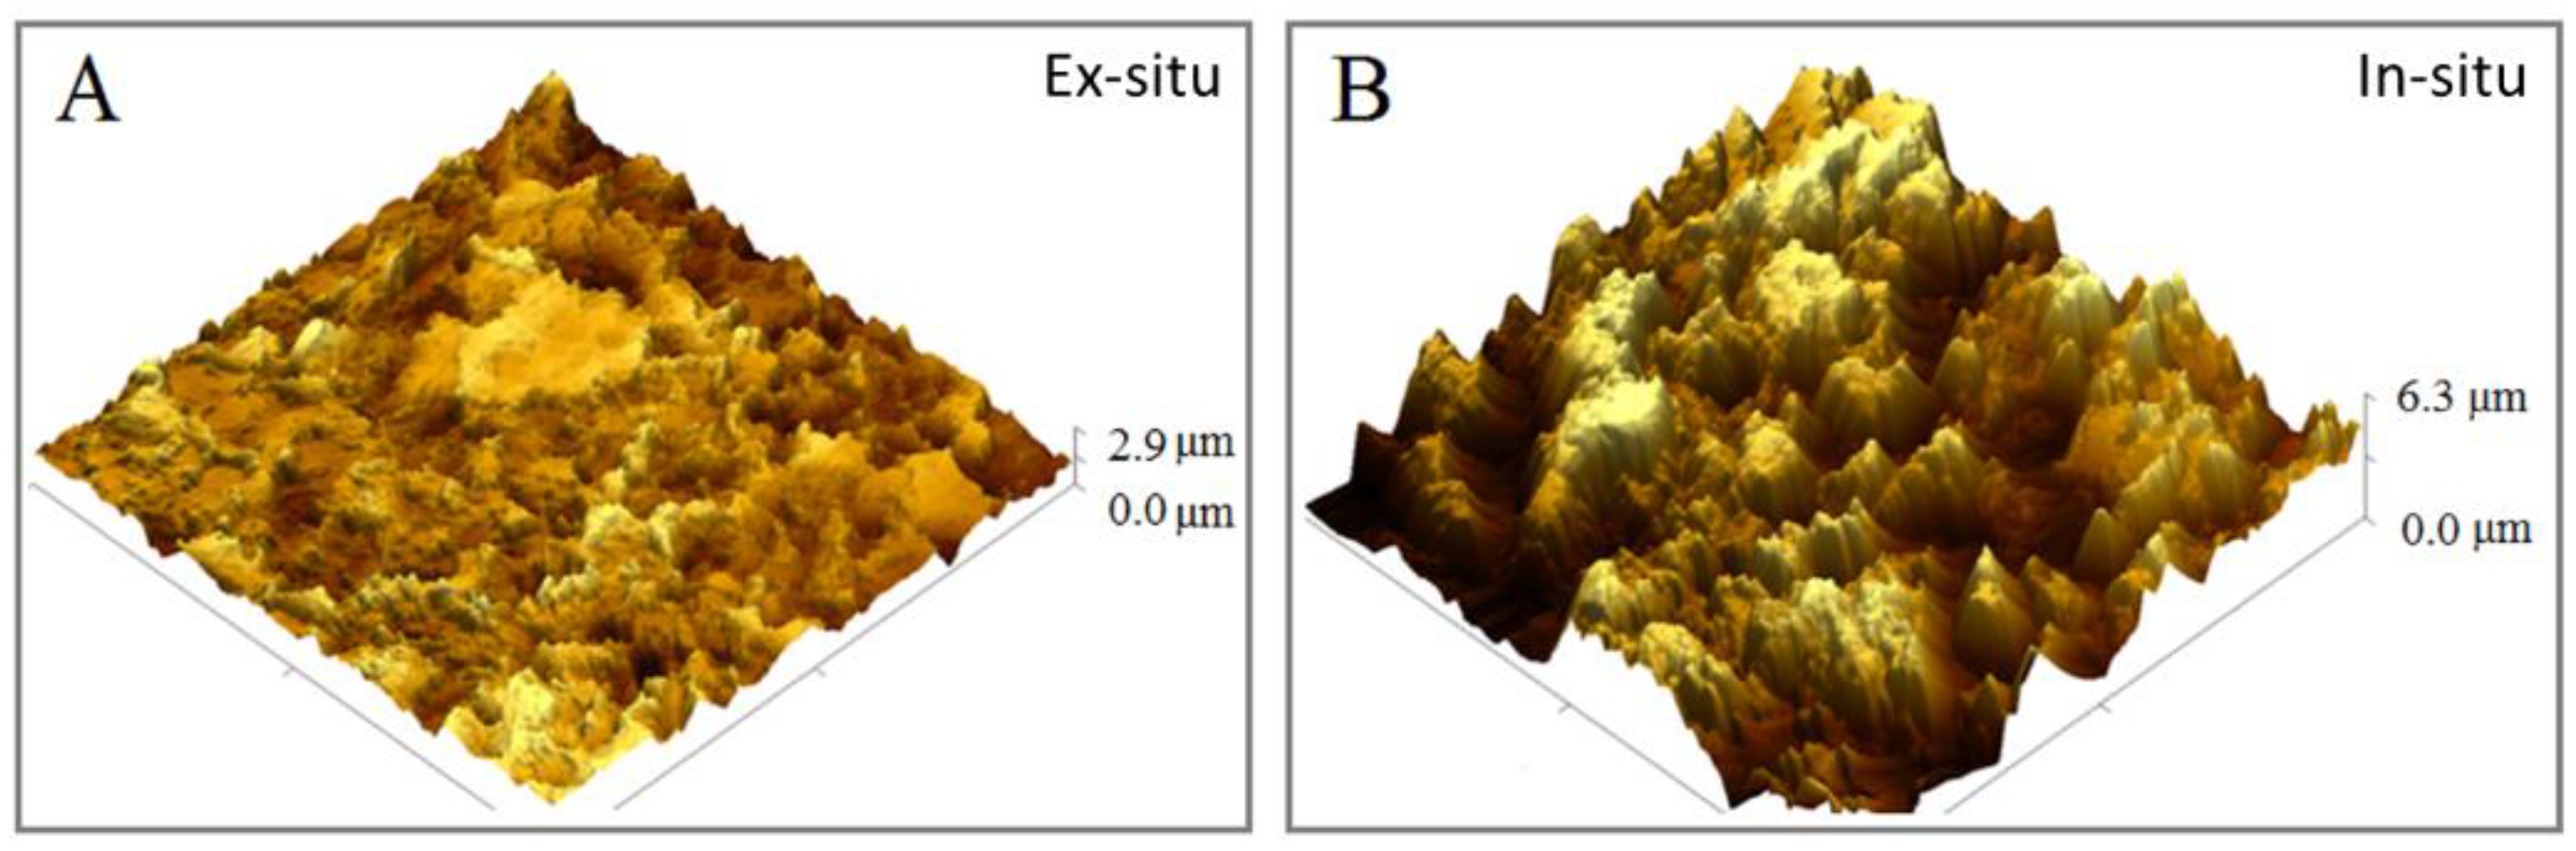
2.4. Atomic Force Microscopy (AFM) Characterization

The AFM images of the corroded copper surface were obtained in a Nanosurf microscope, model Flex, Liestal, Switzerland. The analyses were performed using tapping mode with a Nano Word cantilever with a resonance frequency of 160 KHz. The Gwyddion software, version 2.47, was used to process the images.

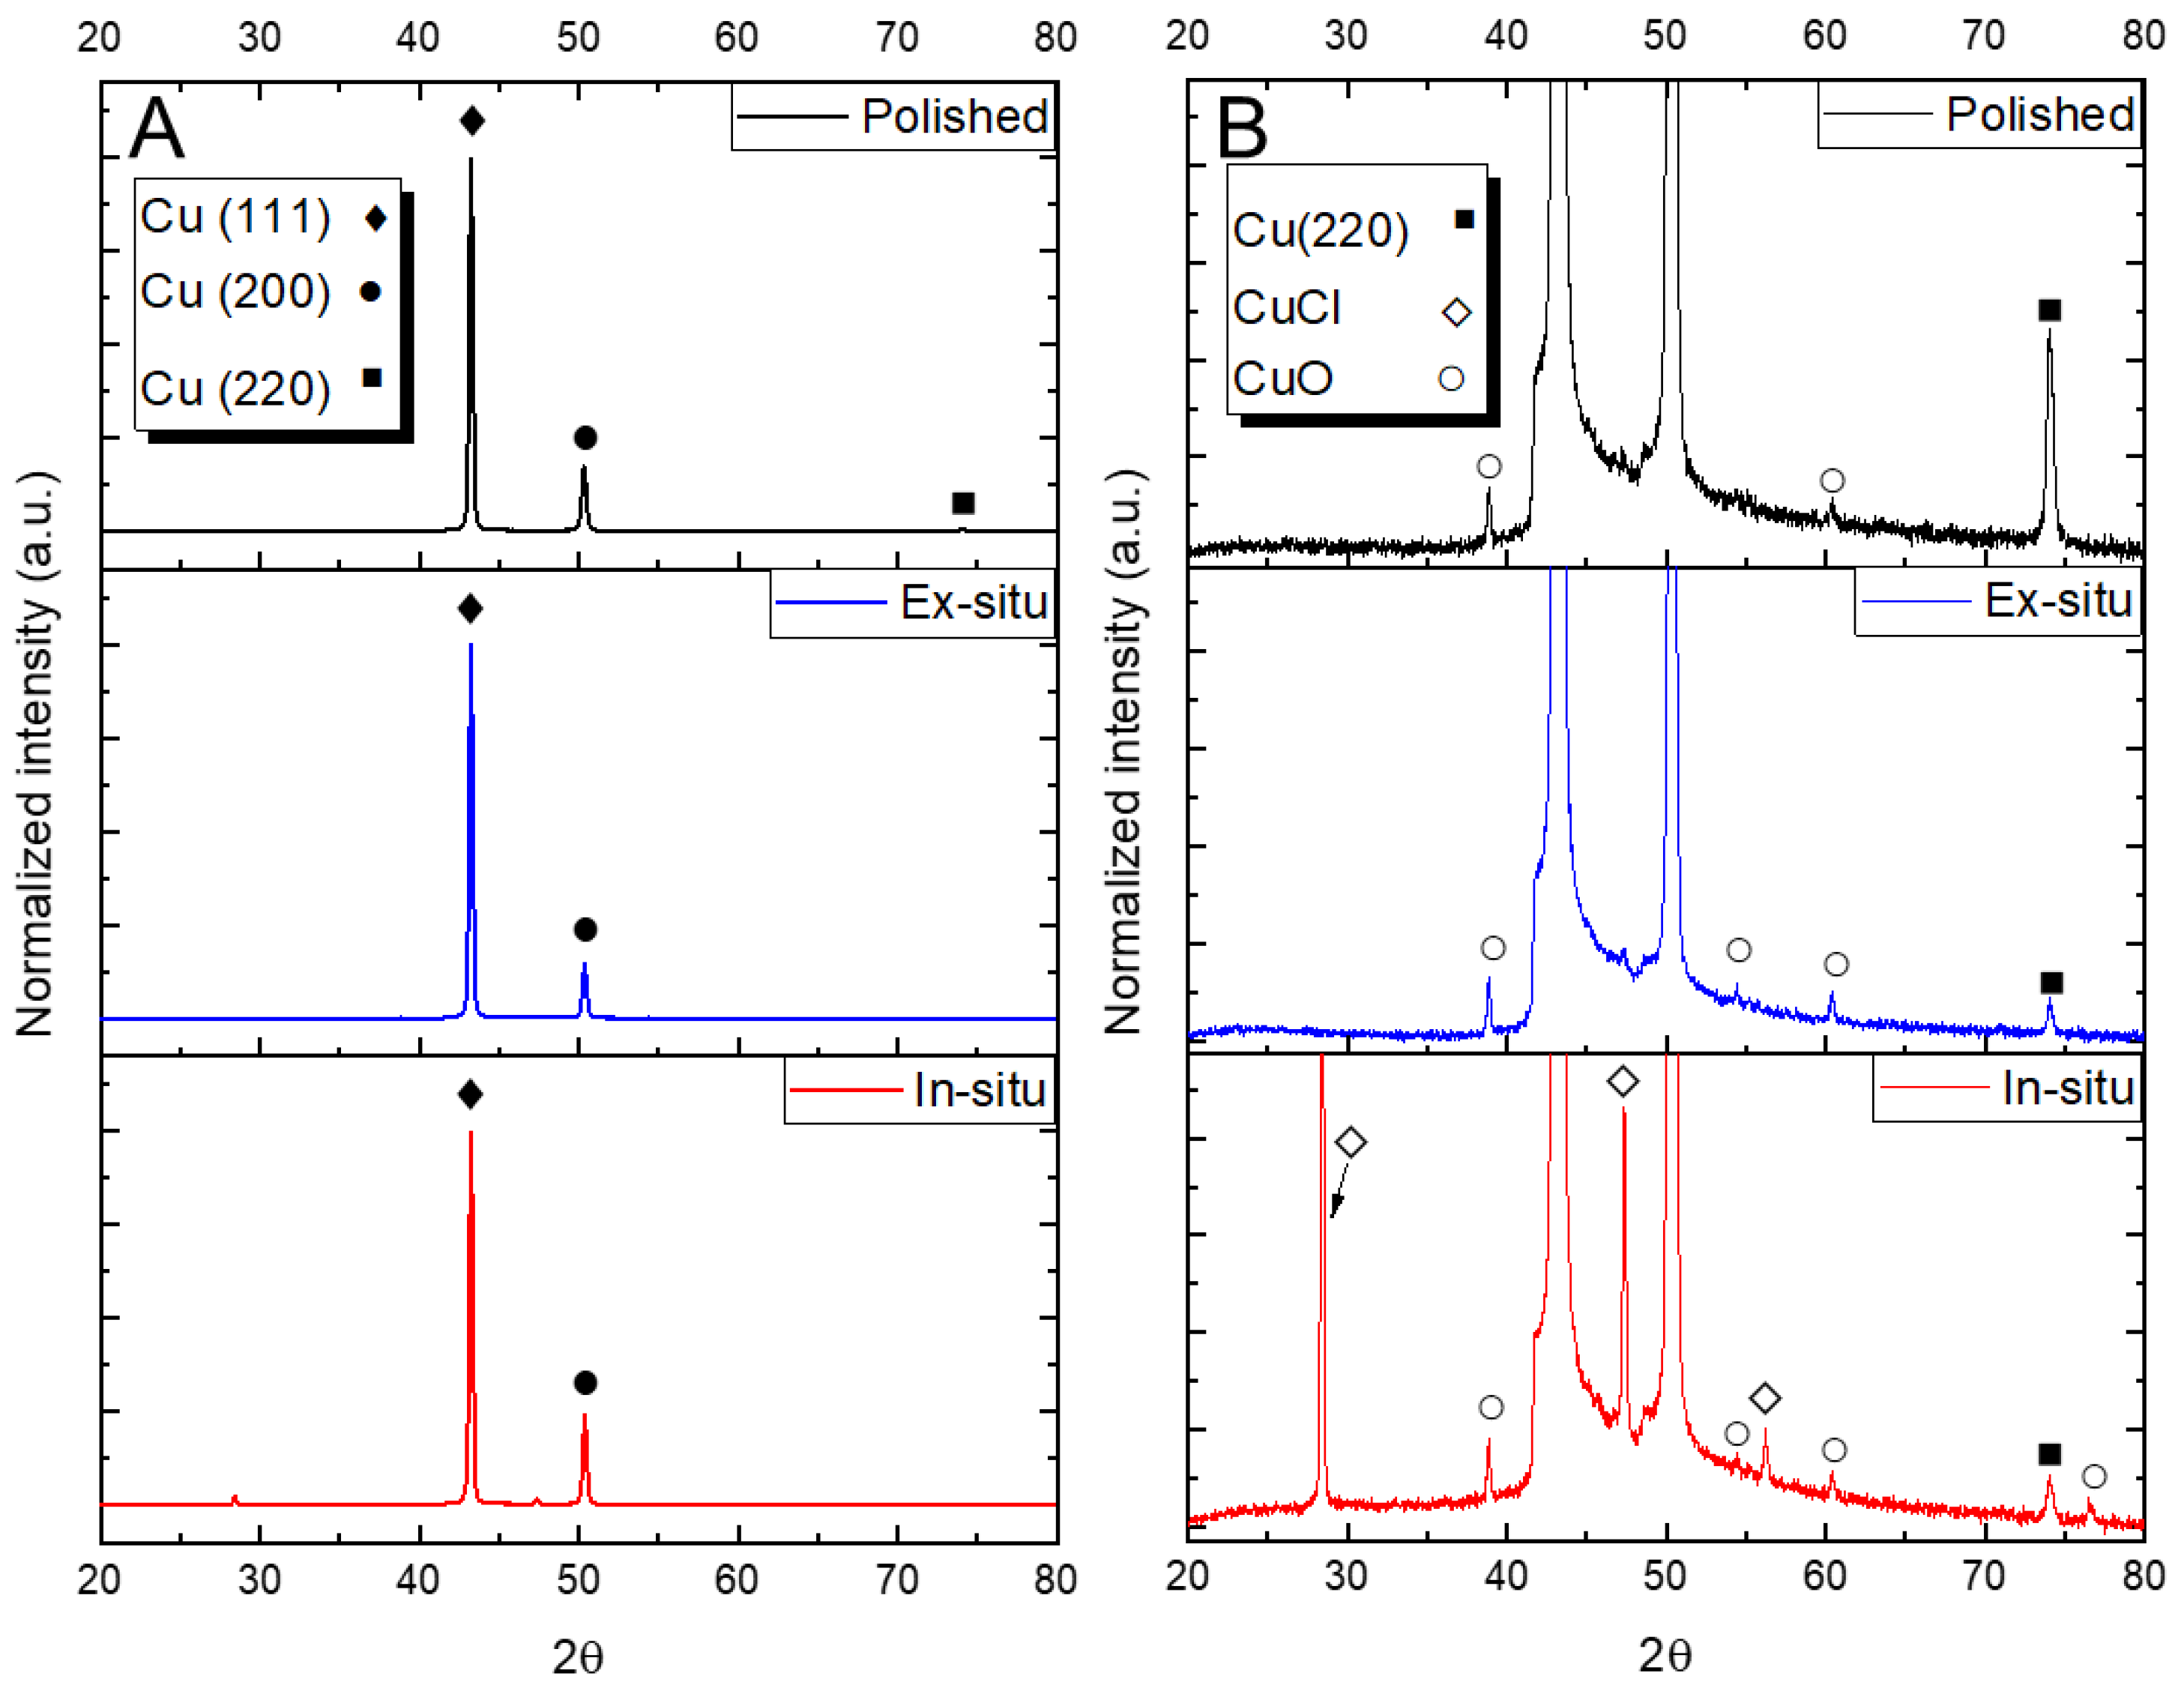
2.5. X-ray Diffraction

X-ray Diffraction patterns of corroded copper surfaces were measured using a Shimadzu XDR-6000 system with XDR-6000/7000 version 5.21 software. X-rays were generated with a copper source operating at 30mA and 30 kV. The data was collected over an angular range, 2θ, from 10° to 80° with a scanning rate of 1° min−1.

3. Results

3.1. NMR and AA Measurements

Figure 3 shows the variation of [Cu2+] in the corrosive medium (square symbols) as a function of corrosion time using R2 values and the calibration curve of Equation (1). These results show that the NMR magnetic field reduces the copper corrosion (red squares) when compared to the reaction for B = 0 (black squares). After 24 h, copper corrosion in the presence and absence of B led to a final [Cu2+] of (1.00 ± 0.03) × 10−3 mol L−1 and (1.90 ± 0.07) × 10−3 mol L−1, respectively. These results correspond to a reduction of about 46% in the corrosion rate in the presence of B. The [Cu2+] in 24 h were confirmed by atomic absorption spectroscopy (AA), which is a classical method for quantification of Cu2+ (Figure 4, triangle symbols). It is worth pointing out that the for the AA experiments, it was necessary to dilute the corrosive medium up to 20 times prior to the measurements. This not only increases the time required for each measurement but may also introduce errors due to the dilutions. Therefore, NMR has the advantage in this regard, since this dilution step is not needed, fewer errors are introduced and the [Cu2+] values are obtained in real-time.

3.2. Surface Analyses

After 24 h of the corrosion reactions, the electrode surfaces were analyzed by atomic force microscopy (AFM) and X ray diffraction (XRD). The AFM and XRD measurements required no special surface pre-treatment. The copper cylinder was simply rinsed with ultra-pure water and dried before being immediately analyzed.
Figure 5A,B show the typical three-dimensional AFM image of the corroded copper surface for B = 0 and B > 0, respectively. The image of the copper surface corroded with B = 0 is smoother, with a maximum peak to valley amplitude of 3 µm and root means square roughness (Rmsr) of 387 m, than the surface corroded with B > 0, with maximum peak to valley amplitude of 6 µm and Rmsr of 1263. The Rms roughness results confirm that the corroded surface under the magnetic field is over three times rougher than the corroded surface outside the magnetic field indicating that the magnetic field not only changes the corrosion rate but also has strong influence on the surface topology.
The corroded copper surfaces were also analyzed using XRD. Figure 6 shows the normalized XRD patterns of the copper surfaces before (polished), after corrosion reactions with B = 0 and B > 0. Figure 6A illustrates the DRX patterns normalized by the intensity of the stronger signal at 2θ = 43.2° and Figure 6B is the magnification of Figure 6A to show the least intense peaks.
The diffraction peaks at the angles, 2θ, of 43.2°, 50.4°, and 74.1° were assigned to the Cu reflections due to the crystalline planes (111), (200), and (220), respectively, according to the JCPDS card number 04.0836. The intensity of the (220) plane was reduced in both corrosion processes when compared to the surface before the reaction (Figure 6B), indicating that this plane is corroded preferentially. Furthermore, in Figure 6B it is also possible to see the peaks at 2θ equal to 28.7°, 47.2°, and 55.9° attributed to CuCl (JCPDS card number 82.2114), open diamonds. The peaks attributed to CuO (JCPDS card number 80-1917) are represented by open circles, which are minor phases in the corroded surfaces. As the CuCl was observed only in the surface corroded when B > 0 it indicates that B favors this phase. The CuO phase (open circles) is present in all samples due to copper being oxidized by atmospheric oxygen.

4. Discussion

The results of Figure 4 and Figure 6 show that the magnetic field mitigates the corrosion process, leading to a rough surface covered by a CuCl phase, when compared to the results in the absence of B. These results can be explained by analyzing the magnetic forces at play during the experiments when B > 0. The 0.23 T magnetic field of the spectrometer is quite homogeneous (variation lower than 200 ppm) as measured by the NMR signal. For this reason, the Kelvin force can be considered to be null and will not be discussed further. Thus, the main forces acting on the solution are the magnetic force (FB), which acts on charged species in motion, and the paramagnetic concentration force (FP). In our system, the [H+] and [Cl] ions are homogeneously distributed in the corrosive solution and their random movements lead to a net null effect of the magnetic force [42]. Therefore, it is expected that the non-random motion of newly formed Cu2+ ions, due to their concentration gradient, generates convective flows by the interaction between the magnetic field and the charged particles. Since these convective flows can agitate the solution, an increase in the corrosion rate would, a priori, be expected. However, Figure 4 shows that the presence of B reduces the corrosion rate. A similar protective effect of B was observed when copper clad laminate discs were corroded with a FeCl3 solution, in the presence of a homogeneous B [24], and when the copper sheet was corroded with a nitric acid solution [19]. It is thought that the reason for this reduced corrosion rate by the FeCl3 solution, when in the presence of the magnetic field, is the centripetal force acting on the Cu2+ ions, due to the action of the magnetic force on the ions diffusing radially from the metal surface. This centripetal force increases the time required for the ions to leave the vicinity of the electrode, thereby also increasing the time taken for corroding ions to reach the electrode surface. The rotating flow of the corrosive HCl medium could be present in the current experiments when B > 0, but due to the experimental setup; it was not possible to verify this claim. The rotation would be slower than the ones observed in FeCl3 solution since the rotation velocity is dependent on the release of Cu2+ from the metal surface, which is much slower in HCl. Therefore, another mitigating mechanism must also to be present.
Given that materials can be attracted (paramagnetic and ferromagnetic) or repelled (diamagnetic) by B, it is crucial to understand the response of the corrosion cell materials to the applied magnetic field. The magnetic field flux density (B) is a vector sum given by [43]:
B = µ0(H + M)
where µ0 is the magnetic permeability of free space, H is the magnetic field strength, and M is the magnetization of the material (or the total magnetic field induced in the material by the external magnetic field). At the beginning, the solution magnetization (Mp) is small because the system starts from a diamagnetic solution (HCl in water) and diamagnetic copper rod and Teflon. As time goes by, due to the corrosion process, Cu2+ concentration increases, and the solution becomes more and more paramagnetic until the intensity of Mp becomes large enough to have a noticeable effect on B. Thus, for our particular system, Equation (5) can be rewritten as:
B = μ H a p p + μ M p
where Happ is the contribution from the external field and M p is the magnetization of the solution, and µ is the magnetic permeability of the solution. Therefore, in the absence of B the distribution of copper ions in solution is dependent on diffusion, natural convection, and electrostatic interactions. The copper ions formed at the metallic surface diffuse to the bulk of the solution due to the concentration gradient, ∇c, established as their concentration at the surface of the metal increases. However, in the presence of B the presence of Cu2+ close to metal surface also results in a magnetic susceptibility gradient (∇χ, where ∇χ = ∇χμc). Considering a volume unit, ∇χ is largest at the electrode/solution interface resulting in a FP that grows from the solution towards the surface of the electrode, i.e., the direction of FP is normal to the electrode surface and contrary to the Cu2+ diffusion direction. Thus, there is an accumulation of Cu2+ at the interface region decreasing the reaction rate (Figure 4) and explaining the presence of more CuCl in the copper surface as detected in XRD experiments for B > 0 (Figure 6). The CuCl protects the metal surface and could be the cause of the peaks observed in AFM images (Figure 5) as it may protect some regions, leading to the peaks being formed, while the valleys could be the regions without the CuCl phase. The scanning electron microscopy figures (see Supplementary Material, Figure S1) also confirm the different surface morphology for samples undergoing corrosion in situ vs ex situ. Therefore, both FB and FP cause a local saturation of the solution with Cu2+ at the interface region, leading to the results observed in this work.

5. Conclusions

TD-NMR is shown to be a simple, fast, and precise method to measure the [Cu2+] in real time during the corrosion of copper in an HCl solution. Furthermore, TD-NMR has proved advantageous in comparison to the consolidated AA technique, since it is possible to follow the entire corrosion process in real time and without any extra procedures, like dilutions. The 0.23 T TD-NMR magnetic field reduced the corrosion rate by approximately 46% indicating a protective effect of B in these experimental conditions. This protective effect is explained by the accumulation of Cu2+ in solution/metal interface for longer times due to magnetic forces. The accumulation of more Cu2+ ions in the vicinity of the electrode surface hinders the arrival of the corrosive agent while also attracting more chloride ions to stabilize the positive charges, thereby increasing the probability of CuCl formation, and maintaining the CuCl phase for a longer time. This may contribute to the rougher surface observed when the corrosion was performed in presence of B. The TD-NMR used here can also be a useful method to study the effect of B in corrosion of other metals or other corrosive liquid media when the reactions produce or consume paramagnetic ions, while the use of a magnetic field has the potential to be useful in delaying corrosion processes in applications such as ships or underwater infrastructure (e.g., tidal turbines).

Supplementary Materials

The following supporting information can be downloaded at: https://0-www-mdpi-com.brum.beds.ac.uk/article/10.3390/magnetochemistry8040040/s1, Figure S1: SEM imaging of the electrode surfaces performed at the end of the corrosion experiments.

Author Contributions

C.I.N.M.: conceptualization, methodology, formal analysis, investigation, and writing—original draft preparation. B.F.G.: conceptualization, methodology, investigation, writing—review and editing, and funding acquisition. L.A.C.: conceptualization, methodology, writing—original draft preparation, supervision, project administration, and funding acquisition. C.M.S.L.: writing—original draft preparation, and review and editing. E.P.: formal analysis and writing—original draft preparation. C.R.: writing—review and editing and funding acquisition. All authors have read and agreed to the published version of the manuscript.

Funding

This research was funded by Brazilian agencies FAPESP (Grant No. 2012/22281-9, 2019/13656-8, and 2021/12694-3), CAPES (Grant No. 1421855), CNPq (Grant No. 142238/2017-1 and 302866/2017-5) and by Deutsche Forschungsgemeinschaft (DFG, German Research Foundation) Project-ID RO 2454/19-1.

Data Availability Statement

Please refer to suggested Data Availability Statements in section “MDPI Research Data Policies” at https://0-www-mdpi-com.brum.beds.ac.uk/ethics (accessed on 20 February 2022).

Conflicts of Interest

The authors declare no conflict of interest.

References

  1. Philip, A.; Schweitzer, P.E. Fundamentals of Corrosion Mechanisms, Causes, and Preventative Methods; CRC Press: Boca Raton, FL, USA, 2009. [Google Scholar]
  2. Hansson, C.M. The Impact of Corrosion on Society. Metall. Mater. Trans. A 2011, 42, 2952–2962. [Google Scholar] [CrossRef]
  3. Koch, G. Cost of corrosion. In Trends in Oil and Gas Corrosion Research and Technologies; El-Sherik, A.M., Ed.; Woodhead Publishing: Boston, MA, USA, 2017; pp. 3–30. [Google Scholar]
  4. Palanisamy, G. Corrosion Inhibitors; Singh, A., Ed.; IntechOpen: London, UK, 2019. [Google Scholar] [CrossRef] [Green Version]
  5. Bahmani, A.; Arthanari, S.; Shin, K.S. Formulation of corrosion rate of magnesium alloys using microstructural parameters. J. Magnes. Alloy 2020, 8, 134–149. [Google Scholar] [CrossRef]
  6. Andrade, C.; Alonso, C. Corrosion rate monitoring in the laboratory and on-site. Constr. Build Mater. 1996, 10, 315–328. [Google Scholar] [CrossRef]
  7. Schmitt, R.J.; Christian, R.R. Monitoring Corrosion. Ind. Eng. Chem. Res. 1960, 52, 71A–74A. [Google Scholar] [CrossRef]
  8. Usman, A.D.; Victoria, A.F.; Okoro, L.N. Weight Loss Corrosion Study of Some Metals in Acid Medium. J. Adv. Chem. 2016, 11, 3434–3440. [Google Scholar] [CrossRef] [Green Version]
  9. Oparaodu, K.O.; Okpokwasili, G.C. Comparison of Percentage Weight Loss and Corrosion Rate Trends in Different Metal Coupons from two Soil Environments. Int. J. Environ. Bioremediat. Biodegrad. 2022, 2, 243–249. [Google Scholar] [CrossRef]
  10. Zou, F.; Cegla, F.B. On quantitative corrosion rate monitoring with ultrasound. J. Electroanal. Chem. 2018, 812, 115–121. [Google Scholar] [CrossRef]
  11. Grachev, V.A.; Rozen, A.E.; Perelygin, Y.P.; Kireev, S.Y.; Los, I.S.; Rozen, A.A. Measuring corrosion rate and protector effectiveness of advanced multilayer metallic materials by newly developed methods. Heliyon 2018, 4, e00731. [Google Scholar] [CrossRef] [Green Version]
  12. Vukmirovic, M.B.; Adzic, R.R.; Akolkar, R. Copper Electrodeposition from Deep Eutectic Solvents—Voltammetric Studies Providing Insights into the Role of Substrate: Platinum vs Glassy Carbon. J. Phys. Chem. B 2020, 124, 5465–5475. [Google Scholar] [CrossRef] [PubMed]
  13. Sherif, E.-S.M.; Erasmus, R.M.; Comins, J.D. Corrosion of copper in aerated acidic pickling solutions and its inhibition by 3-amino-1,2,4-triazole-5-thiol. J. Colloid Interface Sci. 2007, 306, 96–104. [Google Scholar] [CrossRef]
  14. Habbache, N.; Alane, N.; Djerad, S.; Tifouti, L. Leaching of copper oxide with different acid solutions. Chem. Eng. J. 2009, 152, 503–508. [Google Scholar] [CrossRef]
  15. Habashi, F. Kinetics of corrosion of metals. J. Chem. Educ. 1965, 42, 318. [Google Scholar] [CrossRef]
  16. Fateh, A.; Aliofkhazraei, M.; Rezvanian, A.R. Review of corrosive environments for copper and its corrosion inhibitors. Arab. J. Chem. 2020, 13, 481–544. [Google Scholar] [CrossRef]
  17. Shinohara, K.; Aogaki, R. Magnetic Field Effect on Copper Corrosion in Nitric Acid. Electrochemistry 1999, 67, 126–131. [Google Scholar] [CrossRef] [Green Version]
  18. Kountouras, D.T.; Vogiatzis, C.A.; Tsouknidas, A.; Skolianos, S. Preventing or accelerating galvanic corrosion through the application of a proper external magnetic field. Corros. Eng. Sci. Technol. 2014, 49, 603–607. [Google Scholar] [CrossRef]
  19. Sagawa, M. Effect of a Local Magnetic Field on the Dissolution of Copper and Iron in Nitric Acid Solution. Trans. Jpn. Inst. Met. 1982, 23, 38–40. [Google Scholar] [CrossRef] [Green Version]
  20. Lu, Z.; Huang, D.; Yang, W.; Congleton, J. Effects of an applied magnetic field on the dissolution and passivation of iron in sulphuric acid. Corros. Sci. 2003, 45, 2233–2249. [Google Scholar] [CrossRef]
  21. Sueptitz, R.; Tschulik, K.; Uhlemann, M.; Gebert, A.; Schultz, L. Impact of magnetic field gradients on the free corrosion of iron. Electrochim. Acta 2010, 55, 5200–5203. [Google Scholar] [CrossRef]
  22. Nasher, L.S.H.; Shalash, L.A.B.T. Study the effect of magnetic field on the corrosion of steel in sodium chloride solution (NaCl). Misan J. Acad. Stud. 2010, 9, 30–38. [Google Scholar]
  23. Ang, L.Y.; Othman, N.K.; Jalar, A.; Ismail, I. The Effect of Magnetic Field on Copper in Various Corrosive Medium, in 14th Post-Graduate Colloquium of Faculty-of-Science-and-Technology of Universiti-Kebangsaan-Malaysia, Univ Kebangsaan Malaysia, Fac Sci & Technol, Selangor, Malaysia, 1614. AIP Conf. Proc. 2014, 26–29. [Google Scholar] [CrossRef] [Green Version]
  24. Mitre, C.I.N.; Tosin, G.; Colnago, L.A. In-operando analysis of the corrosion patterns and rates under magnetic fields using metallic film. NPJ Mater. Degrad. 2022, 6, 24. [Google Scholar] [CrossRef]
  25. Iwai, M.; Majima, H.; Awakura, Y. Dissolution of copper in hydrochloric acid solutions with dissolved molecular oxygen. Hydrometallurgy 1988, 20, 87–95. [Google Scholar] [CrossRef]
  26. Sisso, O.; Dor, S.; Eliyahu, D.; Sabatani, E.; Eliaz, N. Corrosion inhibition of copper in ferric chloride solutions with organic inhibitors. NPJ Mater. Degrad. 2020, 4, 38. [Google Scholar] [CrossRef]
  27. Gomes, B.F.; Nunes, L.M.S.; Lobo, C.M.S.; Cabeca, L.F.; Colnago, L.A. In Situ Study of the Magnetoelectrolysis Phenomenon during Copper Electrodeposition Using Time Domain NMR Relaxometry. Anal. Chem. 2014, 86, 9391–9393. [Google Scholar] [CrossRef] [PubMed]
  28. Gomes, B.F.; Nunes, L.M.S.; Lobo, C.M.S.; Carvalho, A.S.; Cabeca, L.F.; Colnago, L.A. In situ analysis of copper electrodeposition reaction using unilateral NMR sensor. J. Magn. Reson. 2015, 261, 83–86. [Google Scholar] [CrossRef] [PubMed]
  29. Lobo, C.M.S.; Gomes, B.F.; Bouzouma, H.; Danieli, E.; Blümich, B.; Colnago, L.A. Improving in operando low field NMR copper electrodeposition analyses using inductively coupled coils. Electrochim. Acta 2019, 298, 844–851. [Google Scholar] [CrossRef]
  30. Nunes, L.M.S.; Cobra, P.F.; Cabeca, L.F.; Barbosa, L.L.; Colnago, L.A. In Situ Quantification of Cu(II) during an Electrodeposition Reaction Using Time-Domain NMR Relaxometry. Anal. Chem. 2012, 84, 6351–6354. [Google Scholar] [CrossRef]
  31. Gomes, B.F.; Burato, J.; Lobo, C.M.S.; Colnago, L.A. Use of the Relaxometry Technique for Quantification of Paramagnetic Ions in Aqueous Solutions and a Comparison with Other Analytical Methods. Int. J. Anal. Chem. 2016. [Google Scholar] [CrossRef] [PubMed]
  32. Bloch, F.; Hansen, W.W.; Packard, M. Nuclear Induction. Phys. Rev. 1946, 69, 127. [Google Scholar] [CrossRef] [Green Version]
  33. Bloembergen, N.; Purcell, E.M.; Pound, R.V. Relaxation Effects in Nuclear Magnetic Resonance Absorption. Phys. Rev. 1948, 73, 679–712. [Google Scholar] [CrossRef]
  34. Kock, F.V.C.; Machado, M.P.; Athayde, G.P.B.; Colnago, L.A.; Barbosa, L.L. Quantification of paramagnetic ions in solution using time domain NMR. Pros and Cons to optical emission spectrometry method. Microchem. J. 2018, 137, 204–207. [Google Scholar] [CrossRef]
  35. Gomes, B.F.; Lobo, C.M.; Colnago, L.A. Monitoring Electrochemical Reactions in Situ with Low Field NMR: A Mini-Review. Appl. Sci. 2019, 9, 498. [Google Scholar] [CrossRef] [Green Version]
  36. Cobra, P.F.; Gomes, B.F.; Mitre, C.I.N.; Barbosa, L.L.; Marconcini, L.V.; Colnago, L.A. Measuring the solubility product constant of paramagnetic cations using time-domain nuclear magnetic resonance relaxometry. Microchem. J. 2015, 121, 14–17. [Google Scholar] [CrossRef]
  37. Carr, H.Y.; Purcell, E.M. Effects of Diffusion on Free Precession in Nuclear Magnetic Resonance Experiments. Phys. Rev. 1954, 94, 630–638. [Google Scholar] [CrossRef]
  38. Meiboom, S.; Gill, D. Modified Spin-Echo Method for Measuring Nuclear Relaxation Times. Rev. Sci. Instrum. 1958, 29, 688–691. [Google Scholar] [CrossRef] [Green Version]
  39. Montrazi, E.T.; Monaretto, T.; Bonagamba, T.J.; Colnago, L.A. New and rapid pulse sequences for two-dimensional D-T1 correlation measurements. J. Magn. Reson. 2020, 315, 106749. [Google Scholar] [CrossRef]
  40. Neto, R.P.C.; Rodrigues, E.J.d.R.; Tavares, M.I.B. Single-shot measurement of solids and liquids T1 values by a small-angle flip-flop pulse sequence. Magn. Reason. Chem. 2019, 57, 395–403. [Google Scholar] [CrossRef]
  41. Weston, M.C.; Gerner, M.D.; Fritsch, I. Magnetic Fields for Fluid Motion. Anal. Chem. 2010, 82, 3411–3418. [Google Scholar] [CrossRef] [PubMed]
  42. Abdoli, I.; Sharma, A. Stochastic resetting of active Brownian particles with Lorentz force. Soft Matter 2021, 17, 1307–1316. [Google Scholar] [CrossRef] [PubMed]
  43. Jiles, D. Introduction to Magnetism and Magnetic Materials, 3rd ed.; CRC Press: Boca Raton, FL, USA, 2015. [Google Scholar]
Figure 1. Overview of the corrosion experiments.
Magnetochemistry 08 00040 g001
Figure 2. Schematic diagram of the experimental setup in NMR instrument (B > 0). (A) Copper cylinder, (B) cell, and (C) experimental setup.
Magnetochemistry 08 00040 g002
Figure 3. Calibration curve between [Cu2+] and R2, obtained with the CPMG sequence.
Magnetochemistry 08 00040 g003
Figure 4. [Cu2+] in the corrosive medium as function of reaction time. Black and Red squares are the [Cu2+] determined by TD-NMR relaxometry, using Equation (4), for B = 0 and for B > 0, respectively. The data points represent the average of 3 measurements and the error bars represent the standard deviation. The black and red triangles are [Cu2+] in solution for B = 0 and B > 0 at the end of the 24 h corrosion experiments, respectively, determined by AA.
Magnetochemistry 08 00040 g004
Figure 5. Three-dimensional AFM images of the copper surface corroded in HCl for after 24 h. (A) B = 0 and (B) B > 0. The scan area is 40 × 40 µm2.
Magnetochemistry 08 00040 g005
Figure 6. (A) Normalized X-ray diffraction pattern for copper surface: polished surface before the reaction (black); corroded surfaces in B = 0 (blue) and B > 0 (red). (B) Vertical expansion of the diffractograms of Figure 6A.
Magnetochemistry 08 00040 g006
Publisher’s Note: MDPI stays neutral with regard to jurisdictional claims in published maps and institutional affiliations.

