
Interlayer Coupling and High-Frequency Performance in Magnetic Anisotropic FeCoB/Hf/FeCoB Trilayers with Various Hf Thicknesses

Abstract
:1. Introduction
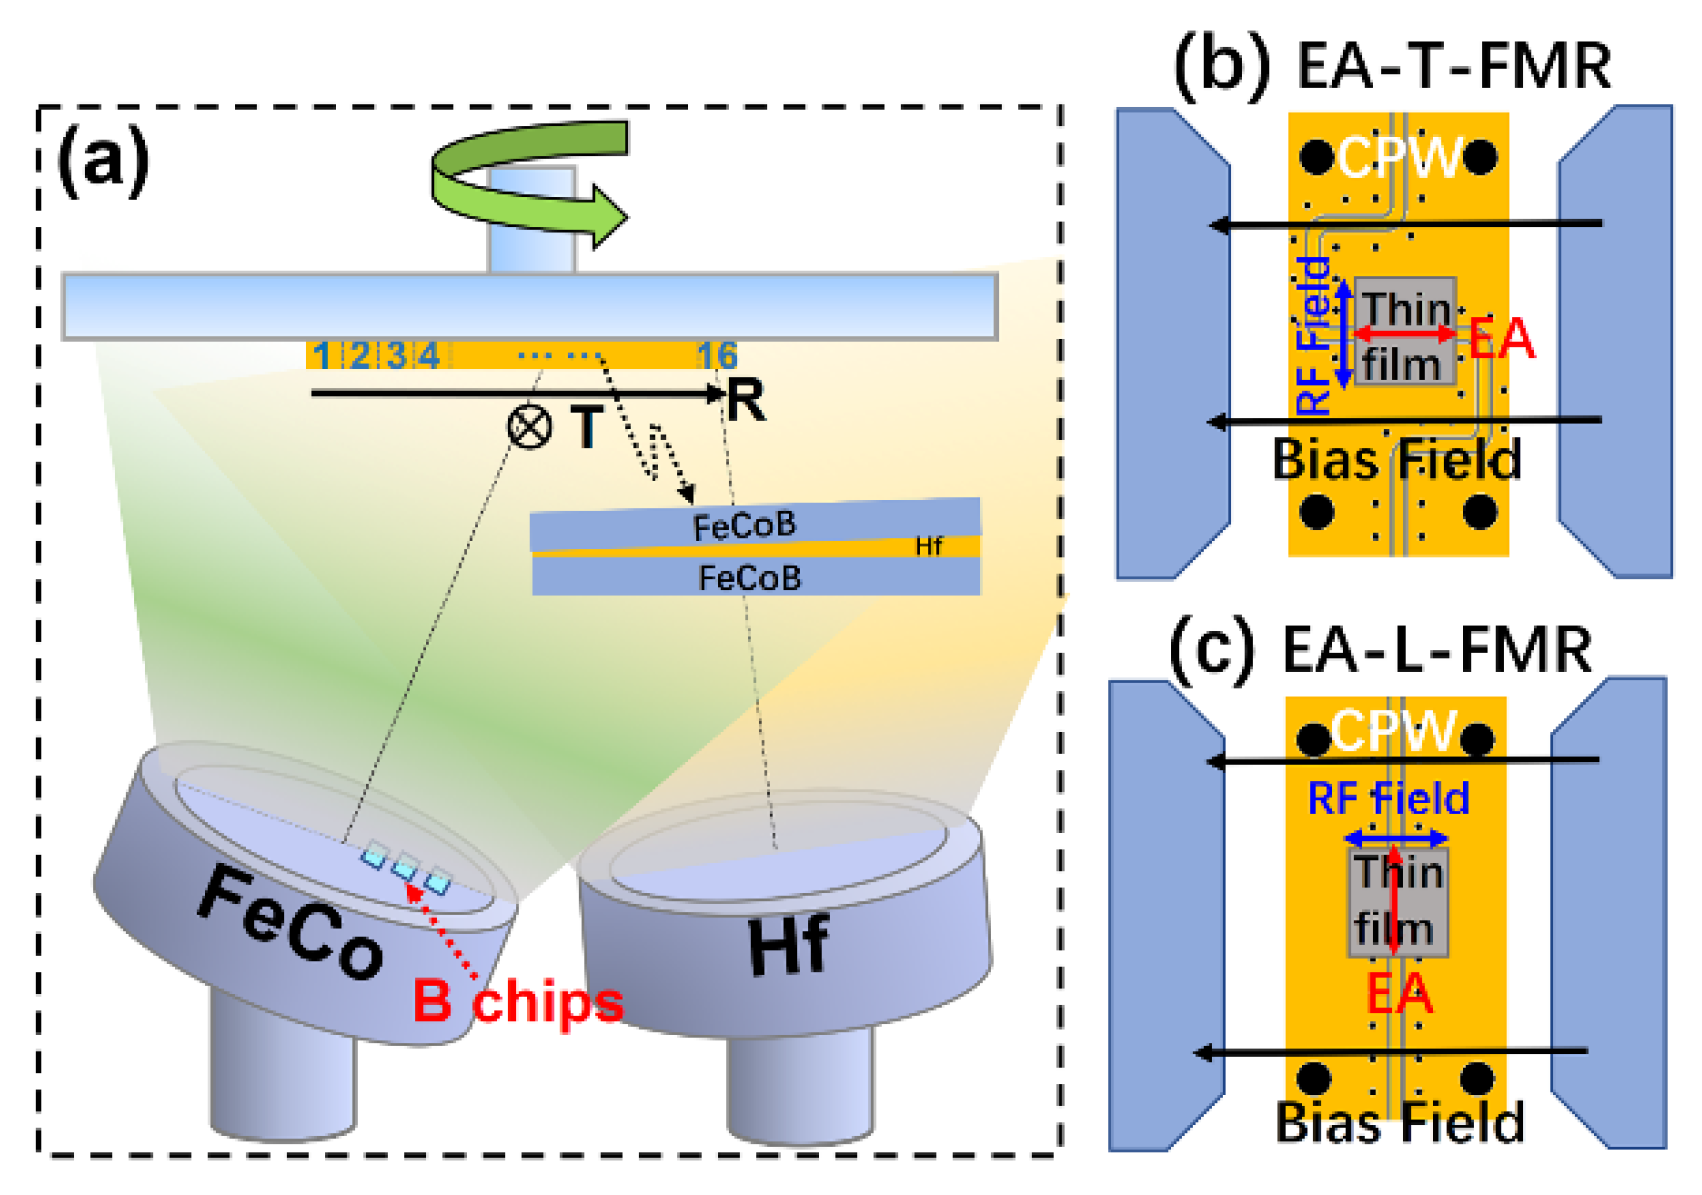
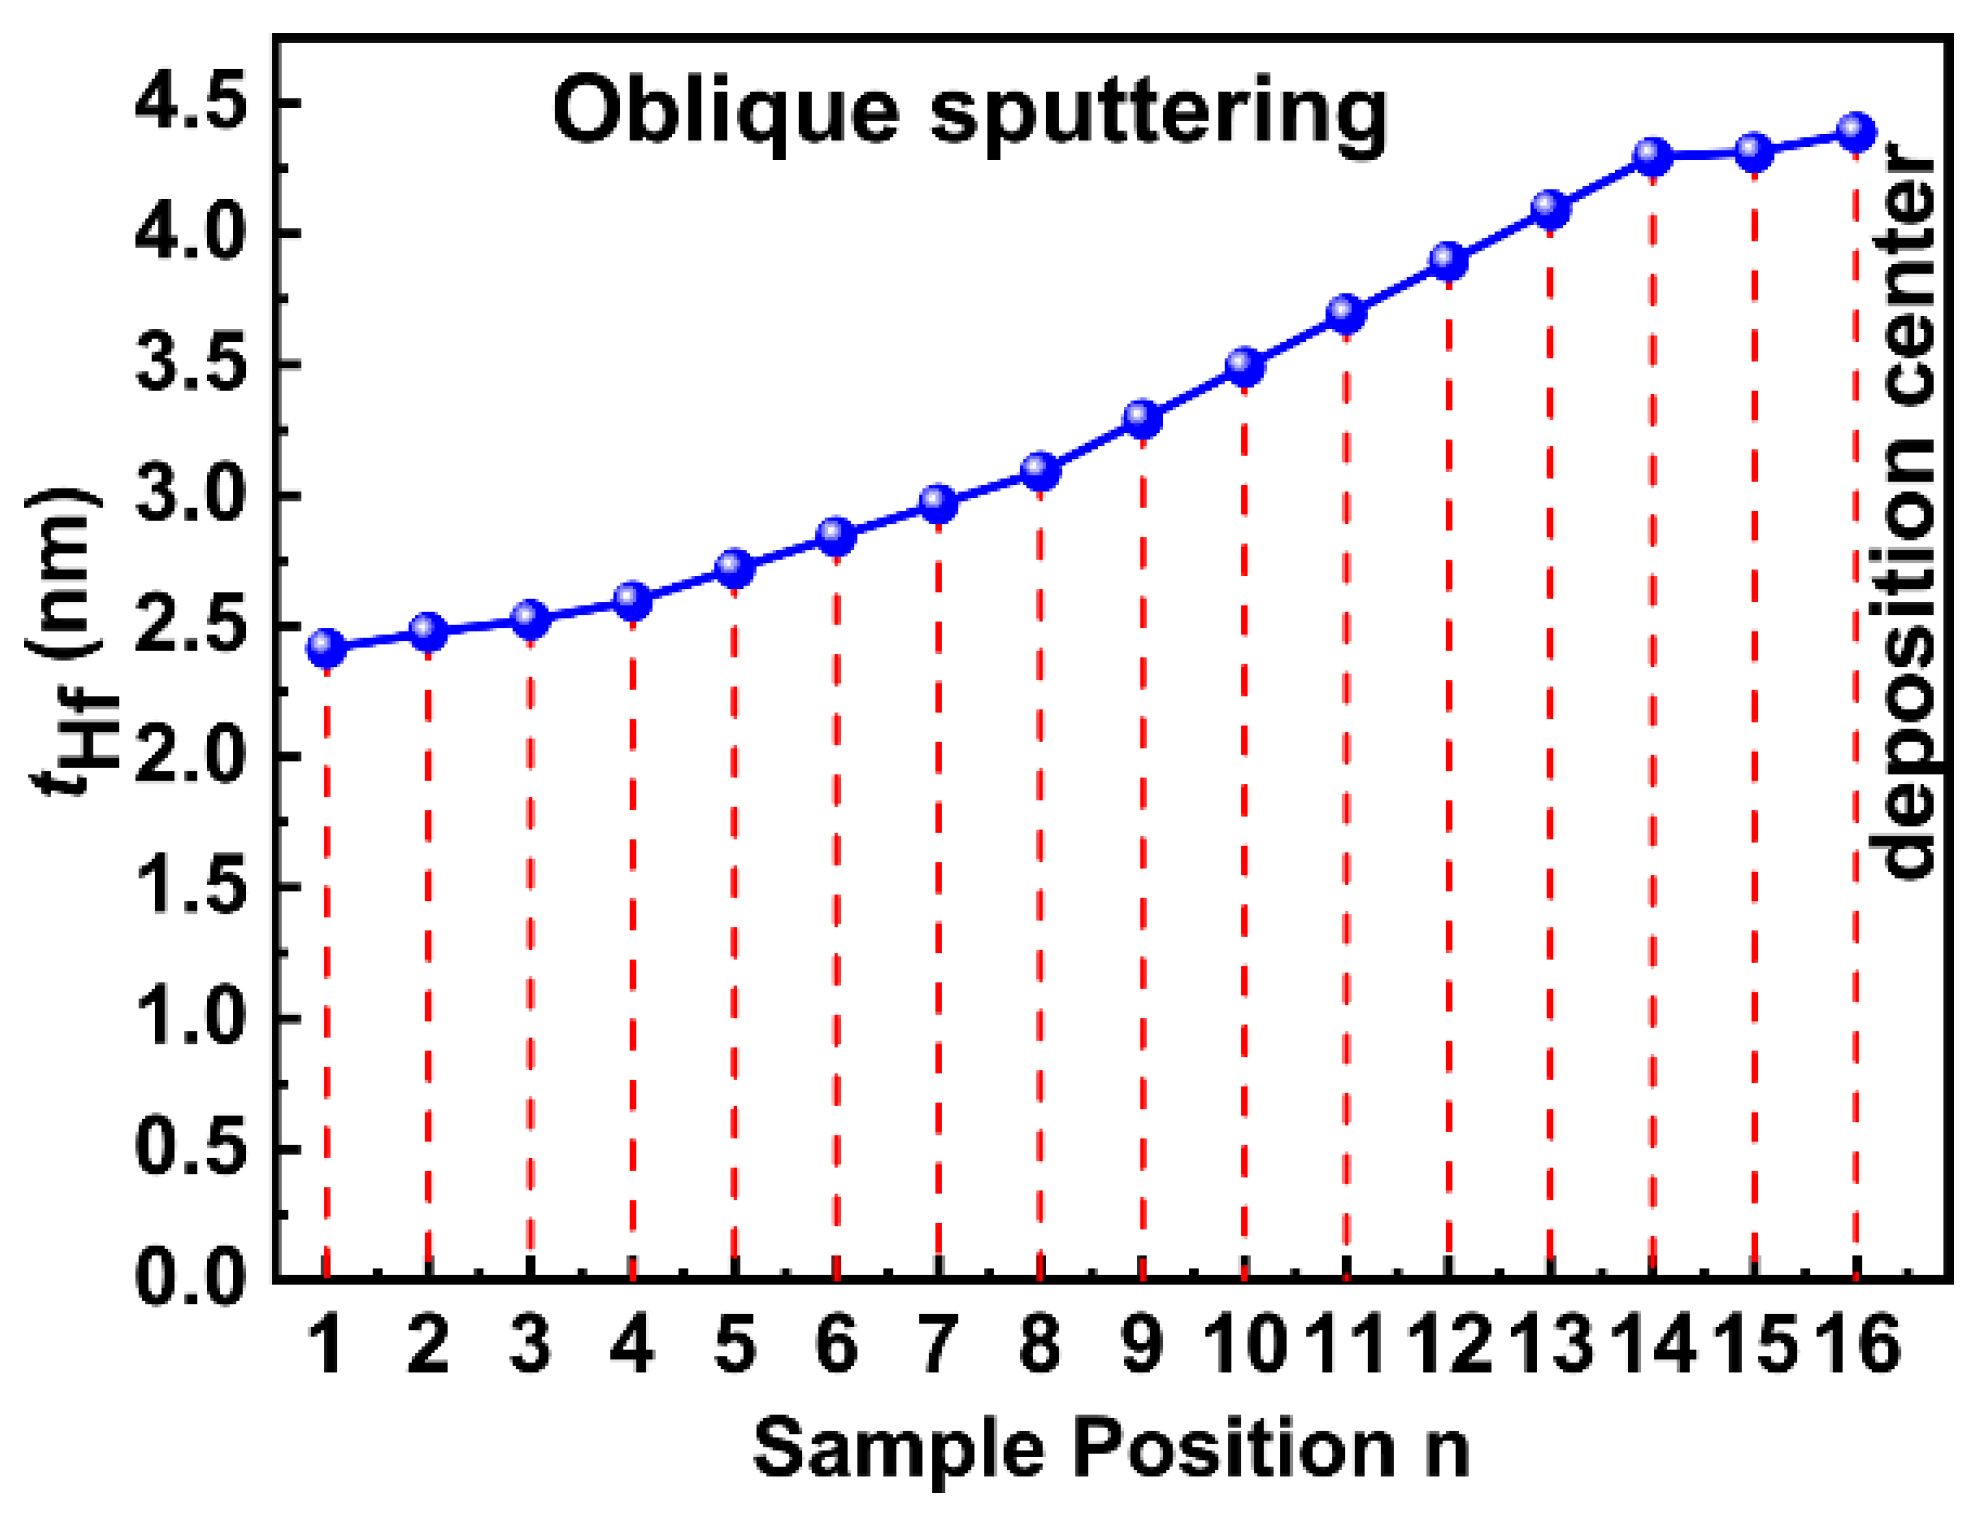
2. Experimental
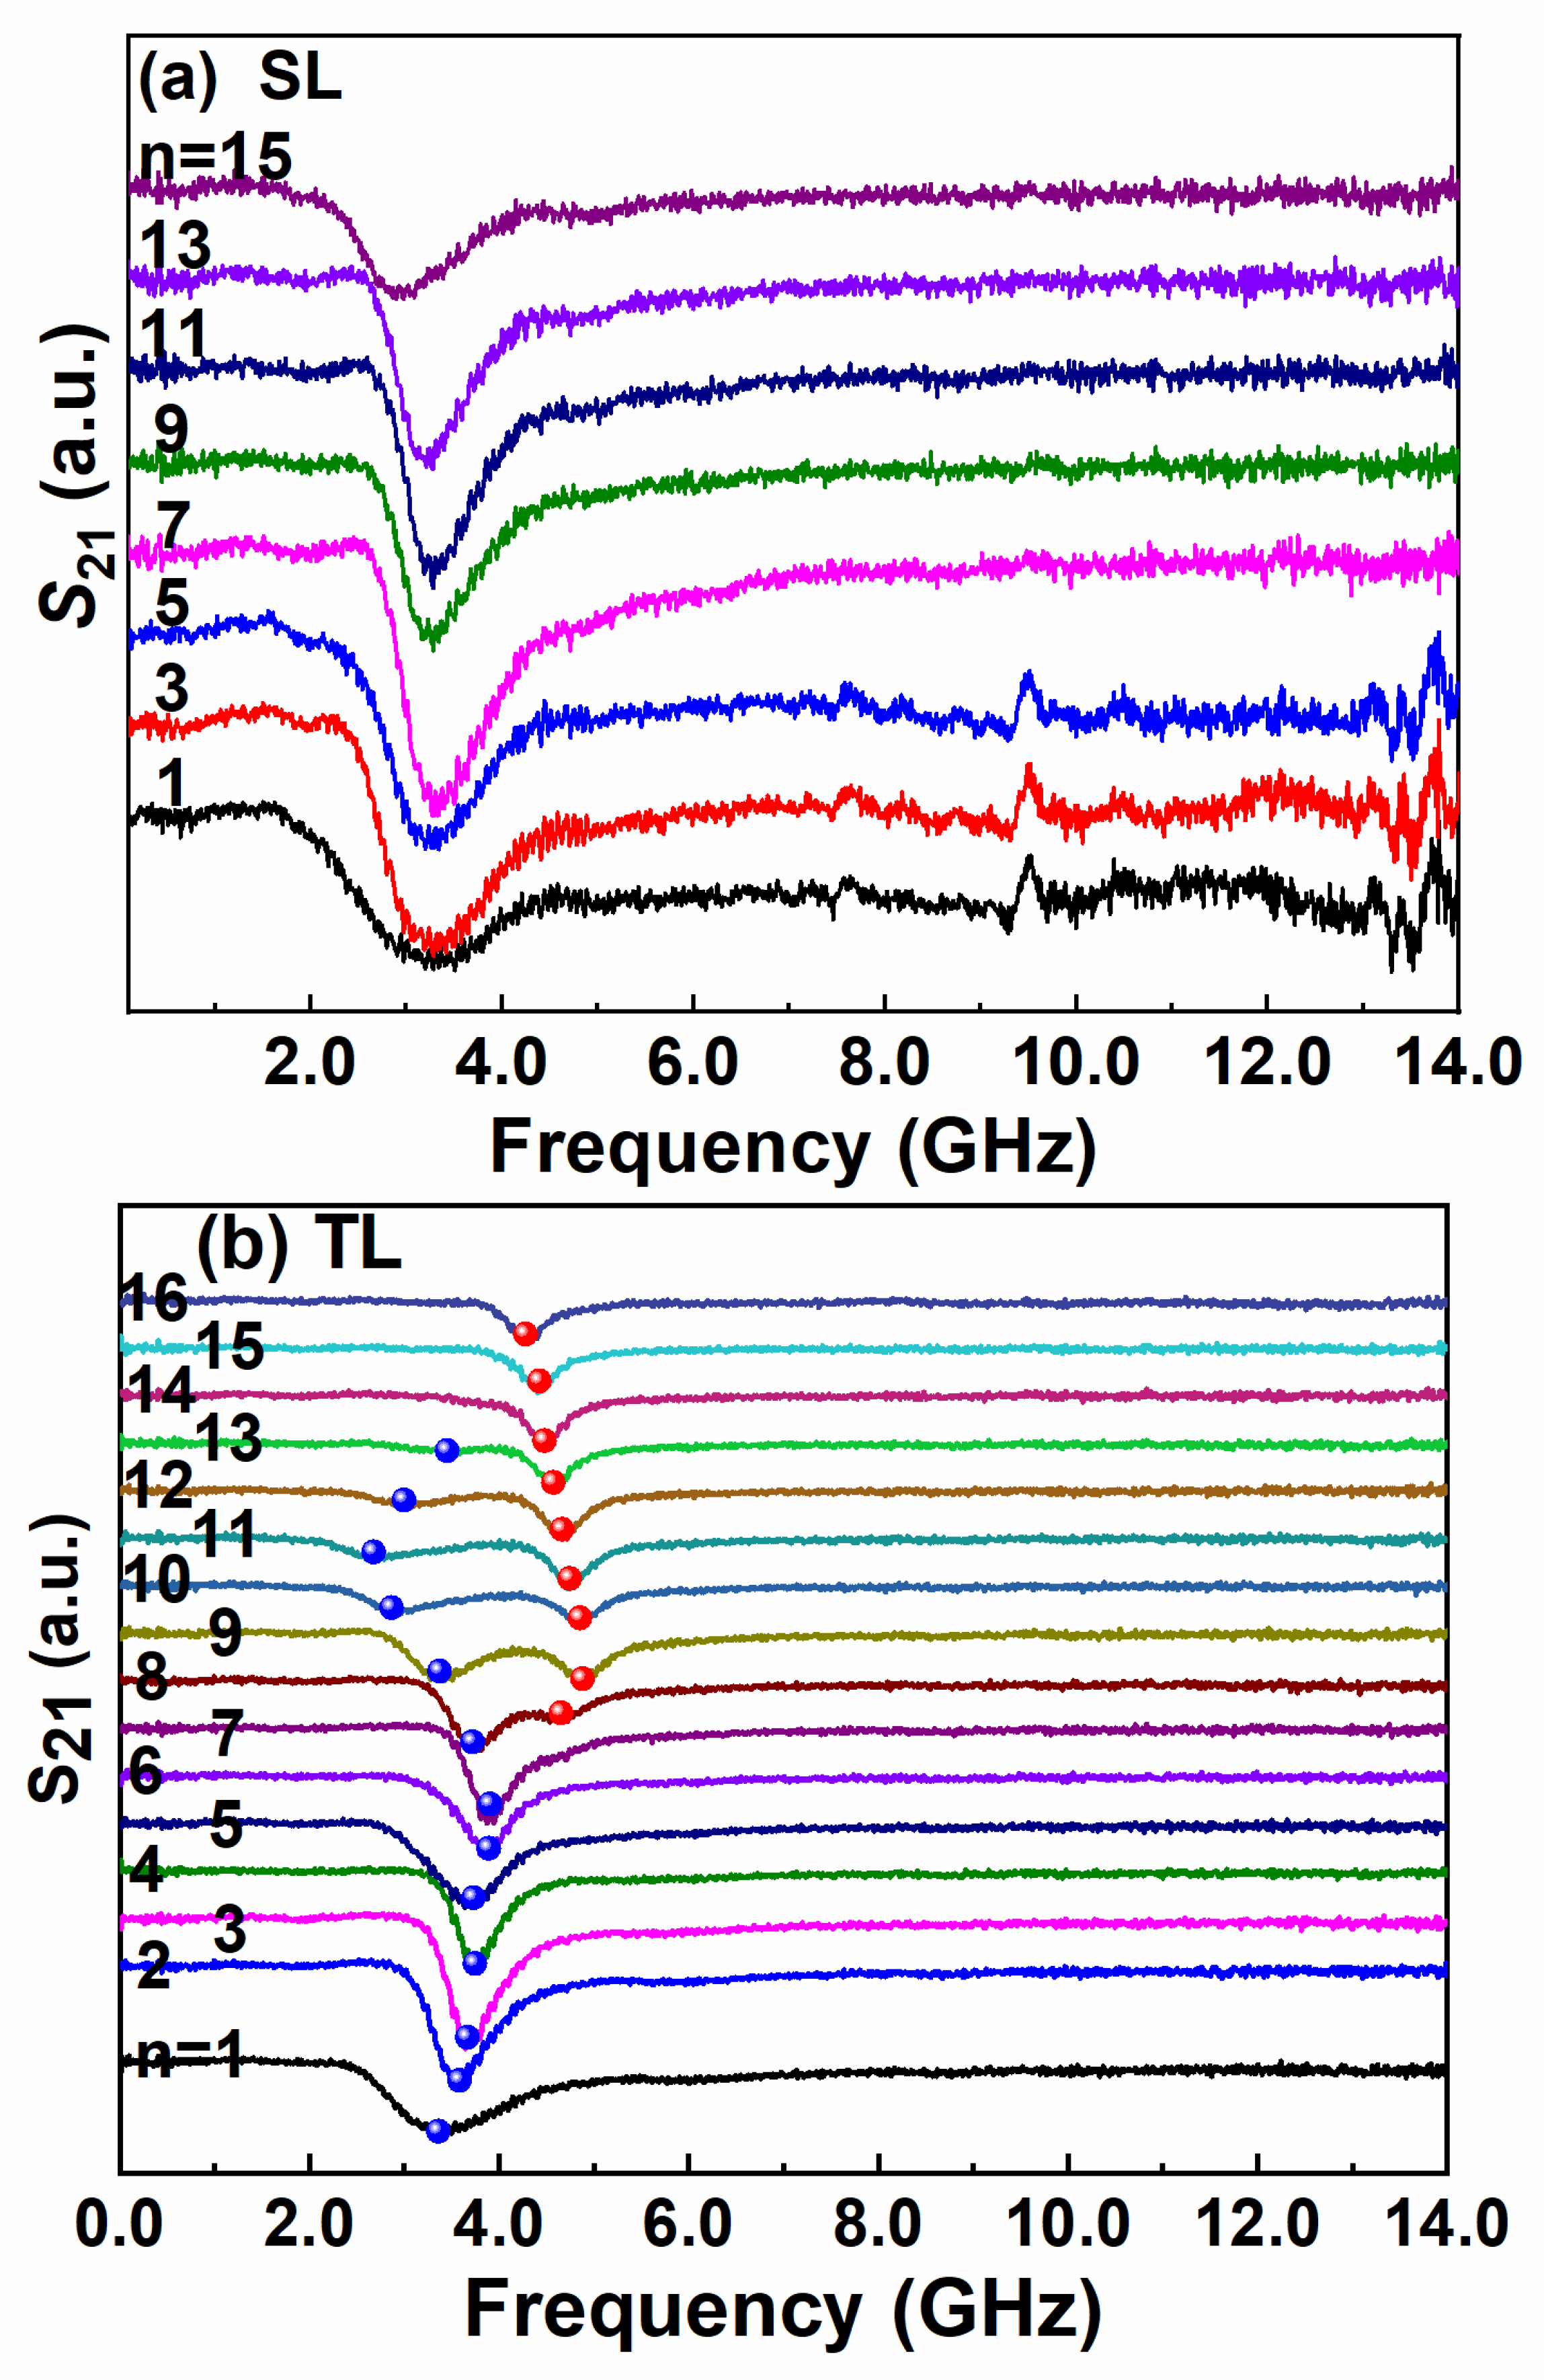
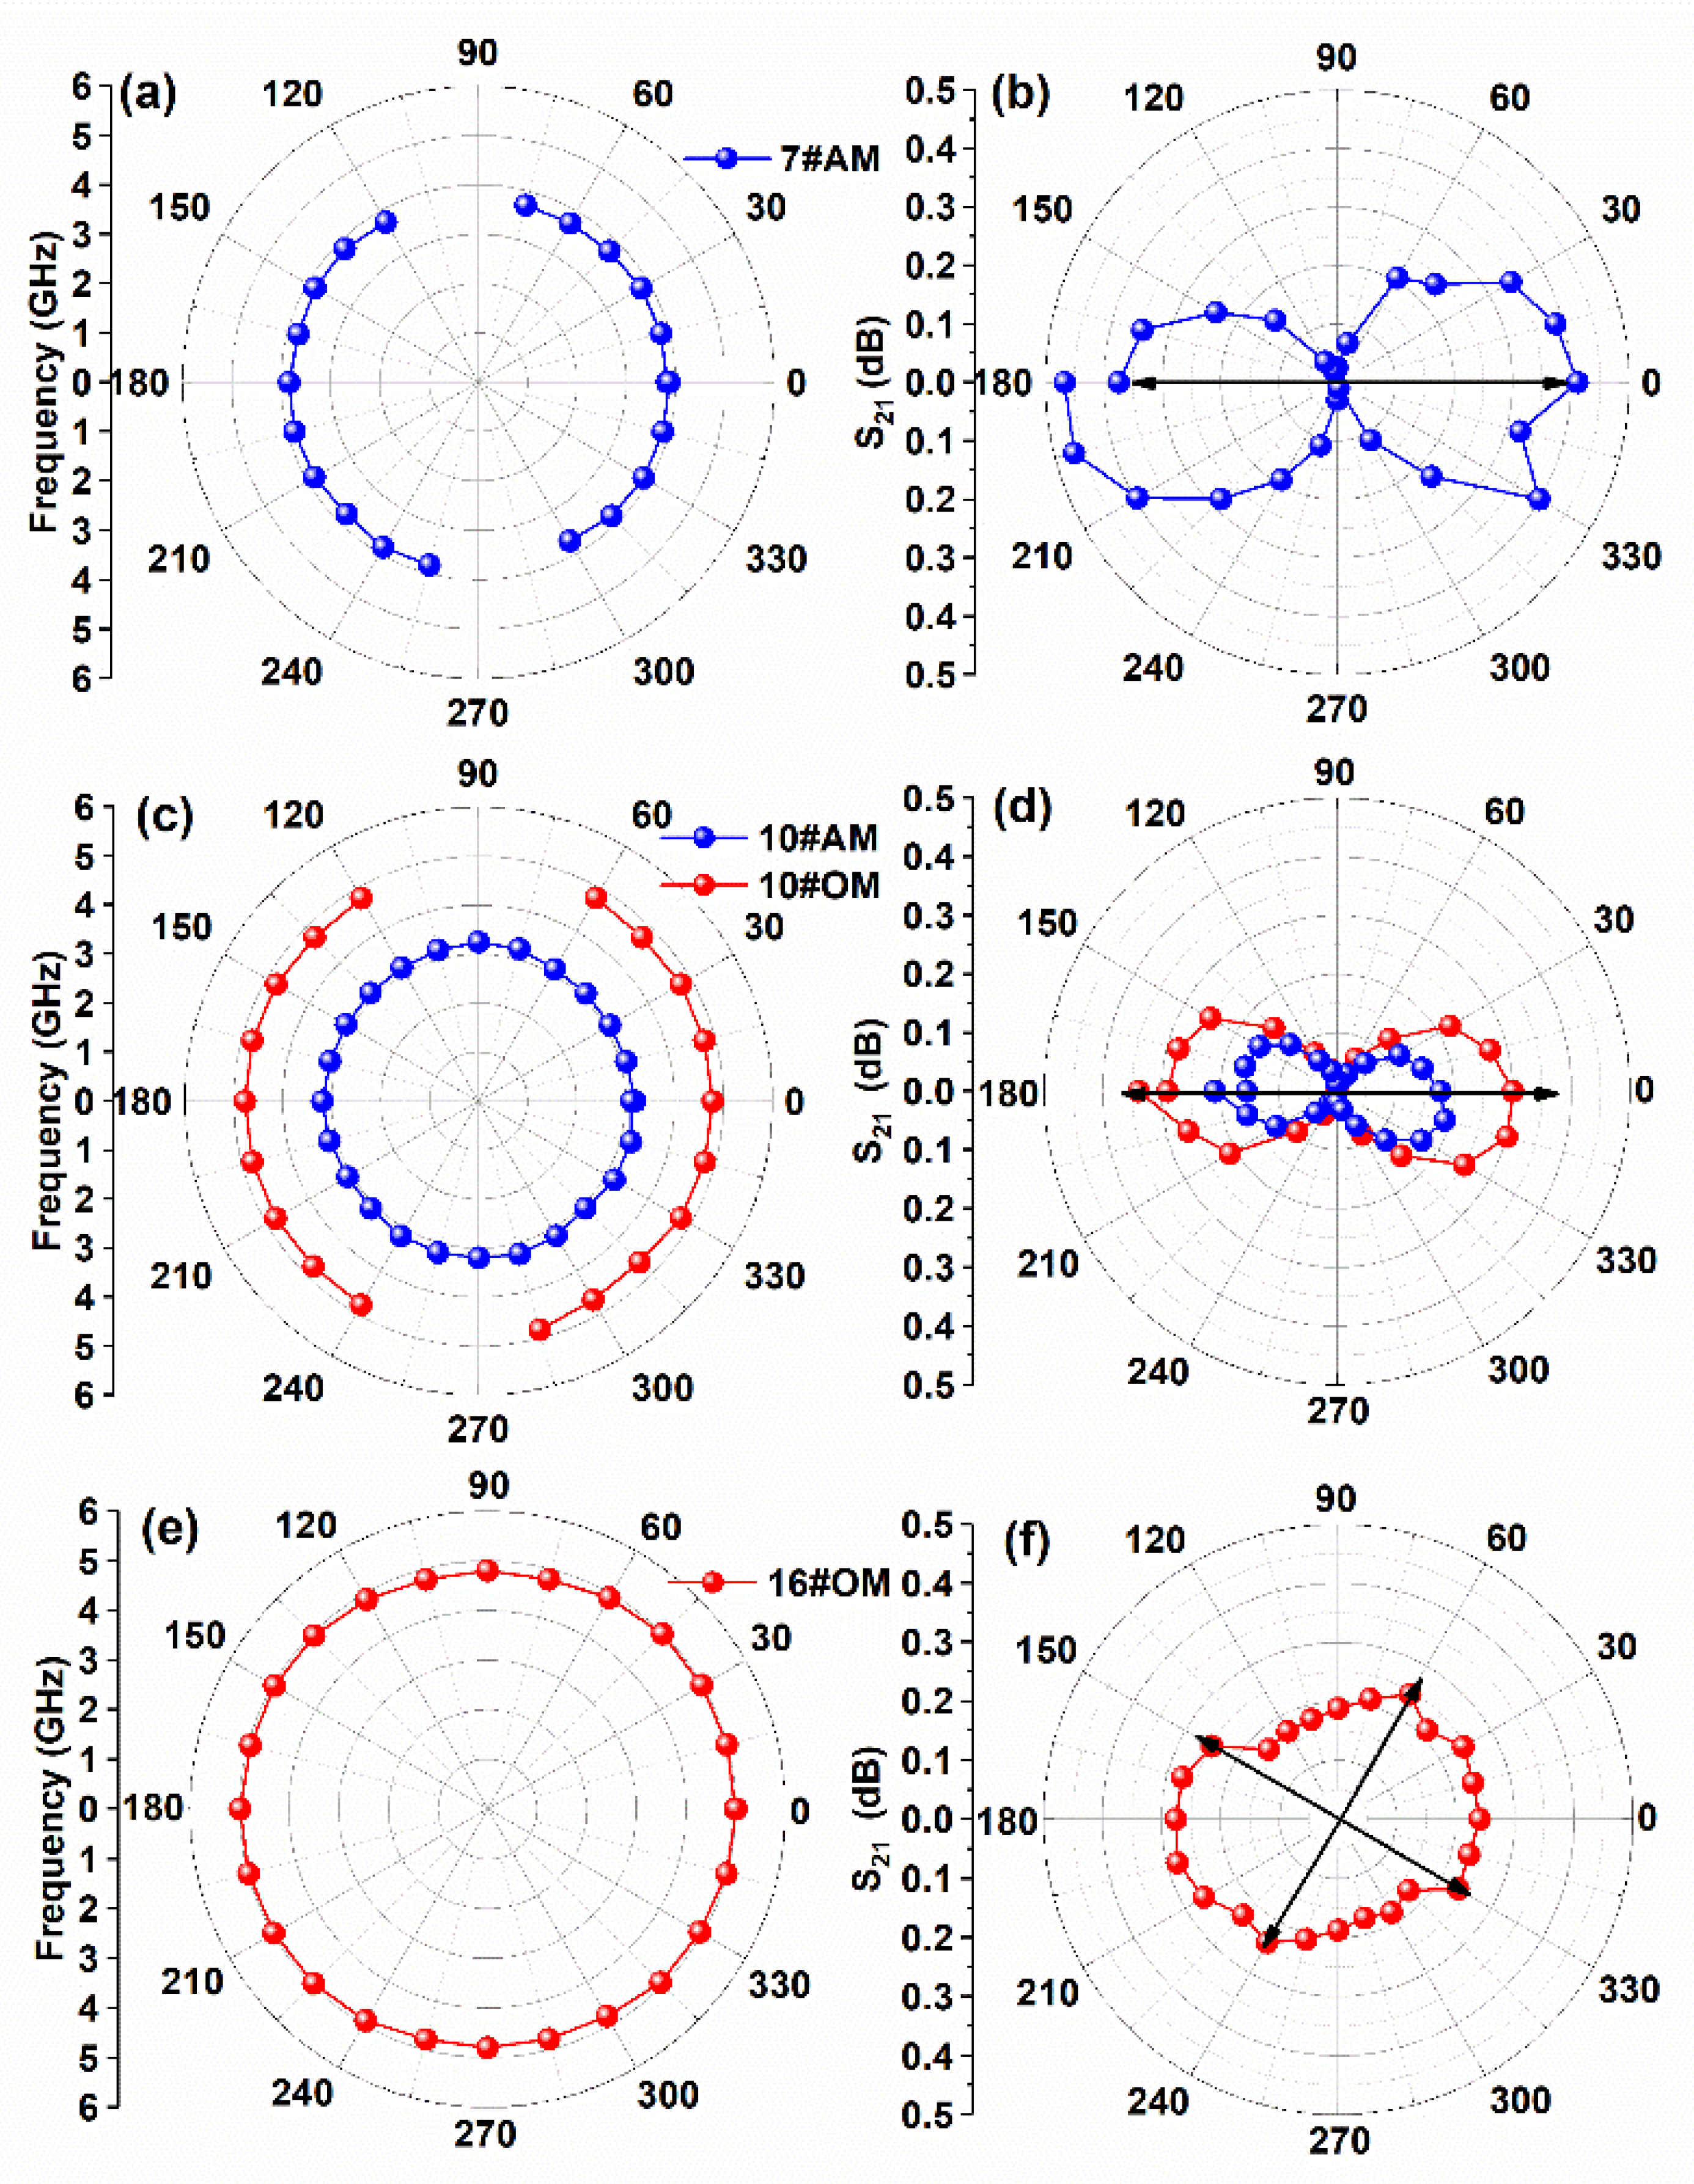
3. Results and Discussion
4. Conclusions
Author Contributions
Funding
Institutional Review Board Statement
Informed Consent Statement
Data Availability Statement
Conflicts of Interest
References
- Knorr, T.G.; Hoffman, R.W. Dependence of geometric magnetic anisotropy in thin iron films. Phys. Rev. 1959, 113, 1039–1046. [Google Scholar] [CrossRef]
- Griffiths, J.H.E. Anomalous high-frequency resistance of ferromagnetic metals. Nature 1946, 158, 670–671. [Google Scholar] [CrossRef]
- Sun, N.X.; Yamaguchi, M.; Yabukami, S.; Wang, S.X. Sandwich films properties of a new soft magnetic material. Nature 2000, 407, 150–151. [Google Scholar]
- Kittel, C. Interpretation of anomalous larmor frequencies in ferromagnetic resonance experiment. Phys. Rev. 1947, 71, 270–271. [Google Scholar] [CrossRef]
- Kittel, C. On the theory of ferromagnetic resonance absorption. Phys. Rev. 1948, 73, 155–161. [Google Scholar] [CrossRef]
- Yu, S.H.; Yoshimura, M. Ferrite/metal composites fabricated by soft solution processing. Adv. Funct. Mater. 2002, 12, 9–15. [Google Scholar] [CrossRef]
- Li, S.D.; Huang, Z.G.; Duh, J.G.; Yamaguchi, M. Ultrahigh-frequency ferromagnetic properties of FeCoHf films deposited by gradient sputtering. Appl. Phys. Lett. 2008, 92, 092501. [Google Scholar] [CrossRef]
- Zhao, Y.W.; Zhang, X.K.; Xiao, J.Q. Submicrometer laminated Fe/SiO2 soft magnetic composites—An effective route to materials for high-frequency applications. Adv. Mater. 2005, 17, 915–918. [Google Scholar] [CrossRef]
- Li, C.Y.; Chai, G.Z.; Yang, C.C.; Wang, W.F.; Xue, D.S. Tunable zero-field ferromagnetic resonance frequency from S to X band in oblique deposited CoFeB thin films. Sci. Rep. 2015, 5, 17023. [Google Scholar] [CrossRef] [Green Version]
- Phuoc, N.N.; Xu, F.; Ong, C.K. Ultrawideband microwave noise filter: Hybrid antiferromagnet/ferromagnet exchange-coupled multilayers. Appl. Phys. Lett. 2009, 94, 092505. [Google Scholar] [CrossRef]
- Sun, N.X.; Wang, S.X. Soft high saturation magnetization (Fe0.7Co0.3)1-xNx thin films for inductive write heads. IEEE Trans. Magn. 2000, 36, 2506–2508. [Google Scholar] [CrossRef]
- Fan, X.L.; Xue, D.S.; Lin, M.; Zhang, Z.M. In situ fabrication of Co90Nb10 soft magnetic thin films with adjustable resonance frequency from 1.3 to 4.9 GHz. Appl. Phys. Lett. 2008, 92, 222505. [Google Scholar] [CrossRef]
- Zhou, C.; Wang, F.L.; Wei, W.W.; Wang, G.X.; Jiang, C.J.; Xue, D.S. Stripe domain and enhanced resonance frequency in ferrite doped FeNi films. J. Phys. D Appl. Phys. 2013, 46, 425002. [Google Scholar] [CrossRef]
- Zhang, Z.; Fan, X.; Lin, M.; Guo, D.; Chai, G.Z.; Xue, D.S. Optimized soft magnetic properties and high frequency characteristics of obliquely deposited Co-Zr thin films. J. Phys. D Appl. Phys. 2010, 43, 085002. [Google Scholar] [CrossRef]
- Li, S.D.; Wang, L.L.; Xu, J.; Wang, Z.; Liu, M.; Lou, J.; Beguhn, S.; Nan, T.X.; Xu, F.; Sun, N.X.; et al. Microwave frequency performance and high magnetic anisotropy of Fe70Co30-B films prepared by a modified composition gradient sputtering. IEEE Trans. Magn. 2012, 48, 4313–4316. [Google Scholar] [CrossRef]
- Li, S.D.; Liu, M.; Lou, J.; Xing, X.; Su, Z.J.; Zhou, Z.Y.; Xu, F.; Duh, J.G.; Sun, N.X. High in-plane magnetic anisotropy and microwave frequency performance of soft magnetic (Fe50Co50)1-X(Al2O3)X films prepared by modified composition gradient sputtering. IEEE Trans. Magn. 2011, 47, 3935–3938. [Google Scholar] [CrossRef]
- Seemann, K.; Leiste, H.; Bekker, V. New theoretical approach to the RF-dynamics of soft magnetic FeTaN films for CMOS components. J. Magn. Magn. Mater. 2004, 278, 200–207. [Google Scholar] [CrossRef]
- Liu, M.; Obi, O.; Lou, J.; Li, S.D.; Xing, X.; Yang, G.M.; Sun, N.X. Tunable magnetoresistance devices based on multiferroic heterostructures. J. Appl. Phys. 2011, 109, 07D913. [Google Scholar] [CrossRef]
- Lou, J.; Liu, M.; Reed, D.; Ren, Y.H.; Sun, N.X. Giant electric field tuning of magnetism in novel multiferroic FeGaB/lead zinc niobate lead titanate (PZN-PT) heterostructures. Adv. Mater. 2009, 21, 4711–4715. [Google Scholar] [CrossRef]
- Liu, M.; Obi, O.; Lou, J.; Chen, Y.J.; Cai, Z.H.; Stoute, S.; Espanol, M.; Lew, M.; Situ, X.D.; Ziemer, K.S.; et al. Giant electric field tuning of magnetic properties in multiferroic ferrite/ferroelectric heterostructures. Adv. Funct. Mater. 2009, 19, 1826–1831. [Google Scholar] [CrossRef]
- Seemann, K.; Leiste, H.; Bekker, V. Uniaxial anisotropy and high-frequency permeability of novel soft magnetic FeCoTaN and FeCoAlN films field-annealed at CMOS temperatures. J. Magn. Magn. Mater. 2004, 283, 310–315. [Google Scholar] [CrossRef]
- Fergen, I.; Seemann, K.; Van de Weth, A.; Schüppen, A. Soft ferromagnetic thin films for high frequency applications. J. Magn. Magn. Mater. 2002, 242–245, 146–151. [Google Scholar] [CrossRef]
- Chai, G.Z.; Yang, Y.C.; Zhu, J.Y.; Lin, M.; Sui, W.B.; Guo, D.W.; Li, X.L.; Xue, D.S. Adjust the resonance frequency of (Co90Nb10/Ta)n multilayers from 1.4 to 6.5 GHz by controlling the thickness of Ta interlayers. Appl. Phys. Lett. 2010, 96, 012505. [Google Scholar]
- Phuoc, N.N.; Ong, C.K. Anomalous temperature dependence of magnetic anisotropy in gradient-composition sputtered thin films. Adv. Mater. 2013, 25, 980–984. [Google Scholar] [CrossRef]
- Phuoc, N.N.; Hung, L.T.; Ong, C.K. Ultra-high ferromagnetic resonance frequency in exchange-biased system. J. Alloys Compd. 2010, 506, 504–507. [Google Scholar] [CrossRef]
- Li, S.D.; Xue, Q.; Duh, J.G.; Du, H.L.; Xu, J.; Wan, Y.; Li, Q.; Lü, Y.G. Driving ferromagnetic resonance frequency of FeCoB/PZN-PT multiferroic heterostructures to Ku-band via two-step climbing: Composition gradient sputtering and magnetoelectric coupling. Sci. Rep. 2014, 4, 7393. [Google Scholar] [CrossRef]
- Li, S.D.; Li, Q.; Xu, J.; Yan, S.S.; Miao, G.X.; Kang, S.S.; Dai, Y.Y.; Jiao, J.Q.; Lü, Y.G. Tunable optical mode ferromagnetic resonance in FeCoB/Ru/FeCoB synthetic antiferromagnetic trilayers under uniaxial magnetic anisotropy. Adv. Funct. Mater. 2016, 26, 3738–3744. [Google Scholar] [CrossRef]
- Chen, Y.; Fan, X.; Zhou, Y.; Xie, Y.; Wu, J.; Wang, T.; Chui, S.T.; Xiao, J.Q. Designing and tuning magnetic resonance with exchange interaction. Adv. Mater. 2015, 27, 1351–1355. [Google Scholar] [CrossRef]
- Li, S.D.; Wang, C.L.; Chu, X.M.; Miao, G.X.; Xue, Q.; Zou, W.Q.; Liu, M.M.; Xu, J.; Li, Q.; Dai, Y.Y.; et al. Engineering optical mode ferromagnetic resonance in FeCoB films with ultrathin Ru insertion. Sci. Rep. 2016, 6, 33349. [Google Scholar] [CrossRef]
- Li, S.D.; Miao, G.X.; Cao, D.R.; Li, Q.; Xu, J.; Wen, Z.; Dai, Y.Y.; Yan, S.S.; Lü, Y.G. Stress-enhanced interlayer exchange coupling and optical mode FMR frequency in self-bias FeCoB/Ru/FeCoB trilayers. ACS Appl. Mater. Interfaces 2018, 10, 8853–8859. [Google Scholar] [CrossRef]
- Zhang, Z.; Zhou, L.; Wigen, P.E.; Ounadjela, K. Angular dependence of ferromagnetic resonance in exchange-coupled Co/Ru/Co trilayer structures. Phys. Rev. B 1994, 50, 6094–6112. [Google Scholar] [CrossRef] [PubMed]
- Krebs, J.J.; Lubitz, P.; Chaiken, A.; Prinz, G.A. Observation of magnetic resonance modes of Fe layers coupled via intervening Cr (invited). J. Appl. Phys. 1990, 67, 5920–5924. [Google Scholar] [CrossRef]
- Kohlhepp, J.; Valkier, M.; Van de Graaf, A.; Broeder, F.J.A.D. Mimicking of a strong biquadratic interlayer exchange coupling in Fe/Si multilayers. Phys. Rev. B 1997, 55, R696–R699. [Google Scholar] [CrossRef] [Green Version]
- Kohlhepp, J.; Broeder, F.J.A.D.; Valkier, M.; Van de Graaf, A. Apparent strong biquadratic contributions to the interlayer exchange coupling in Fe/Si multilayers. J. Magn. Magn. Mater. 1997, 165, 431–434. [Google Scholar] [CrossRef]
- Bijoy, K. Interlayer exchange coupling of epitaxial Fe/Al/Fe trilayer films: Dynamic and static measurements. J. Appl. Phys. 2003, 93, 7232–7234. [Google Scholar]
- Wang, H.; Sato, A.; Saito, K.; Mitani, S.; Takanashi, K.; Yakushiji, K. Oscillatory interlayer exchange coupling in epitaxial trilayers. Appl. Phys. Lett. 2007, 90, 142510. [Google Scholar] [CrossRef]
- Wei, Y.; Svedlindh, P.; Kostylev, M.; Ranjbar, M.; Dumas, R.K.; Åkerman, J. Measuring acoustic mode resonance alone as a sensitive technique to extract antiferromagnetic coupling strength. Phys. Rev. B 2015, 92, 064418. [Google Scholar] [CrossRef]
- Belmeguenai, M.; Martin, T.; Woltersdorf, G.; Maier, M.; Bayreuther, G. Frequency- and time-domain investigation of the dynamic properties of interlayer-exchange-coupled Ni81Fe19/Ru/Ni81Fe19 thin films. Phys. Rev. B 2007, 76, 104414. [Google Scholar] [CrossRef] [Green Version]
- Zhang, Z.; Zhou, L.; Wigen, P.E.; Ounadjela, K. Using ferromagnetic resonance as a sensitive method to study temperature dependence of interlayer exchange coupling. Phys. Rev. Lett. 1994, 73, 336–339. [Google Scholar] [CrossRef]
- Liu, X.M.; Nguyen, H.T.; Ding, J.; Cottam, M.G.; Adeyeye, A.O. Interlayer coupling in Ni80Fe20/Ru/Ni80Fe20 multilayer films: Ferromagnetic resonance experiments and theory. Phys. Rev. B 2014, 90, 064428. [Google Scholar] [CrossRef]
- Parkin, S.S.P. Systematic variation of the strength and oscillation period of indirect magnetic exchange coupling through the 3d, 4d, and 5d transition metals. Phys. Rev. Lett. 1991, 67, 3598–3601. [Google Scholar] [CrossRef] [PubMed]
- Zhou, A.R.; Li, Y.Z.; Zhang, S.H.; Jin, Z.J.; Guo, W.; Xu, F.; Wang, X.; Cao, D.R.; Xu, J.; Zhao, G.X.; et al. Self-biased optical mode ferromagnetic resonance beyond 22 GHz in artificial exchange coupled trilayers. J. Magn. Magn. Mater. 2022, 54, 168955. [Google Scholar] [CrossRef]
- de Vries, J.J.; Kohlhepp, J.; den Broeder, F.J.A.; Coehoorn, R.; Jungblut, R.; Reinders, A.; de Jonge, W.J.M. Exponential dependence of the interlayer exchange coupling on the spacer thickness in MBE-grown Fe/SiFe/Fe Sandwiches. Phys. Rev. Lett. 1997, 78, 3023–3026. [Google Scholar] [CrossRef]
- McKinnon, T.; Omelchenko, P.; Heinrich, B.; Girt, E. FMR study of interlayer exchange coupling in FeCoB vertical bar Ta vertical bar FeCoB trilayers with in-plane anisotropy. J. Phys. D Appl. Phys. 2018, 51, 055005. [Google Scholar]
- Zhang, S.H.; Lin, J.X.; Miao, G.X.; Li, S.D.; Zhao, G.X.; Wang, X.; Li, Q.; Cao, D.R.; Xu, J.; Yan, S.S.; et al. Ultrahigh frequency and anti-interference optical-mode resonance with biquadratic coupled FeCoB/Ru/FeCoB trilayers. ACS Appl. Mater. Interfaces 2019, 11, 48230. [Google Scholar] [CrossRef]
- Grimsditch, M.; Kumar, S.; Fullerton, E.E. Brillouin light scattering study of Fe/Cr/Fe (211) and (100) trilayers. Phys. Rev. B 1996, 54, 3385–3393. [Google Scholar] [CrossRef]
- Zivieri, R.; Giovannini, L.; Nizzoli, F. Acoustical and optical spin modes of multilayers with ferromagnetic and antiferromagnetic coupling. Phys. Rev. B 2000, 62, 14950–14955. [Google Scholar] [CrossRef]
- Demokritov, S.O. Biquadratic interlayer coupling in layered magnetic systems. J. Phys. D Appl. Phys. 1998, 31, 925–941. [Google Scholar] [CrossRef] [Green Version]
- Layadi, A. Theoretical study of resonance modes of coupled thin films in the rigid layer model. Phys. Rev. B 2004, 69, 144431. [Google Scholar] [CrossRef]
- Layadi, A. Effect of biquadratic coupling and in-plane anisotropy on the resonance modes of a trilayer system. Phys. Rev. B 2002, 65, 104422. [Google Scholar] [CrossRef]
- Li, L.; Lu, Y.F.; Liu, Z.Y.; Lü, Y.F.; Zhang, Y.; Liu, S.C.; Hao, C.X.; Lü, W.M. Interlayer exchange coupling and magnetic reversal in Co/Pt multilayers. J. Magn. Magn. Mater. 2013, 325, 117–121. [Google Scholar] [CrossRef]


Publisher’s Note: MDPI stays neutral with regard to jurisdictional claims in published maps and institutional affiliations. |
© 2022 by the authors. Licensee MDPI, Basel, Switzerland. This article is an open access article distributed under the terms and conditions of the Creative Commons Attribution (CC BY) license (https://creativecommons.org/licenses/by/4.0/).
Share and Cite
Liu, D.; Zhang, S.; Li, S. Interlayer Coupling and High-Frequency Performance in Magnetic Anisotropic FeCoB/Hf/FeCoB Trilayers with Various Hf Thicknesses. Magnetochemistry 2022, 8, 65. https://0-doi-org.brum.beds.ac.uk/10.3390/magnetochemistry8060065
Liu D, Zhang S, Li S. Interlayer Coupling and High-Frequency Performance in Magnetic Anisotropic FeCoB/Hf/FeCoB Trilayers with Various Hf Thicknesses. Magnetochemistry. 2022; 8(6):65. https://0-doi-org.brum.beds.ac.uk/10.3390/magnetochemistry8060065
Chicago/Turabian StyleLiu, Duo, Shouheng Zhang, and Shandong Li. 2022. "Interlayer Coupling and High-Frequency Performance in Magnetic Anisotropic FeCoB/Hf/FeCoB Trilayers with Various Hf Thicknesses" Magnetochemistry 8, no. 6: 65. https://0-doi-org.brum.beds.ac.uk/10.3390/magnetochemistry8060065