Article

Effects of State of Charge on the Physical Characteristics of V(IV)/V(V) Electrolytes and Membrane for the All Vanadium Flow Battery

1
Department of Chemistry, Williams College, Williamstown, MA 01267, USA
2
Department of Chemistry, Salve Regina University, Newport, RI 02840, USA
3
Department of Chemistry, University of Rhode Island, Kingston, RI 02881, USA
4
Department of Chemistry and Biochemistry, UMASS Dartmouth, North Dartmouth, MA 02747, USA
*
Author to whom correspondence should be addressed.
Submission received: 21 August 2020 / Revised: 20 September 2020 / Accepted: 25 September 2020 / Published: 6 October 2020
(This article belongs to the Special Issue Redox Flow Batteries for Large-Scale Energy Storage)

Abstract

:
The VO2+/VO2+ redox couple commonly employed on the positive terminal of the all-vanadium redox flow battery was investigated at various states of charge (SOC) and H2SO4 supporting electrolyte concentrations. Electron paramagnetic resonance was used to investigate the VO2+ concentration and translational and rotational diffusion coefficient (DT, DR) in both bulk solution and Nafion membranes. Values of DT and DR were relatively unaffected by SOC and on the order of 10−10 m2s−1. Cyclic voltammetry measurements revealed that no significant changes to the redox mechanism were observed as the state of charge increased; however, the mechanism does appear to be affected by H2SO4 concentration. Electron transfer rate (k0) increased by an order of magnitude (10−6 ms−1 to 10−8 ms−1) for each H2SO4 concentrations investigated (1, 3 and 5 M). Analysis of cyclic voltammetry switching currents suggests that the technique might be suitable for fast determination of state of charge if the system is well calibrated. Membrane uptake and permeability measurements show that vanadium absorption and crossover is more dependent on both acid and vanadium concentration than state of charge. Vanadium diffusion in the membrane is about an order of magnitude slower (~10−11 m2s−1) than in solution (~10−10 m2s−1).

Graphical Abstract

1. Introduction

Large-scale energy storage technologies play a pivotal role in the global clean energy transition, enabling intermittent renewable energy sources such as solar and wind to serve as feasible replacements for fossil fuels [1]. The vanadium redox flow battery (VRFB) is a promising candidate for renewable energy storage applications due to its high energy efficiency, low toxicity, and long lifespan [2,3]. Like all redox flow batteries, the VRFB utilizes two tanks of electrolyte that circulate through the battery cell stack, where the redox couples in each electrolyte react at the electrodes to generate an electrical current. Because energy storage capacity scales with the volume of the electrolyte, redox flow batteries are conducive to large-scale applications such as electrical grid storage. Power output, meanwhile, increases with the number of stacked reaction cells [2].
The VRFB in particular is unique in that a single chemical species, vanadium, is employed on both the positive and negative half-cells of the battery: the catholyte contains the redox couple VO2+/VO2+, while anolyte contains V2+/V3+, in a supporting electrolyte, typically sulfuric acid. The half-cells of the battery are separated by a proton exchange membrane to allow for proton transport while minimizing the mixing of catholyte and anolyte. Nafion, a perfluorinated polymer with sulfonate functional side-groups that facilitate proton transport, is the most widely used membrane due to its high proton conductivity and chemical and thermal stability [3]. However, the low ion selectivity of Nafion permits positively charged vanadium ions, as well as others, to cross through the membrane into the opposite electrolyte [4,5,6]. The resulting unintended side reactions between vanadium species after crossover results in self-discharge of the battery, reducing its efficiency [7,8]. Although the single-metal design of the VRFB enables the vanadium electrolyte to be salvaged after self-discharge, minimizing vanadium ion crossover is crucial in the optimization of VRFB performance and reducing battery down time [9].
The complete characterization of vanadium crossover must take into account the relationship between electrolyte composition and membrane properties. Vanadium concentration, sulfuric acid concentration, and state of charge are the three main parameters that determine electrolyte composition. High total vanadium concentration improves the energy density of the VRFB, but the solubility of vanadium ions is a limiting factor as the maximum vanadium concentration that can be achieved has been reported at 3 M [10], though 2 M is most common [11,12]. The common ion effect, resulting from the sulfate anions in both vanadyl sulfate and sulfuric acid, causes a decrease in the solubility of vanadium as acid concentration increases [13]. Furthermore, this shift in equilibrium causes the conductivity of the electrolyte to decrease at higher vanadium concentrations, which increases internal resistance of the battery [14]. Additionally, other studies have reported the use of electrolyte additives to enhance reactions and increase solubility with varying degrees of success [15,16,17].
On the other hand, decreasing the sulfuric acid concentration has a remarkable effect on the electrochemical reversibility of the VO2+/VO2+ redox couple. Prior studies employing cyclic voltammetry revealed that the catholyte redox couple is electrochemically irreversible at H2SO4 concentrations < 3 M and becomes quasi-reversible above 3 M [11,18,19]. CV is a useful technique to study VRFB electrolytes as it can yield important thermodynamic and kinetic information such as reversibility, rate constants and reaction mechanisms.
Permeability studies by Lawton et al. [20] found that electrolyte solutions with higher H2SO4 concentration corresponded to lower VO2+ membrane permeability. A higher initial VO2+ concentration also corresponded to lower VO2+ membrane permeability; however, the effect diminished with increased acid concentration. The low permeability at high H2SO4 and VO2+ concentrations could only be partially attributed to increased viscosity. Other contributing factors may include dehydration of the membrane from interactions with sulfuric acid, the immobilization of the fraction of VO2+ ions that interact with the membrane’s sulfonate groups, and the diffusion of sulfate ions into the membrane.
The influence of different vanadium species on membrane permeability and uptake has been previously investigated [21]. In crossover-diffusion experiments, the permeability of VO2+ with respect to the counter ion followed the trend H+ > VO2+ > VO2+, while the permeability of V3+ with respect to the counter ion was found to be VO2+ > VO2+. Uptake of vanadium species in the membrane followed the order V3+ ≈ VO2+ > VO2+ at all concentrations of H2SO4 (0.5 M to 5 M), suggesting that permeability behavior of each vanadium species depends on the presence or absence of competitive partitioning resulting from particular vanadium counter ions. For all vanadium species, increased acid concentration decreased both the permeability and uptake of vanadium ions, likely due to the dehydration of the membrane in more acidic conditions [21]. However, Tang et al. [22] found that a higher concentration of sulfuric acid in the membrane increases proton concentration while simultaneously decreasing water content, leading to a decrease in membrane conductivity. The optimal acid concentration for VRFB performance must strike a balance between these opposing factors of crossover, decreased conductivity and electrochemical reversibility-which affects the electrochemical kinetics.
In an operating VRFB, the relative ratios of the redox couples in the anolyte and catholyte change continuously as the battery completes a charge–discharge cycle. The state of charge (SOC) of the electrolyte, expressed as a percentage from 0% to 100%, describes the extent of oxidation/reduction that has occurred in each electrolyte. In the catholyte, for example, a 0% SOC solution consists of entirely VO2+, while a 100% SOC solution is entirely VO2+. The characterization of mass transfer in the operating VRFB has yet to fully take into account the role of SOC on electrolyte properties. The mass transfer processes of diffusion, migration, and convection are driven by concentration gradients, electrical potential, and bulk motion of a solution, respectively [23]. During discharge of the VRFB, diffusion and migration cause a flux of vanadium species in the same direction across the membrane, resulting in crossover of vanadium species; during charging, the direction of migration is reversed due to the application current while the direction of diffusion remains the same, somewhat reducing the extent of vanadium species crossover. The low velocity of solution within the membrane makes the contribution of convection minimal [24]. The 3D simulation of the VRFB constructed by Oh et al. [24] suggests that accurate modeling of the diffusion and migration of vanadium species across the membrane can help predict the SOC that will exist when the total concentration of vanadium in each side of the battery becomes imbalanced, at which point halting the VRFB charge/discharge cycle would minimize capacity fade. The VRFB model developed by Barton et al. [25] takes into account concentration and potential-driven crossover of vanadium species, but, as in the Oh et al. model, the properties of the electrolytes are assumed to be constant across different SOCs.
In studying the relationship between SOC and physical characteristics of the catholyte, which was the focus of our study, electron paramagnetic resonance spectroscopy is a valuable tool [26,27,28]. Vanadium in the 4+ oxidation state, existing as VO2+ in the catholyte, has a single unpaired electron and thus is Electron Paramagnetic Resonance (EPR) active. VO2+ yields a characteristic 7-peak on an EPR spectrum (nuclear spin I = 7/2), which can be analyzed quantitatively to determine vanadium concentration in a solution among other parameters. The 5+ oxidation state of vanadium, VO2+, is EPR silent, but chemical reduction via potassium iodide converts VO2+ to EPR-active VO2+ to enable quantification.
The fundamental aspects of these vanadium ion/sulfuric acid system studies of the may also be of interest in application where recent advances utilizing vanadium have taken place. These include catalysis [29,30], medicine [31] and biological systems [32,33]. Additionally, the methods employed in this article have applications in catalysis [34,35], dietary medicine [36], and materials applications such as smart glass [37], which exemplifies the broad utility of vanadium compounds and the methods discussed below.
This work seeks to elucidate some of the questions that remain in characterizing Nafion membrane permeability in the VRFB catholyte, in particular: how vanadium ion permeability varies with SOC; how the presence of VO2+ and VO2+ together in the catholyte influences each ion’s permeability; and how H2SO4 concentration affects all of these factors. Finally, the effect of SOC on the electrochemical kinetics of the catholyte is presented via analysis of the cyclic voltammograms.

2. Results and Discussion

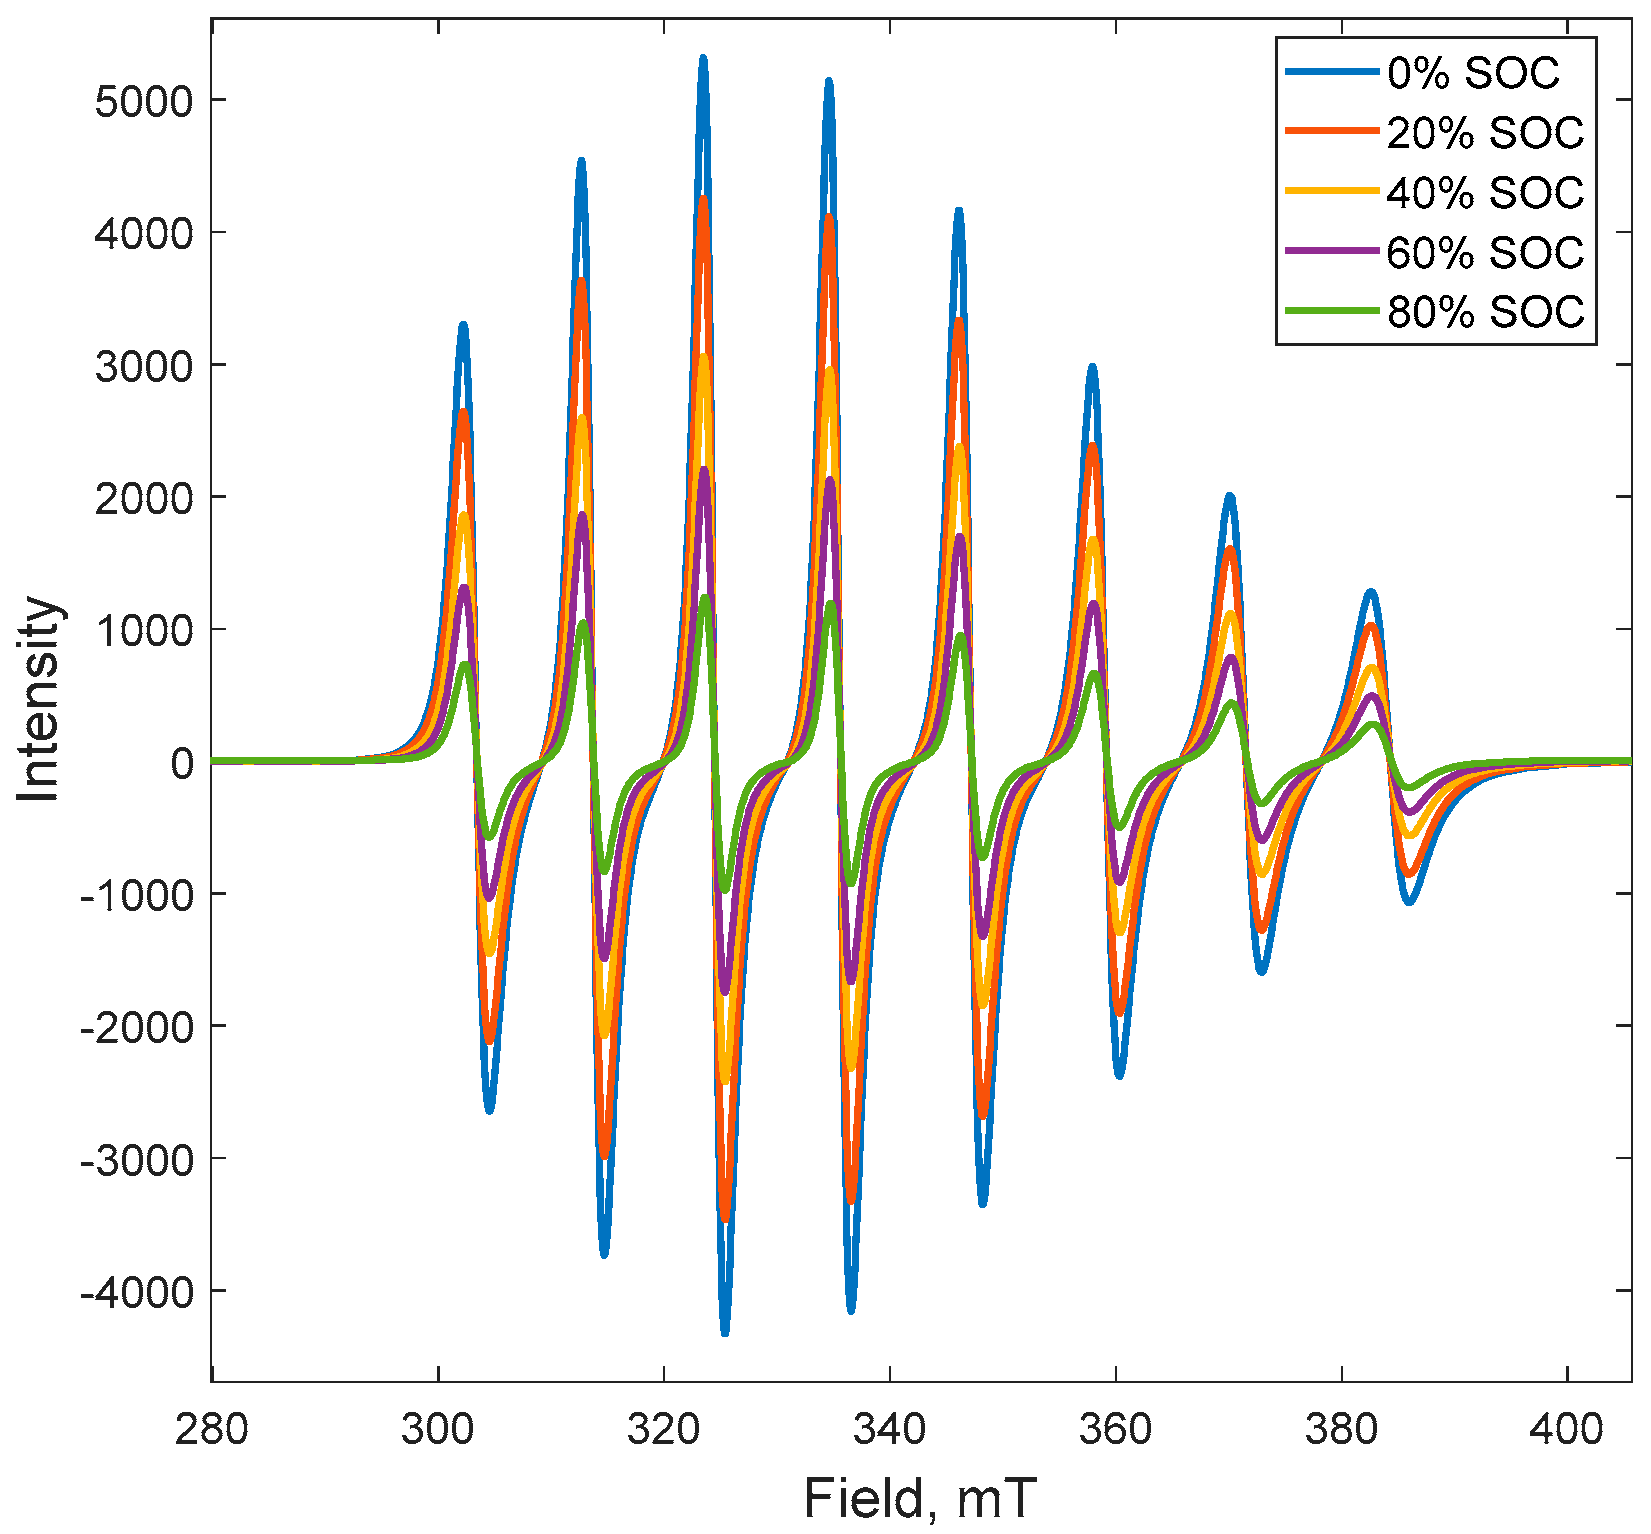
2.1. Electron Paramagnetic Resonance

Figure 1 shows sample EPR spectra of the VO2+ ion signal for 0%–80% state of charge (SOC) in 1 M H2SO4. The decrease in signal with increasing SOC is consistent with the decrease in VO2+ concentration as SOC increases. The line shape of the VO2+ signal does not change significantly with SOC other than the decreasing signal intensity (e.g., peaks retain their original shape).
The EPR solution data were fit to determine the rotational rate (DR) of the VO2+ ions. Initial parameters for fitting the spectra were described previously [18]. The rotational diffusion, which decreased as H2SO4 concentration and viscosity increased, did not exhibit a trend with SOC but remained in the 10−10 m2s−1 range.
The hydrodynamic radius of the VO(H2O)52+ complex [38] is related to the rotational diffusion through the Stokes Einstein Debye (SED) equation:
D R =   k B T 8 π η r 3
The radius decreases with increasing H2SO4 concentration: 3.3 Å in 1 M, 3.1 Å in 3 M and 3.0 Å in 5 M H2SO4. These values are in good agreement with values reported elsewhere [39,40,41]. The trend with H2SO4 concentration, however, is different than what was observed by Oriji et al. [11] in solutions with significantly higher VO2+ concentration (~2 M) where considerably lower Stokes Radii (~2 Å) were reported. The observation seen here with higher Stokes radius might be the result of a lack of solution crowding effects in comparison to the higher VO2+ employed in the above study.
The rotational diffusion and hydrodynamic radius can be related to the translational diffusion through the Stokes Einstein (SE) equation relating translational diffusion and viscosity:
D T =   k B T 6 π η r
And by combining Equations (1) and (2):
D T D R =   4 3 r 2
The translational diffusion of VO2+ in the H2SO4 solutions as determined by EPR is shown in Table A1 (in Appendix A). There was no significant trend in the translational diffusion with varying SOC.

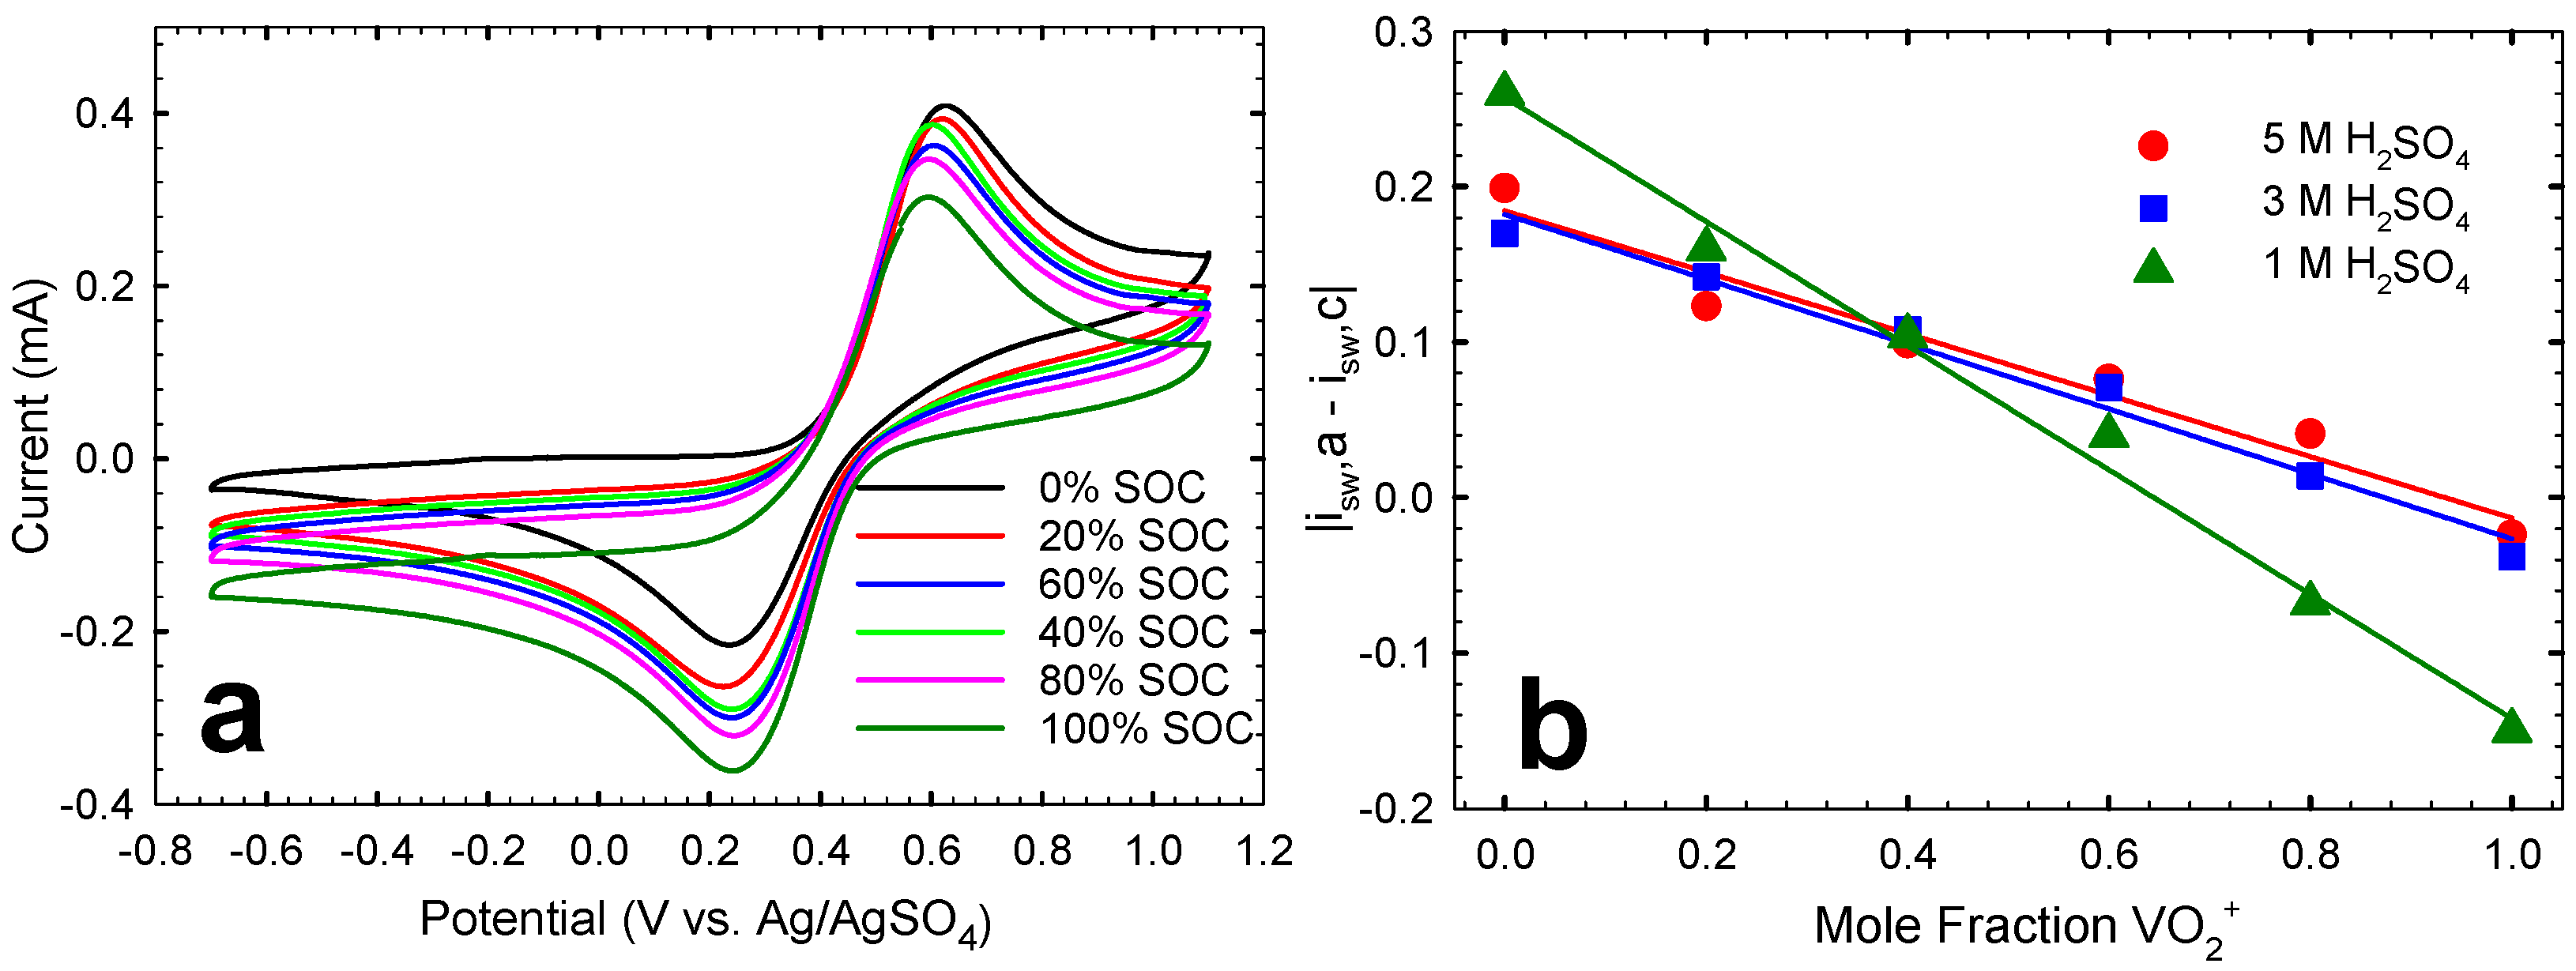
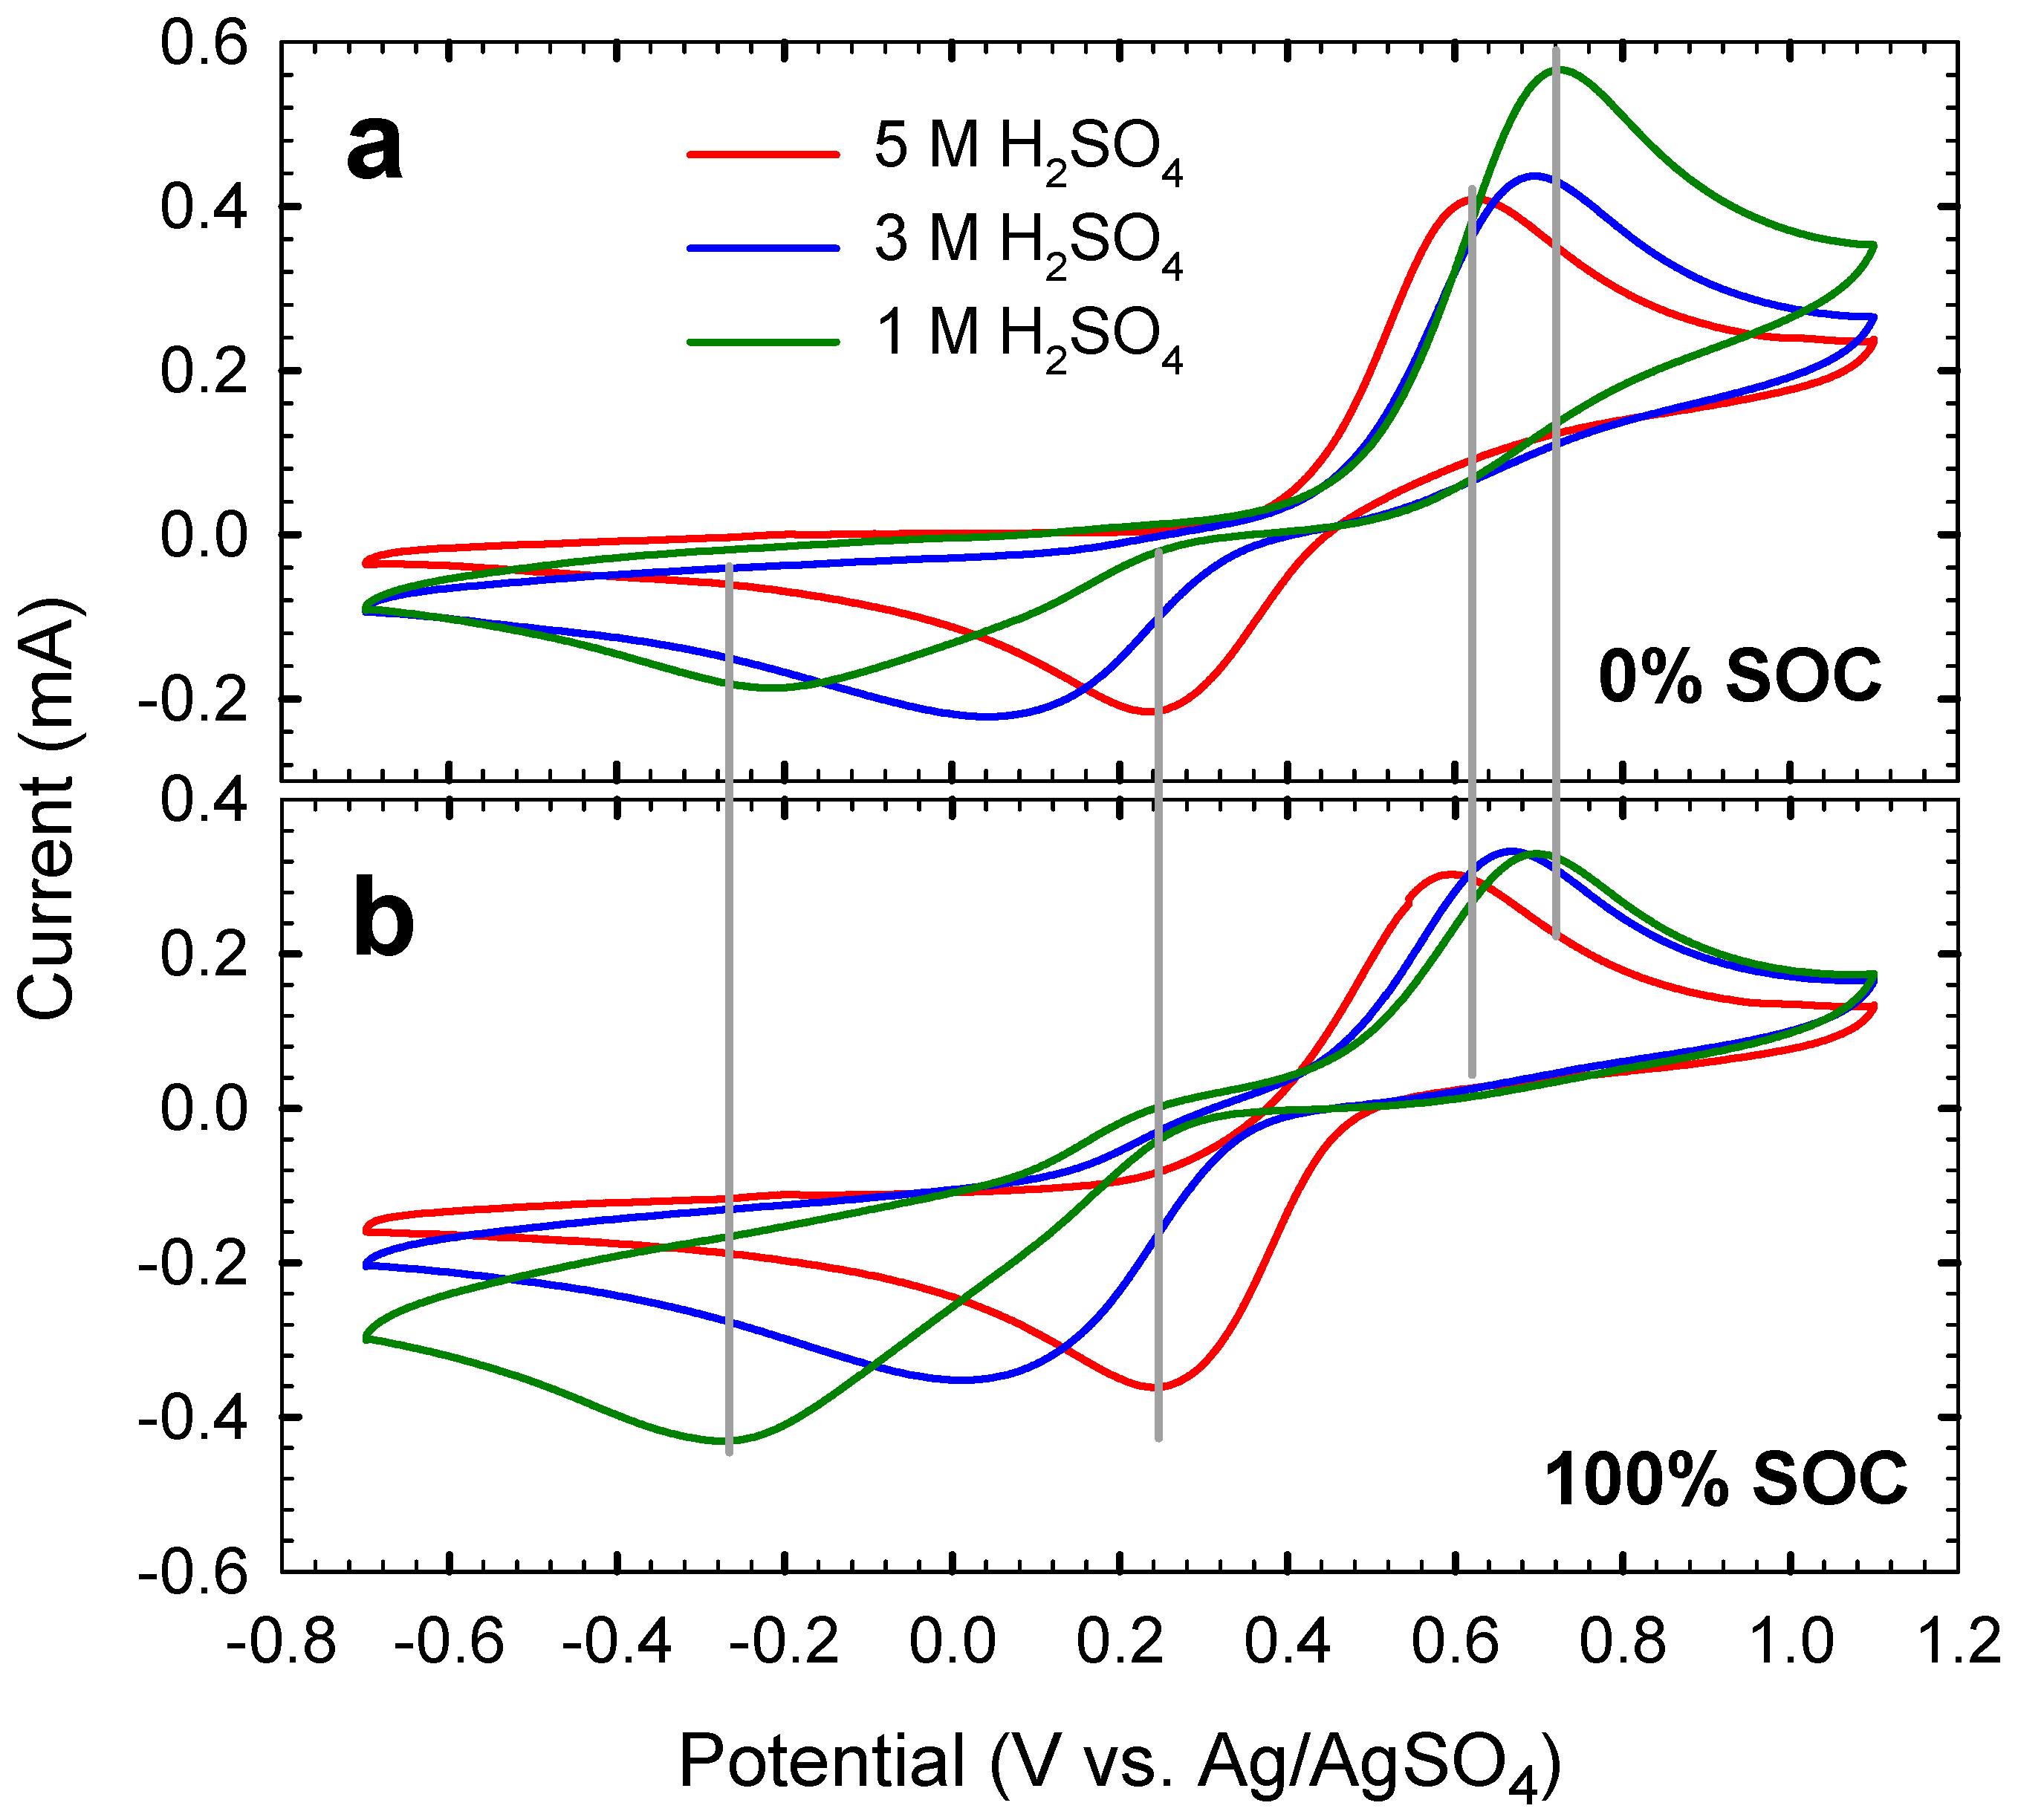
2.2. Cyclic Voltammetry

Cyclic voltammograms are presented in Figure 2a as a function of SOC for the reaction:
VO 2 + + H 2 O VO 2 + + 2 H + + e
The difference in peak potential (ΔEp) for each electrolyte is on the order of 400 mV (at 5 M H2SO4) and is consistent with previous work [11,18], which indicates an irreversible electrochemical system. One major difference observed in the SOC series is a systematic decrease in current for all scans at all potentials. This CV depression is consistent with the increasing amount of VO2+ as SOC increases, thus producing more cathodic current ubiquitously in the CV. Figure 2b explores this phenomenon more closely via inspection of the difference in switching currents (isw,a and isw,c) based on a method described by Scholz and Hermes [42] on reversible systems. A linear trend is evident with increasing mole fraction of VO2+, which for a well-known system could be used to estimate the SOC. The slope of this line decreases with increasing sulfuric acid concentration, exemplifying the need to fully characterize the system in order to employ this technique as an SOC determination method. However, this rather simplistic process might open up an avenue for a quick, in situ gauge to determine SOC on operating VRFBs. Otherwise, no significant changes occur within the dataset at fixed H2SO4 concentrations vs. SOC.
Figure 3a shows sample cyclic voltammograms for 0.1 M VO2+ at 0% SOC in 1, 3 and 5 M H2SO4. Figure 3b shows the CVs in the same H2SO4 concentrations at 100% SOC. Guide lines are provided to draw a comparison to the peak positions between Figure 3a,b. At 0% SOC, the anodic peaks (positive current) only exhibit a slight shift in potential (Ep,a) toward the cathodic direction (more reversible) from 1 M to 3 M H2SO4. However, a significant decrease in peak current (ip,a) is observed. The origin of this phenomena is unclear, though it might be ascribed to slower diffusion due to the increased viscosity [18,43] at higher H2SO4 concentrations. This decrease in ip,a of the anodic peak is most prevalent in low SOC (i.e., high VO2+ concentrations). At 100% SOC, the difference in ip,a in 1 and 3 M is negligible.
From 3 M to 5 M H2SO4, there is only a small decrease in ip,a but a significant shift in Ep,a toward the reversible direction, which is also consistent with previous findings [11,18] of faster electrochemical kinetics with higher H2SO4 concentrations. The cathodic peaks (negative current) shift away from the reversible direction, are broadened and muted at lower H2SO4 concentrations. This effect is similar to previous observations supporting the EC (electrochemical-chemical) mechanism [18,44] as the lower H+ concentration would be expected to benefit the forward direction of Equation (4) and hinder the reverse process.
Also note that, aside from the decreased ip,a for 1 M H2SO4, there is no significant difference in peak position, supplying further evidence that the degree of SOC does not affect the EC reaction mechanism for the anodic reaction.
The presence of both valence state of vanadium does not appear to change the reaction mechanism as the overall shape of the CVs remains unchanged. The anodic peaks shift slightly towards a more reversible potential as the SOC is increased. The effect on the cathodic peak is dependent on sulfuric acid concentration, with little change in cathodic peak position at 5 M and a slight shift away from a more reversible potential at 1 M sulfuric acid.
Using the Randles-Sevcik equation for irreversible redox reactions [45,46], the translational diffusion could be predicted from the first CV scan of a series, when the VO2+ concentration at the electrode is the same as that in the bulk and is known:
i p i r r e v = ± 0.496 ( α n ) 1 2 n F A C ( F D υ R T ) 1 / 2
where n’ is the number of electrons transferred before the rate determining step. The average diffusion coefficient determined for each of the electrolyte solutions is listed in Table A1 and is similar to the values calculated using EPR.
Assuming α = 0.5, those determined diffusion coefficients (D) and the peak potential difference (ΔEp), the standard heterogeneous rate constant (k0) can be determined by employing the relationship of Klingler and Kochi [46]:
k 0 = 2.18 [ D α ν n F R T ] 1 / 2 exp [ ( α 2 n F R T ) ( E p o x E p r e d ) ]
This method is similar to the commonly used method of Nicholson and Shane [47,48] but is more appropriate for the larger values of ΔEp (and therefore lower values of k0) which are observed here for the lower H2SO4 concentrations. As Figure 4 illustrates, the rate of the electrochemical step on glassy carbon approximately increases by an order of magnitude as H2SO4 concentration is increased for the three H2SO4 concentrations probed.
Interestingly, there is no consistent trend in k0 as a function of SOC across the three series. In 1 M H2SO4, the rate is the slowest, which is consistent with poor kinetics for low acid content [18]. This can be explained by Le Chatelier’s Principle and Equation (4), where H+ is produced during the anodic reaction (forward arrow) and consumed during the cathodic reaction. The difference in the rates with SOC is largely due to changes in the peak position of the cathodic peak. In 5 M H2SO4, the cathodic peak for all SOCs is at a more reversible potential than the peaks seen in 1 M H2SO4. Through modeling and Tafel slope fitting, Gatrell et al. [44] suggested that the V5+ to V4+ reaction occurs through a CEC (chemical, electrochemical, chemical) mechanism close to the reversible potential and shifts to a ECC (electrochemical, chemical, chemical) mechanism as the overpotential increases. The different behavior of the cathodic peak at 1 M and 5 M H2SO4 could be an effect of a shift from CEC mechanism dominating at 5 M and the ECC mechanism occurring in 1 M.

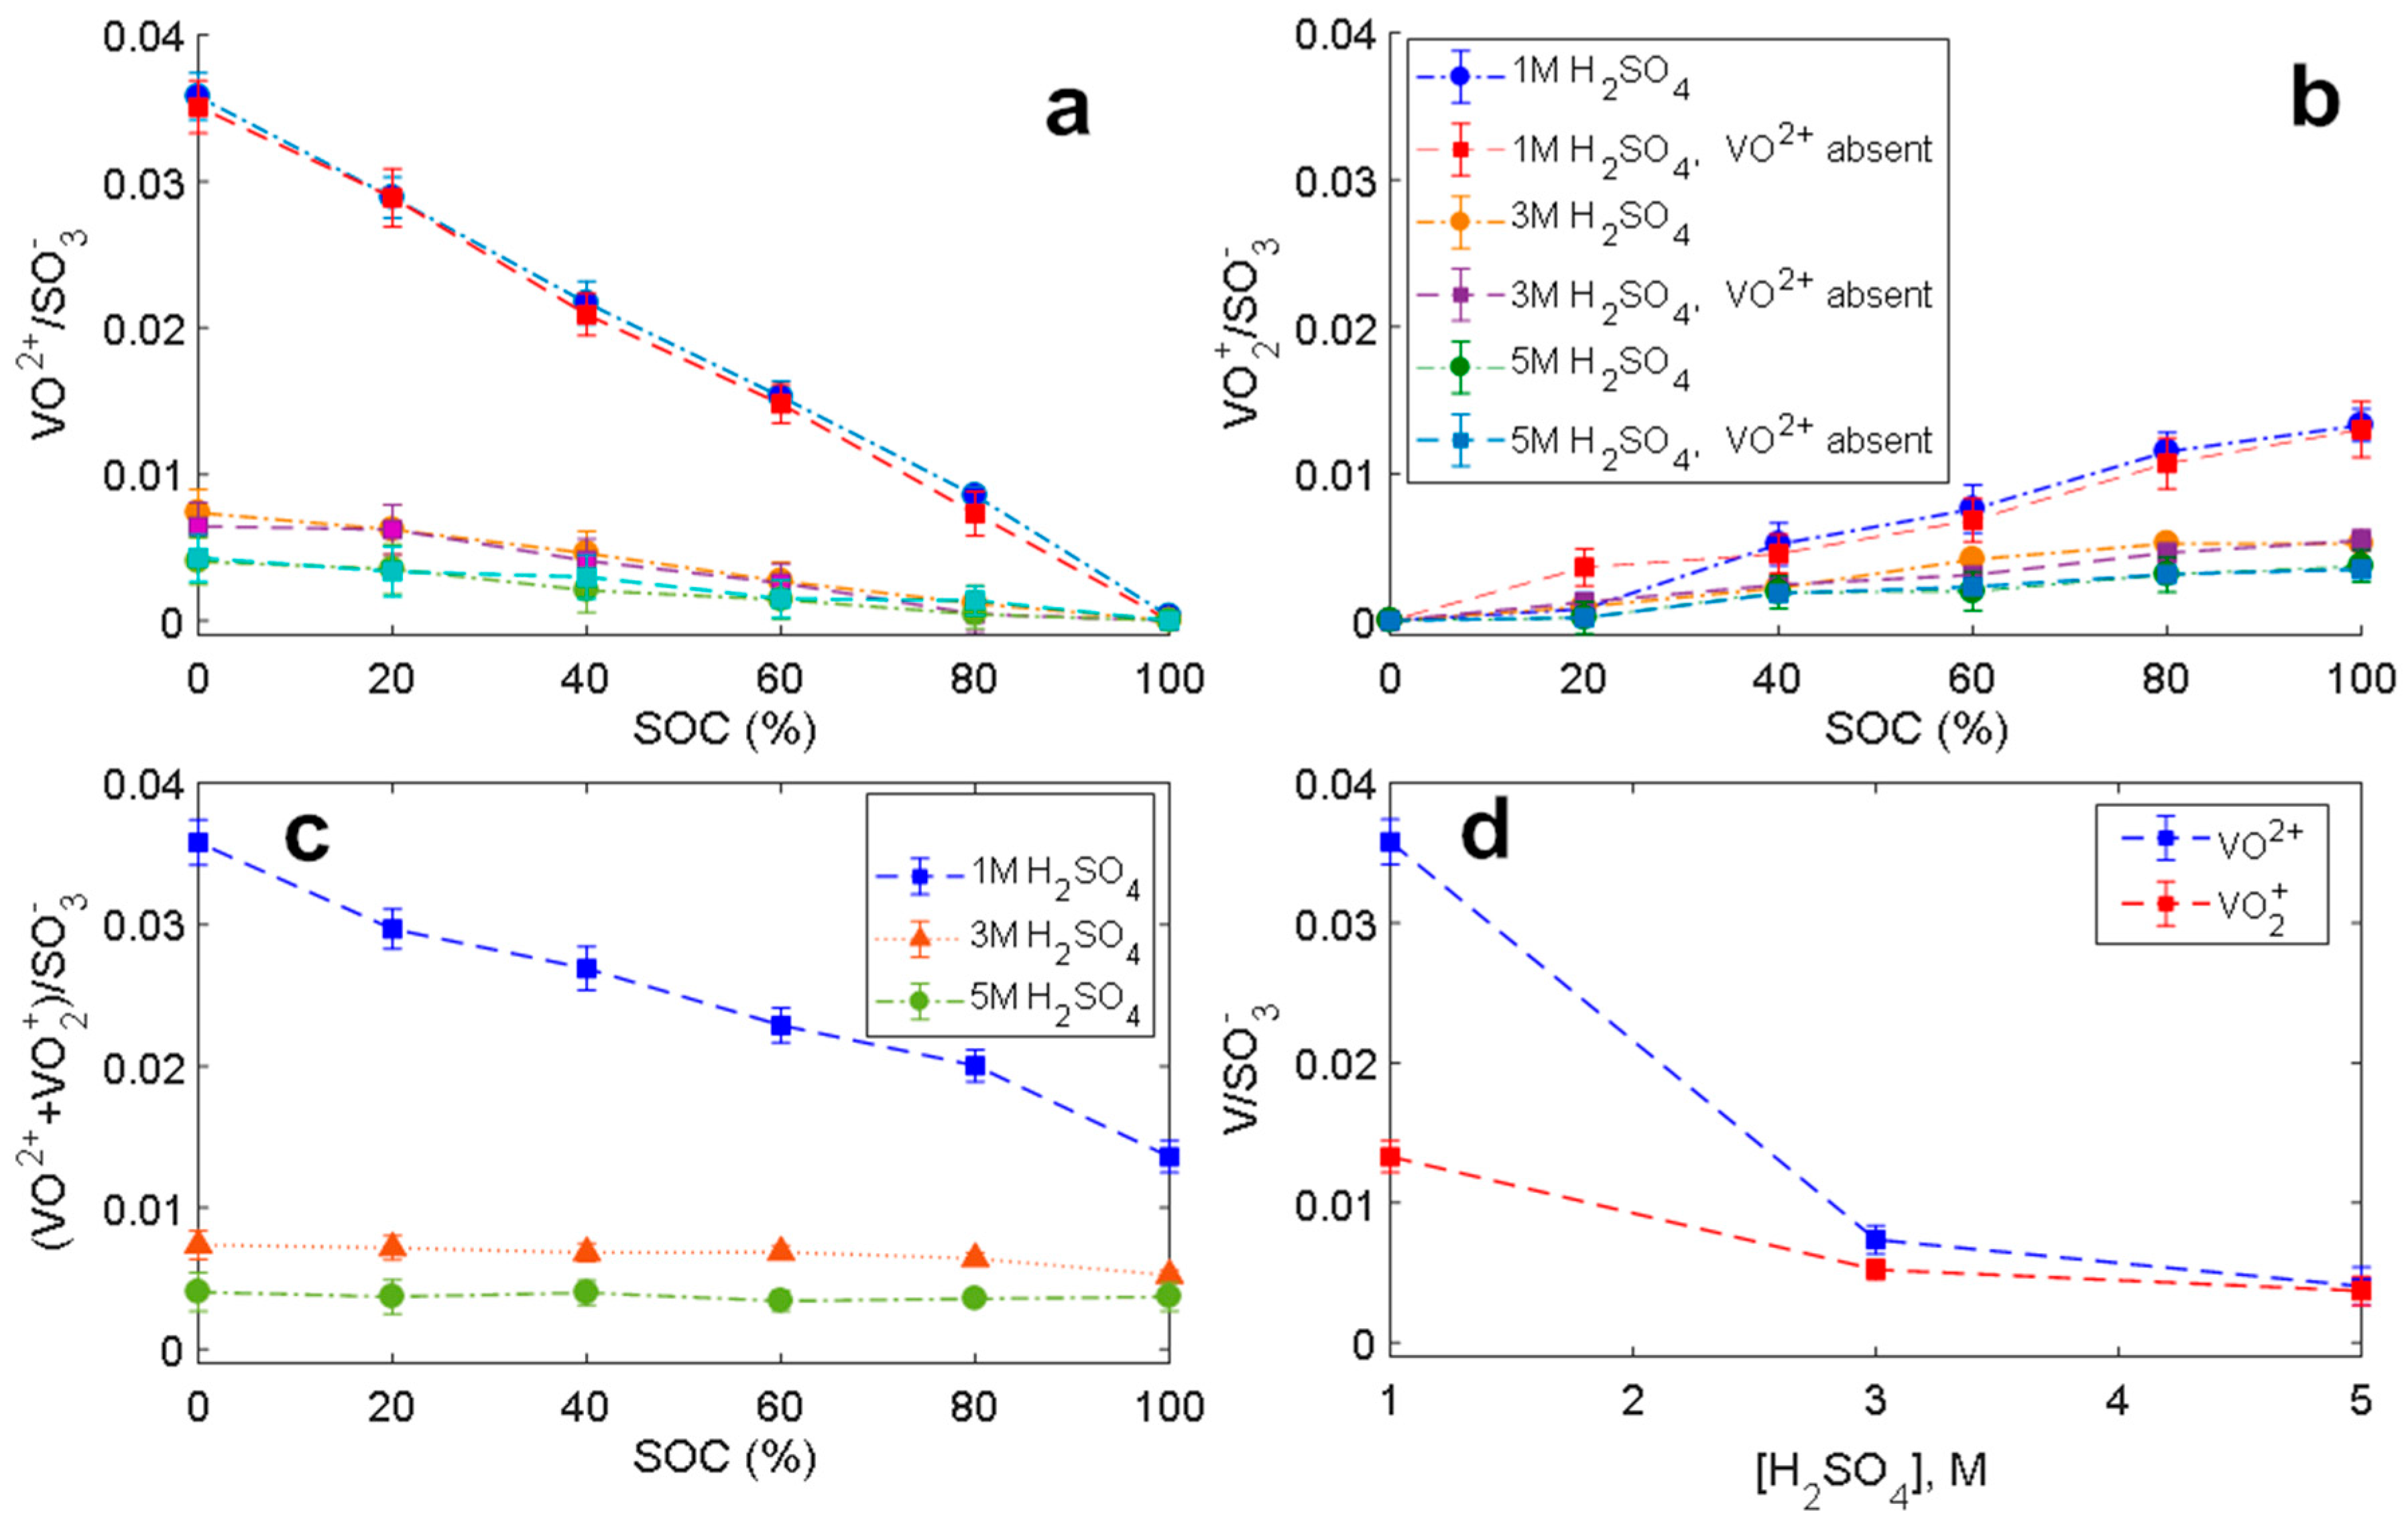
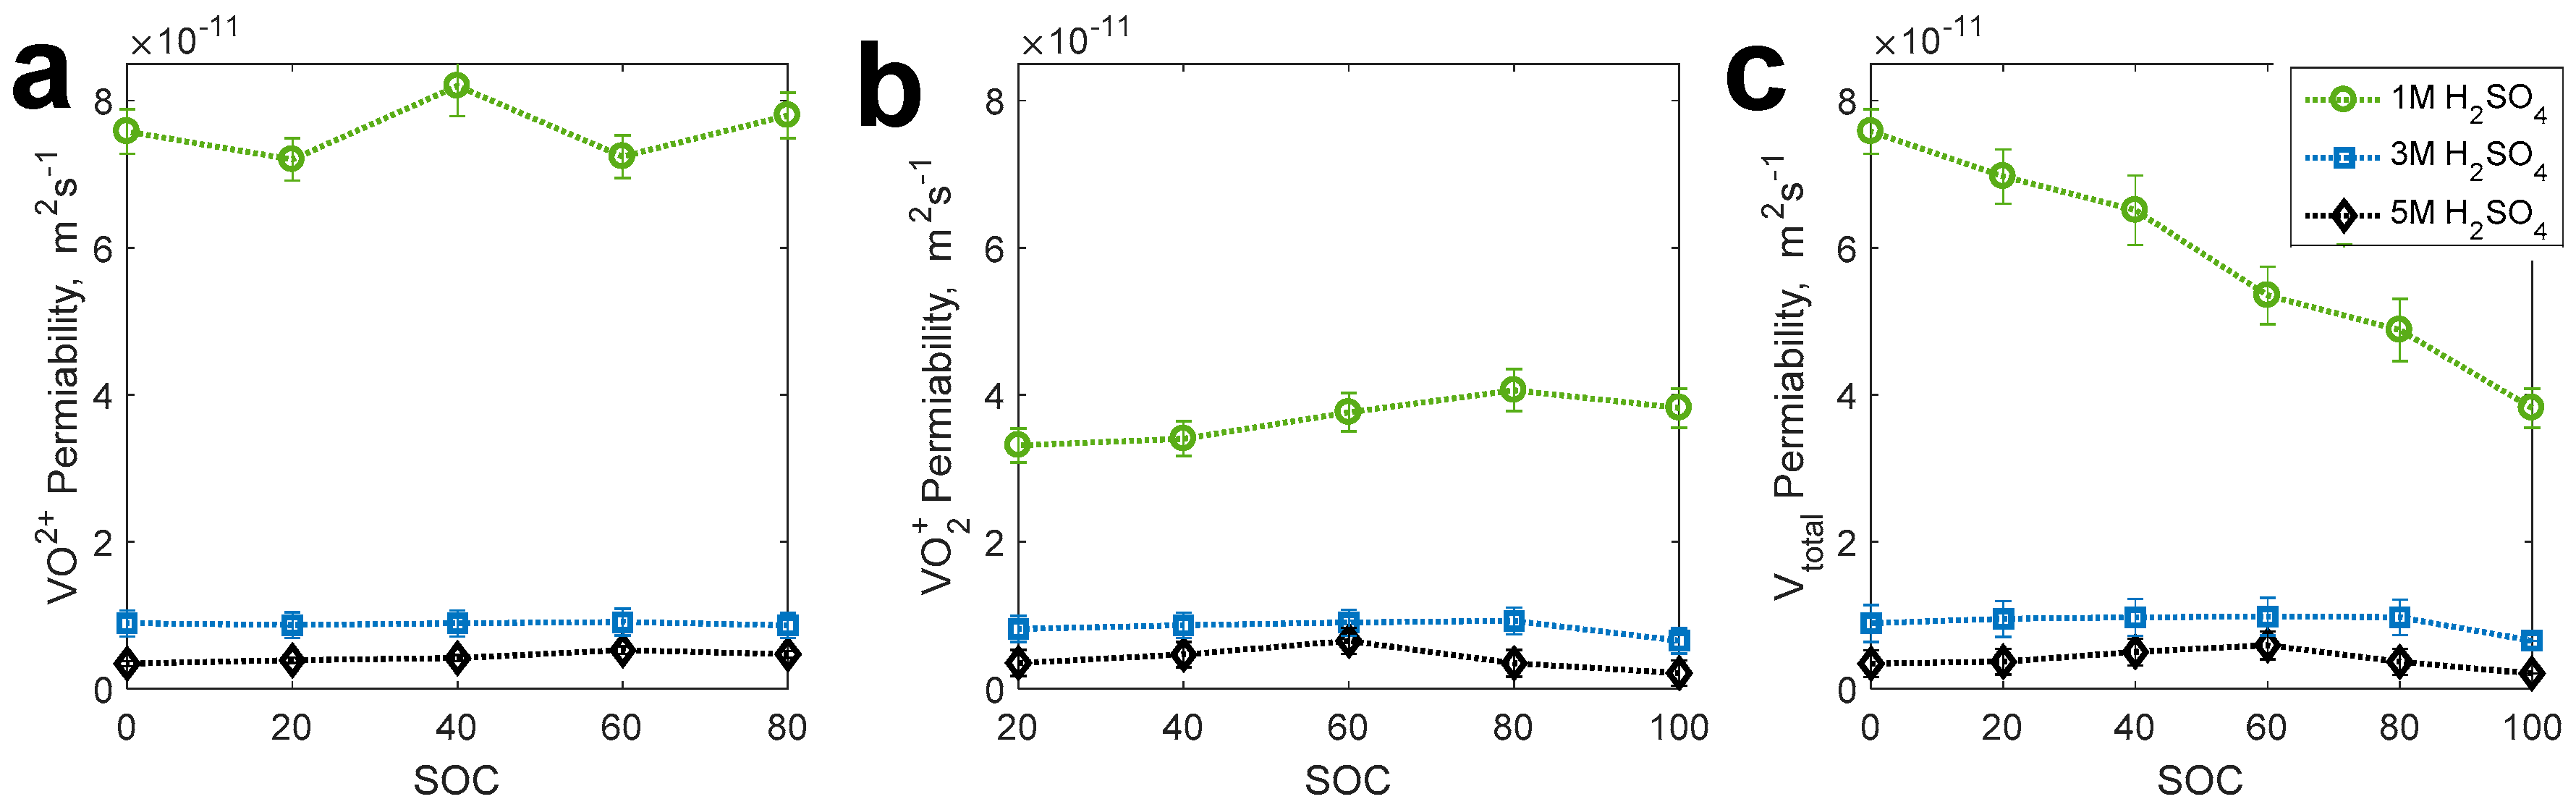
2.3. Uptake of Vanadium in Nafion Membrane

Figure 5a shows VO2+ uptake in the Nafion membranes upon exposure to the different electrolyte solutions. The uptake decreases with increased acid concentration, as shown in Figure 5d. It also decreases linearly with SOC, consistent with the decrease in concentration of VO2+ in the solution. Also plotted in Figure 5a is the VO2+ uptake when the membranes were exposed to solutions of VO2+ with concentrations consistent with the VO2+ concentration for a particular SOC. For example, the 40% SOC solution contains 0.06 M VO2+ and 0.04 M VO2+. The comparison solution contains only 0.06 M VO2+. The presence or absence of VO2+ from the soaking material does not have an effect on the amount of VO2+ that is absorbed into the membrane.
Figure 5b shows VO2+ uptake in the Nafion membranes upon exposure to the different electrolyte solutions. The uptake decreases with increased acid concentration, shown in Figure 5d. It also increases fairly linearly with SOC, consistent with the increase in concentration of VO2+ in the solution. Also plotted in Figure 5b is the VO2+ uptake when the membranes were exposed to solutions of VO2+ with concentrations consistent with the VO2+ concentration for a particular SOC. Similar to the VO2+, the presence of VO2+ does not have a significant effect on the amount of VO2+ absorbed into the membrane.
In general, VO2+ absorbs more readily into the membrane than VO2+. However, this effect is more pronounced at lower H2SO4 concentrations. At low H2SO4 concentrations, VO2+ has been observed to absorb into the membrane substantially [21]. In Figure 5c, the total vanadium in the membrane with SOC shows that there is a significant decrease in the total vanadium content at 1 M H2SO4 as SOC increases, but this change essentially disappears at 3 and 5 M sulfuric. It is an interesting observation that the relationship between VO2+ and the membrane is not affected by the pH the way VO2+ is.
The permeability of the VO2+ and VO2+ is calculated using the following equation:
C ( t ) = C t = + ( C t = 0 C t = ) e P A t V l
The concentrations here reflect the concentration of the particular vanadium species at the given state of charge considering that the total vanadium concentration in this study is 0.1 M. The total vanadium permeability combines the results of the two ions. Figure 6 shows the permeability of VO2+ (Figure 6a), VO2+ (Figure 6b) and the total vanadium permeability (Figure 6c). The VO2+ permeability is not significantly altered by state of charge (data is flat in Figure 6) but it does increase with lower acid concentration. Similar results were observed for VO2+ except the permeability of VO2+ is lower than VO2+ in 1 M sulfuric acid, consistent with the patterns of uptake. In 3 and 5 M sulfuric acid, the permeability rates are similar for both ions. This leads to the total vanadium permeability being fairly consistent with SOC in 3 M and 5 M H2SO4. However, a linear decrease is observed in 1 M sulfuric acid as SOC increases. Because the concentration is accounted for in the permeability, the overall crossover of VO2+, for example, is lower at low SOCs and increases with SOC even though the permeability remains consistent.
Two important factors that govern the permeability are the diffusion of the vanadium ions in the membrane and the amount of each ion that is able to absorb into the membrane, determined from the uptake measurements. This relationship is described by the following equation:
D T = P K
where P is permeability and K is the partitioning coefficient. Partitioning describes the concentration of VO2+ or VO2+ in the membrane versus the concentration of the solutions. In general, vanadium diffusion in the membrane is about an order of magnitude lower than the vanadium diffusion in the bulk solution. Both partitioning and solvent uptake decrease with increasing H2SO4 concentration but remain fairly unchanged with SOC. The results of translational diffusion and partitioning in the membrane are listed in Table A2 (in Appendix A).

3. Materials and Methods

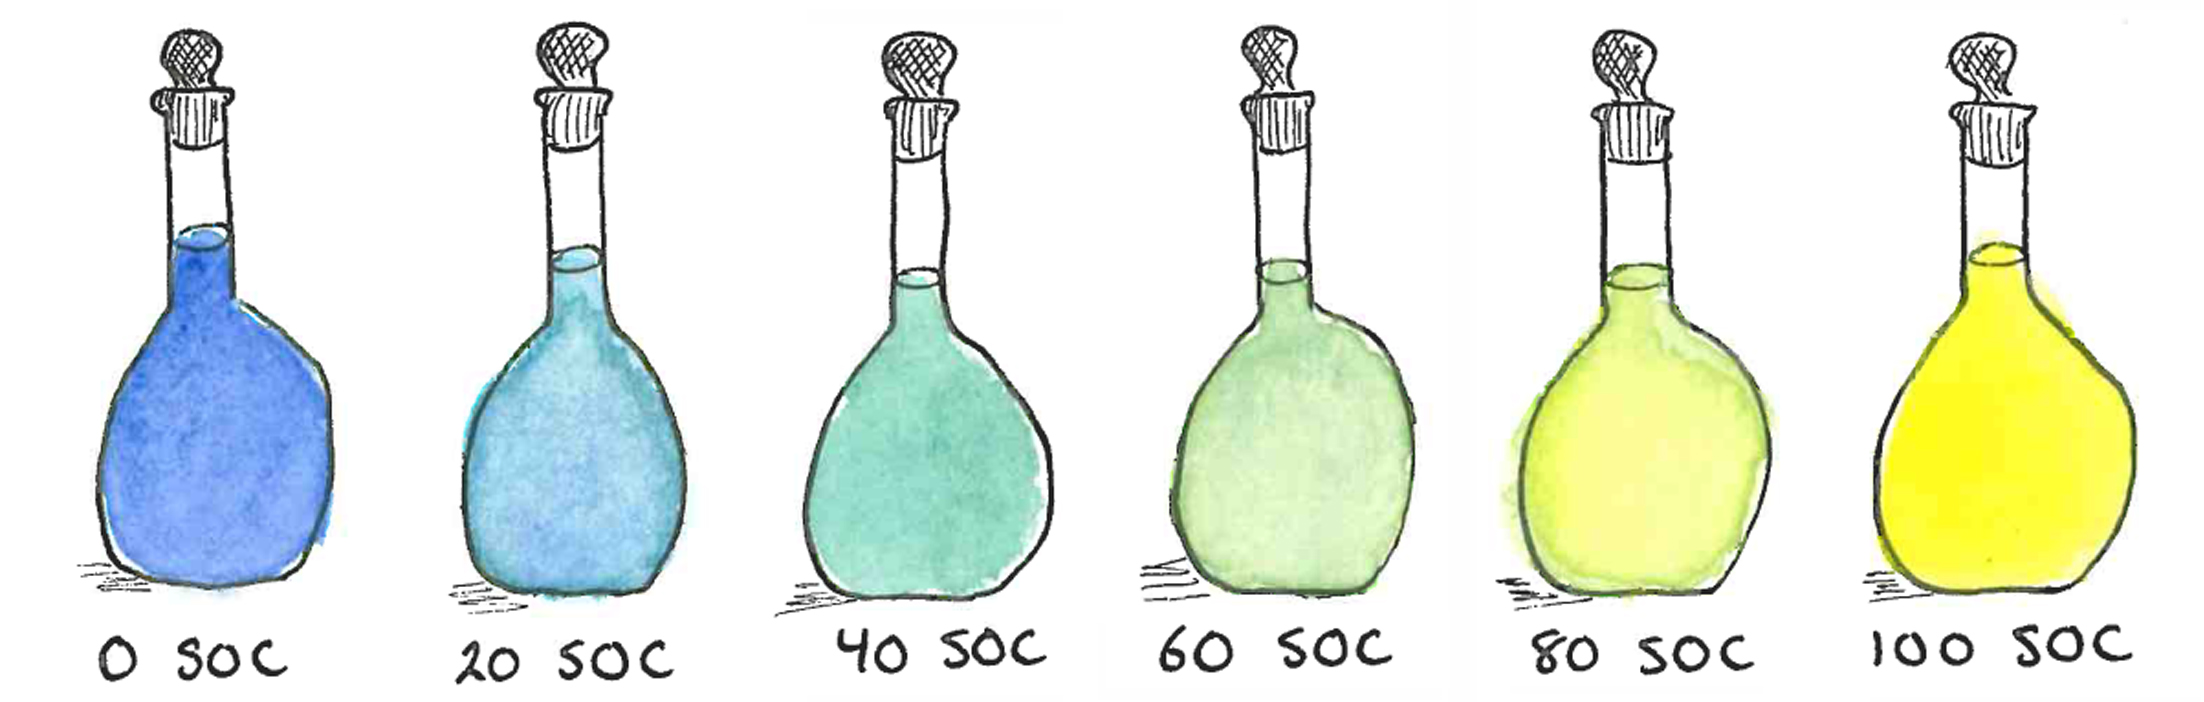
3.1. Preparation of Electrolyte Solutions

Electrolyte stock solutions were prepared from crystalline vanadium (IV) oxide sulfate hydrate (Sigma Aldrich, St. Louis, MO, USA) in sulfuric acid (Sigma Aldrich, St. Louis, MO, USA). Sulfuric acid solutions at the target concentrations of 1.0, 3.0, and 5.0 M were titrated with standardized NaOH to verify concentration; the actual titrated H2SO4 concentrations were 1.0, 3.0, and 4.9 M. Stock electrolyte solutions at each acid concentration were then prepared to consist of 1.0 M VOSO4·xH2O (x = 3.04 via the certificate of analysis). To prepare the charged vanadium (V) oxide solutions, a flow battery cell [49], with equal 50 mL volumes of 1.0 M VO2+ electrolyte solution as the anolyte and catholyte, was held at 1.8 V for approximately 24 h [21]. This yielded 50 mL of 1.0 M VO2+ and 50 mL of 1.0 M V3+, the latter of which was not used in the experiment below. The charged 1.0 M VO2+ stock electrolyte solutions were prepared at each of the 1.0, 3.0, and 5.0 M H2SO4 concentrations.
Electrolyte solutions for the experiments below were prepared from the stock 1.0 M VO2+ and 1.0 M VO2+ electrolyte solutions. Mixing appropriate ratios of the stock electrolytes enabled the preparation of solutions at various state of charge (SOC) percentages from 0% (all VO2+) to 100% (all VO2+). The electrolyte solutions were then diluted with H2SO4 of corresponding concentration to achieve the desired total vanadium concentration.

3.2. Electron Paramagnetic Resonance (EPR) Measurements

Vanadium in the 4+ oxidation state, VO2+, has a single unpaired electron and therefore is EPR active. The characteristic 7-peak EPR signal for VO2+ can be analyzed quantitatively to determine vanadium concentration. Because relatively low concentrations of vanadium are analyzed in the following experiments, the signal peak widths remain narrow so the intensity of the maximum (third) peak can be used for quantification, rather than the double integration necessary at higher concentrations. For the membrane uptake experiments, VO2+ standards ranging from 0.098 to 25 mM were prepared in nitric acid (5% by mass, TraceMetal Grade, Fisher Scientific, Fairlawn, NJ, USA). For the crossover/diffusion cell experiments, VO2+ standards ranging from 0.098 to 100 mM were prepared at each of the four H2SO4 concentrations. A 50 µL sample of each standard was sealed in a quartz capillary tube (Hirschmann, Eberstadt, Germany) and measured on the EPR (Freiberg Instruments Magnettech MiniScope MS-5000 EPR with ESRStudio Software, Berlin, Germany). Calibration curves, with the EPR signal intensity of the third peak on the x-axis and VO2+ concentration on the y-axis, were fitted using a quadratic function to account for the very subtle broadening at the upper end of the concentration range. The calibration curve equations were then used to determine VO2+ concentration from EPR measurements taken for the 50 µL capillary tube samples of electrolyte solutions collected during the experiments.
Electrolyte solutions at SOC above 0% also contain VO2+, vanadium in the 5+ oxidation state. This species is not paramagnetic and thus not EPR-active, so the VO2+ in each of these solutions were converted to EPR-active VO2+ in order to determine the concentration. After collecting an initial 50 µL capillary tube sample to measure the existing VO2+ concentration via EPR, 0.5 mL the electrolyte solution was transferred to a plastic centrifuge vial (1.5 mL volume, VWR International, Radnor, PA, USA). An excess (10 µL) of 1.0 M potassium iodide (Sigma Aldrich, St. Louis, MO, USA) was then added to the vial to reduce VO2+ to VO2+.
2 VO 2 +   +   2 I + 4 H +   2 VO 2 + +   I 2 + 2 H 2 O
The reaction proceeds quickly, so after a minimum of 30 min a 50 µL volume of the reduced solution was sealed in capillary tube and the EPR measurement taken. The resulting EPR spectrum represents the total concentration of vanadium (the sum of existing VO2+ and reduced VO2+) in a given electrolyte solution. The VO2+ concentration in the solution was determined by subtracting the VO2+ concentration, as previously determined, from the total vanadium concentration.
The SOC solutions were deoxygenated by bubbling with hydrated nitrogen for 1 h. Samples were sealed in a capillary. Measurements were collected on an x-band EPR (Magnettech 5000 miniscope) at 25–45 °C and at −180 °C. The spectra were fitted using Easyspin [50,51].

3.3. Membrane Pre-treatment

The Nafion 117 membrane (FuelCellStore, College Station, TX, USA) used in the experiments was pretreated to ensure consistent initial conditions. After cutting to the appropriate size, the membrane was heated in a beaker of MilliPore deionized water (18.2 MΩ·cm, Millipore Sigma, Burlington, MA, USA) at 80 °C for 1 h, followed by heating in 5.0 M H2SO4 at 80 °C for 1 h. The membrane was then rinsed with deionized water and stored in a sealed container of deionized water at room temperature until use.

3.4. Membrane Uptake Experiments

Nafion 117 membrane was cut into 25-mm-wide strips and pretreated as described in Section 3.3 Membrane Pretreatment. The pretreated membranes were dried in a vacuum oven overnight at 40 °C. The large strips were then cut into smaller 3.0 mm × 25 mm samples and placed into individual 1.5 mL plastic centrifuge vials (VWR International, Radnor, PA, USA). The dry mass of each membrane was measured with an analytical balance (XS 105 Dual Range, Mettler-Toledo, Columbus, OH, USA), working quickly to minimize exposure of the membrane to atmospheric moisture when removed from the centrifuge vial. The membranes were then soaked in electrolyte solutions, a 1.5 mL volume of which was added to each centrifuge vial, for at least 72 h at room temperature to establish uptake equilibrium. The different electrolyte solutions were prepared with SOC percentages of 0%, 20%, 40%, 60%, 80%, and 100%; total vanadium concentrations of 0.02, 0.04, 0.06, 0.08, and 0.1 M; and H2SO4 concentrations of 1.0, 3.0, and 5.0 M.
After equilibration in the electrolyte solutions, each membrane sample was removed from its centrifuge vial, the surface wiped dry with a Kimwipe and the mass of each soaked membrane was also measured on the analytical balance. The membranes were then transferred into clean, labeled centrifuge vials containing 1.5 mL nitric acid at (5% by mass, TraceMetal Grade, Fisher Scientific, Fairlawn, NJ, USA). Another 72-h equilibration period allowed for the vanadium contained within the membranes to leach out into the HNO3 soak solution. The VO2+ and VO2+ concentration in the soak solutions were measured by EPR.

3.5. Crossover/Diffusion Cell Experiments

Nafion 117 membrane was cut into a 4cm x 4cm square and pretreated as described in Section 3.3 (Membrane Pretreatment). The pretreated membrane was clamped between the two halves of a 15 mm Side-Bi-Side glass diffusion cell with 10 mL volumes (PermeGear, Hellertown, PA, USA). A circulating water bath was flowed through the outer jacket of the diffusion cell to maintain a temperature of 25 °C during all experiments, and magnetic stir bars in each side of the cell were used to prevent the formation of a concentration gradient. Before and after each diffusion experiment, both sides of cell were filled with 10 mL of H2SO4 to equilibrate the membrane. After removing the equilibration acid, experiments were conducted by inserting 10 mL of an electrolyte solution into one side of the cell and a 10 mL “blank,” pure H2SO4 of the same concentration as the electrolyte, into the opposite side of the cell. Electrolyte solutions were prepared at 0.1 M total vanadium concentration, SOC percentages of 0%, 20%, 40%, 60%, 80%, and 100%, and H2SO4 concentrations of 1.0, 3.0, and 5.0 M.
Over a run time lasting up to 4250 min, 50 µL samples were removed at recorded time intervals from the sampling port on the “blank” side of the diffusion cell. The samples, sealed in capillary tubes, were measured on the EPR for VO2+ quantification.
For the 20% through 100% SOC solutions, an additional 0.5 mL sample was taken at the end of the diffusion experiment and transferred to a clean centrifuge vial. The procedure outlined in Section 3.2 (EPR Measurements) was followed to determine the VO2+ concentration.

3.6. Cyclic Voltammetry (CV) Experiments

Electrolyte solutions were prepared with 0.1 M total vanadium, SOC percentages of 0%, 20%, 40%, 60%, 80%, and 100%, and H2SO4 concentrations of 1.0, 3.0, and 5.0 M. Ultra-high-purity argon gas (Airgas, Radnor, PA, USA) was hydrated and bubbled for at least 30 min to degas the solutions prior to the CV experiments. Approximately 25 mL of a degassed solution was poured into a 50 mL glass beaker fitted with a Teflon cap with ports, through which the three electrodes were inserted into the solution. The working electrode, a glassy carbon electrode with a 3.0 mm diameter (BASi, West Lafayette, IN, USA), was pretreated by polishing with 0.05 µm alumina slurry (Electron Microscopy Sciences, Hatfield, PA, USA) followed by sonication in deionized water. The counter electrode was a platinum mesh spot welded to a platinum wire, and the reference electrode was a Ag/AgSO4 reference electrode (saturated K2SO4, Koslow Scientific, Englewood, NJ, USA). A glass tube hovering above the surface of the electrolyte solution supplied a gentle stream of hydrated ultra-high purity argon gas to blanket the electrolyte.
The electrodes were connected to a low-current probe differential electrometer on the Bio-Logic SP-300 Potentiostat (with Bio-Logic EC-Lab software, Seyssinet-Pariset, France). Cyclic voltammograms for each electrolyte solution were collected using potential limits of −0.70–1.10 V versus Ag/AgSO4 and scan rates of 50, 25, 15, and 10 mV/s. To allow for equilibration to occur in the solution, fifty cyclic voltammograms were collected at 50 mV/s, five at 25 mV/s, five at 15 mV/s, and two at 10 mV/s; only the final cyclic voltammogram at each scan rate was used for analysis except for Randles-Sevcik analysis (Equation (5)) as described above.
The experiments were conducted in a Faraday cage to prevent electrical interference. Between each CV experiment, the electrodes, beaker, and cap were rinsed with deionized water and dried thoroughly.

4. Conclusions

The VO2+/VO2+ redox couple was studied as a function of state of charge (SOC) at 1, 3 and 5 M H2SO4 concentrations by EPR, cyclic voltammetry and gravimetric techniques. Vanadium species crossover through Nafion membranes was also studied by EPR, diffusion cell measurements and gravimetric methods. EPR data show that SOC has a minimal impact on the EPR line shape and only reflects the decreasing signal intensity as VO2+ concentration decreases. Cyclic voltammetry measurements show no major changes in the reaction mechanism with respect to SOC, but possible changes when the H2SO4 concentration is varied. The electron transfer rate determined from the CV analysis was shown to be largely constant as SOC changes except at low SOC. However, H2SO4 concentration significantly affects the rate by increasing an order of magnitude for each of the three H2SO4 series investigated.
Vanadium uptake measurements show that the amount of VO2+ or VO2+ that absorbs into the membrane is dependent on concentration, but it is not affected by the presence of the other redox partner. More VO2+ absorbs into the membrane than VO2+, but the difference decreases significantly with increased H2SO4 concentration. The crossover of the vanadium species through the membrane is related to the uptake, as the ions have to absorb into the membrane to cross through. Permeability is reduced with increased H2SO4 concentration but is not affected by SOC. The permeation and uptake measurements combined allow for a calculation of vanadium diffusion in Nafion, which is about an order of magnitude smaller than the diffusion in the bulk solution.

Author Contributions

Conceptualization, J.S.L. and T.M.A.; methodology, J.S.L. and T.M.A.; software, all authors; validation, T.M.A., W.S.C., S.M.T. and J.S.L.; formal analysis, T.M.A. and J.S.L.; investigation, all authors; resources, T.M.A.; data curation, all authors; writing—original draft preparation, W.S.C., J.S.L. and T.M.A.; writing—review and editing, T.M.A. and J.S.L.; visualization, W.S.C., J.S.L. and T.M.A.; supervision, T.M.A. and J.S.L.; project administration, T.M.A.; funding acquisition, T.M.A. and W.S.C. All authors have read and agreed to the published version of the manuscript.

Funding

T.M.A. gratefully acknowledges support from a NASA Rhode Island EPSCoR Research Infrastructure and Development grant NNX15AK52A; S.M.T. acknowledges the NASA Rhode Island Space Grant Consortium (NASA) for a summer undergraduate research scholarship (NNX15AI06H); W.S.C. acknowledges the Williams Center for Environmental Studies Summer Grants Program for funding undergraduate summer research internships for Williams College students.

Acknowledgments

All authors thank the Salve Regina University Department of Chemistry for use of lab space, equipment and selected materials.

Conflicts of Interest

The authors declare no conflict of interest.

Appendix A

Table A1. Translational diffusion coefficient determined from EPR and Cyclic Voltammetry as a function of H2SO4 concentration and SOC.
[H2SO4] (M)SOC (%)VO2+ DT, Solution, EPR, (m2s−1) ×1010VO2+ DT, Solution, CV, (m2s−1) ×1010
106.033.20
1206.022.97
1405.912.88
1605.922.95
1806.063.15
1100--
304.192.18
3204.202.01
3404.071.88
3604.221.81
3804.182.60
3100--
503.441.52
5203.341.96
5404.051.72
5603.491.52
5803.481.46
5100--
Table A2. Partition and translational diffusion coefficients for VO2+ and VO2+ in the membrane.
SOC
(%)
VO2+ Partition CoefficientVO2+ Partition CoefficientMass of Absorbed Solvent per Gram of MembraneVO2+ DT, Membrane (m2s−1) × 1011VO2+ DT,
Membrane
(m2s−1) × 1011
1 M H2SO4
03.18-0.1032.38-
203.440.3770.1062.093.20
403.751.350.09512.182.51
603.881.280.09261.862.94
803.871.300.1012.023.12
100-1.240.103-3.09
3 M H2SO4
00.836-0.09461.06-
201.010.6130.08260.8651.32
401.110.8020.07420.8021.07
600.7900.8170.09111.141.11
800.7400.8400.08371.151.10
100-0.640.0878-0.996
5 M H2SO4
00.615-0.07640.551-
200.7800.1640.06600.4972.12
400.4330.6040.09240.9580.768
600.5740.5300.07250.9131.53
800.3600.6430.07071.310.536
100-0.5520.0782-0.375
Note: partition coefficients are dimensionless quantities as calculated by mol kg−1/mol kg−1.
Table A3. List of terms and symbols.
Term/SymbolDefinition
AElectrode area, cm2
CoBulk Concentration, mol m−3
DRRotational diffusion, s−1
DTTranslational diffusion, m2 s−1
E p o x Anodic peak potential, V
E p r e d Cathodic peak potential, V
Esw,aAnodic switching potential, V
Esw,cCathodic switching potential, V
FFaraday’s constant, C mol−1
iCurrent, Amperes
ip,aAnodic peak current, Amperes
ip,cCathodic peak current, Amperes
KPartitioning coefficient, a.u.
kBBoltzmann Constant, kg m2 s−2 K−1
k0Rate constant, cm s−1
nMoles
ɳViscosity, cP
PPermeability, m2s−1
rHydrodynamic radius, m
RGas constant, Jmol−1K−1
TTemperature, K
αElectron transfer constant
ΔEpDifference in peak potentials, V
νScan rate, Vs−1

References

  1. Skyllas-Kazacas, M.; Rychcik, M.; Robins, R.G.; Fane, A.G.; Green, M.A. New All-Vanadium Redox Flow Cell. J. Electrochem. Soc. 1986, 133, 1057–1058. [Google Scholar] [CrossRef]
  2. Skyllas-Kazacos, M.; Cao, L.; Kazacos, M.; Kausar, N.; Mousa, A. Vanadium Electrolyte Studies for the Vanadium Redox Battery—A Review. ChemSusChem 2016, 9, 1521–1543. [Google Scholar] [CrossRef]
  3. Shi, Y.; Eze, C.; Xiong, B.; He, W.; Zhang, H.; Lim, T.M.; Ukil, A.; Zhao, J. Recent development of membrane for vanadium redox flow battery applications: A review. Appl. Energy 2019, 238, 202–224. [Google Scholar] [CrossRef]
  4. Lawton, J.S.; Budil, D.E. Investigation of water and methanol sorption in monovalent- and multivalent-ion-exchanged nafion membranes using electron spin resonance. J. Phys. Chem. B 2009, 113, 10679–10685. [Google Scholar] [CrossRef] [PubMed]
  5. Darling, R.M.; Saraidaridis, J.D.; Shovlin, C.; Fortin, M. Transference Numbers of Vanadium Cations in Nafion. J. Electrochem. Soc. 2020, 167, 020529. [Google Scholar] [CrossRef]
  6. Kushner, D.I.; Crothers, A.R.; Kusoglu, A.; Weber, A.Z. Transport phenomena in flow battery ion-conducting membranes. Curr. Opin. Electrochem. 2020, 21, 132–139. [Google Scholar] [CrossRef]
  7. Sun, C.; Chen, J.; Zhang, H.; Han, X.; Luo, Q. Investigations on transfer of water and vanadium ions across Nafion membrane in an operating vanadium redox flow battery. J. Power Sources 2010, 195, 890–897. [Google Scholar] [CrossRef]
  8. Vardner, J.T.; Edziah, J.-J.S.; West, A.C. Measurement of VO 2+ Transference Number in Nafion with Varying Concentrations of Sulfuric Acid. J. Electrochem. Soc. 2019, 166, A848. [Google Scholar] [CrossRef]
  9. Gurieff, N.; Keogh, D.F.; Baldry, M.; Timchenko, V.; Green, D.; Koskinen, I.; Menictas, C. Mass transport optimization for redox flow battery design. Appl. Sci. 2020, 10, 2801. [Google Scholar] [CrossRef]
  10. Roe, S.; Menictas, C.; Skyllas-Kazacos, M. A High Energy Density Vanadium Redox Flow Battery with 3 M Vanadium Electrolyte. J. Electrochem. Soc. 2016, 163, A5023–A5028. [Google Scholar] [CrossRef]
  11. Oriji, G.; Katayama, Y.; Miura, T. Investigation on V(IV)/V(V) species in a vanadium redox flow battery. Electrochim. Acta 2004, 49, 3091–3095. [Google Scholar] [CrossRef]
  12. Rahman, F.; Skyllas-Kazacos, M. Vanadium redox battery: Positive half-cell electrolyte studies. J. Power Sources 2009, 189, 1212–1219. [Google Scholar] [CrossRef]
  13. Choi, C.; Kim, S.; Kim, R.; Choi, Y.; Kim, S.; Jung, H.Y.; Yang, J.H.; Kim, H.T. A review of vanadium electrolytes for vanadium redox flow batteries. Renew. Sustain. Energy Rev. 2017, 69, 263–274. [Google Scholar] [CrossRef]
  14. Skyllas-Kazacos, M.; Kazacos, M. State of charge monitoring methods for vanadium redox flow battery control. J. Power Sources 2011, 196, 8822–8827. [Google Scholar] [CrossRef]
  15. Wu, X.; Liu, S.; Wang, N.; Peng, S.; He, Z. Influence of organic additives on electrochemical properties of the positive electrolyte for all vanadium redox flow battery. Electrochim. Acta 2012, 78, 475–482. [Google Scholar] [CrossRef]
  16. Skyllas-Kazacos, M.; Peng, C.; Cheng, M. Evaluation of Precipitation Inhibitors for Supersaturated Vanadyl Electrolytes for the Vanadium Redox Battery. Electrochem. Solid-State Lett. 1999, 2, 121. [Google Scholar] [CrossRef]
  17. Li, L.; Kim, S.; Wang, W.; Vijayakumar, M.; Nie, Z.; Chen, B.; Zhang, J.; Xia, G.; Hu, J.; Graff, G.; et al. A Stable Vanadium Redox-Flow Battery with High Energy Density for Large-Scale Energy Storage. Adv. Energy Mater. 2011, 1, 394–400. [Google Scholar] [CrossRef]
  18. Lawton, J.S.; Tiano, S.M.; Donnelly, D.J.; Flanagan, S.P.; Arruda, T.M. The Effect of Sulfuric Acid Concentration on Physical and Electrochemical Properties of Vanadyl Solutions. Batteries 2018, 4, 40. [Google Scholar] [CrossRef] [Green Version]
  19. Cao, L.; Skyllas-Kazacos, M.; Wang, D.-W. Effects of Surface Pretreatment of Glassy Carbon on the Electrochemical Behavior of V(IV)/V(V) Redox Reaction. J. Electrochem. Soc. 2016, 163, A1164. [Google Scholar]
  20. Lawton, J.S.; Jones, A.; Zawodzinski, T. Concentration dependence of VO2+ crossover of nafion for vanadium redox flow batteries. J. Electrochem. Soc. 2013, 160, A697–A702. [Google Scholar] [CrossRef]
  21. Lawton, J.S.; Jones, A.M.; Tang, Z.; Lindsey, M.; Zawodzinski, T. Ion effects on vanadium transport in Nafion membranes for vanadium redox flow batteries. J. Electrochem. Soc. 2017, 164, A2987. [Google Scholar]
  22. Tang, Z.; Svoboda, R.; Lawton, J.S.; Aaron, D.S.; Papandrew, A.B.; Zawodzinski, T.A. Composition and Conductivity of Membranes Equilibrated with Solutions of Sulfuric Acid and Vanadyl Sulfate. J. Electrochem. Soc. 2013, 160, F1040. [Google Scholar]
  23. Miles, D.T. Run-D.M.C.: A mnemonic aid for explaining mass transfer in electrochemical systems. J. Chem. Educ. 2013, 90, 1649–1653. [Google Scholar] [CrossRef]
  24. Oh, K.; Won, S.; Ju, H. A comparative study of species migration and diffusion mechanisms in all-vanadium redox flow batteries. Electrochim. Acta 2015, 181, 238–247. [Google Scholar]
  25. Barton, J.L.; Brushett, F.R. A one-dimensional stack model for redox flow battery analysis and operation. Batteries 2019, 5, 25. [Google Scholar]
  26. Lawton, J.S.; Budil, D.E. Spin Probe ESR Study of Cation Effects on Methanol and DMMP Solvation in Sulfonated Poly(styrene−isobutylene−styrene) Triblock Copolymers at High Ion-Exchange Capacities. Macromolecules 2010, 43, 652–661. [Google Scholar] [CrossRef]
  27. Lawton, J.S.; Smotkin, E.S.; Budil, D.E. Electron spin resonance investigation of microscopic viscosity, ordering, and polarity in nafion membranes containing methanol-water mixtures. J. Phys. Chem. B 2008, 112, 8549–8557. [Google Scholar] [PubMed]
  28. Lawton, J.S.; Budil, D.E. Electron spin resonance investigaion of the effects of methanol on microscopic viscosity, ordering, and polarity in different phases of ionomer membranes with sulfonated polyarylene backbones. J. Memb. Sci. 2010, 357, 47–53. [Google Scholar] [CrossRef]
  29. Coronado, F.; Valenzuela Soto, A.; Encinas Romero, M.A.; Hernández-Negrete, O.; Tiburcio Munive, G. Microstructural and chemical characterization of stabilized spent vanadium pentoxide catalyst in copper smelting slag. Mater. Res. Express 2020, 7, 016521. [Google Scholar]
  30. Mangini, L.F.K.; Valt, R.B.G.; Ponte, M.J.J.d.S.; Ponte, H.d.A. Vanadium removal from spent catalyst used in the manufacture of sulfuric acid by electrical potential application. Sep. Purif. Technol. 2020, 246, 116854. [Google Scholar]
  31. Rehder, D. The potentiality of vanadium in medicinal applications. Inorg. Chim. Acta 2020, 504, 119445. [Google Scholar] [CrossRef]
  32. Frank, P.; Carlson, R.M.K.; Carlson, E.J.; Hedman, B.; Hodgson, K.O. Biological sulfur in the blood cells of Ascidia ceratodes: XAS spectroscopy and a cellular-enzymatic hypothesis for vanadium reduction in the ascidians. J. Inorg. Biochem. 2020, 205, 110991. [Google Scholar]
  33. Frank, P.; Hodgson, K.O.; Carlson, R.M.K. Vanadyl Ion EPR as a Noninvasive Probe of pH in Intact Vanadocytes from Ascidia ceratodes. Inorg. Chem. 1986, 25, 470–478. [Google Scholar] [CrossRef]
  34. Servedio, L.T.; Lawton, J.S.; Zawodzinski, T.A. An electrochemical study of cobalt-salen (N,N′-bis(salicylidene)ethylenediaminocobalt(II) in the oxidation of syringyl alcohol in acetonitrile. J. Appl. Electrochem. 2020, 1–12. [Google Scholar] [CrossRef]
  35. Maurya, A. Homogeneous catalytic oxidation of alkenes employing mononuclear vanadium complex with hydrogen peroxide. J. Iran. Chem. Soc. 2020, 1–9. [Google Scholar] [CrossRef]
  36. Zwolak, I. Protective Effects of Dietary Antioxidants against Vanadium-Induced Toxicity: A Review. Oxid. Med. Cell. Longev. 2020, 2020, 1490316. [Google Scholar]
  37. Srinivasa Rao, L.; Thirmal, C.; Raghavendra Rao, P. Dielectric dispersion, linear and nonlinear optical properties of Li 2 O–WO 3 –B 2 O 3: V 2 O 5 glasses. J. Adv. Dielectr. 2020, 10, 2050006. [Google Scholar]
  38. Vijayakumar, M.; Li, L.; Graff, G.; Liu, J.; Zhang, H.; Yang, Z.; Zhi, J. Towards understanding the poor thermal stability of V 5 + electrolyte solution in Vanadium Redox Flow Batteries. J. Power Sources 2011, 196, 3669–3672. [Google Scholar] [CrossRef]
  39. Barklie, R.C.; Girard, O.; Braddell, O. EPR of vanadyl (2+) in a Nafion membrane. J. Phys. Chem. 1988, 92, 1371–1377. [Google Scholar] [CrossRef]
  40. Reuben, J.; Fiat, D. Proton and Deuteron Relaxation in Aqueous Solutions of Vanadyl( IV). Effects of Electron Spin Relaxation and Chemical Exchange. J. Am. Chem. Soc. 1969, 1611, 4652–4656. [Google Scholar]
  41. Chasteen, D.; Hanna, M. Resonance Line Widths of vanadyl(IV) hydroxycarboxylates. J. Phys. Chem. 1972, 76, 3951–3959. [Google Scholar] [CrossRef]
  42. Scholz, F.; Hermes, M. The determination of the redox state of a dissolved depolariser by cyclic voltammetry in the case of electrochemically reversible systems. Electrochem. Commun. 1999, 1, 345–348. [Google Scholar]
  43. Lawton, J.S.; Aaron, D.S.; Tang, Z.; Zawodzinski, T. Qualitative Behavior of Vanadium Ions In Nafion Membranes Using Electron Spin Resonance. J. Membrane Sci. 2013, 428, 38–45. [Google Scholar] [CrossRef]
  44. Gattrell, M.; Park, J.; MacDougall, B.; Apte, J.; McCarthy, S.; Wu, C.W. Study of the Mechanism of the Vanadium 4+/5+ Redox Reaction in Acidic Solutions. J. Electrochem. Soc. 2004, 151, A123–A130. [Google Scholar]
  45. Batchelor-Mcauley, C.; Kätelhön, E.; Barnes, E.O.; Compton, R.G.; Laborda, E.; Molina, A. Recent Advances in Voltammetry. ChemistryOpen 2015, 4, 224–260. [Google Scholar]
  46. Brownson, D.A.C.; Banks, C.E. The Handbook of Graphene Electrochemistry, 1st ed.; Springer: London, UK, 2014. [Google Scholar]
  47. Nicholson, R.S.; Shain, I. Theory of Stationary Electrode Polarography: Single Scan and Cyclic Methods Applied to Reversible, Irreversible, and Kinetic Systems. Anal. Chem. 1964, 36, 706–723. [Google Scholar]
  48. Aristov, N.; Habekost, A. Cyclic Voltammetry—A Versatile Electrochemical Method Investigating Electron Transfer Processes. World J. Chem. Educ. 2015, 3, 115–119. [Google Scholar]
  49. Arruda, T.M.; Shyam, B.; Lawton, J.S.; Ramaswamy, N.; Budil, D.E.; Ramaker, D.E.; Mukerjee, S. Fundamental Aspects of Spontaneous Cathodic Deposition of Ru onto Pt/C Electrocatalysts and Membranes under Direct Methanol Fuel Cell Operating Conditions: An in Situ X-ray Absorption Spectroscopy and Electron Spin Resonance Study. J. Phys. Chem. C 2010, 114, 1028–1040. [Google Scholar]
  50. Stoll, S.; Schweiger, A. EasySpin, a comprehensive software package for spectral simulation and analysis in EPR. J. Magn. Reson. 2006, 178, 42–55. [Google Scholar] [CrossRef]
  51. Stoll, S.; Schweiger, A. EasySpin: Simulating cw ESR spectra. Biol. Magn. Reson. 2007, 27, 299–321. [Google Scholar]
Figure 1. Electron Paramagnetic Resonance (EPR) spectra of vanadium electrolytes in 1 M H2SO4 supporting electrolyte at 0%, 20%, 40%, 60% and 80% state of charge. Total vanadium concentration is 0.1 M. Note 100% state of charge (SOC) is missing as VO2+ is EPR silent.
Batteries 06 00049 g001
Figure 2. (a) Cyclic voltammograms (CVs) of the VO2+/VO2+ redox couple in 5 M H2SO4 on a glassy carbon electrode at 50 mV/s. CVs started at open circuit potential (ca. 0.55 V) and proceeded in the anodic direction first. All CVs shown here were the 50th scan of each experiment to attain a steady-state CV. (b) Absolute value of the difference in switching currents (|isw,a| – |isw,c|) as a function of mole fraction of VO2+ at 50 mV/s, 50th scan of each data set. The switching potentials (Esw,a and Esw,c) corresponding to isw,a and isw,c were 1.1 V and −0.7 V vs. Ag/AgSO4 respectively.
Batteries 06 00049 g002
Figure 3. Cyclic voltammograms of (a) 0.1 M VO2+ in 1 M, 3 M and 5 M H2SO4 and (b) 0.1 M VO2+ in the same acid concentrations on a glassy carbon electrode. All CVs shown were collected at 50 mV/s starting at open circuit potential (ca. 0.55 V) progressing in the anodic direction first. All CVs shown were the 50th scan of each experiment to attain a steady-state CV. Intermediate SOCs (not shown) had a total vanadium concentration of 0.1 M.
Batteries 06 00049 g003
Figure 4. Rate (k0) as a function of state of charge as determined from the CVs using Equation (6).
Batteries 06 00049 g004
Figure 5. (a) VO2+ per sulfonate group in Nafion vs. SOC, (b) VO2+ per sulfonate group in Nafion vs. SOC, (c) total vanadium per sulfonate group in Nafion vs. SOC and (d) vanadium per sulfonate group as a function of H2SO4 concentration for both 0.1M VO2+ and VO2+ (0 and 100 SOC). In all cases, the Nafion had been equilibrated in the appropriate solution then subsequently leeched out of the membrane by soaking in 5% HNO3 and analyzed by EPR. Data in (a) and (b) that indicate “VO2+ absent” and “VO2+ absent” were prepared with the appropriate concentration of each vanadium while omitting the other.
Batteries 06 00049 g005
Figure 6. Permeability of vanadium in Nafion membranes for (a) VO2+, (b) VO2+ and (c) total vanadium as a function of SOC. The total vanadium concentration was 0.1 M.
Batteries 06 00049 g006

