Development of a Capacitance versus Voltage Model for Lithium-Ion Capacitors


1
Univ Lyon, University of Claude Bernard Lyon 1, Ecole Centrale de Lyon, INSA Lyon, CNRS, Ampère, F-69100 Villeurbanne, France
2
LabECAM, ECAM Lyon, Univ Lyon, 40 montée Saint-Barthélémy, F-69005 Lyon, France
*
Author to whom correspondence should be addressed.
Batteries 2020, 6(4), 54; https://0-doi-org.brum.beds.ac.uk/10.3390/batteries6040054
Submission received: 9 July 2020
/
Revised: 2 October 2020
/
Accepted: 30 October 2020
/
Published: 4 November 2020
(This article belongs to the Section Battery Performance, Ageing, Reliability and Safety)
Abstract
:The capacitance of Lithium-ion Capacitors (LiCs) highly depends on their terminal voltage. Previous research found that it varies in a nonlinear manner with respect to the voltage. However, none of them modeled the capacitance evolution while considering the physicochemical phenomena that happen in a LiC cell. This paper focuses on developing a new capacitance model that is based on the Stern model of the electrochemical double layer capacitance. The model accounts for the asymmetric V-shape of the C(V) curve, which reflects the variation of the capacitance with respect to the voltage. The novelty of this study concerns the development of a model for LiCs that relies on the fundamental theory of Stern for the differential capacitance. The basic model of Stern is modified in order to account for the hybrid physicochemical structure of LiCs. Moreover, the model was applied to three aged cells to which accelerated calendar aging tests were applied at three voltage values: 2.2, 3 and 3.8 V. A drift of the voltage corresponding to the minimum capacitance was detected for the aged cells. This voltage is related to the neutral state of the positive electrode. The main cause of this phenomenon concerns the loss of lithium ions from the negative electrode of a LiC. In addition, capacitance values decreased after aging, showing an eventual blocking of the pores of the positive electrode. Therefore, the analysis of the C(V) curve was found to be an interesting tool for the interpretation of aging mechanisms.
1. Introduction
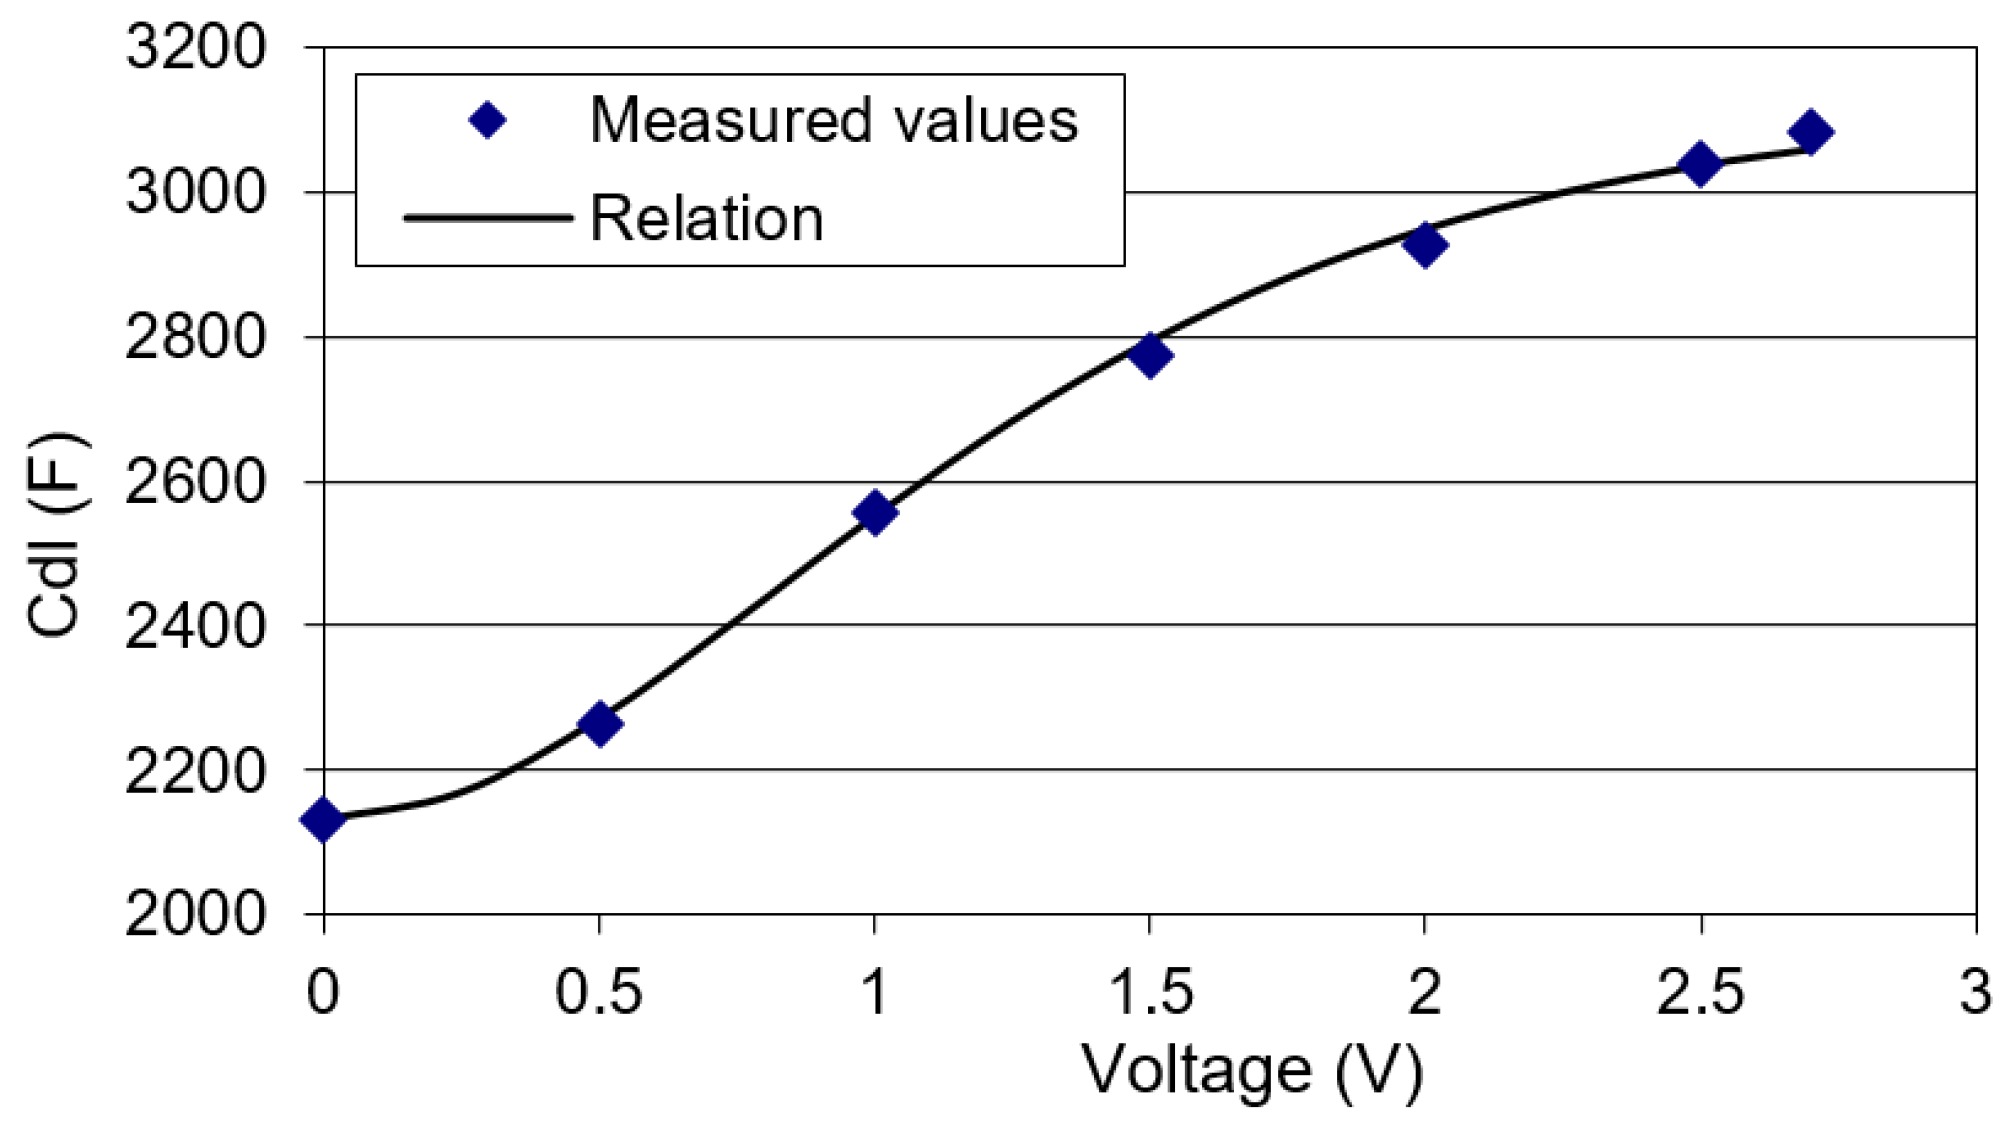
Online monitoring of Energy Storage Systems (ESSs) relies on several tools such as the estimation of the current state of charge and state of health [1,2,3,4]. As a first step towards this goal, the amount of energy stored in the ESS should be assessed. For this reason, capacitance estimation is an important factor to be studied [5,6]. It particularly depends on the operating principle of the ESS. For example, in Supercapacitors (SCs), the storage of energy is based on the formation of an electrochemical double layer at the surface of two activated carbon electrodes [7,8]. This phenomenon induces the creation of the electrochemical double layer capacitance that was discovered and modeled by Helmholtz in 1879. The model was then enhanced by Gouy-Chapman, and finally completed by Stern [9]. Following this research, several models were developed for the capacitance evolution of an activated carbon electrode with respect to the potential of the electrode [10,11,12]. As a result, the capacitance of a SC was found to be increasing with the increase in the voltage of the cell [13], as can be seen in Figure 1. The characteristic curve, C(V), that shows the capacitance evolution of a cell with respect to its terminal voltage is an effective illustration of the properties of the cell.
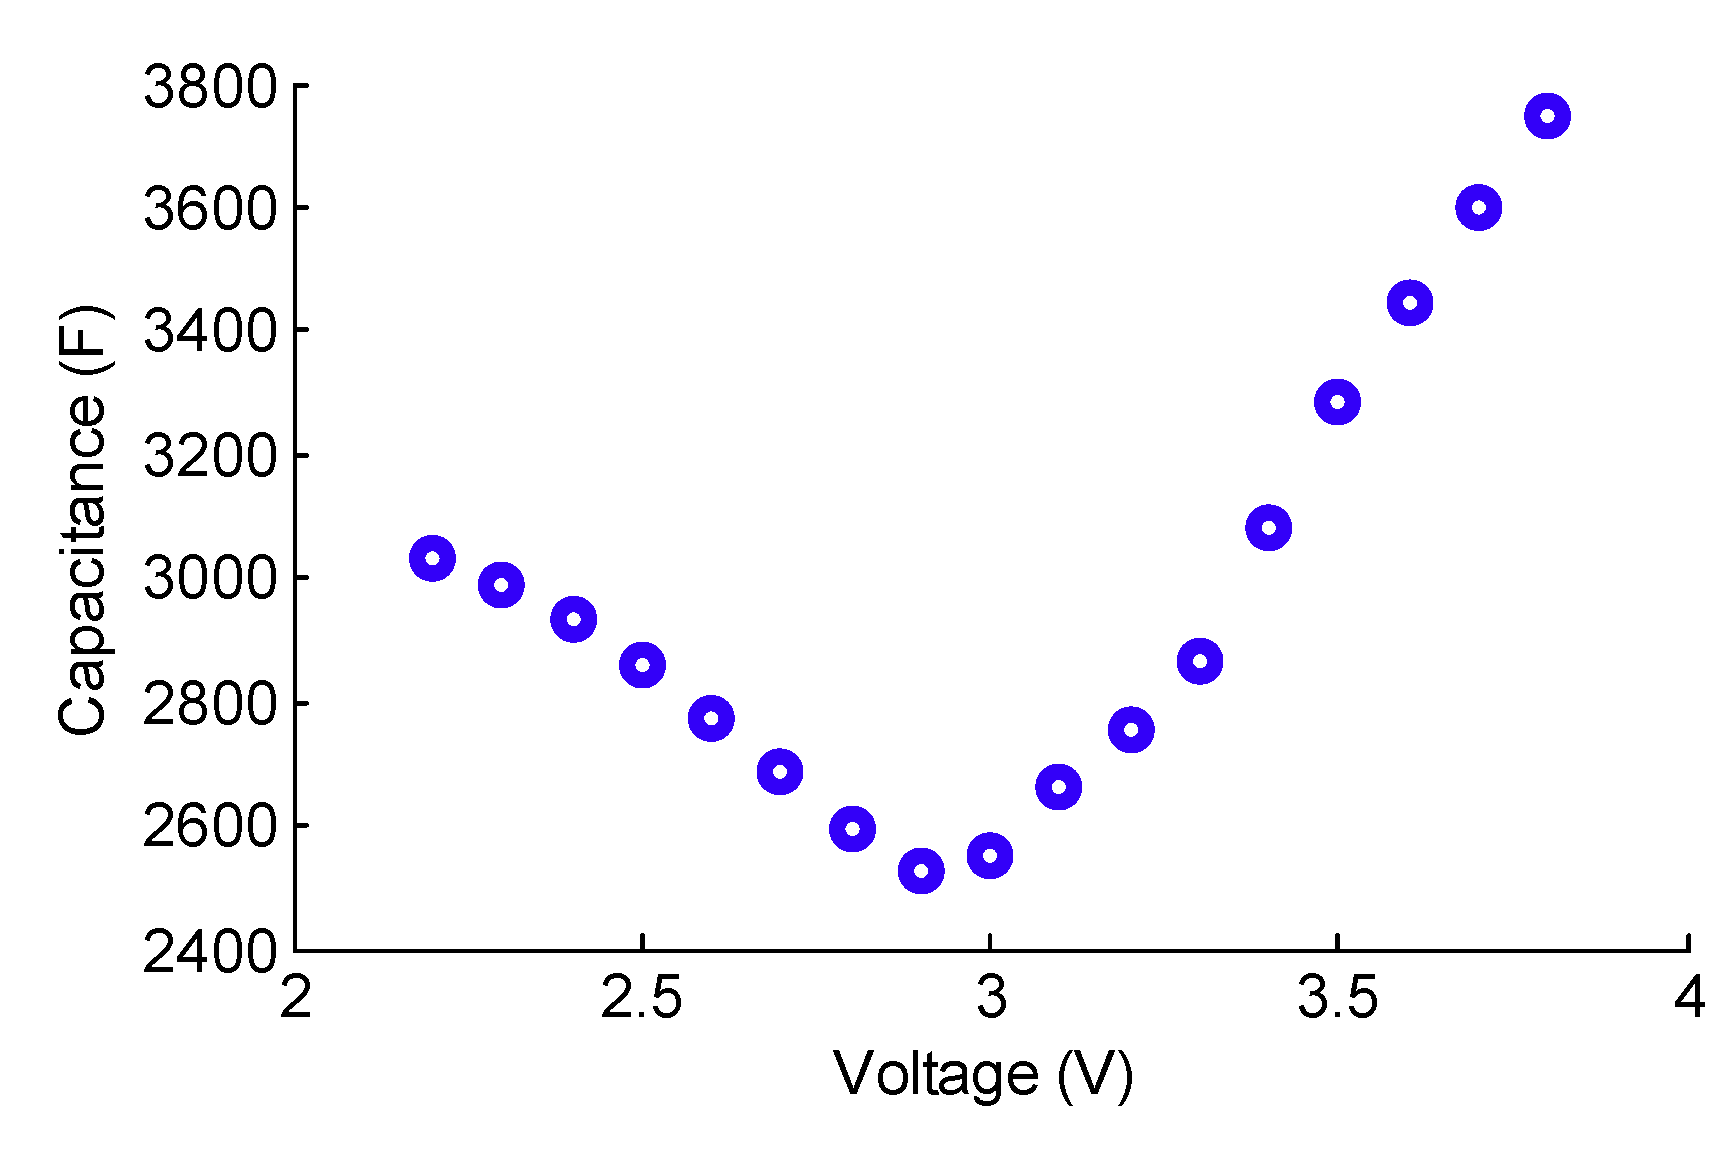
The models previously implemented for conventional SCs cannot be applied to the hybrid technologies of SCs. In fact, asymmetric Lithium-ion Capacitors (LiCs), whose operating principle combines the physicochemical phenomena that exist in conventional SCs and Lithium-ion Batteries (LiBs), have a nonlinear capacitance evolution [14,15] with respect to the voltage. The C(V) curve has an asymmetric V-shape with a minimum at the middle of the nominal voltage window that goes from 2.2 to 3.8 V, as can be seen in Figure 2.
This type of hybrid supercapacitor has the advantage of a higher energy density than that of conventional ones. However, their power density is still low with respect to SCs. Moreover, their energy density is lower than that of lithium-ion batteries.
In [16,17], polynomial curve fitting was used in order to model the C(V) curve of LiCs. Therefore, the developed models did not consider the physicochemical phenomena happening inside the cells. A detailed description of these phenomena, that are responsible for the nonlinear evolution of the capacitance, can be found in [14]. In fact, the capacitance of a LiC mainly depends on the capacitance of the positive electrode made of activated carbon. Therefore, the formation of the double layer at its surface contributes to the increase in the total capacitance of the cell. The minimum capacitance is found to be at 3 V which corresponds to a neutral state of the positive electrode. This neutral voltage value of the cell depends on the level of pre-lithiation of the negative electrode made of graphite [18,19]. In the tested LiCs, the pre-lithiation is done using a sacrificial lithium electrode that is short-circuited with the negative electrode. When the cell is charged from 3 to 3.8 V, the capacitance increases due to the double layer formed by the anions present in the electrolyte and the positive electronic charges present at the surface of the positive electrode. However, when the cell is discharged from 3 to 2.2 V, the capacitance increases due to the formation of the double layer by the cations of the electrolyte and the negative electronic charges at the surface of the positive electrode [14,15].
Throughout the lifetime of a LiC, several aging mechanisms may arise. One major mechanism is the loss of lithium ions that are pre-intercalated in the graphite negative electrode [3,20,21,22,23,24,25,26]. Consequently, the potentials of both electrodes derive due to aging and the neutral voltage value changes. Moreover, the capacitance of the LiC decreases, demonstrating less ability to store energy [3,24]. Therefore, the C(V) curve would be highly affected by the aging of the LiC cell. This is not yet studied in the literature.
Since the C(V) curve can illustrate the physicochemical states of the components of LiC cells, it is interesting to find a model that is able to provide insights on both electrodes. Therefore, based on a previous research paper that presented several accelerated aging tests applied to LiCs [24], the aim of the current study is to develop a capacitance model that can be valuable throughout their aging cycle. Section 2 will present the conventional model of the double layer capacitance and the modified one that is developed to fit the behavior of LiCs. The effects of aging on the C(V) curve will be then discussed in Section 3 and Section 4.
2. Capacitance Model
An electrochemical double layer is formed when ions in the electrolyte accumulate at the surface of an electrode, facing the opposite electronic charges. The first and simplest model of the double layer was created by Helmholtz [27]. The model assumes that the electrode maintains a density of electrons in excess or deficit on its surface. Its charge is then balanced by redistributing the ions in the electrolyte solution with an equal number of ions but having an opposite charge. This results in two layers of opposite charges separated by a distance d, limited by the diameter of the attracted ions with their eventual solvation layer. The double layer capacitance model developed by Helmholtz is expressed by the following equation [27]:
where is the dielectric permittivity of the solvent and S is the surface of the interface between the electrode and the electrolyte. However, this model does not take into account the dependence of the measured capacitance on the potential or the concentration of the electrolyte. Another disadvantage is not considering the interactions that occur far from the distance d of the compact double layer. As a result, several modifications were made to the original model.
2.1. Gouy-Chapman and Stern Model
Gouy and Chapman [10,11] were the first to consider the thermal movement of ions near a charged surface. They imagined a diffuse double layer formed by ions and counterions. Therefore, the surface attracts ions and repels counterions according to the Poisson-Boltzmann (PB) equation. The diffuse capacitance model is represented by the following equation [28]:
where is the valence of the ions, is the concentration of the anions or cations in the solution, is the elementary charge, is the surface potential between the electrode and the electrolyte and is the thermodynamic potential. This capacitance model highly depends on the potential of the electrode and has a parabolic V-shape, symmetrical with respect to a neutral potential that defines the potential of the electrode when no ion is adsorbed at its surface [29]. The neutral potential of the electrode is often denoted as (potential of zero charge). When the potential of the electrode decreases and therefore becomes lower than , the cations accumulate on the surface of the electrode. On another hand, when its potential increases and becomes higher than , the anions accumulate on its surface. However, the approach of Gouy-Chapman does not include the size of the ions. It considers them as statistical points without possible attributes for a physical dimension. Therefore, capacitance values are generally over estimated, especially for electrolytes having a low concentration of ions. Equation (2) can also be expressed by this equation:
where, and .
describes the following potential difference:
where is the potential of the electrode. is a symmetric curve with respect to .
In 1924, Stern [12] developed the theory of the electric double layer in a more realistic manner by describing the physical situation at the interface. He combined the two previous models by considering the compact layer, used by Helmholtz, next to the diffuse layer of Gouy-Chapman that is usually extended in the electrolyte. He took into account the size of the ions, considering that the capacitance of the compact layer varies with respect to their radius. The differential capacitance of the double layer is then equivalent to the one of two capacitors in series:
In this case, the C(V) curve has a symmetric V-shape and converges at high potentials to the value of [29].
2.2. Modified Stern Model
According to the operating principle of a LiC, its total capacitance is mainly influenced by that of its positive electrode [14]. The storage of energy at the positive electrode of activated carbon is based on the formation of the electric double layer. Therefore, the models of this layer can be used to describe the capacitance of the LiC. However, since three-electrode measurement techniques are not suitable for the current study, the potential of the positive electrode cannot be followed separately. Therefore, of Equation (4) is considered as the voltage of the cell when the capacitance is at its minimum (3 V as per Figure 2) and as the total voltage of the cell.
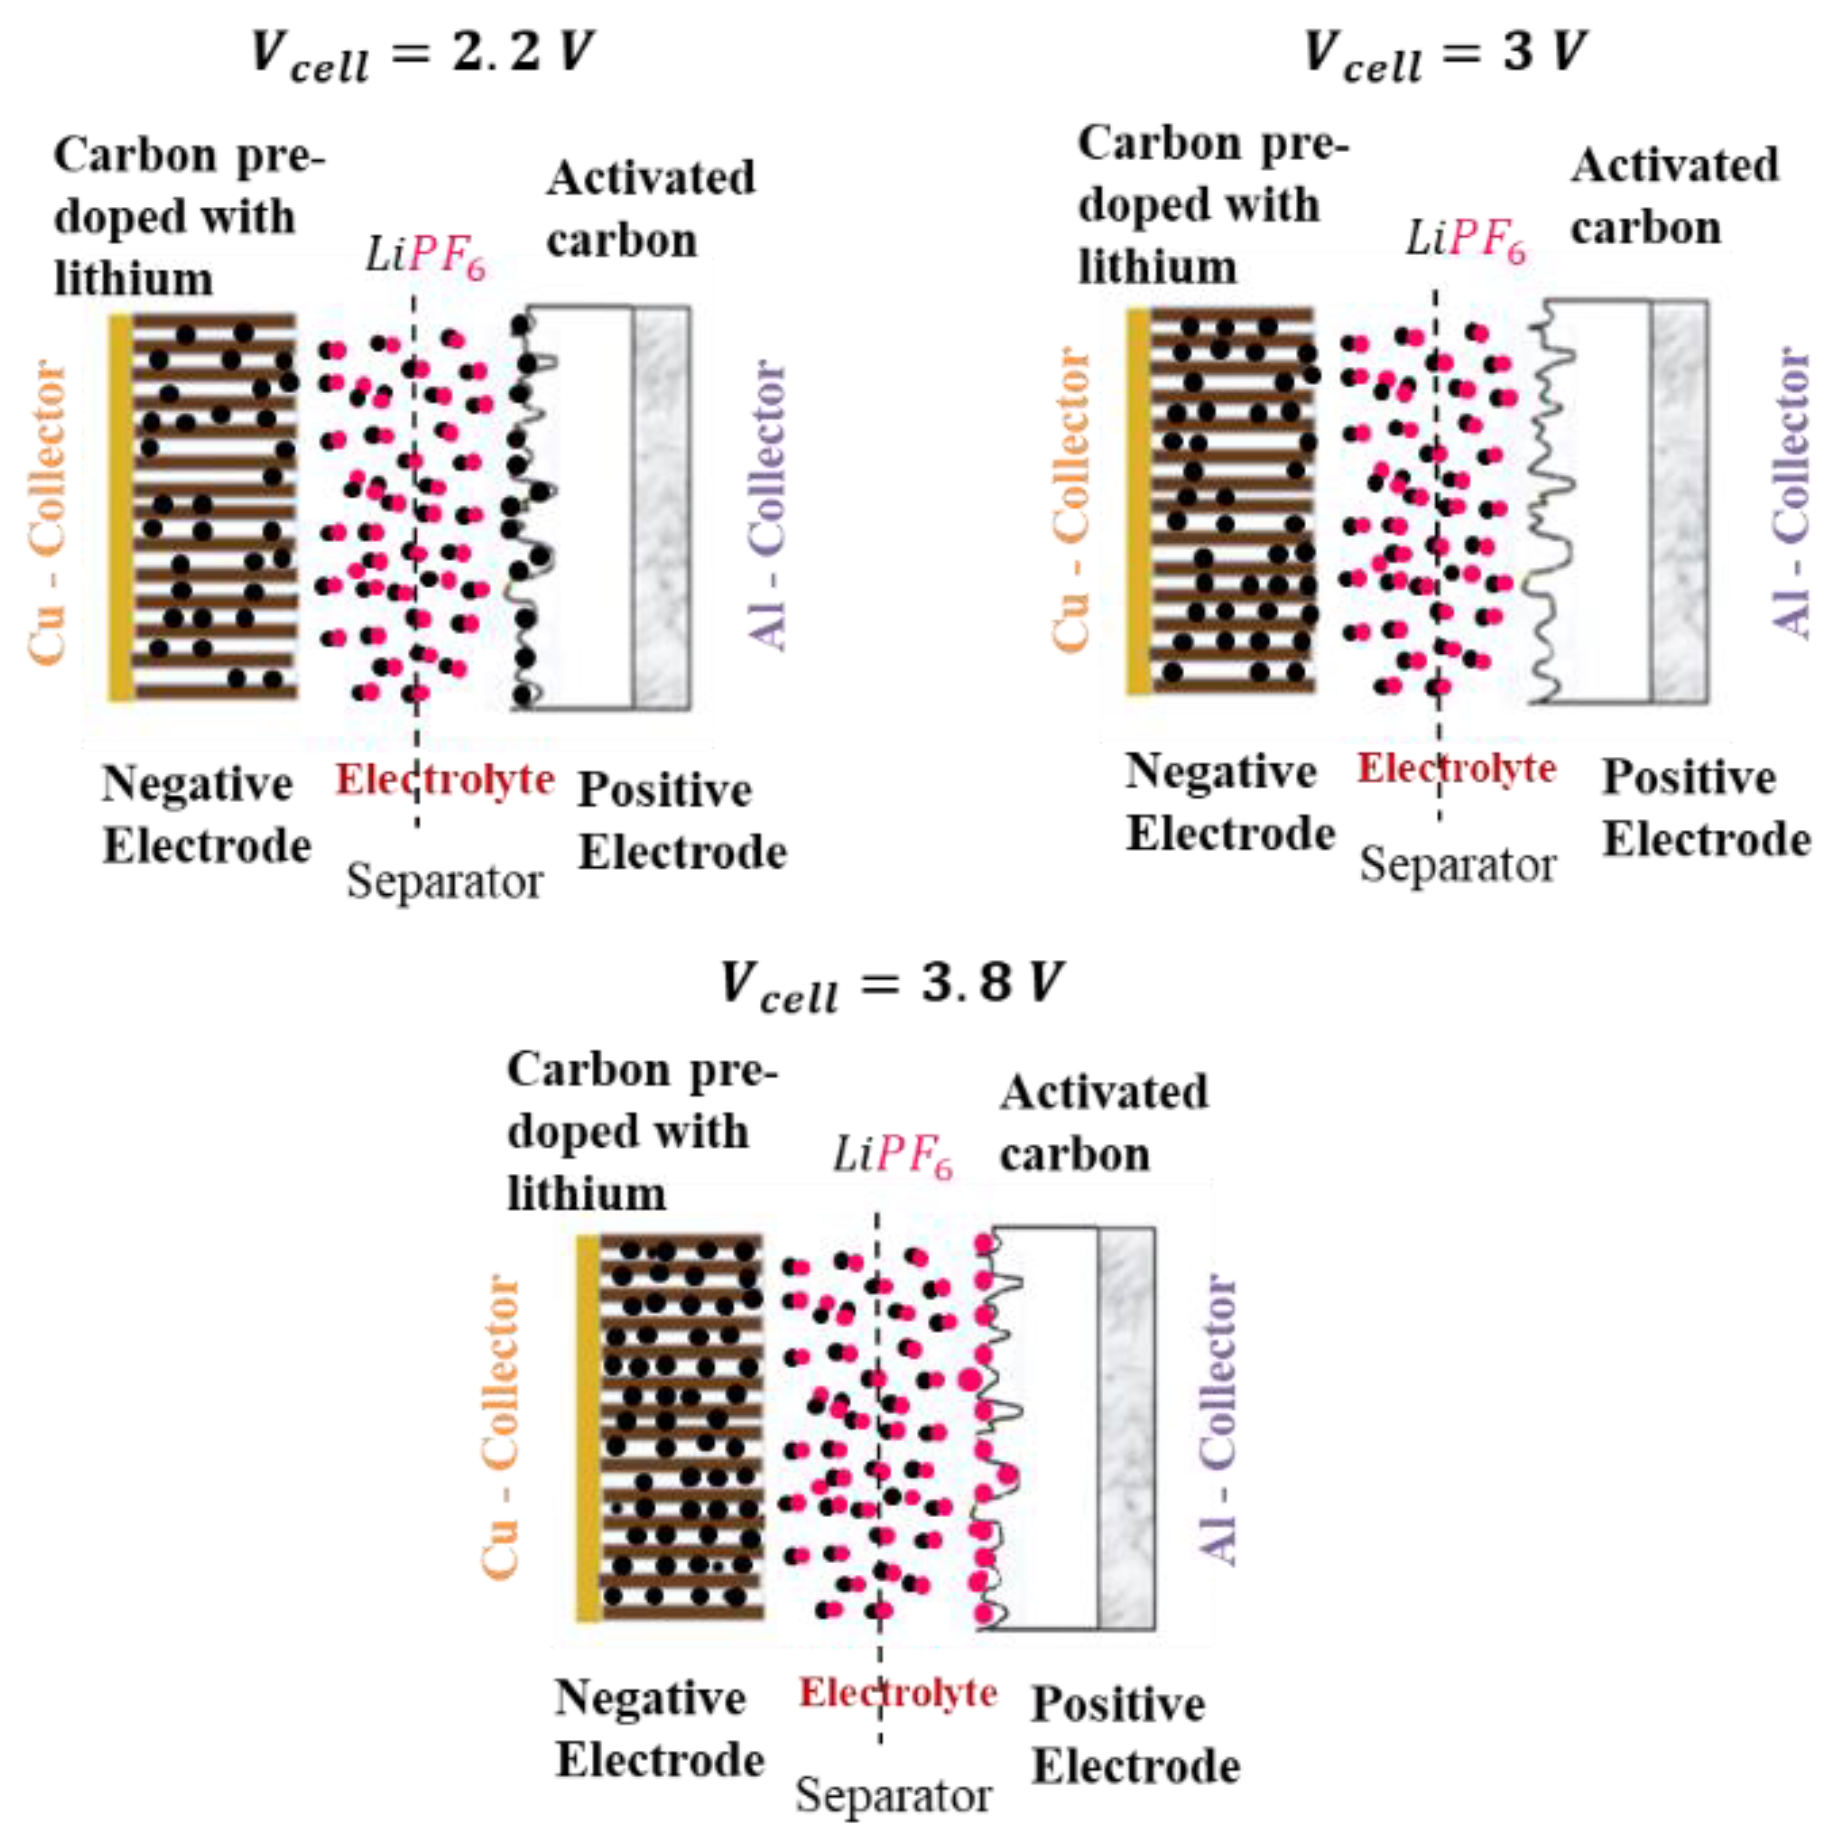
The symmetric C(V) curve of the previous models does not fit the evolution of the capacitance of a LiC that is shown in Figure 2. In fact, when is negative (), the double layer is formed by the cations and the negative electronic charges on the surface of the activated carbon. For example, at the lowest voltage value of a LiC, 2.2 V, the cations Li+ accumulate at the surface of the positive electrode, as can be seen in Figure 3 [24]. When is positive (), the double layer is formed by the anions and the positive electronic charges on the surface of the activated carbon. In fact, at the highest voltage value of a LiC, 3.8 V, the anions accumulate at the surface of the positive electrode (Figure 3).
A symmetrical curve considers a unique and identical size of positive and negative ions. In order to include the effect of the size of the ions on the value of the capacitance, knowing that in a LiC the cations Li+ have a larger size than the anions [30,31], an asymmetrical curve with respect to ΔV must to be considered. Therefore, the Gouy-Chapman model is modified in this study in order to be able to describe an asymmetric curve with respect to ΔV:
Considering the capacitance of Helmholtz as a constant capacitance () which does not depend on the voltage, the differential capacitance of the electric double layer based on the Stern model of Equation (5) can be expressed by the following equation:
2.3. Validation
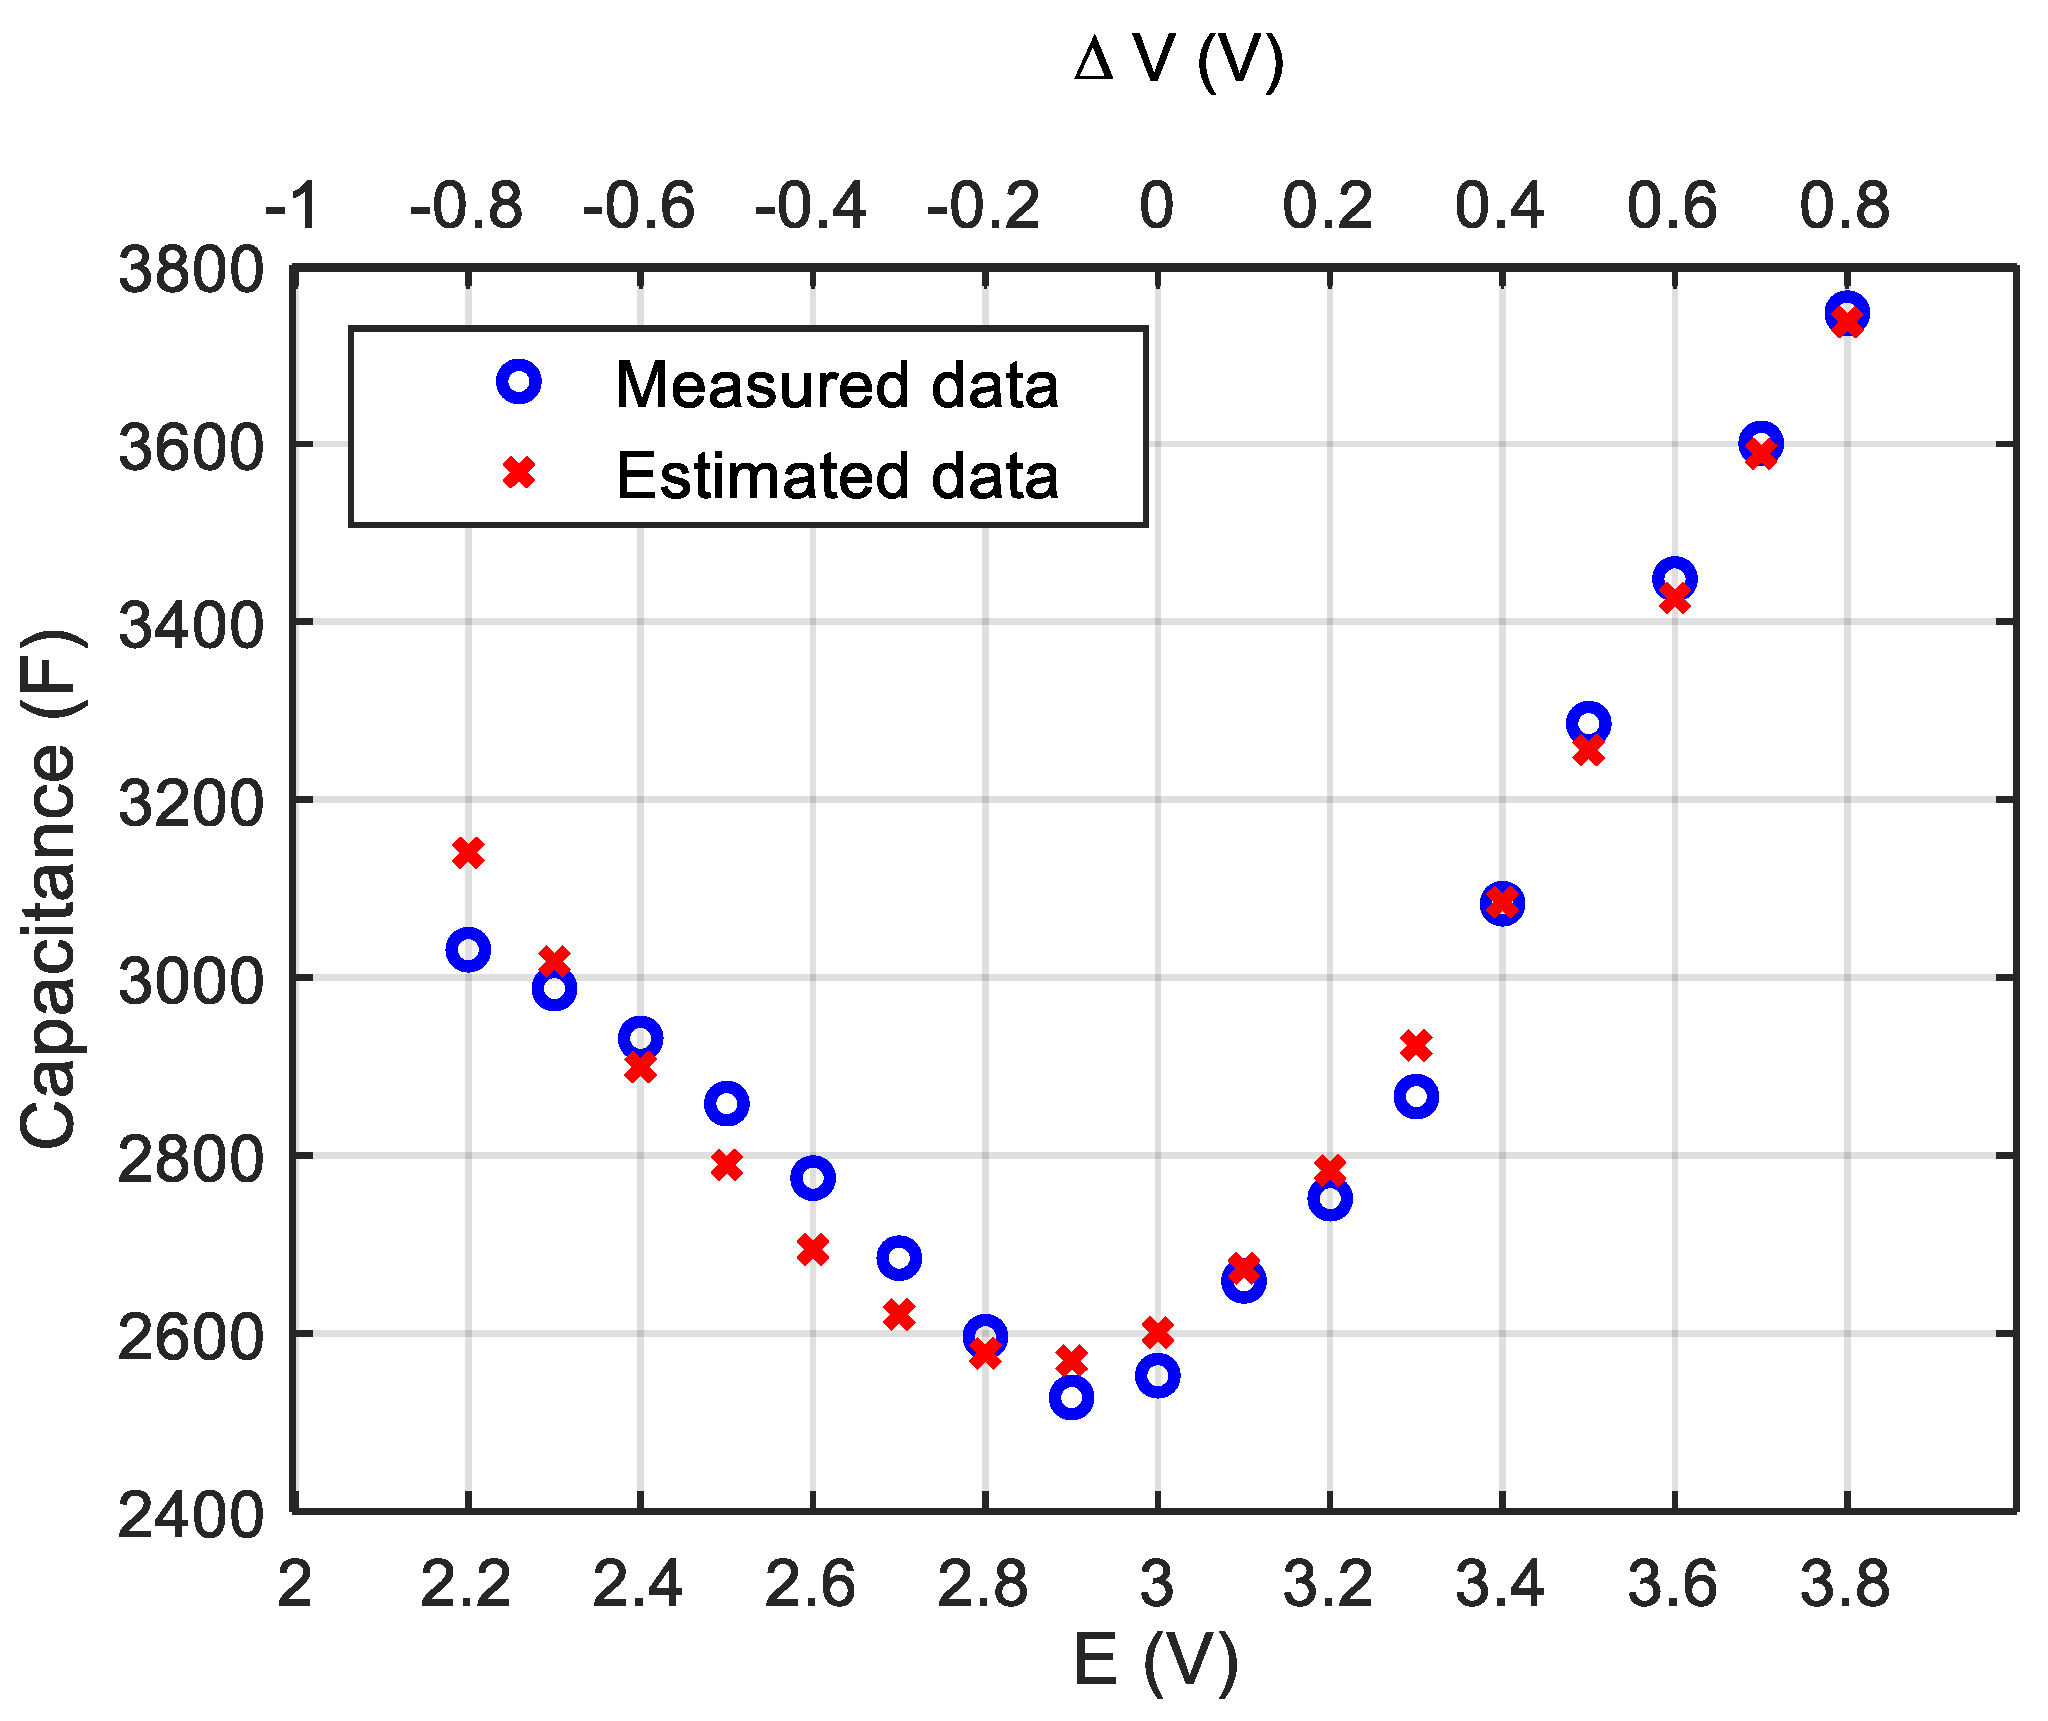
The parameters of Equation (7) are identified by minimizing the mean square error between the model and the data in Figure 2. Table 1 shows the values of the identified parameters. Figure 4 compares the experimental values of the capacitance and the estimated ones whose prediction method produces an error of 1.3%.
The capacitance of a LiC significantly depends on the voltage. During the charge from 2.2 V to the neutral voltage, 3 V, the capacitance decreases. On the other hand, during the charge from the neutral voltage to 3.8 V, the capacitance increases. The neutral voltage of 3 V of the LiC cell relies on a very low potential of the negative electrode, approximately 0.1 V vs. [18]. The corresponding potential depends on the level of lithiation of the carbon negative electrode. This is the most common configuration of commercial products. Therefore, the modified Stern model can be applied to LiCs made of similar electrodes by adjusting the value of the corresponding neutral voltage.
The potential of the negative electrode may increase due to the loss of pre-intercalated lithium ions in the negative electrode. In this case, the neutral voltage decreases. This phenomenon was found during continuous cycling of a LiC with similar electrodes [18]. The effects of calendar aging on the neutral voltage are not yet studied in the literature. For this reason, the following section will present the effects of calendar aging on the variation of the capacitance with respect to the voltage.
3. Calendar Aging
Accelerated calendar aging tests were applied to LiCs as described in [24]. The aim of these tests was to assess the influence of three voltage values (2.2, 3 and 3.8 V) and two temperatures (60 °C and 70 °C) on the lifetime of LiCs. Float charge was used throughout the aging tests. In order to follow the evolution of the aging process, cell capacitances were measured only at the aging voltage in order to ensure that aging conditions were not modified. For this reason, it was not possible to follow the evolution of the C(V) curve during the tests. However, characterizations were applied to the cells at 25 °C and five voltages (2.2, 2.6, 3, 3.4 and 3.8 V) before and after the aging process. Therefore, the results of these measurements can be compared in order to investigate aging effects on the C(V) curves. Since cells that aged at 60 °C had a similar degradation behavior as the ones that aged at 70 °C but with less pronounced effects [24], only C(V) curves of cells aged at 70 °C will be shown in this paper. Three cells that aged at different voltage values and at 70 °C were chosen to be assessed. The values of their capacitances were extracted from their measured impedances at 100 mHz using electrochemical impedance spectroscopy.
3.1. Calendar Aging at 2.2 V at 70 °C
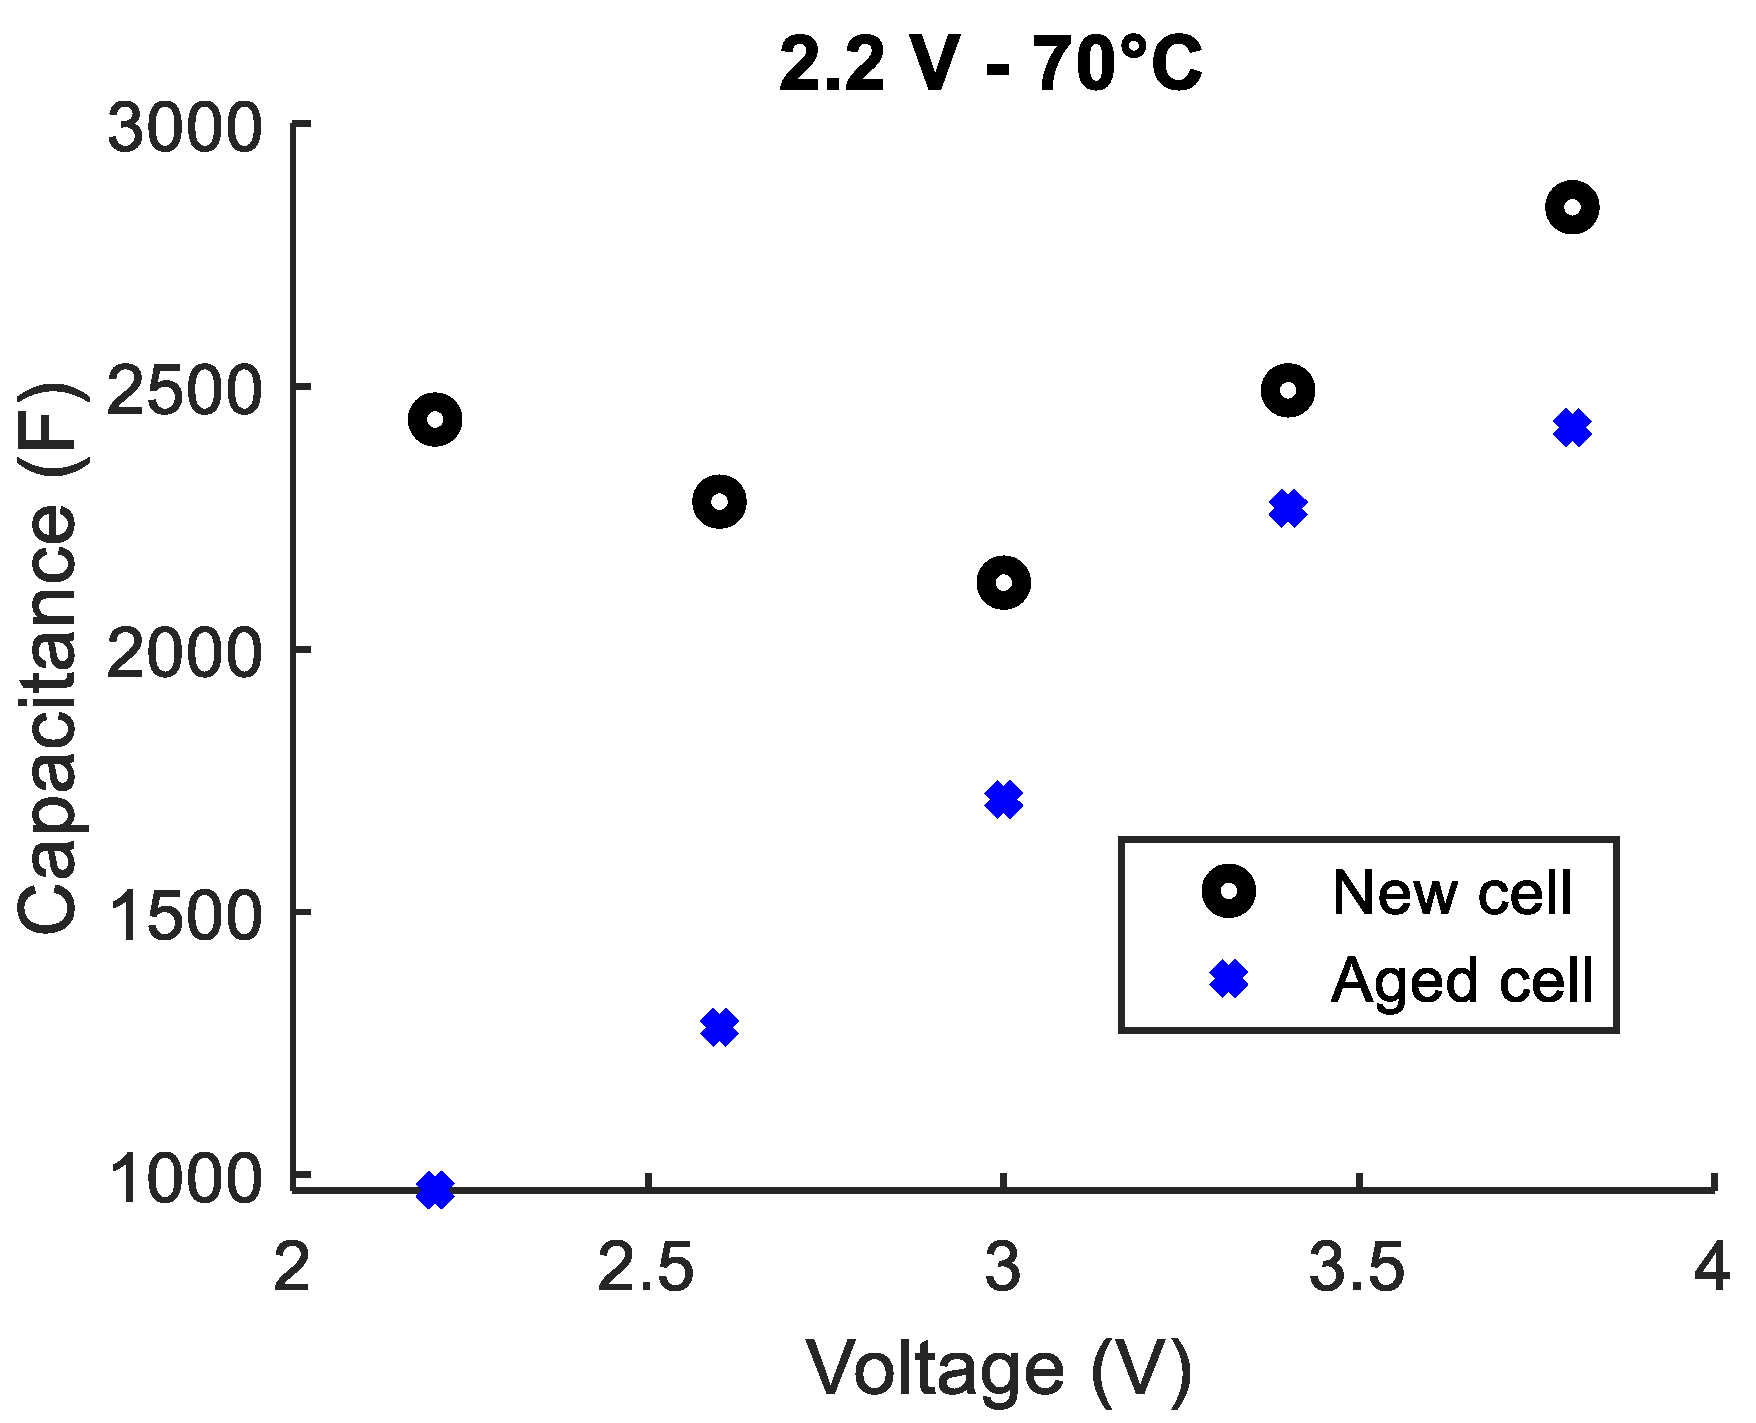
A LiC that aged at 2.2 V and 70 °C for 20 months lost around 55% of its initial capacitance that was measured at the aging conditions (2.2 V and 70 °C). This was confirmed by the final characterizations that showed a 60% decrease in the capacitance that was measured at 2.2 V and 25 °C. Figure 5 compares the C(V) curves extracted from capacitance measurements before and after aging.
Before aging, the C(V) curve has an asymmetrical V-shape with a minimum at 3 V. On the other hand, after aging, the capacitance increases with the increase in the voltage from 2.2 to 3.8 V. The voltage corresponding to the minimum capacitance derives from 3 V to less than 2.2 V. Since the cell cannot be discharged below the minimum nominal voltage of 2.2 V, the eventual rise of the capacitance for voltages below 2.2 V cannot be detected. Therefore, one can conclude that the potential of the negative electrode increased with aging. This is directly related to the loss of lithium ions, which is commonly attributed to the growth of the SEI (Solid Electrolyte Interface) layer on the surface of the negative electrode. However, according to aging mechanisms that were deduced in [24], the functional groups present on the surface of the positive electrode of the cells aged at 2.2 V may irreversibly adsorb the cations. This causes the potential of the positive electrode to drift towards higher potentials [22]. Therefore, in order to maintain a voltage of 2.2 V throughout the test period, additional ions must be deintercalated from the negative electrode to accumulate on the surface of the positive electrode. In this case, the main cause of lithium ions loss from the negative electrode can be associated with the aging mechanisms that occur at the positive electrode [24].
Considering the new variation of the capacitance with respect to the voltage, the storage of the energy during the charge from 2.2 to 3.8 V seems to depend only on the accumulation of the anions on the surface of the positive electrode and the intercalation of the cations in the negative electrode. The accumulation of ions at the surface of the positive electrode that happens during the charge of a new cell from 2.2 to 3 V no longer occurs due to the potential drifts of both electrodes.
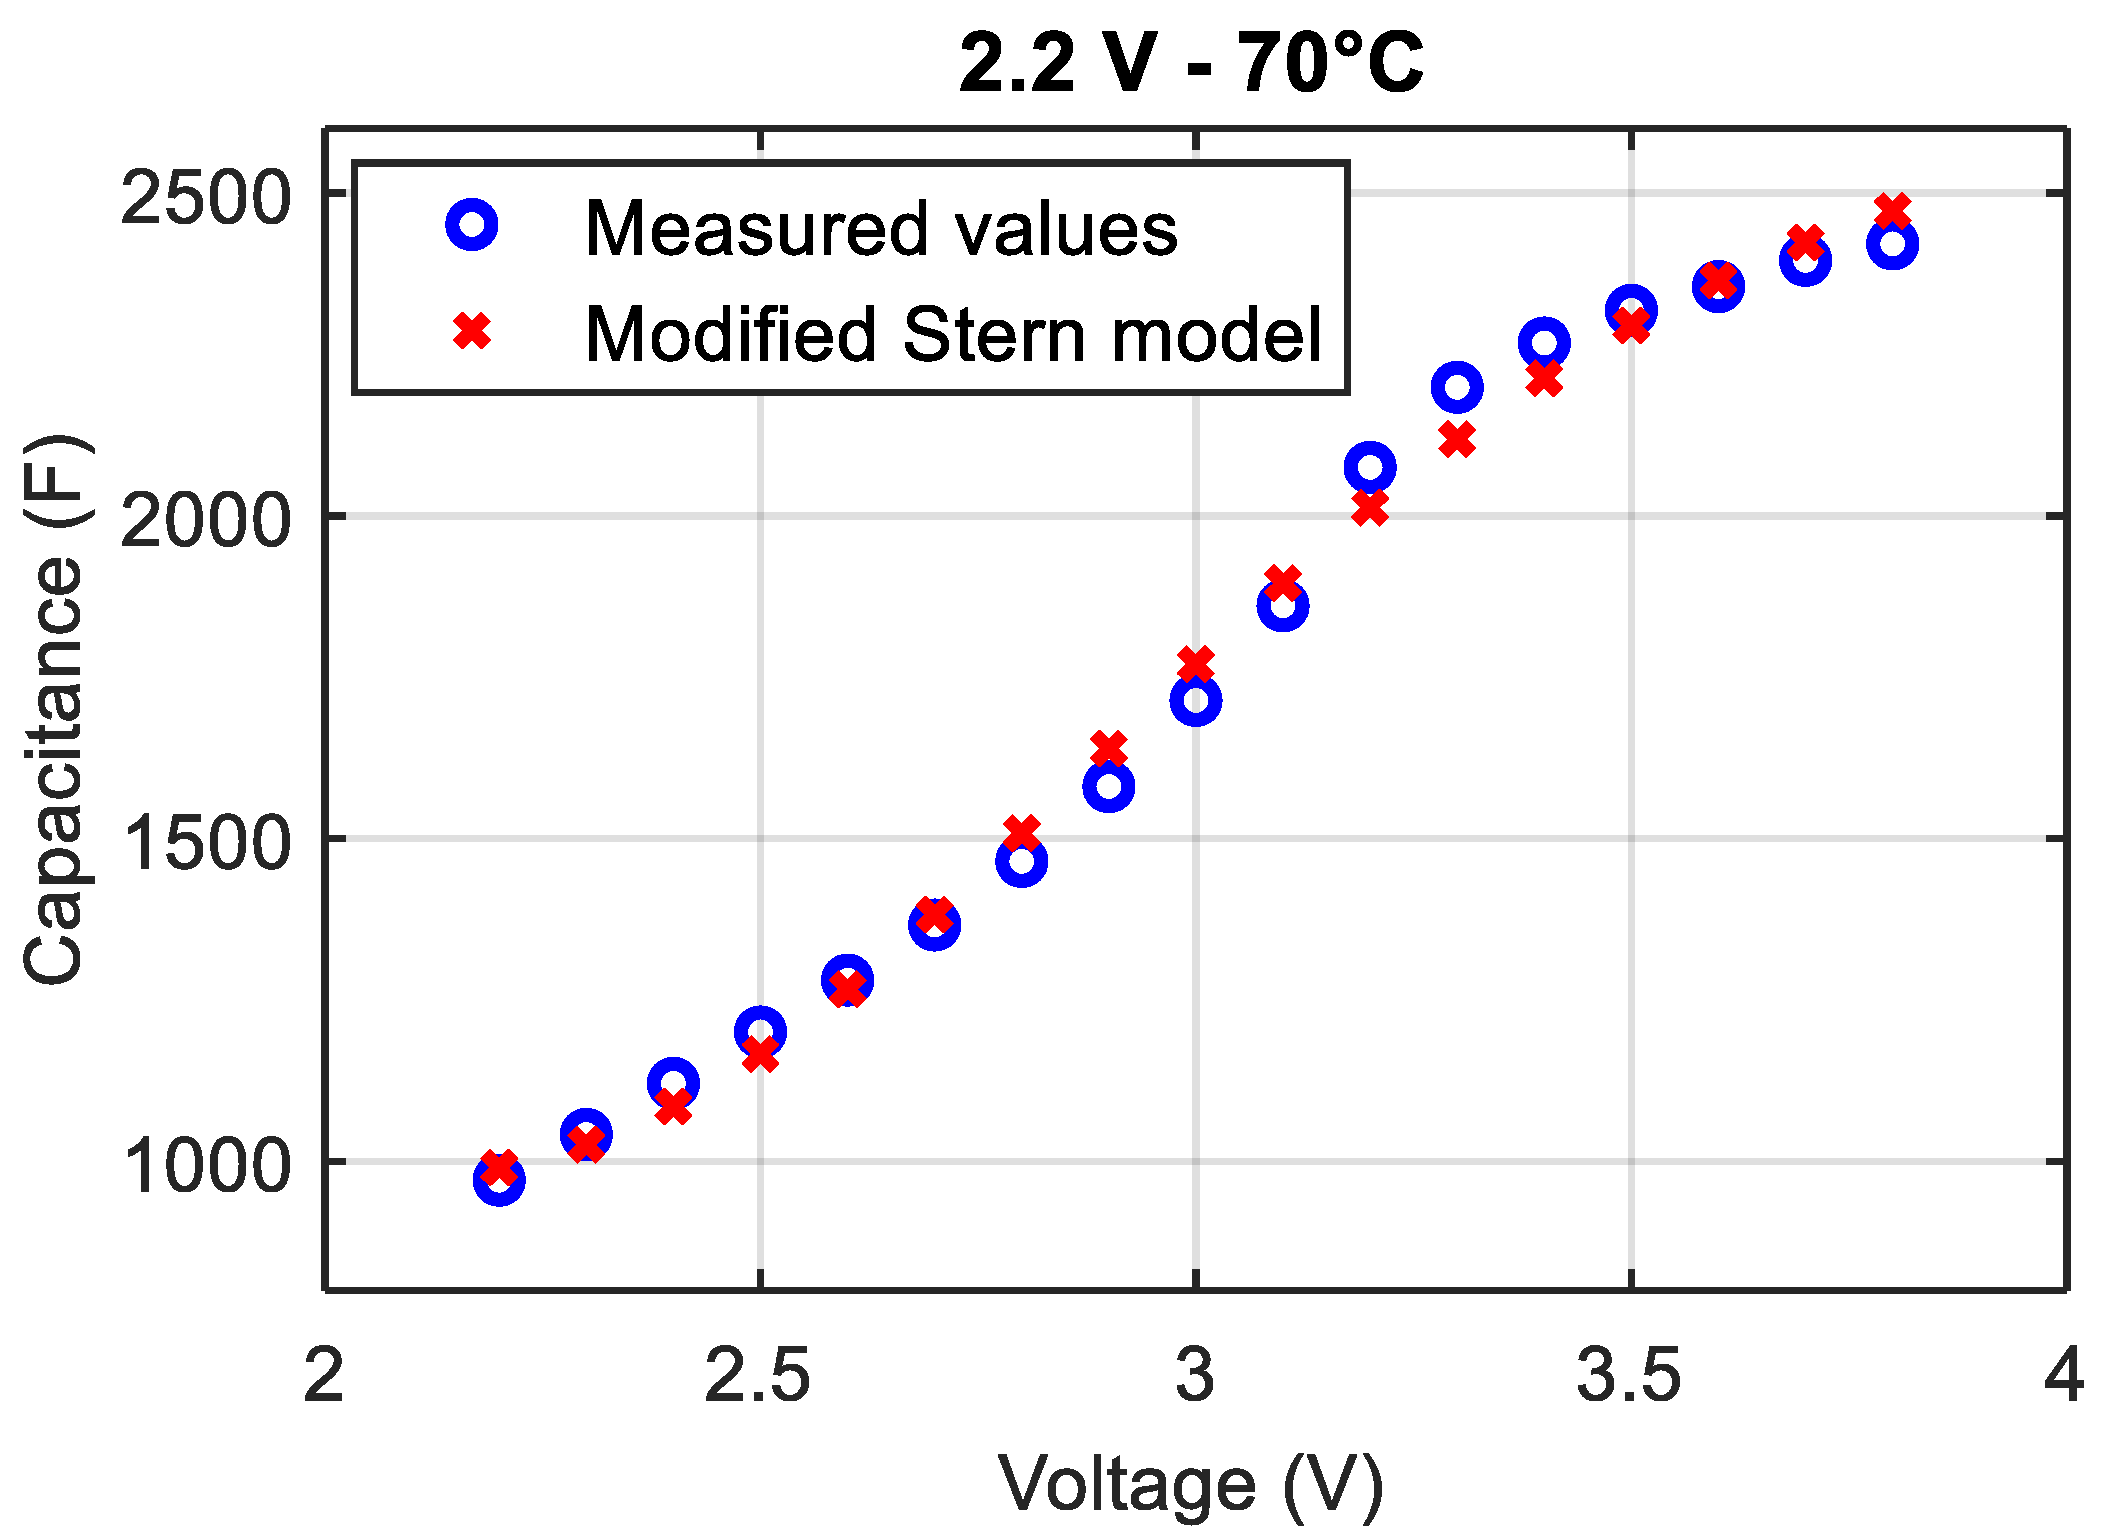
In order to confirm this new evolution of the capacitance with respect to the voltage, additional measurements were done for 17 potentials, ranging from 2.2 to 3.8 V with a step of 0.1 V. The model of the differential capacitance of Equation (7) was then applied to these data assuming that is equal to 2.2 V (Equation (4)). The new evolution of the capacitance as a function of the voltage is shown in Figure 6.
Table 2 combines the identified parameters of the modified Stern model before and after aging. The capacitance related to the diffuse layer decreases much more than the capacitance related to the compact layer of Helmholtz. Recalling Equations (2) and (3), depends on the concentration of the anions or cations in the solution, the surface potential between the electrode and the electrolyte and the thermodynamic potential. Therefore, the decrease in shows possible damages at the interface between the electrode and the electrolyte and in the electrolyte of the LiC cells.
3.2. Calendar Aging at 3 V at 70 °C
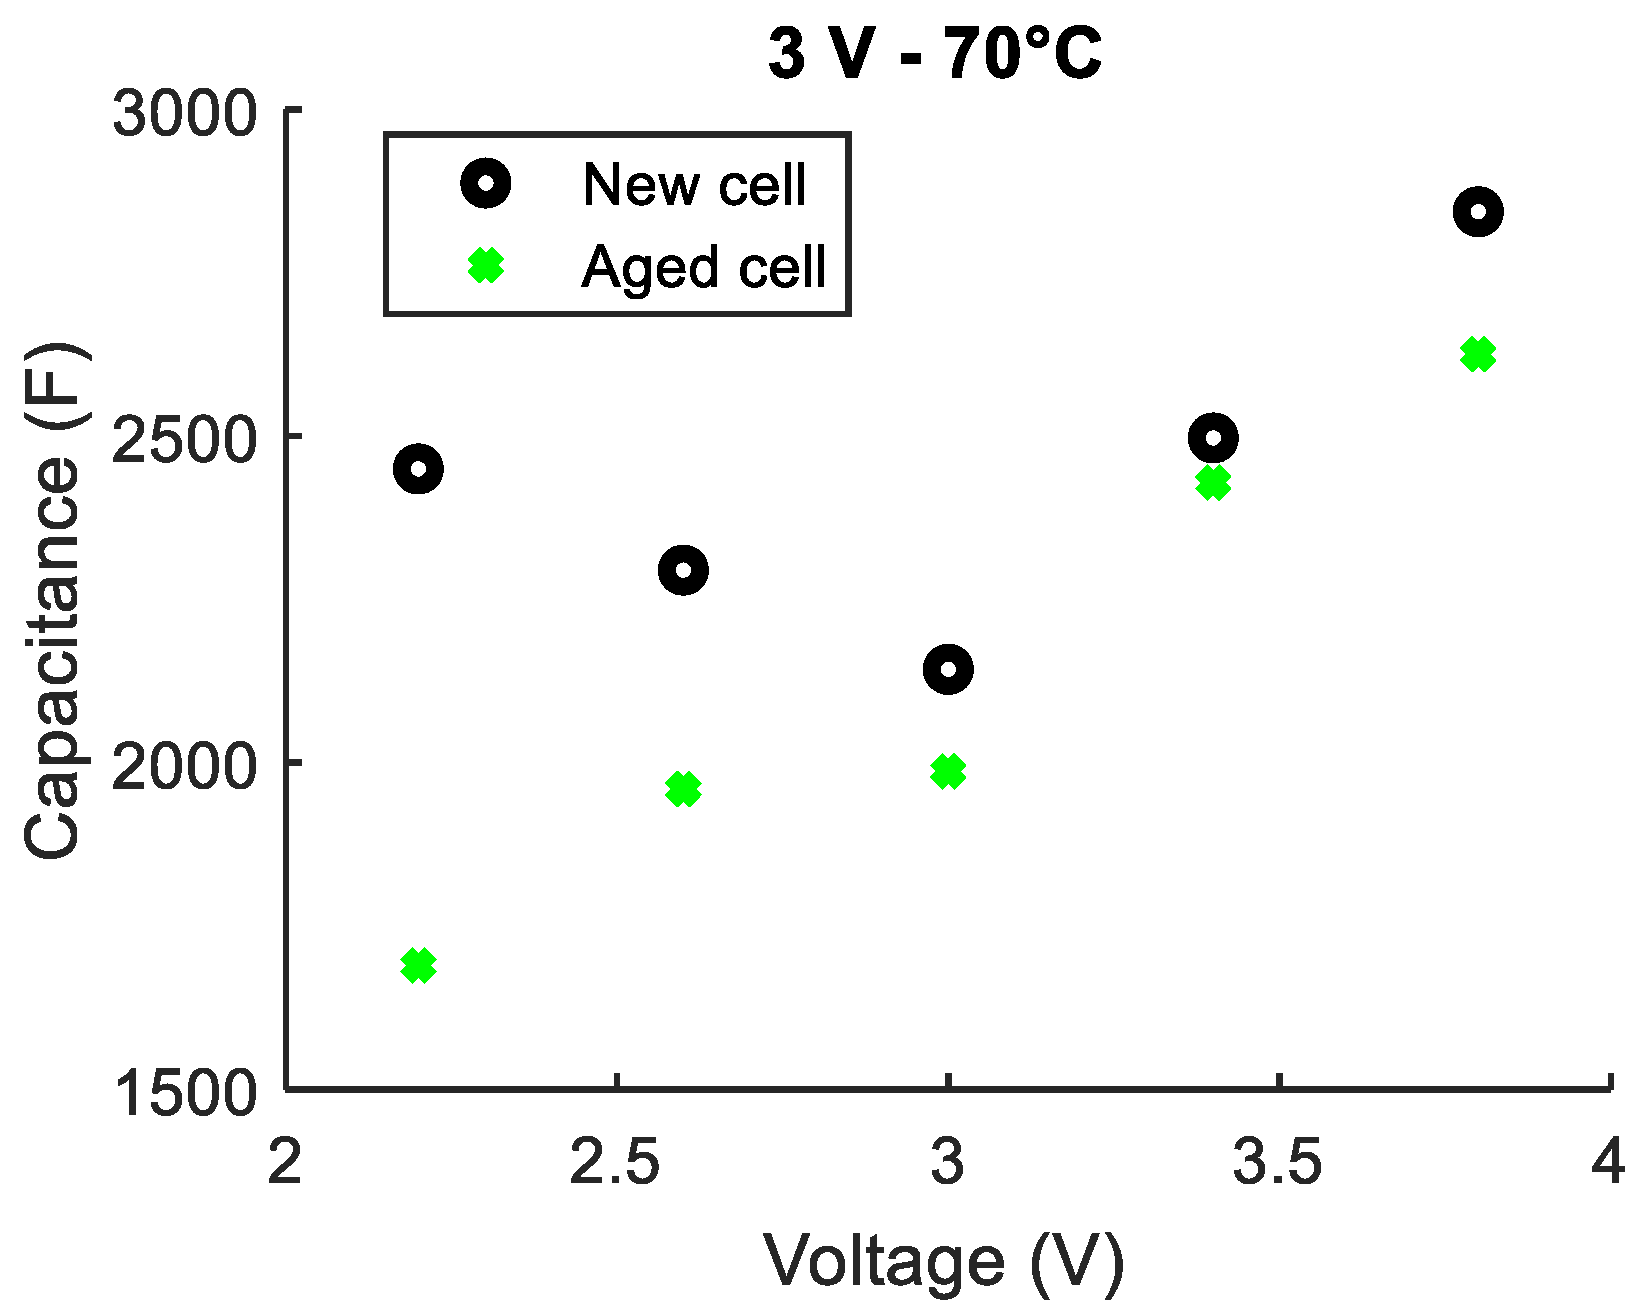
A second LiC that aged at 3 V and 70 °C for 20 months lost 7% of its initial capacitance that was measured under the corresponding aging conditions (3 V and 70 °C). The same percentage decrease in the capacitance was found by the final characterizations at a temperature of 25 °C. Figure 7 illustrates a comparison between the capacitances extracted from the initial and final characterizations done at 25 °C and at five different voltages.
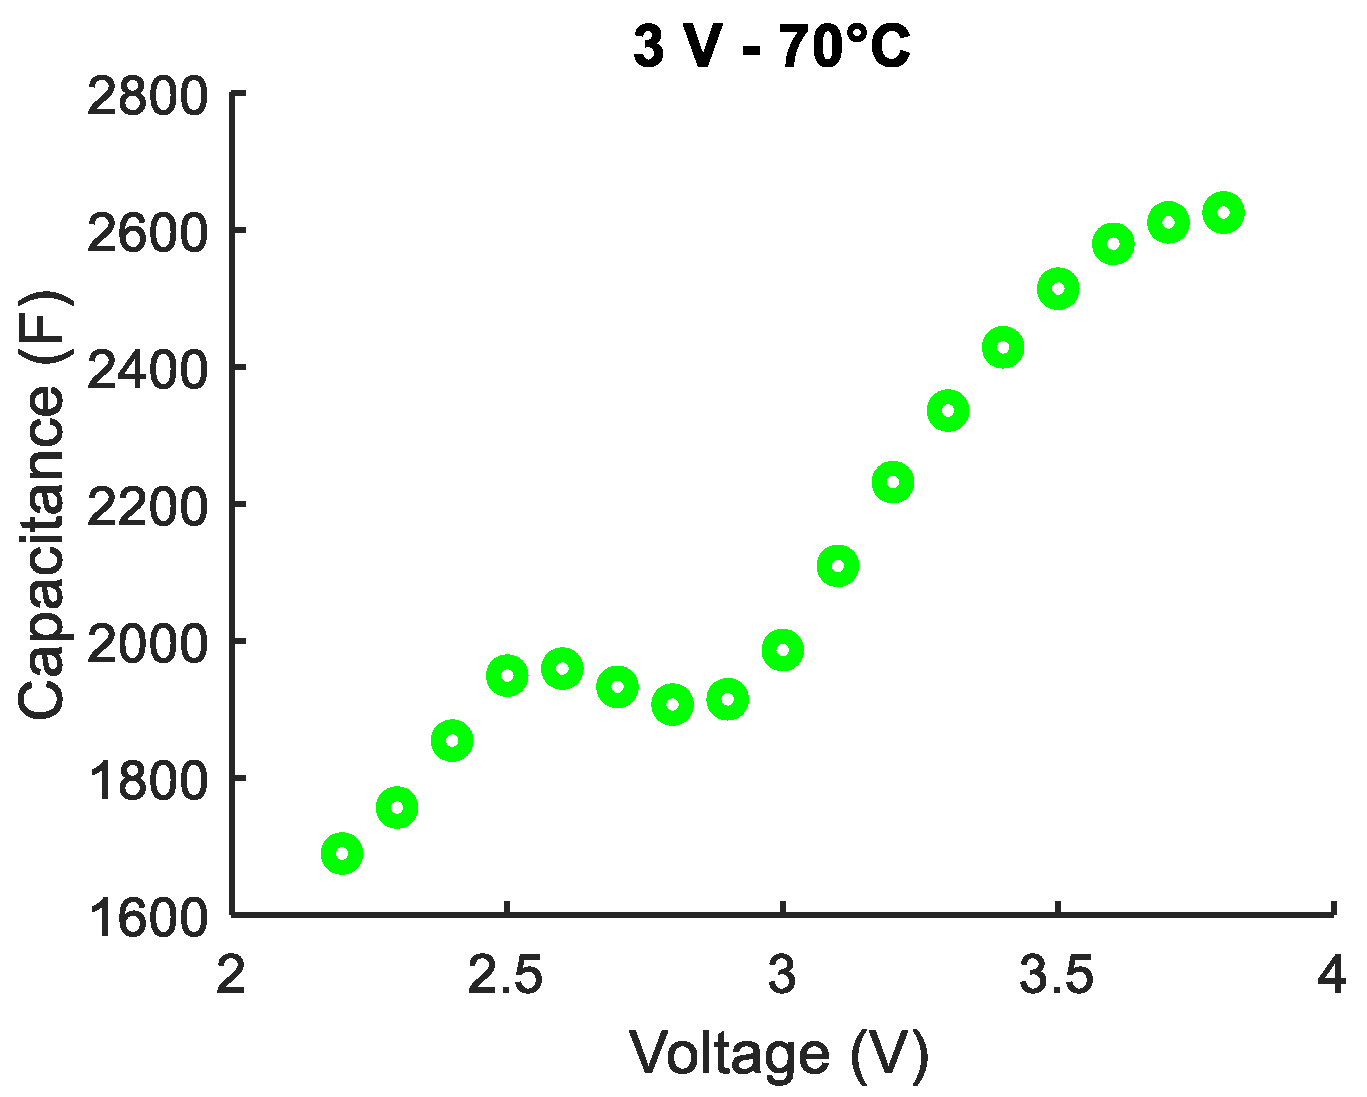
The usual shape of the C(V) curve is no longer detected after the accelerated aging at 3 V. In the first voltage window from 2.2 to 3 V, the capacitance decreases the most. In order to further interpret the mechanisms involved at the different voltage values, impedance measurements were carried out for 17 potentials, as previously described. The subsequent capacitances are shown in Figure 8.
The capacitance does not increase in a monotonous way with the increase in the voltage. In fact, from 2.2 to 2.6 V, the capacitance increases with voltage rise, then decreases to 2.8 V and then increases again from 2.8 to 3.8 V. According to the literature [32], when the ions approach a surface subjected to a voltage that exceeds a threshold voltage, steric overcrowding of ions can occur. A sufficiently large electric field can attract a large number of ions, creating a concentrated solution in the diffuse layer [32]. Ionic overcrowding against the surface develops the diffuse double layer and thus decreases the differential capacitance. The positive electrode could therefore suffer from the blocking of its pores since they no longer seem to accept the same number of ions as before aging. As can be seen in Figure 8, the saturation phenomenon starts at a threshold voltage of 2.6 V. In addition, the voltage of 3 V, which corresponds to the minimum value of the capacitance before aging, shifts to 2.8 V after aging. This is certainly due to the growth in the SEI layer at the negative electrode and the resulting slight drift of its potential. Unlike the cell that aged at 2.2 V, the positive electrode of cells aging at 3 V is close to the neutral state. This eliminates the possibility of relating the loss of lithium ions from the negative electrode to the aging mechanisms of the positive electrode.
The operating principle of the LiC is then modified. From 2.2 to 2.8 V, the Li+ cations leave the surface of the positive electrode and intercalate in the carbon layers of the negative electrode. From 2.8 to 3.8 V, the anions , present in the electrolyte, accumulate at the surface of the positive electrode while the Li+ cations of the electrolyte intercalate in the negative electrode. Since the capacitance model based on Stern model does not take into account the saturation phenomenon, it can no longer be applied to cells that aged at this voltage value of 3 V.
3.3. Calendar Aging at 3.8 V at 70 °C
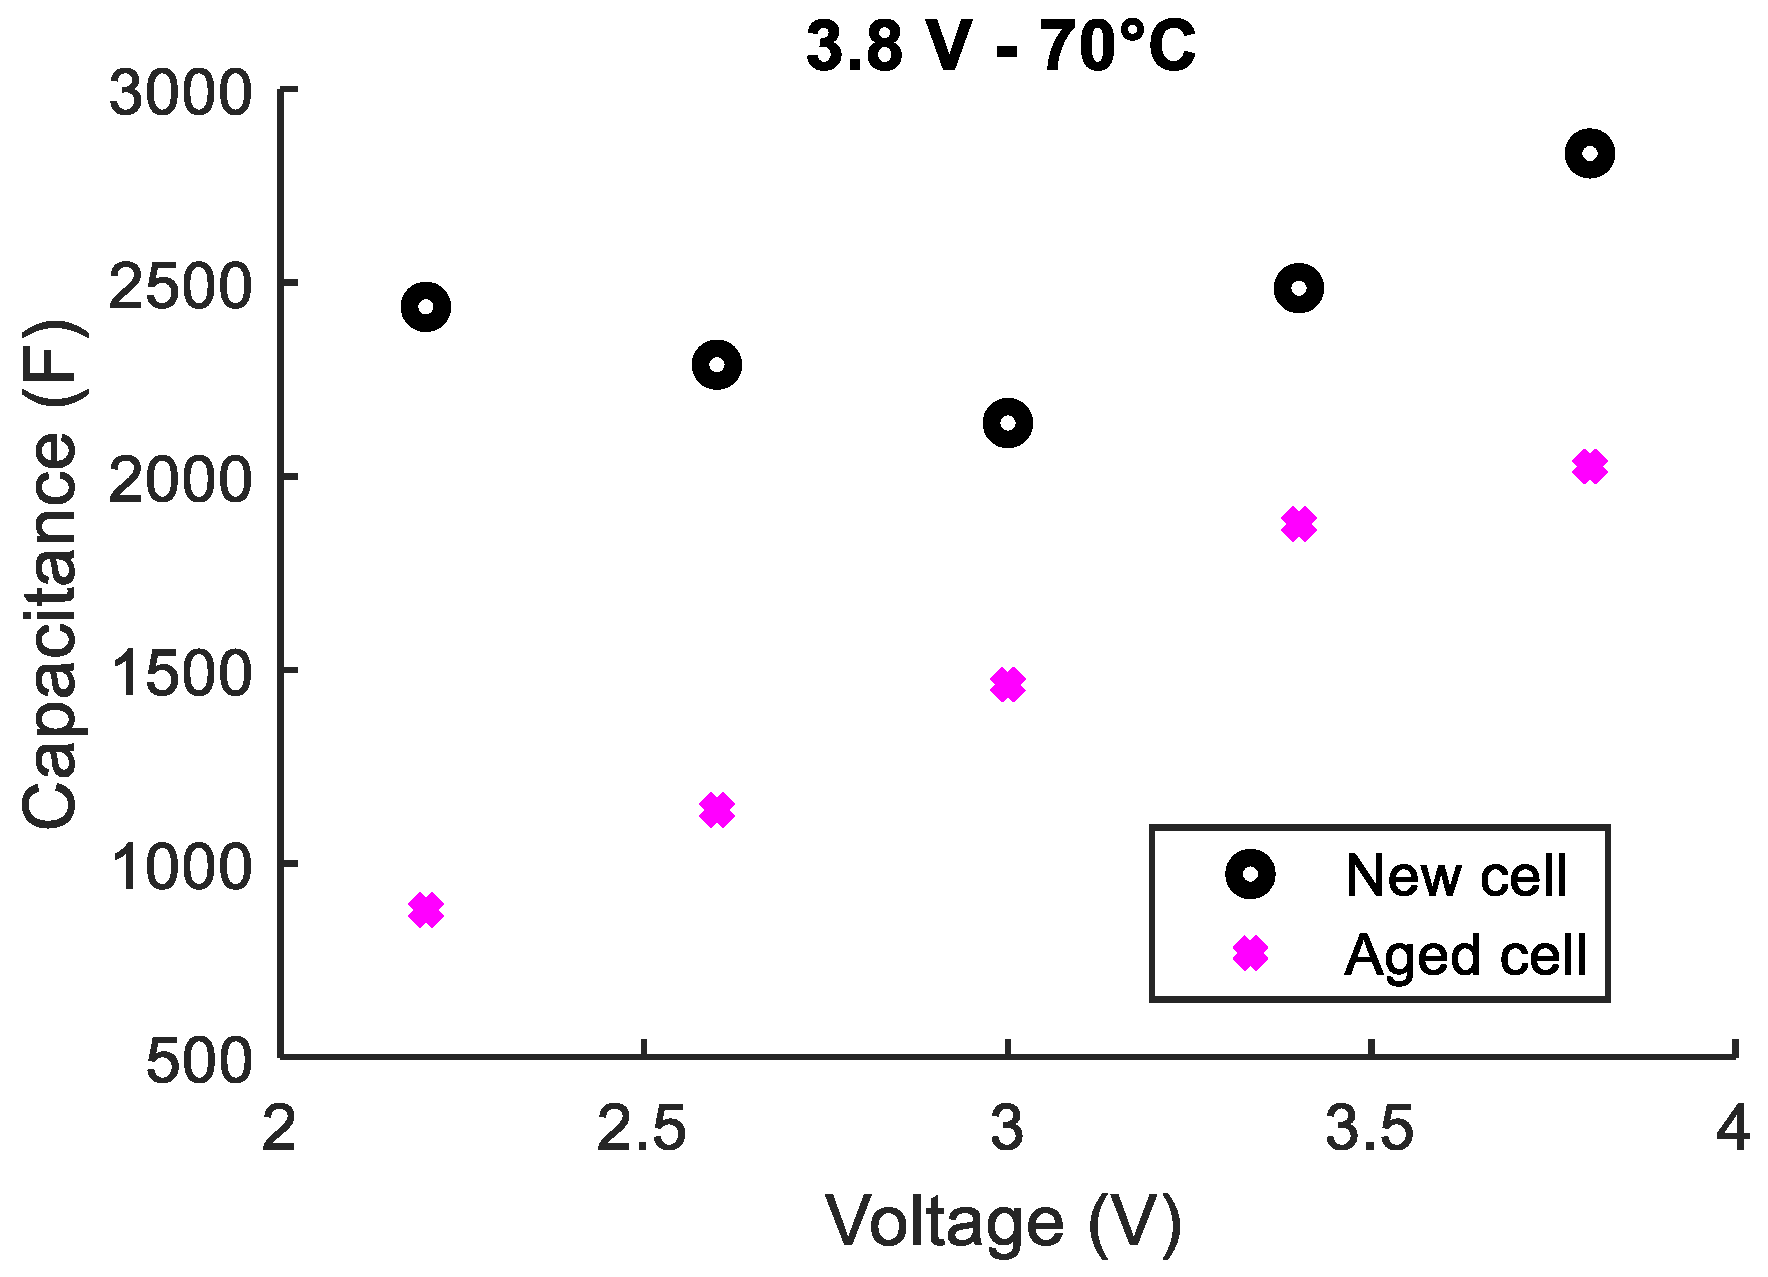
The third tested LiC aged at 3.8 V and 70 °C for 17 months instead of 20 months. In fact, cells that aged at 3.8 V suffered from swelling issues. For this reason, their aging process was interrupted after 17 months [24]. This LiC lost around 36% of its initial capacitance that was measured at the aging conditions (3.8 V and 70 °C). According to the final characterizations at 25 °C, the percentage decrease in the capacitance at 3.8 V is 30% compared to the characterizations done before aging. Figure 9 shows a comparison between capacitances measured at 25 °C before and after aging. One can conclude that the degradations affect the capacitance values over the entire potential window. The asymmetrical V-shape of the C(V) curve is also no longer observed.
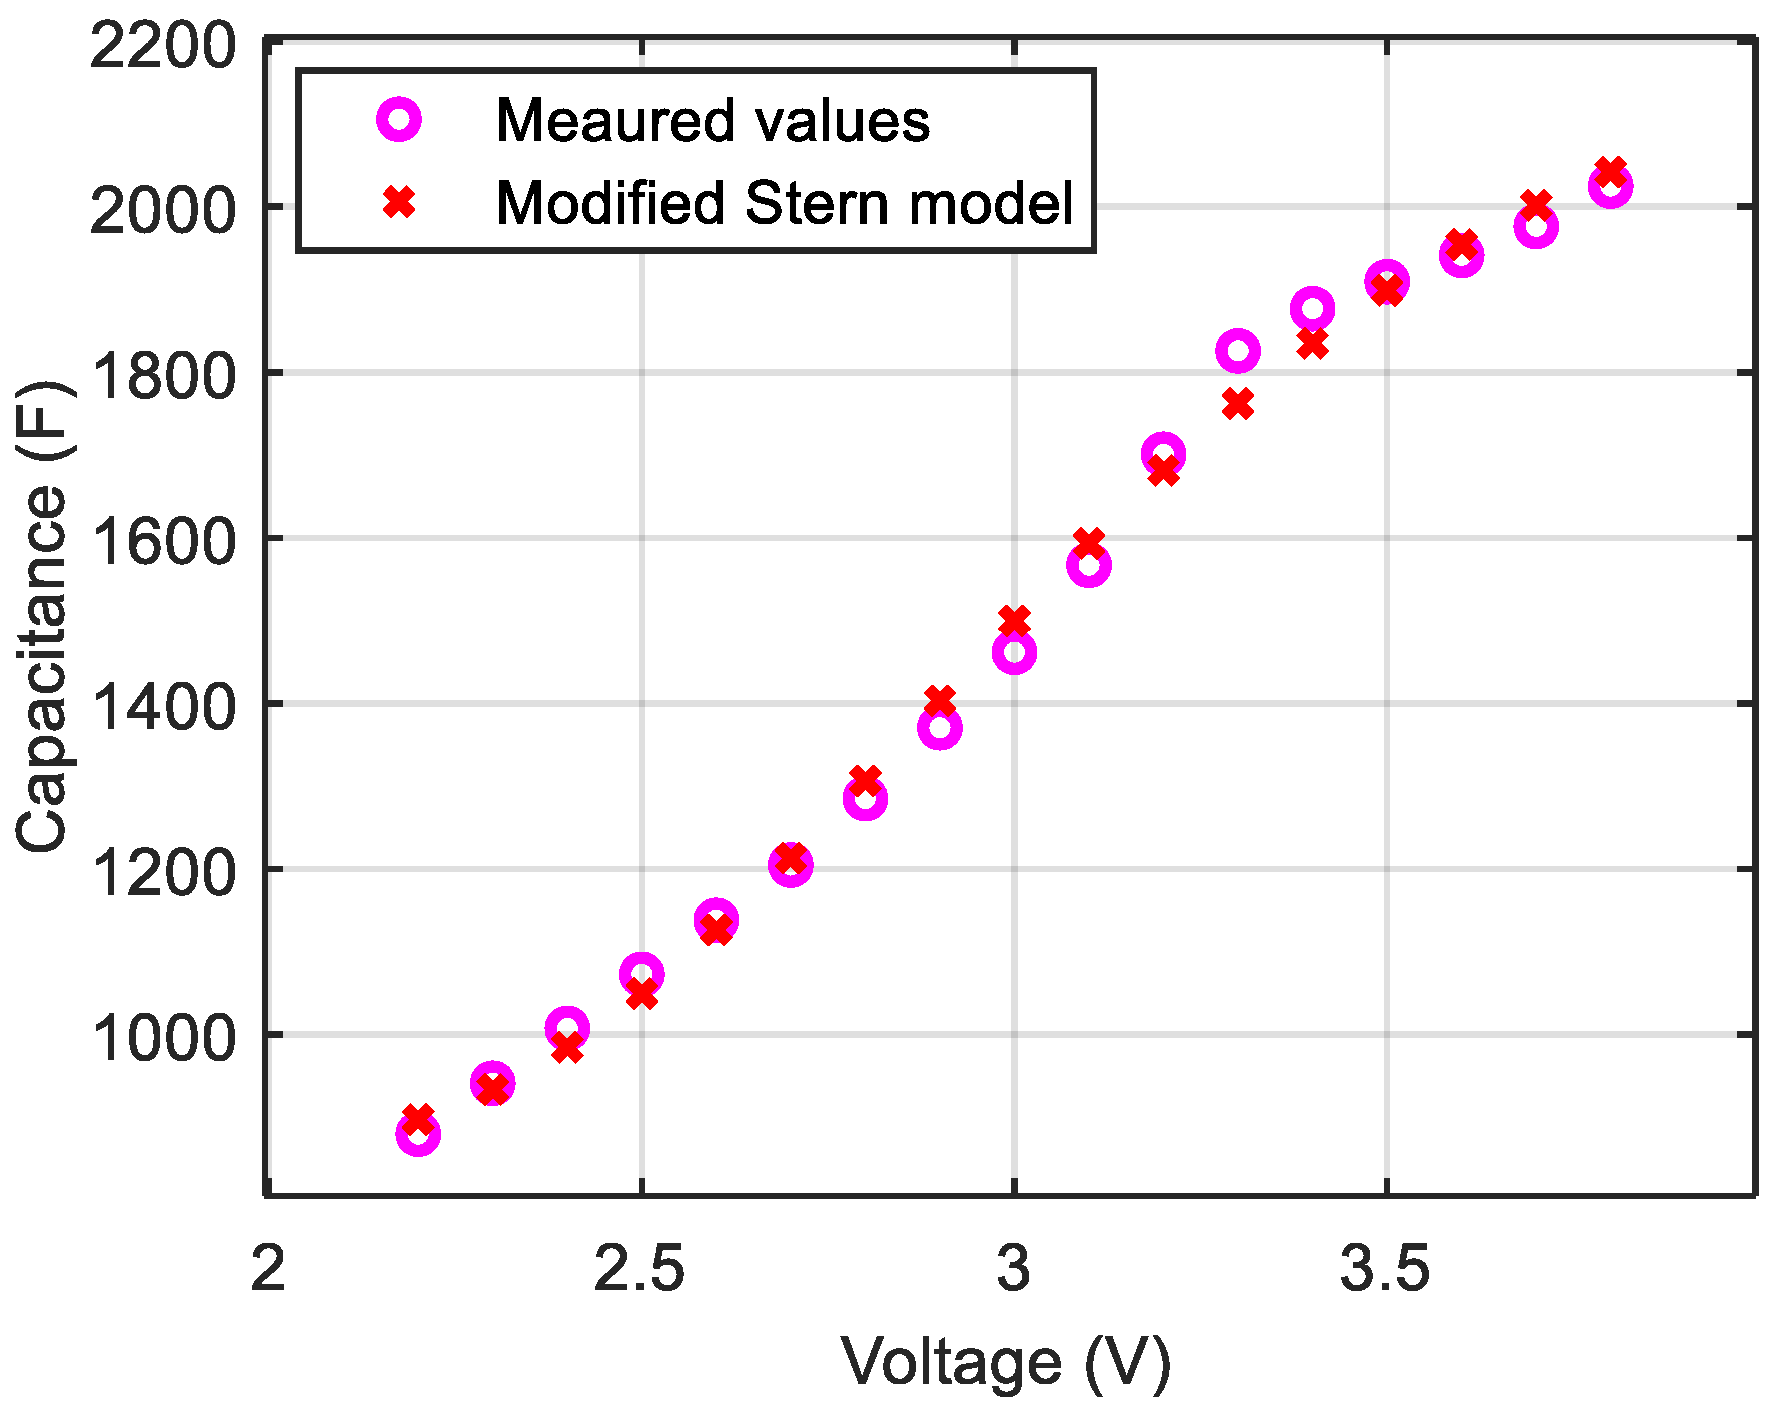
The complete evolution of the capacitance as a function of the voltage, extracted from impedance measurements at 17 potentials, is shown in Figure 10, as well as the resulting modified Stern model.
Similar to the cell that aged at 2.2 V, the minimum capacitance corresponds to a voltage value below 2.2 V. Therefore, is considered equal to 2.2 V since the cell cannot be discharged below 2.2 V. The potential of the negative electrode clearly drifted towards higher potentials. This induces a change in the operating principle of the positive electrode whose double layer can only be formed by the accumulation of anions on its surface. Therefore, a monotonous increase in the capacitance during charging from 2.2 to 3.8 V is found. Significant growth of the layer SEI at the negative electrode can cause this potential drift of the negative electrode related to a loss of pre-intercalated lithium ions in the carbon layers. The pre- and post-aging parameters of the modified Stern model are shown in Table 3. The capacitances related to the compact and diffuse layers significantly decrease (by 29% and 80% respectively) during aging at 3.8 V. Damages at the interface between the electrode and the electrolyte and in the electrolyte of the LiC cells can be the reason behind the significant decrease in the parameter .
4. Discussion
The hybrid composition of LiCs directly affects their aging mechanisms that strongly depend on their terminal voltage. The analysis of the evolution of the capacitance with respect to the voltage (the C(V) curve) through aging is a way towards the interpretation of the generated degradations. According to accelerated aging tests applied to LiCs [24], two main mechanisms, whose origins differ from one voltage to another, can be highlighted:
- the loss of pre-intercalated lithium ions from the negative electrode,
- the blocking of the pores of the positive electrode.
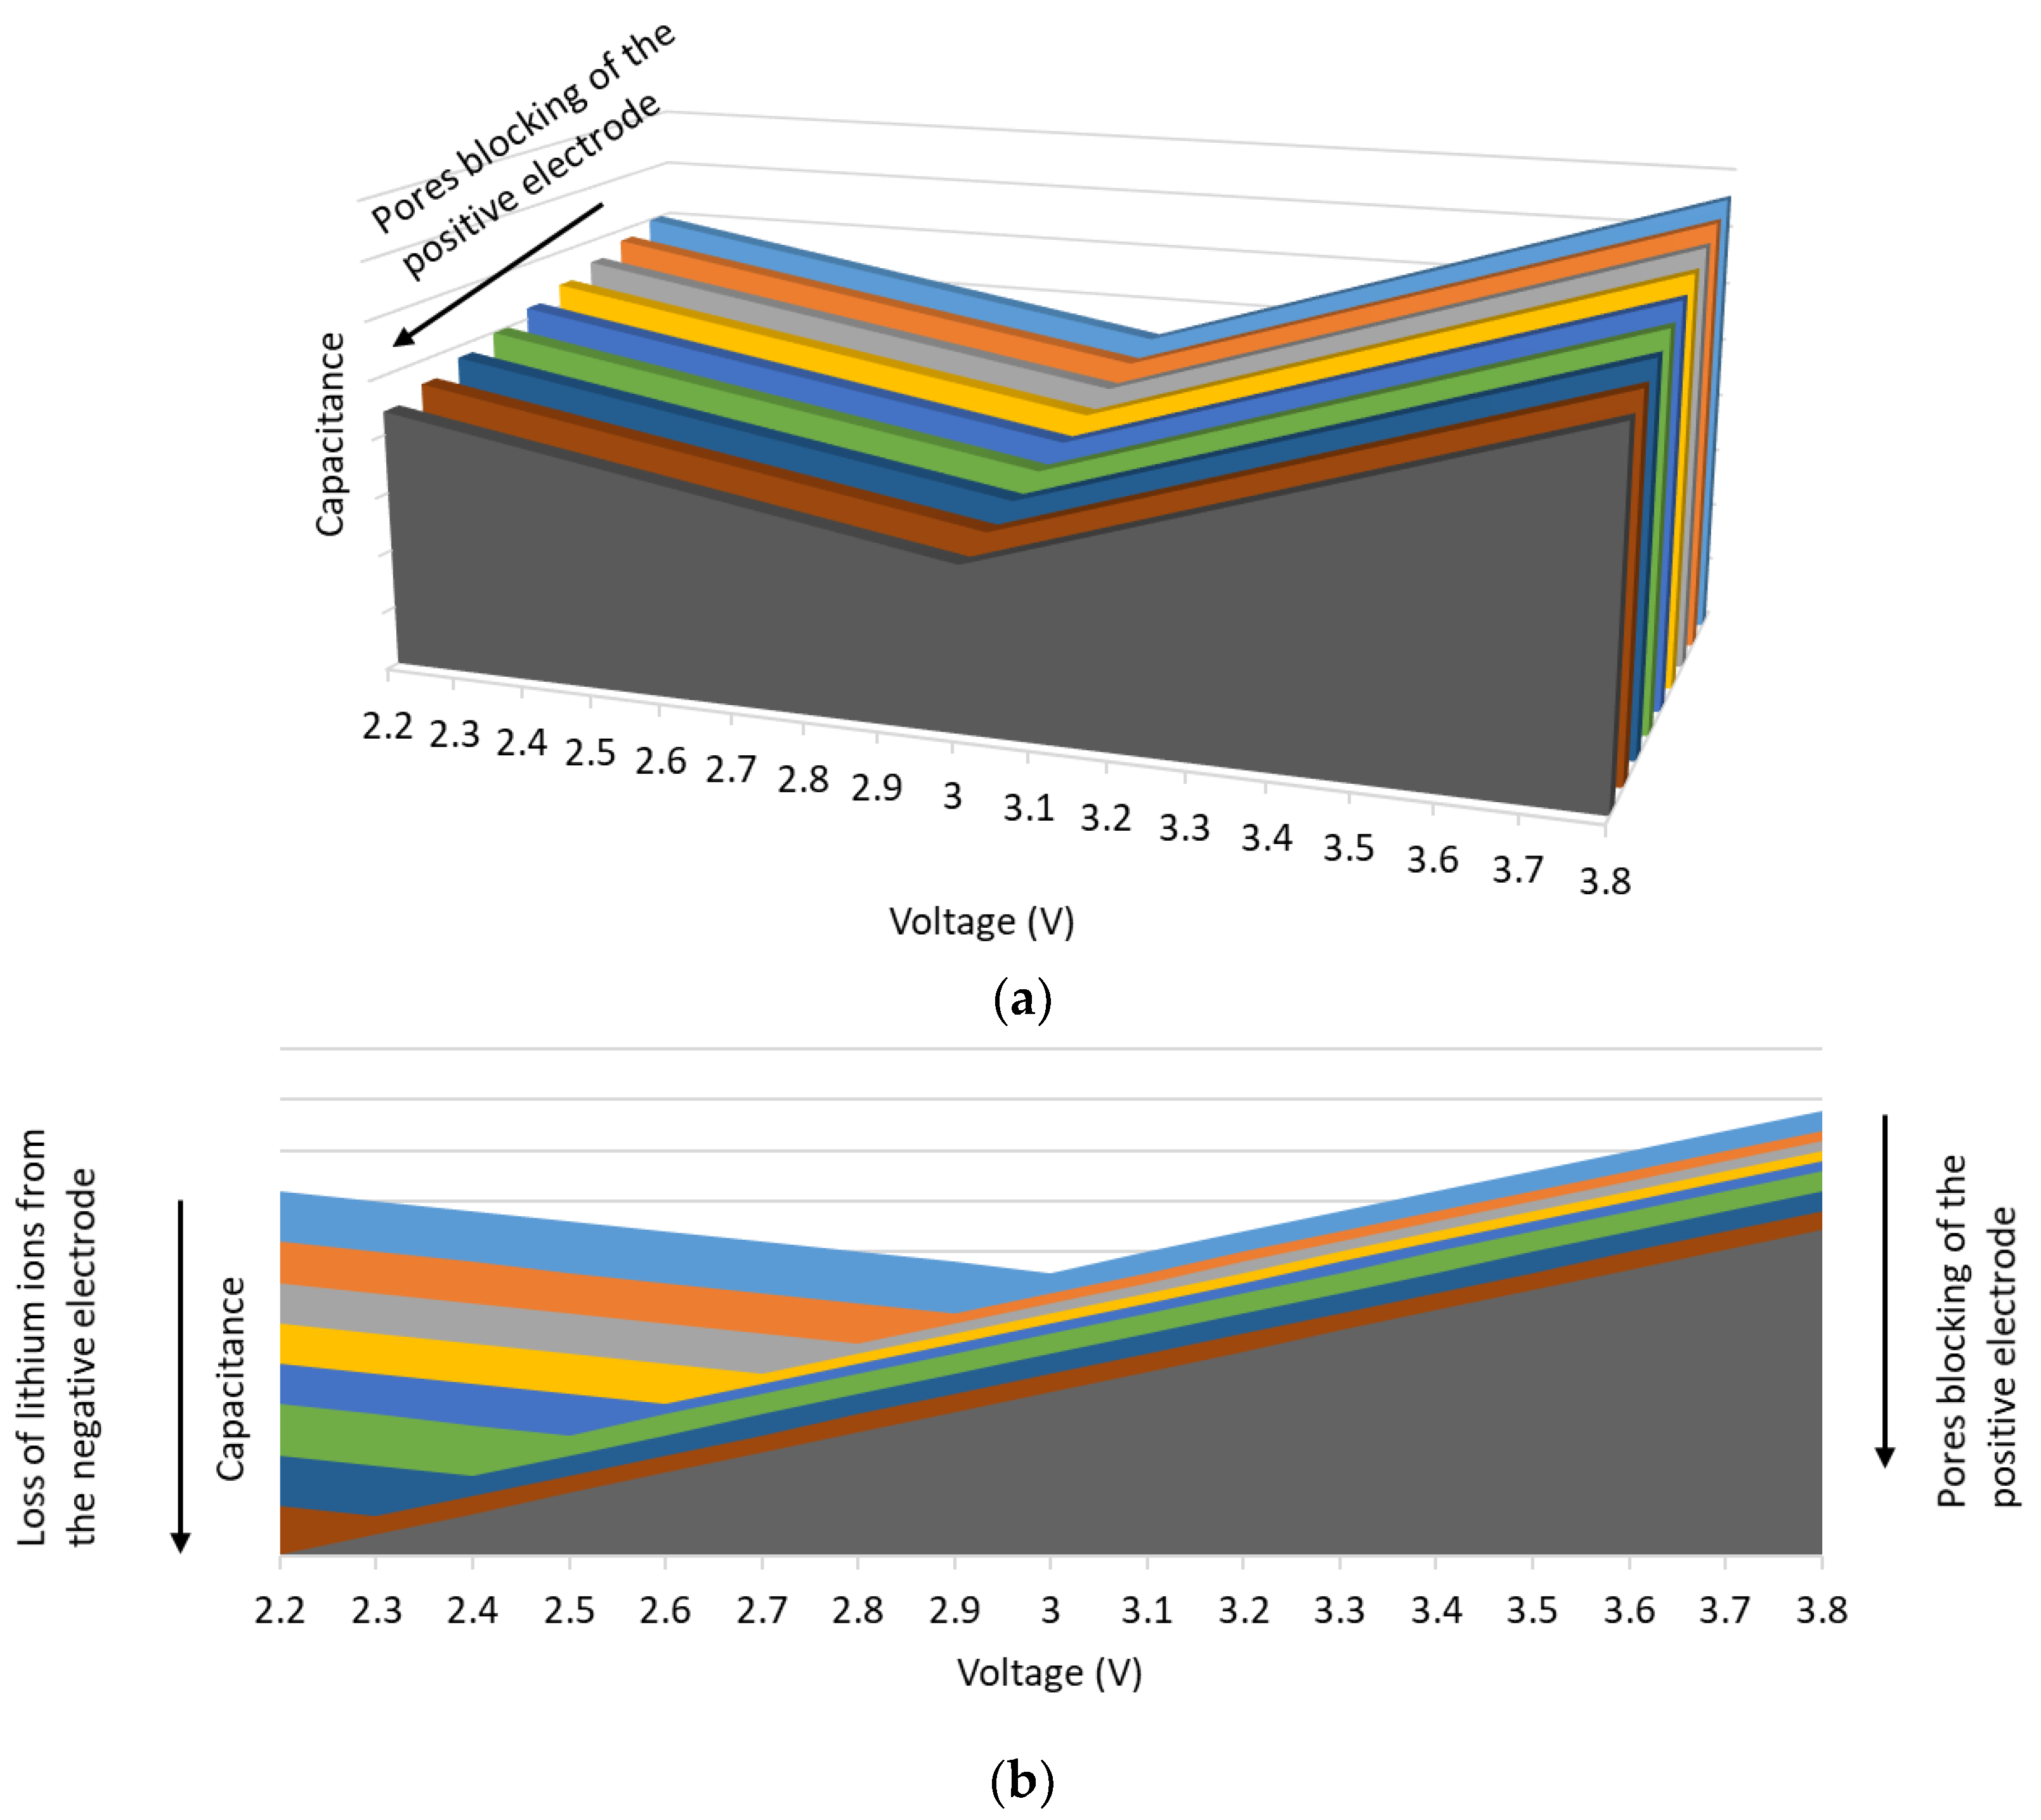
The graphs in Figure 11 summarize the effects of the blocking of the pores of the positive electrode as well as the loss of pre-intercalated lithium ions in the negative electrode on the C(V) curve. The blocking of the pores of the positive electrode induces the decrease in the capacitance, as shown in the first graph of Figure 11. At 2.2 V, the products of the reactions between the lithium ions and the functional groups present on the surface of the positive electrode block its pores. At 3.8 V, the reaction products between electrolyte components, that decompose at high temperatures and high potential values, and the functional groups also cause pores to block [24].
The loss of the cyclable lithium ions of the negative electrode causes the drift of its potential. The voltage , which corresponds to the minimum capacitance of the C(V) curves, drifts progressively with aging from 3 to less than 2.2 V. In addition, the total capacitance of the LiC decreases because of the decrease in the capacity of the negative electrode causing a limitation of the use of the total capacitance of the positive electrode. If the LiCs are stored at 2.2 V, this loss of capacity is caused by the potential drift of the positive electrode that irreversibly adsorbs the lithium ions. An additional deintercalation of lithium ions from the negative electrode is then required. On the other hand, if the LiCs are stored at 3.8 V, the growth of the SEI layer on the surface of the negative electrode is the reason behind the loss of capacity. As for LiCs that are stored at 3 V, the positive electrode is at the neutral state, which reduces the effects of floating aging on its surface. However, a saturation of the electrode was noticed at a threshold voltage value of 2.6 V. Moreover, a small shift of from 3 V to 2.8 V was recorded showing the potential drift of the negative electrode due to the growth of the SEI layer.
In a LiC, these two mechanisms are complementary. Consequently, their respective effects accelerate the degradation of the two electrodes. The second graph in Figure 11 shows the effects of the combined two mechanisms on the C(V) curve. The voltage corresponding to the minimum capacitance decreases as well as the capacitance values. These results correspond well to the cells aging at 2.2 and at 3.8 V. At 3 V, the effects of these two mechanisms are less pronounced since a lower voltage drift and a smaller decrease in the capacitance were found.
5. Conclusions
The nonlinear capacitance evolution of LiCs was modeled based on a physicochemical analysis of the electrochemical double layer capacitance. Simulation results show a good accordance between the measured values of the capacitance and the estimated ones. The model was able to follow the evolution of calendar aging of LiCs at the maximum and the minimum nominal voltages. Since the tested LiCs are made of activated carbon at the positive electrode and pre-lithiated graphite at the negative electrode, the model can be applied to LiCs with the same chemical structure since the operating principle is the same. This chemical structure of LiCs is the most common one.
The interpretation of the C(V) curve was found to be a significant indicator of the aging mechanisms of LiCs. Degradations of the cells were deduced from the decrease in the capacitance values and the shift of the voltage corresponding to the minimum capacitance. The blocking of the pores of the positive electrode and the loss of lithium ions from the graphite negative electrode are the two aging mechanisms directly influencing the shape of the C(V) curve.
Online estimation of the capacitance during the operation of LiCs is a beneficial process that can contribute to the state of health estimation. Additional tests should be applied to LiCs in order to assess the effects of cycling on the evolution of the C(V) curve.
Author Contributions
Conceptualization, N.E.G.; methodology, N.E.G., A.S. and P.V.; software, N.E.G.; validation, N.E.G., A.S. and P.V.; formal analysis, N.E.G., A.S. and P.V.; investigation, N.E.G.; resources, A.S. and P.V.; data curation, N.E.G.; writing—original draft preparation, N.E.G.; writing—review and editing, N.E.G., A.S. and P.V.; visualization, N.E.G., A.S. and P.V.; supervision, A.S. and P.V.; project administration, A.S. and P.V.; funding acquisition, A.S. and P.V. All authors have read and agreed to the published version of the manuscript.
Funding
This research received no external funding.
Conflicts of Interest
The authors declare no conflict of interest.
References
- Al-Gabalawy, M.; Hosny, N.S.; Hussien, S.A. Lithium-ion battery modeling including degradation based on single-particle approximations. Batteries 2020, 6, 37. [Google Scholar] [CrossRef]
- Bonfitto, A.; Feraco, S.; Tonoli, A.; Amati, N.; Monti, F. Estimation accuracy and computational cost analysis of artificial neural networks for state of charge estimation in lithium batteries. Batteries 2019, 5, 47. [Google Scholar] [CrossRef] [Green Version]
- El Ghossein, N.; Sari, A.; Venet, P. Lifetime prediction of Lithium-Ion capacitors based on accelerated aging tests. Batteries 2019, 5, 28. [Google Scholar] [CrossRef] [Green Version]
- Plattard, T.; Barnel, N.; Assaud, L.; Franger, S.; Duffault, J.-M. Combining a fatigue model and an incremental capacity analysis on a commercial NMC/graphite cell under constant current cycling with and without calendar aging. Batteries 2019, 5, 36. [Google Scholar] [CrossRef] [Green Version]
- Wang, W.; Chung, H.S.-H.; Zhang, J. Near-real-time parameter estimation of an electrical battery model with multiple time constants and SOC-dependent capacitance. IEEE Trans. Power Electron. 2014, 29, 5905–5920. [Google Scholar] [CrossRef]
- Yang, H. Effects of supercapacitor physics on its charge capacity. IEEE Trans. Power Electron. 2019, 34, 646–658. [Google Scholar] [CrossRef]
- German, R.; Venet, P.; Sari, A.; Briat, O.; Vinassa, J.M. Improved supercapacitor floating ageing interpretation through multipore impedance model parameters evolution. IEEE Trans. Power Electron. 2014, 29, 3669–3678. [Google Scholar] [CrossRef]
- Eguchi, T.; Kanamoto, Y.; Tomioka, M.; Tashima, D.; Kumagai, S. Effect of ball milling on the electrochemical performance of activated carbon with a very high specific surface area. Batteries 2020, 6, 22. [Google Scholar] [CrossRef] [Green Version]
- Simon, P.; Gogotsi, Y. Materials for electrochemical capacitors. Nat. Mater. 2008, 7, 845–854. [Google Scholar] [CrossRef] [PubMed] [Green Version]
- Gouy, M. Sur la constitution de la charge électrique à la surface d’un électrolyte. J. Phys. Théorique Appliquée 1910, 9, 457–468. [Google Scholar] [CrossRef] [Green Version]
- Chapman, D.L. A contribution to the theory of electrocapillarity. Lond. Edinb. Dublin Philos. Mag. J. Sci. 1913, 25, 475–481. [Google Scholar] [CrossRef] [Green Version]
- Stern, O. Zur theorie der elektrolytischen doppelschicht. Zeitschrift Elektrochemie Angewandte Physikalische Chemie 1924, 30, 508–516. [Google Scholar] [CrossRef]
- Venet, P. Amélioration de la Sûreté de Fonctionnement des Dispositifs de Stockage d’Energie. Ph.D. Thesis, Université Claude Bernard, Lyon, France, 2007. [Google Scholar]
- Ghossein, N.E.; Sari, A.; Venet, P. Nonlinear capacitance evolution of lithium-ion capacitors based on frequency- and time-domain measurements. IEEE Trans. Power Electron. 2018, 33, 5909–5916. [Google Scholar] [CrossRef] [Green Version]
- Ghossein, N.E.; Sari, A.; Venet, P. Interpretation of the particularities of lithium-ion capacitors and development of a simple circuit model. In Proceedings of the 2016 IEEE Vehicle Power and Propulsion Conference (VPPC), Hangzhou, China, 17–20 October 2016; pp. 1–5. [Google Scholar]
- Manla, E.; Mandic, G.; Nasiri, A. Development of an electrical model for lithium-ion ultracapacitors. IEEE J. Emerg. Sel. Top. Power Electron. 2015, 3, 395–404. [Google Scholar] [CrossRef]
- Barcellona, S.; Ciccarelli, F.; Iannuzzi, D.; Piegari, L. Modeling and parameter identification of lithium-ion capacitor modules. IEEE Trans. Sustain. Energy 2014, 5, 785–794. [Google Scholar] [CrossRef]
- Sivakkumar, S.R.; Pandolfo, A.G. Evaluation of lithium-ion capacitors assembled with pre-lithiated graphite anode and activated carbon cathode. Electrochim. Acta 2012, 65, 280–287. [Google Scholar] [CrossRef]
- Shellikeri, A.; Hung, I.; Gan, Z.; Zheng, J. In situ NMR tracks real-time li ion movement in hybrid supercapacitor–battery device. J. Phys. Chem. C 2016, 120, 6314–6323. [Google Scholar] [CrossRef]
- Schroeder, M.; Winter, M.; Passerini, S.; Balducci, A. On the cycling stability of lithium-ion capacitors containing soft carbon as anodic material. J. Power Sources 2013, 238, 388–394. [Google Scholar] [CrossRef]
- Aida, T.; Murayama, I.; Yamada, K.; Morita, M. Analyses of capacity loss and improvement of cycle performance for a high-voltage hybrid electrochemical capacitor. J. Electrochem. Soc. 2007, 154, A798–A804. [Google Scholar] [CrossRef]
- Zhang, T.; Fuchs, B.; Secchiaroli, M.; Wohlfahrt-Mehrens, M.; Dsoke, S. Electrochemical behavior and stability of a commercial activated carbon in various organic electrolyte combinations containing Li-salts. Electrochim. Acta 2016, 218, 163–173. [Google Scholar] [CrossRef]
- Sun, X.; Zhang, X.; Liu, W.; Wang, K.; Li, C.; Li, Z.; Ma, Y. Electrochemical performances and capacity fading behaviors of activated carbon/hard carbon lithium ion capacitor. Electrochim. Acta 2017, 235, 158–166. [Google Scholar] [CrossRef]
- Ghossein, N.E.; Sari, A.; Venet, P. Effects of the hybrid composition of commercial lithium-ion capacitors on their floating aging. IEEE Trans. Power Electron. 2019, 34, 2292–2299. [Google Scholar] [CrossRef]
- Ghossein, N.E.; Sari, A.; Venet, P. Degradation behavior of lithium-ion capacitors during calendar aging. In Proceedings of the 2017 IEEE 6th International Conference on Renewable Energy Research and Applications (ICRERA), San Diego, CA, USA, 5–8 November 2017; pp. 142–146. [Google Scholar]
- Ghossein, N.E.; Sari, A.; Venet, P. Accelerated cycle aging tests applied to lithium-ion capacitors. In Proceedings of the 2017 IEEE Vehicle Power and Propulsion Conference (VPPC), Belfort, France, 11–14 December 2017; pp. 1–5. [Google Scholar]
- Helmholtz, H. Studien über electrische Grenzschichten. Ann. Phys. 1879, 243, 337–382. [Google Scholar] [CrossRef] [Green Version]
- German, R.L. Étude du Vieillissement Calendaire des Supercondensateurs et Impact des Ondulations de Courant Haute Fréquence. Ph.D. Thesis, Université Claude Bernard, Lyon, France, 2013. [Google Scholar]
- Hou, Y. Controlling Variables of Electric Double-Layer Capacitance. Ph.D. Thesis, University of Fukui, Fukui, Japan, 2014. [Google Scholar]
- von Wald Cresce, A.; Gobet, M.; Borodin, O.; Peng, J.; Russell, S.M.; Wikner, E.; Fu, A.; Hu, L.; Lee, H.-S.; Zhang, Z.; et al. Anion solvation in carbonate-based electrolytes. J. Phys. Chem. C 2015, 119, 27255–27264. [Google Scholar] [CrossRef]
- Bogle, X.; Vazquez, R.; Greenbaum, S.; Cresce, A.v.W.; Xu, K. Understanding Li+–Solvent interaction in nonaqueous carbonate electrolytes with 17O NMR. J. Phys. Chem. Lett. 2013, 4, 1664–1668. [Google Scholar] [CrossRef]
- Bazant, M.Z.; Kilic, M.S.; Storey, B.D.; Ajdari, A. Towards an understanding of induced-charge electrokinetics at large applied voltages in concentrated solutions. Adv. Colloid Interface Sci. 2009, 152, 48–88. [Google Scholar] [CrossRef] [Green Version]
Figure 1.
The capacitance evolution as a function of the voltage of a conventional supercapacitor [13].
Figure 1.
The capacitance evolution as a function of the voltage of a conventional supercapacitor [13].

Figure 2.
The nonlinear evolution of the capacitance of an asymmetric Lithium-ion Capacitor (LiC) (3300F, JSR Micro) with respect to its terminal voltage [14].
Figure 2.
The nonlinear evolution of the capacitance of an asymmetric Lithium-ion Capacitor (LiC) (3300F, JSR Micro) with respect to its terminal voltage [14].

Figure 3.
The chemical states of a LiC at 2.2 V (), 3 V () and 3.8 V ().

Figure 4.
Comparison of the experimental data and the estimated values of the capacitance using the modified Stern model.
Figure 4.
Comparison of the experimental data and the estimated values of the capacitance using the modified Stern model.

Figure 5.
Comparison between the capacitances of a LiC, measured at 25 °C, before and after aging at 2.2 V and 70 °C for 20 months.
Figure 5.
Comparison between the capacitances of a LiC, measured at 25 °C, before and after aging at 2.2 V and 70 °C for 20 months.

Figure 6.
C(V) curve of a LiC that aged at 2.2 V and 70 °C for 20 months.

Figure 7.
Comparison between the capacitances measured at 25 °C before and after aging for a LiC that aged at 3 V and 70 °C for 20 months.
Figure 7.
Comparison between the capacitances measured at 25 °C before and after aging for a LiC that aged at 3 V and 70 °C for 20 months.

Figure 8.
C(V) curve of a LiC that aged at 3 V and 70 °C for 20 months.

Figure 9.
Comparison between the capacitances measured at 25 °C before and after aging for a LiC that aged at 3.8 V and 70 °C for 17 months.
Figure 9.
Comparison between the capacitances measured at 25 °C before and after aging for a LiC that aged at 3.8 V and 70 °C for 17 months.

Figure 10.
C(V) curve of a LiC that aged at 3.8 V and 70 °C for 17 months.

Figure 11.
Effects of aging mechanisms on the C(V) curve related to: (a) the positive electrode, (b) the positive and the negative electrodes.
Figure 11.
Effects of aging mechanisms on the C(V) curve related to: (a) the positive electrode, (b) the positive and the negative electrodes.


Table 1.
The identified parameters of the modified Stern model.
| 4475 | 6211 | 2.4 | 1.5 |
Table 2.
Comparison of the C(V) model parameters before and after aging at 2.2 V and 70 °C during 20 months.
Table 2.
Comparison of the C(V) model parameters before and after aging at 2.2 V and 70 °C during 20 months.
| Parameters of the Modified Stern Model | |||||
|---|---|---|---|---|---|
| Brand new cell | 3 | 3089 | 7264 | 2.7 | 1.5 |
| Aged cell at 2.2 V and 70 °C | ≤2.2 | 2682 | 1570 | 2.3 | 1.5 |
| (Figure 6) |
Table 3.
Comparison of the C(V) model parameters before and after aging at 3.8 V and 70 °C for 17 months.
Table 3.
Comparison of the C(V) model parameters before and after aging at 3.8 V and 70 °C for 17 months.
| Parameters of the Modified Stern Model | |||||
|---|---|---|---|---|---|
| Brand new cell | 3 | 3113 | 7257 | 2.6 | 1.4 |
| Aged cell at 3.8 V and 70 °C | ≤2.2 | 2228 | 1502 | 2.2 | 1.1 |
| (Figure 10) |
Publisher’s Note: MDPI stays neutral with regard to jurisdictional claims in published maps and institutional affiliations. |
© 2020 by the authors. Licensee MDPI, Basel, Switzerland. This article is an open access article distributed under the terms and conditions of the Creative Commons Attribution (CC BY) license (http://creativecommons.org/licenses/by/4.0/).
Share and Cite
MDPI and ACS Style
El Ghossein, N.; Sari, A.; Venet, P. Development of a Capacitance versus Voltage Model for Lithium-Ion Capacitors. Batteries 2020, 6, 54. https://0-doi-org.brum.beds.ac.uk/10.3390/batteries6040054
AMA Style
El Ghossein N, Sari A, Venet P. Development of a Capacitance versus Voltage Model for Lithium-Ion Capacitors. Batteries. 2020; 6(4):54. https://0-doi-org.brum.beds.ac.uk/10.3390/batteries6040054
Chicago/Turabian StyleEl Ghossein, Nagham, Ali Sari, and Pascal Venet. 2020. "Development of a Capacitance versus Voltage Model for Lithium-Ion Capacitors" Batteries 6, no. 4: 54. https://0-doi-org.brum.beds.ac.uk/10.3390/batteries6040054
Note that from the first issue of 2016, this journal uses article numbers instead of page numbers. See further details here.