Article

Heat Generation in NMC622 Coin Cells during Electrochemical Cycling: Separation of Reversible and Irreversible Heat Effects

1
Volkswagen AG, 38239 Salzgitter, Germany
2
Karlsruhe Institute of Technology, Institute for Applied Materials-Applied Materials Physics, Hermann-von-Helmholtz-Platz 1, 76344 Eggenstein, Germany
*
Author to whom correspondence should be addressed.
Submission received: 29 June 2020 / Revised: 16 October 2020 / Accepted: 30 October 2020 / Published: 10 November 2020

Abstract

:
The thermal behavior of a commercial lithium-ion cell with the cathode material LiNi0.6Mn0.2Co0.2O2 (NMC622) was investigated during the cycling process using a Tian-Calvet calorimeter (C80, SETARAM Instrumentation, France). Various current flows of 42.5, 85, and 170 mA corresponding to charging rates of 0.5, 1, and 2 C, respectively, were applied in the measurements. The corresponding heat flow rates were measured by the C80 calorimeter at 30 °C. The reversible heat effect due to the reversible electrochemical reaction was quantified by the entropy change measurement. The irreversible heat effect due to internal resistances was determined by the electrochemical impedance spectroscopy (EIS) and the galvanostatic intermittent titration technique (GITT). The results were compared with the direct measurement of the heat effect by calorimetry during electrochemical cycling.

1. Introduction

For the end of the current decade, the total lithium-ion batteries (LIBs) market is predicted to be as large as 390 GWh/y, in which the road-transport market consumes 245 GWh/y [1]. Advanced positive electrode materials are crucial for best electrochemical performance and thermal stability of LIB. Layered structure LiNi1-x-yMnxCoyO2 (NMC) and LiNi1-x-yCoxAlyO2 (NCA), spinel structure LiMn2O4 (LMO), and olivine structure LiFePO4 (LFP) are presently mainly used as cathode material for commercial LIBs [2,3,4,5,6,7,8]. Currently, NCA- and NMC-based batteries dominate the market of electrical vehicles (EVs). Ni-rich NMC cathode materials are especially attractive in large-scale automotive applications. Despite its outstanding electrochemical performance, the thermal stability and safety remains to be an important issue for the use of Ni-rich NMC materials. These key properties can be addressed at the materials level [9,10], on the cell level with regard to a safe cell design, and on the level of a pack or module for the development of advanced thermal management systems.
Although thermodynamic properties like the entropy change, which is responsible for the reversible heat generation during the intercalation or deintercalation processes in Li-ion cells, can be determined by temperature-dependent measurements of the open circuit voltage [11], the application of calorimetric methods can give additional insights for the thermal characterization [8,9]. Furthermore, since the calorimetry measures the integral heat generated of the cell, the combination of calorimetry, impedance, and potentiometric or galvanostatic methods [8,12,13] can provide further information about the details of the heat generation processes. With this combination, the individual contributions to total overpotential, which is composed of the ohmic loss; the charge transfer resistance; and the mass transport limitation due to diffusion can determined and the corresponding fractions of the irreversible heat generation rate can be estimated [14].
The objective of this work is an approach to a better understand the heat generation in Ni-rich NMC materials. By a combination of different analytical methods like calorimetry, electrochemical impedance spectroscopy (EIS), and galvanostatic intermittent titration technique (GITT), the thermal properties can be determined as valid input data for the development of thermal management systems. Especially, in the case of fast charging or discharging processes, the thermal behavior and the heat generation need to be investigated in details. The term “fast” has been used here according to the data sheet of the commercial coin cell, which allows a continuous maximum charge or discharge current of 120 mA. This corresponds to a charging of 1.4 C. Under charging and discharging different transport mechanisms contribute to the generated heat effects, which consists of a reversible and an irreversible part, respectively.
The total heat generation rate during cycling can be described by the following equation [11]:
Q ˙ t o t   =     Q ˙ i r r +   Q ˙ r .
The irreversible part Q ˙ i r r is generated due to the internal resistance R i (the sum of ohmic, activation, and diffusion polarization resistances), which is proportional to the voltage drop under a load condition. Since this effect represents always a heat loss from the system, the value is conventionally defined with a negative sign:
Q ˙ i r r   =   ( OCV U i ) · i ,
where OCV (open circuit voltage) is the open circuit voltage, Ui the voltage under load, and i the current density.
The reversible heat is related to just a reaction, which can be generated or consumed during the reversible intercalation or deintercalation of lithium during charging or discharging.
The reversible heat rate Q r ˙ at the temperature T is proportional to the entropy change ΔS of the reaction and the operating current i, given by [11,12]:
Q r ˙   =   T · Δ S · i n · F ,
with F = 96 485.3329 C/mol, the Faraday constant, and n equals the number of electrons per reaction.
The entropy change of the reversible reaction in LIBs can be determined by the following equation [11,12]:
Δ S ( x , T )   =   F · ( OCV ( x ,   T ) T | x ) ,
where x is the molar fraction, and with these definitions, the total volumetric heat generation rate can be written in terms of the overpotential η under current load [13]:
Q ˙   =   i V ( η T · Δ S n · F ) .
Since the total overpotential η is caused by ohmic losses, charge transfer resistance and limitations in the mass transport due to limited diffusion, Equation (5) can be also expressed with the individual contributions:
Q ˙ = i V ( η Ω + η c t + η D T · Δ S n · F ) ,
where ηΩ, ηct, and ηD are the ohmic potential drop, the activation overpotential due to the charge transfer, and the diffusion overpotential, respectively.
In this work, a calorimetric study combined with measurements of the different individual contributions from the overpotentials to the internal resistance is conducted as an effective approach for the characterization of the thermal behavior of coin cells with LiNi0.6Mn0.2Co0.2O2 as the cathode material. The heat generation under different charging/discharging rates of 0.5, 1, and 2 C, respectively, was investigated. The total heat generation during cycling was measured by a C80 (Setaram, Caluire, France) calorimeter, and the different contributions from reversible and irreversible heat to the total heat generation were separated by the measurement of the entropy change and the internal resistance, respectively. The OCV was measured as a function of the state of charge (SOC) at 30 °C for the determination of the entropy change according to Equation (4). The contributions from the ohmic potential drop, the charge transfer resistance, and the diffusional resistance to the internal resistances, respectively, were determined from the electrochemical impedance spectrum (EIS) and from the results of the galvanostatic intermittent titration technique (GITT). Using the results from the entropy change and the internal resistance measurements, the total heat flow rates could be computed. The calculated values computed from the individual contributions of the overpotentials were compared with the experimental results from the calorimetric measurements.

2. Results

2.1. Internal Resistances Definition and the Corresponding Irreversible Heat Effects
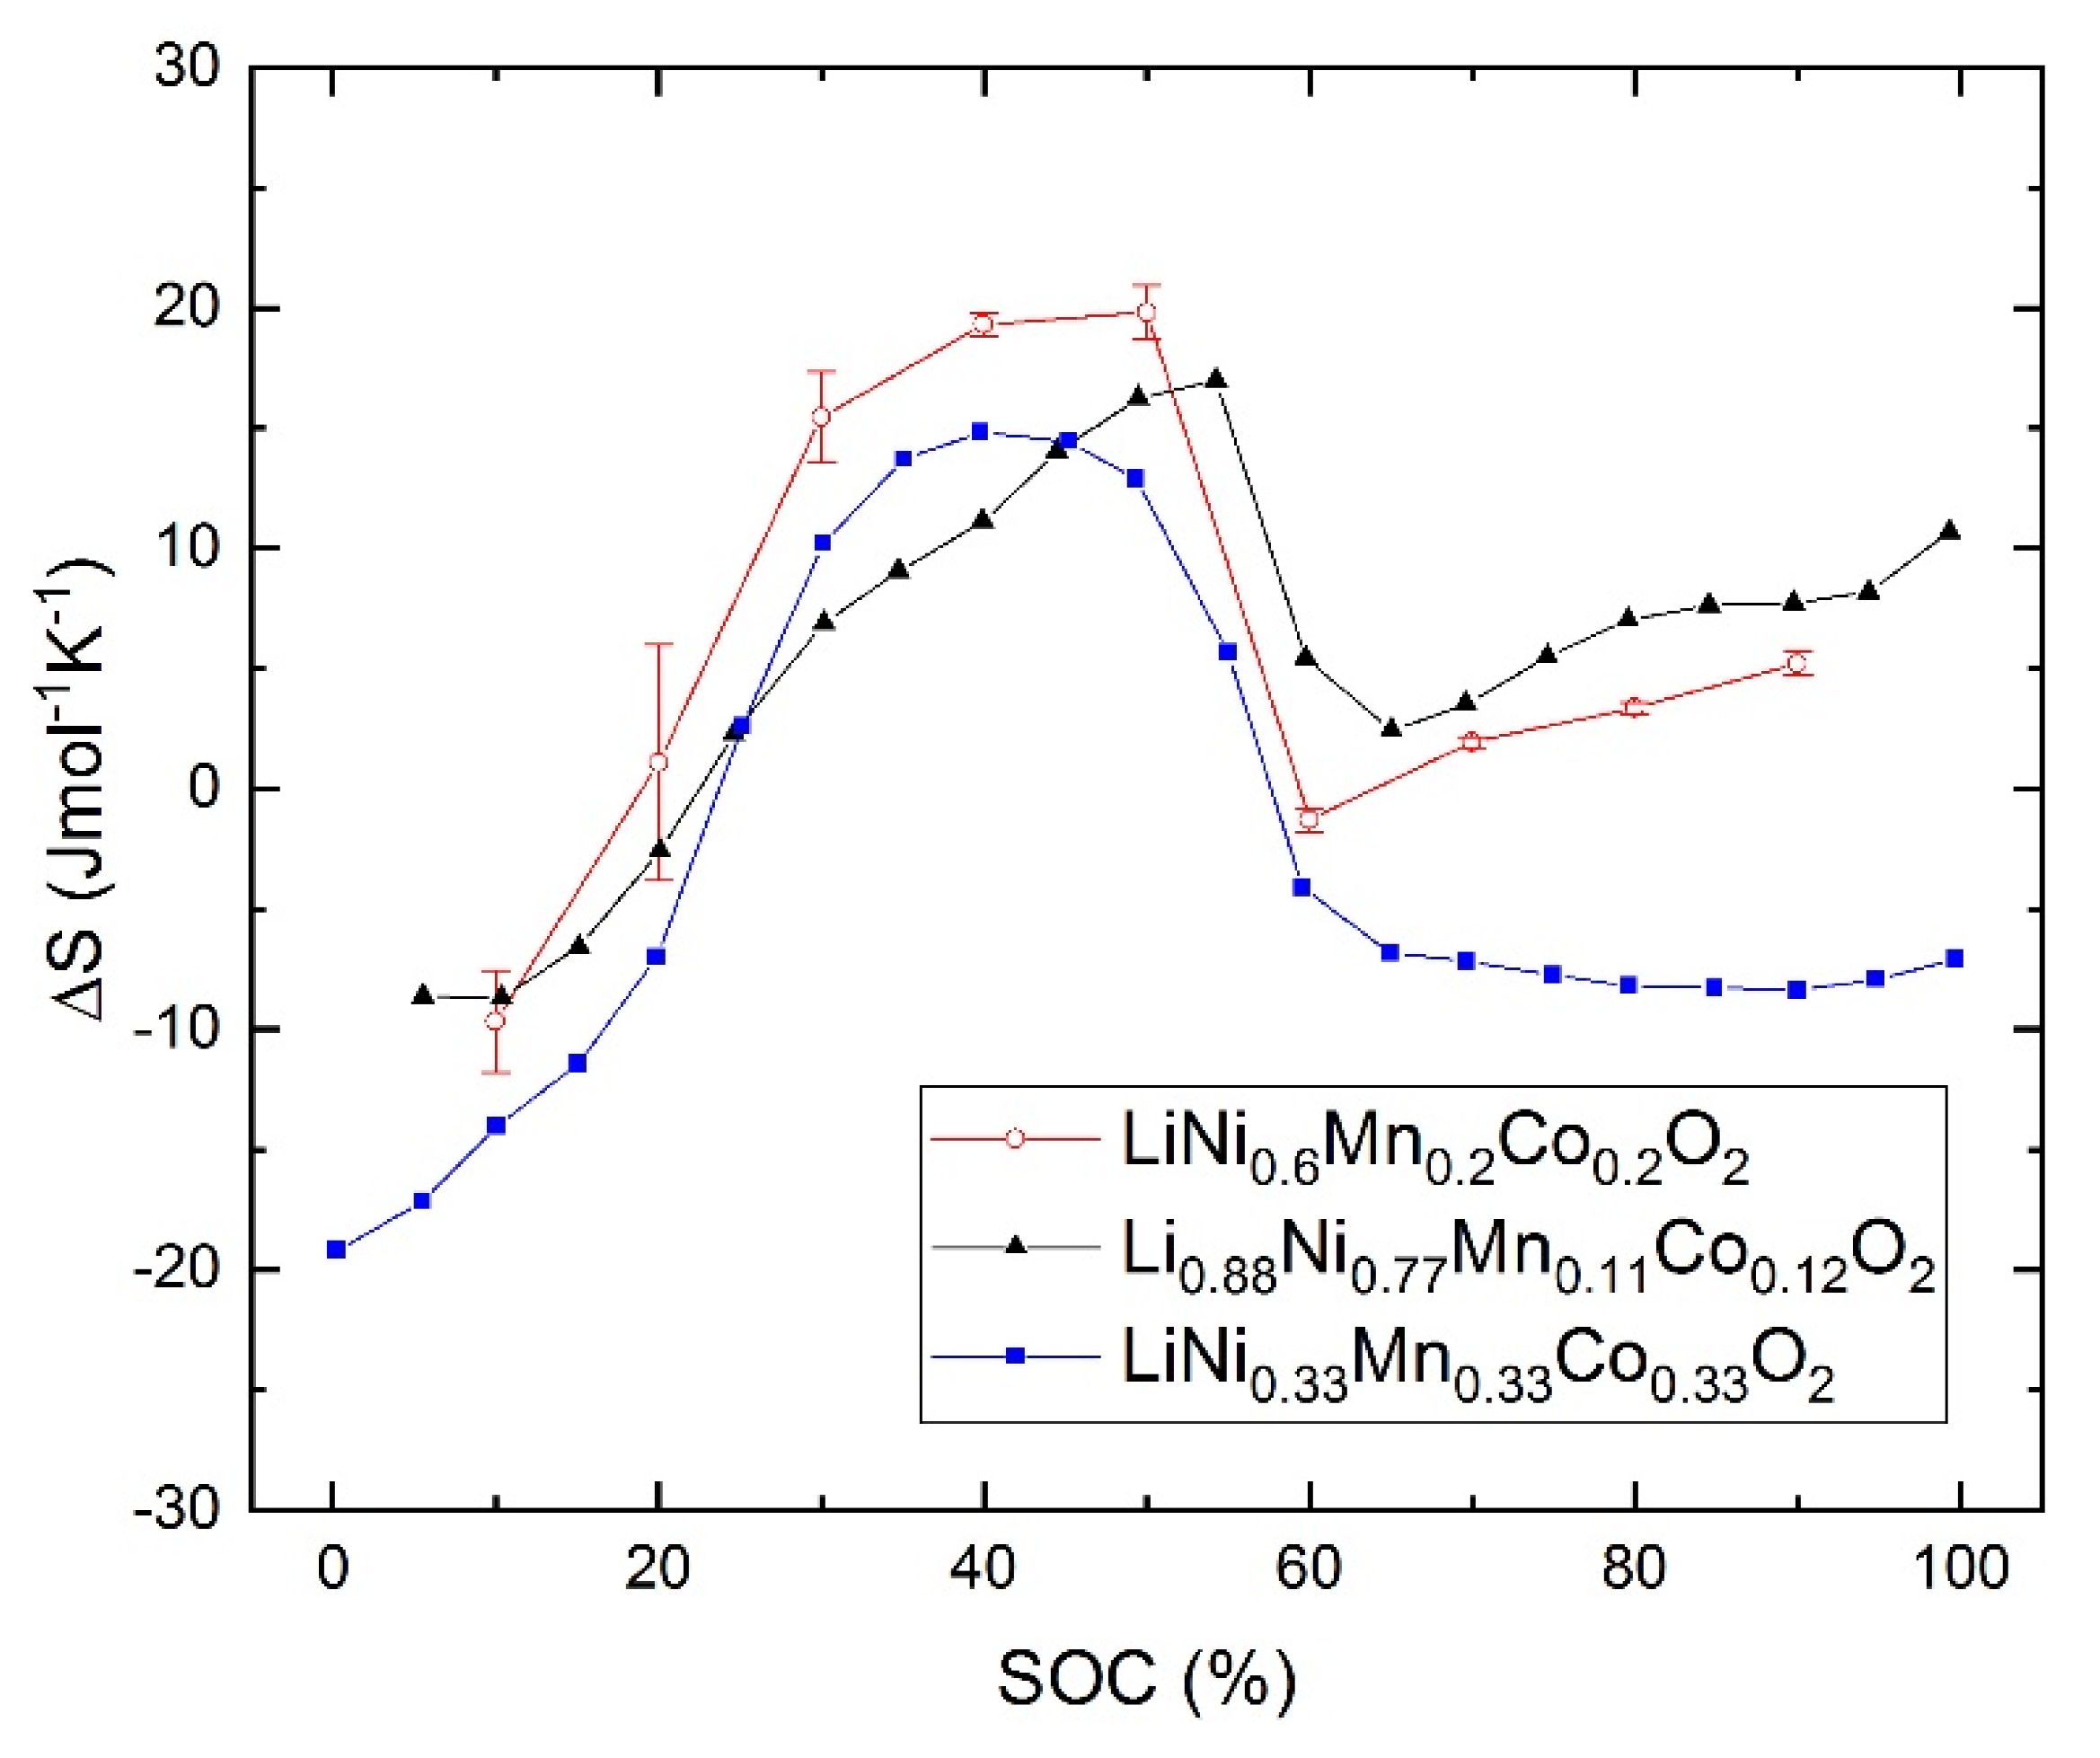
The discharge behavior of the coin cells for the three discharge rates is shown in Figure 1. The nominal capacity is 85 mAh and the discharge capacity for 0.5, 1, and 2 C are reduced to 98%, 93%, and 85% compared to the nominal capacity, respectively.
The impedance spectra (Figure 2) show that the pure ohmic resistance RΩ, which is defined by the intersection of the experimental curve with the real Z’-axis at Z” = 0 Ω, remained the same, independently from changes of the SOC, with SOC = 1 − DOD (depth of discharge). The average value is 402 ± 2 mΩ for all SOC levels with increasing values from SOC0 = 0.4016 Ω to SOC100 = 0.4037 Ω. However, this variation corresponds to a change of 0.5%, which is close to the resolution limit of the measurement system. Figure 3 shows a typical result of the GITT measurements, which are used to separate contributions of different overpotentials under a charge pulse. The IR-drop represents the sum of the overpotentials ηΩ and ηCT, respectively, due to the effects of the ohmic resistance and charge transfer impedance. Since the ohmic overpotential is ηΩ = I∙RΩ, the charge transfer overpotential η C T can be calculated using Equation (7). The diffusional part ηD of the overpotential was extracted at longer relaxation times using a procedure described by Heubner et al. [14].
The irreversible heat flow rates due to ohmic losses, charge transfer, and ionic diffusion during charge and discharge process at 30 °C are shown in Figure 4 for different charging and discharging rates. The values of SOC and DOD (depth of discharge) are defined with respect to the nominal capacity of 85 mAh at equilibrium conditions. The reachable capacities for 0.5, 1, and 2 C are reduced to 98%, 93%, and 85%, respectively.
The maximum values over all SOCs of the heat flow rates due to the charge transfer and diffusion impedance are listed in Table 1 with an expanded uncertainty of k = 2, i.e., with a confidence of 95% according to GUM (Guide to the expression of uncertainty in measurement) [15].
The total irreversible heat flow rates are shown in Figure 5. The values are calculated as the sum of heat generation rates due to ohmic, charge transfer, and mass diffusion contributions, respectively. Although there are only small effects as a function of SOC during charging, the heat generation rates exhibit maximum values at discharge levels higher than 80%. The maximum values of the heat flow rates calculated from the overpotentials due to diffusion and charge transfer among all SOCs and DODs, respectively, are listed in Table 1.

2.2. Entropy

The results of the entropy measurements are shown in Figure 6 together with the entropy change data of Yazami [16] and Zhang et al. [17], respectively. The three data sets agree very well with each other at SOC values larger than 60%. Below this value small deviations can be observed, but below 20% SOC, the entropy changes the sign to negative values, which would imply a cooling effect at low charging states.

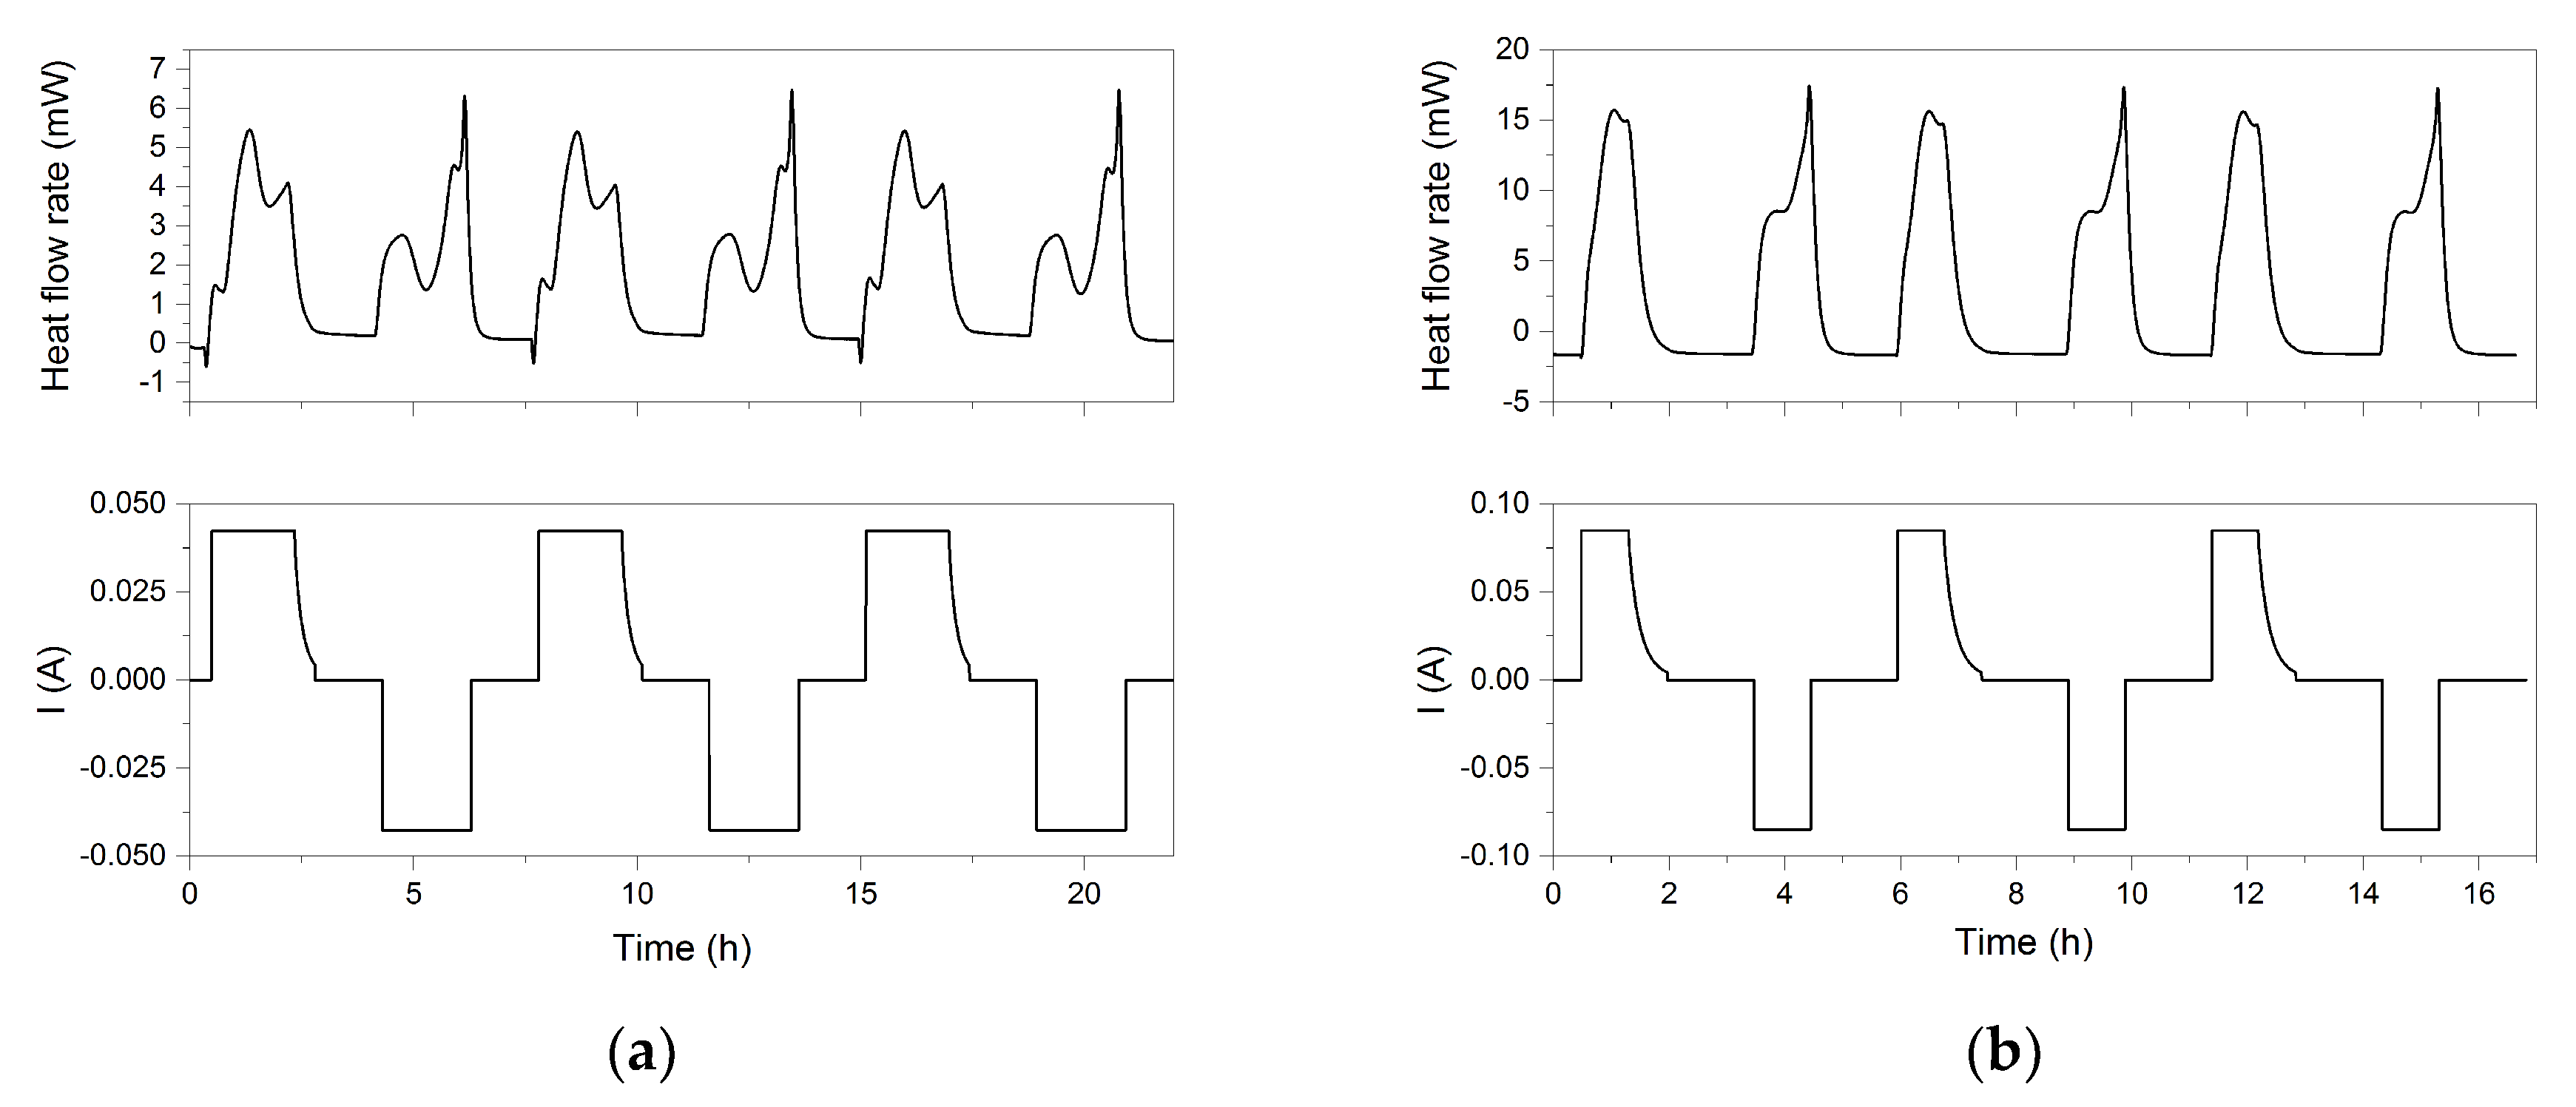
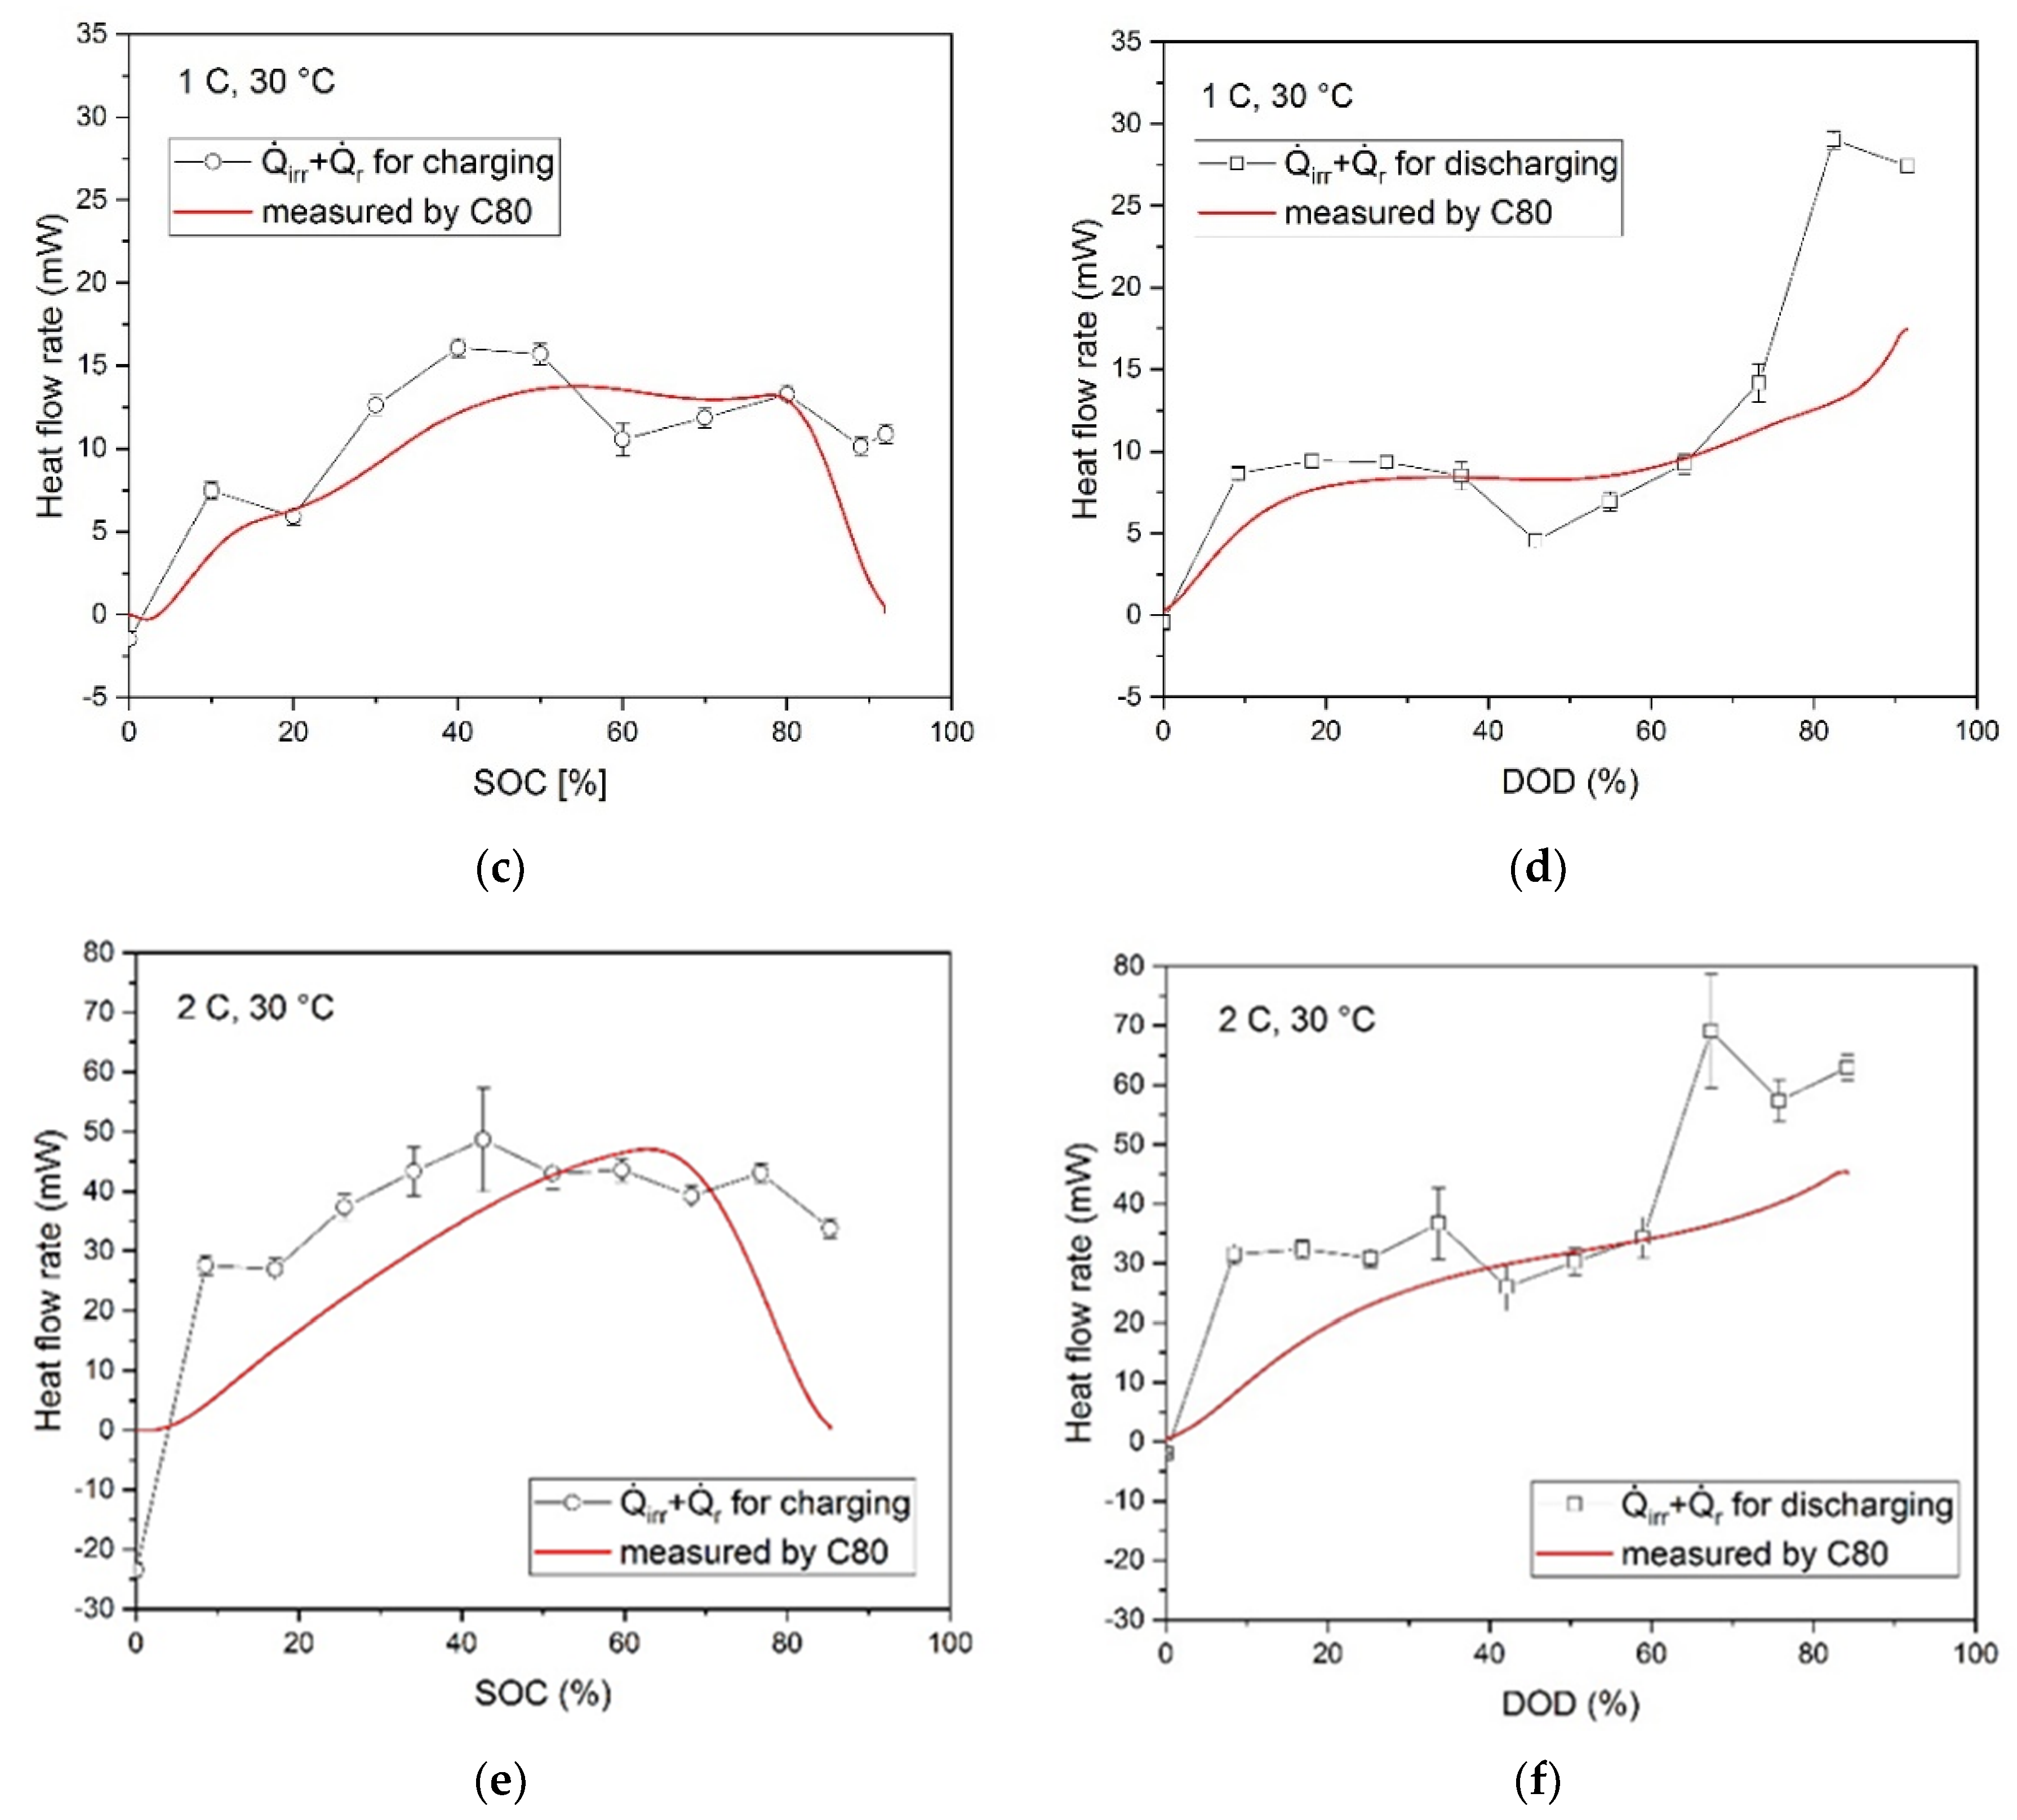
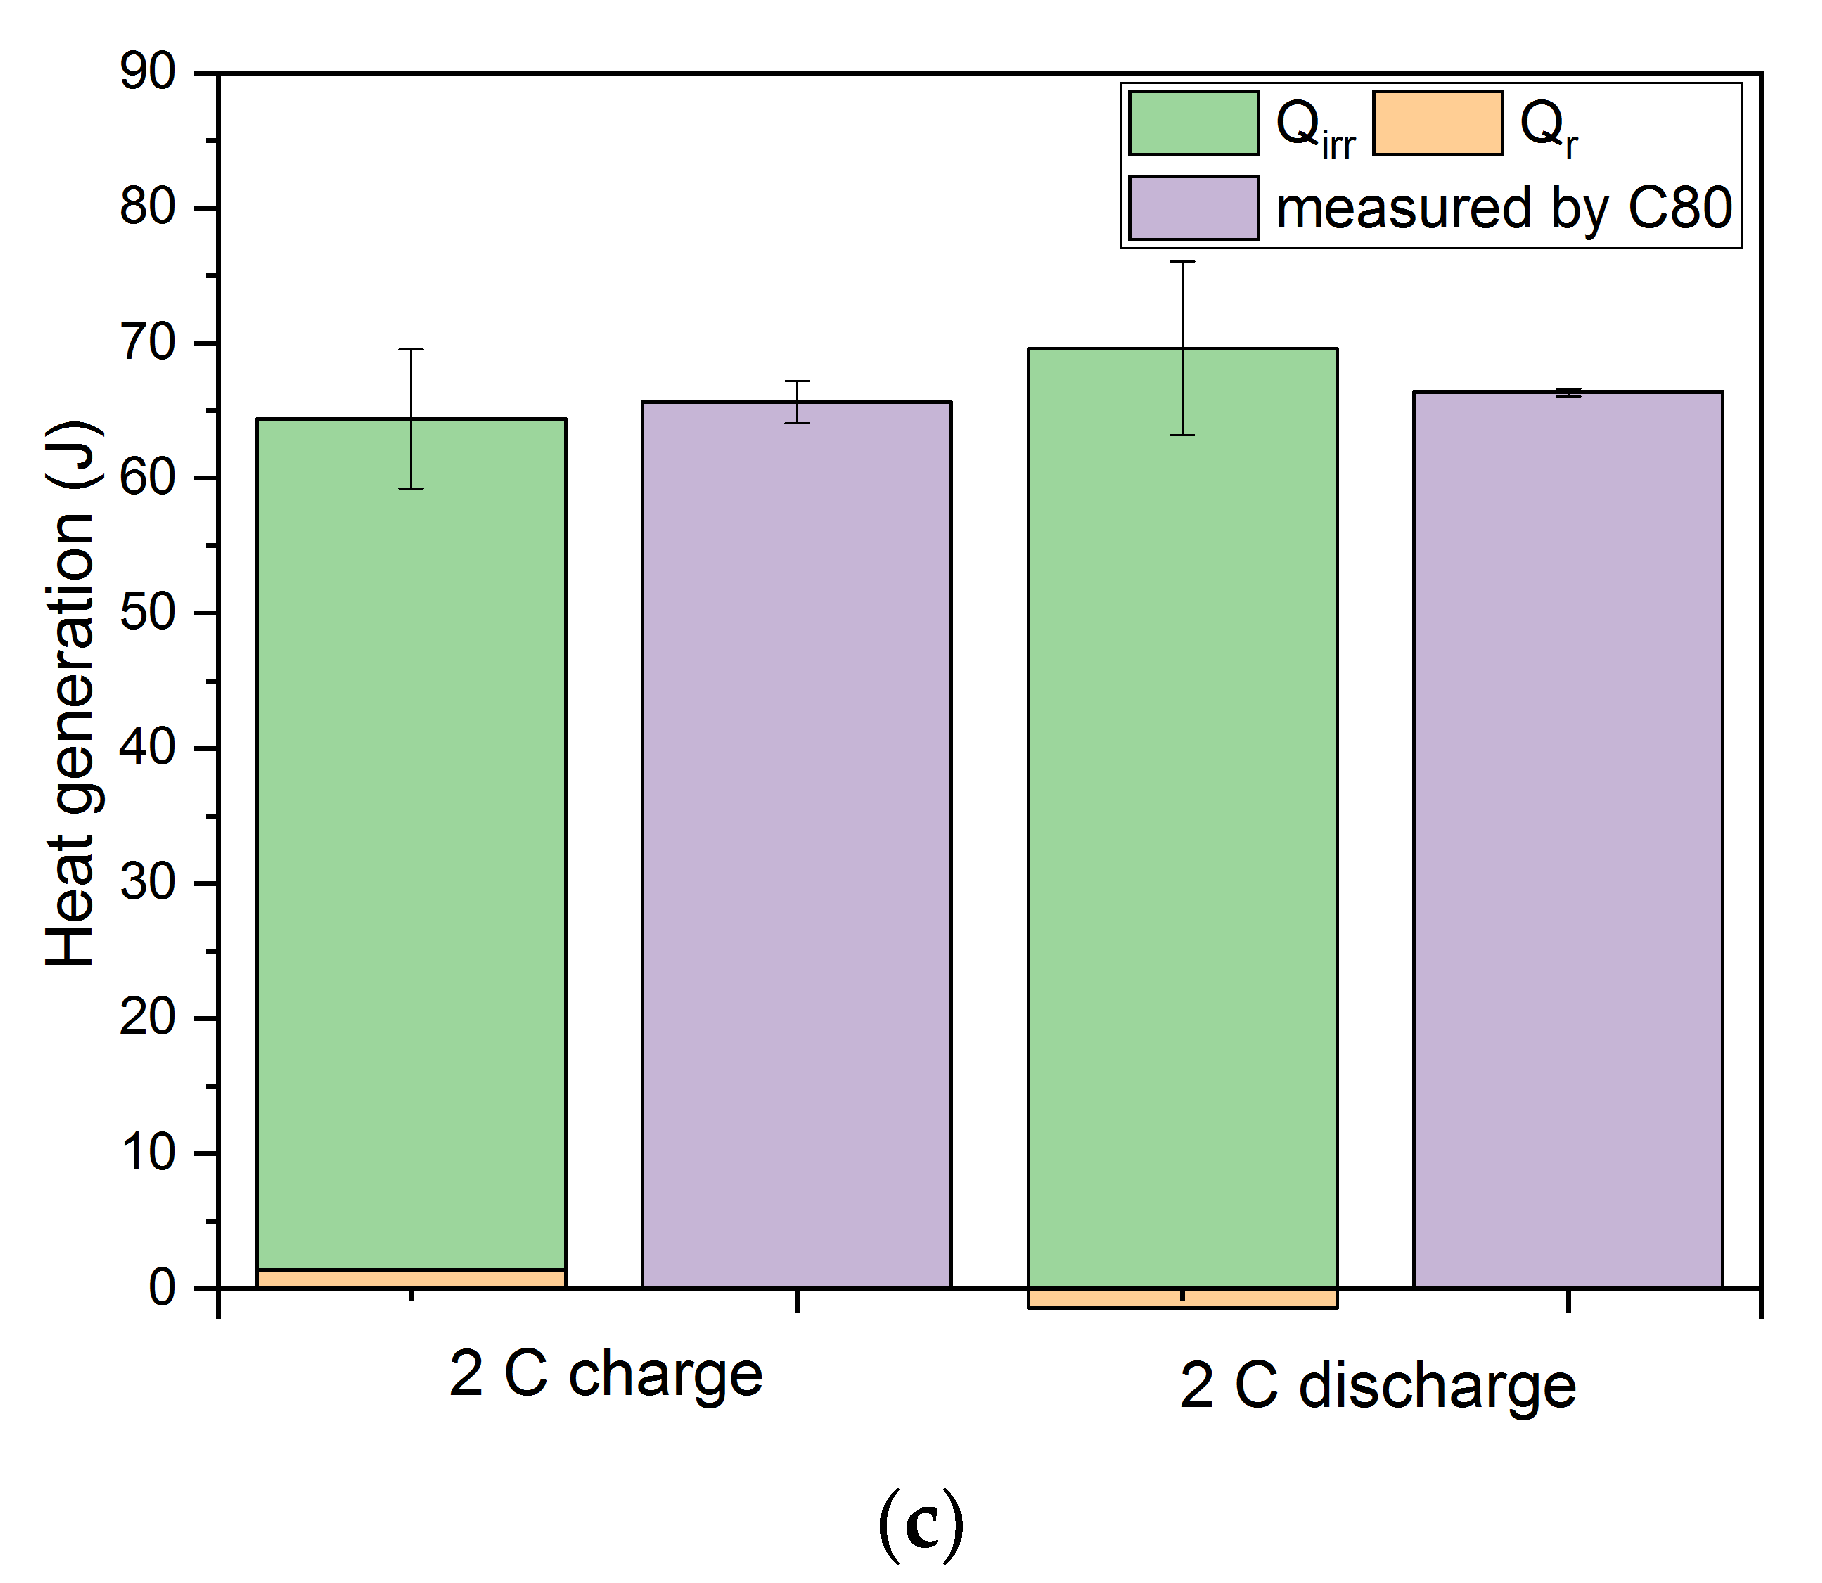
2.3. Total Heat Effect Measured by C80

In order to compensate for the perturbing effects of the cables, which are introduced into the calorimeter for the cell cycling, a so-called Joule-effect calibration was performed using a defined heat input by a current flow through an internal resistance device. This is an important step for every calorimetric measurement [18] since it allows the computation of a conversion factor or calibration coefficient, respectively, and the estimation of the uncertainty of the measurement. The current values have been chosen in order to cover the typical heat flow rates (Figure 7) in a calorimetric measurement in the C80. The heat dissipated by the resistance device is calculated by integration over time and the comparison with the measured values of the C80 gives the calibration coefficient as a result. As can be seen in Table 2 the calibration coefficient shows a constant value of 1.03 and no variation with the heat flow rate. The calibration was repeated three times, in order to confirm sufficient reproducibility.
The heat flow rates measured in the C80 calorimeter during cycling at different charging/discharging rates are shown in Figure 8. At the beginning of charging at the lowest rate of 0.5 C, a small cooling effect is visible. This cooling effect was also reported in earlier studies [19,20] and can be explained by the entropy change in early stages of the Li+ deintercalation of the cathode and the following intercalation of the anode. The beginning and the end of the charging and discharging period, respectively, are as expected generating discriminable peaks in the heat flow rate. Furthermore, the difference between the heat flow characteristics on charging and discharging is caused by the fact that the values of the entropy change, and consequently, the reversible heat flow rate changes the sign.
The heat generation during the charge/discharge process was calculated by integration of the measured heat flow rate over time using the individual contribution from the measured overpotential and the entropy change (Equation (5)). The results are shown in Table 3 in comparison with corresponding integrated heat data from measurement in the calorimeter.
The results of the measurements of the heat flow rate as a function of the SOC or DOD are shown in Figure 9 at different charging and discharging rates. The values along the straight line were measured during the cycling process in the C80 calorimeter, while the data points were calculated based on the results of the electrochemical impedance spectroscopy (EIS), the GITT, and the entropy change measurement, which allowed the determination of the irreversible and reversible part of the heat flow.
The total amount of the generated heat measured in the calorimeter (C80) compared to the contribution of the irreversible Qirr and the reversible part Qr is shown in Figure 10. At the highest C rate, the deviations of the calculated from the measured results for charging and discharging process, respectively, are both reaching minimum values. The deviation for all C-rates falls into the range of +/− 5%.

3. Discussion

3.1. Internal Resistances Definition and the Corresponding Irreversible Heat Effect

The diffusion impedance and charge transfer impedance are increasing with decreasing SOC, which can be associated with a shift of the local minimum in the EIS spectra (Figure 2) to higher resistance values.
Since the ohmic resistance is determined by EIS measurement, which almost does not vary with the SOC, the charge transfer overpotential can be separated from the IR-drop (Figure 3) using the following equation:
η C T =   η I R   η Ω =   η I R I · R Ω .
Furthermore, also the diffusional part ηD of the overpotential can be extracted from GITT data at longer relaxation times. According to Equation (6), the three parts of irreversible heat, i.e., Q c t ˙ , Q Ω ˙ and Q D ˙ , can be calculated by multiplying the applied currents for charging and discharging process [13].
In Figure 4, the values of the generated heat due to diffusion impedance and charge transfer are increasing strongly at higher current densities in a nonlinear way. The heat flow rate due to diffusion is the dominating contribution at 0.5 C. At the higher C-rates of 1 and 2 C, respectively, this effect levels out to nearly equal contributions from diffusion and charge transfer with an exception of the highest discharge rate 2 C where the heat effect by the charge transfer tends to be the strongest. The values of the heat generation due to diffusion and charge transfer are different for charging and discharging. For the diffusional heat flow rates during the charge process, respectively, there seems to be a local maximum at around 50% SOC on charging and between 60% and 70% DOD during discharging. Similar effects were observed by other authors [21,22] and were explained by kinetic and thermodynamic arguments. However, the diffusion and charge transfer parts of the heat during the discharge process show a trend to maximum values at deep discharge. The corresponding maximum heat flow rates for 0.5, 1, and 2 C are all higher on discharging than on charging.

3.2. Total Heat Effect Measured by C80

Towards higher C-rates, the relative contribution of the reversible heat to the total heat effect decreases due to the increasing contribution of the irreversible heat flow rate leading to a stronger deviation from equilibrium.
The heat generated during charging is close to the corresponding value on discharging and increases approximately linear with increasing current flow. The difference in the generated heat between charging and discharging processes is not that pronounced as it could be anticipated from the measurements of the heat flow rates but tends to get smaller from the lowest to the highest C-rates.
In Figure 9, the calculated data points are in qualitative agreement with the heat flow rate measured in the calorimeter, but they tend to deviate from the lowest C-rate to the higher ones. Therefore, it can be assumed that the heat generation amount can be represented by individual contributions from the internal resistance calculated from the measured overvoltage. The deviation can be explained by the complex dependence of ηCT and ηD on the SOC/DOD and the charging/discharging current density, respectively. Furthermore, since the deviations seem to increase with increasing charging/discharging rates, there might be also a growing influence of chemical side reactions, which are not considered in the calculation using the overpotentials.
As already discussed for the results of the EIS and GITT measurements (Figure 3), the influence of the diffusion and charge transfer are especially pronounced at deep discharge, therefore the cells need an extended time to reach the equilibrium state again. This is reflected in the difficulties of the entropy change and internal resistances measurement at low SOCs as well as high DODs. The accuracy of the thermal behavior analysis based on overpotential contributions relies strongly on achieving an equilibrium.

4. Materials and Methods

The investigated commercial coin cells had a nominal capacity of 85 mAh with LiNi0.6Mn0.2Co0.2O2 as cathode material and graphite as anode material. The specified operation voltage window was between 3.0 and 4.2 V. The total heat generation was investigated by a Tian-Calvet calorimeter (C80, SETARAM Instrumentation, Caluire, France) under an isothermal condition at 30 °C. The temperature was measured at the surface of the cell by an attached thermocouple (K-type) and data were recorded as a function of time by a data logger (PicoLog, Pico Technology, St. Neots, Cambridgeshire, UK). The cells were cycled with 0.5 C (42.5 mA), 1 C (85 mA), and 2 C (170 mA) rates using a battery cycler (Gamry Reference 3000TM, Gamry Inc., Warminster, PA, USA). The CCCV (constant current constant voltage) method was implemented for charging (4.2 V) and CC for discharging (3.0 V), which means charging at constant current with the respective rate, followed by charging with the upper voltage limit until the current decreases to C/20. Afterwards, the cells were discharged with the respective C rate until the minimal voltage was reached.
A joule effect calibration was performed with a standard resistance of 9.85 Ω (tolerance 5%) before the measurements in order to calibrate the heat flow rates. The calibration coefficient was calculated by the ratio of electrical power input and measured heat flow rates.
The principle of the entropy change measurement was described by several authors [9,10]. The entropy data can be obtained by monitoring the change of the OCV as a function of temperature. After charging to 100% SOC, the entropy change of the cells was measured with 10% decrements of the SOC. After reaching the selected SOC, the cells were relaxed for 3 h to establish an equilibrium at a given temperature level starting at 15 °C and ending at 35 °C with increments of 5 °C. The average voltage values within the last 30 min of the 3 h interval were used for the calculation of the entropy change. The measurements were repeated for three cells.
Electrochemical impedance spectroscopy (EIS) measurements were carried out using the AC-impedance measurement function of the Gamry Reference 3000TM at room temperature. The impedance of the coin cells was determined with an AC-current of 140 µA and with frequencies ranging from 20 kHz to 0.01 Hz. The impedance was measured at every SOC level after a relaxation time of 3 h.
Internal resistances were determined by the galvanostatic intermittent titration technique (GITT) using the voltage drop under load compared to the equilibrium voltage (OCV) using Gamry Reference 3000TM at room temperature. The voltage difference was measured at different current loads corresponding to rates of 0.5, 1, and 2 C at 30 °C, respectively. The OCV values were taken after waiting for 3 h following the charging step at the given SOC.

5. Conclusions

In this work, the heat generation in commercial coin cells during cycling was determined by a combination of calorimetric measurements with electrochemical impedance spectroscopy (EIS) and current interruption technique (GITT). Using the data of the EIS and GITT measurements, the heat flow rates could be separated into contributions from the ohmic resistance, charge transfer, and diffusion processes. Based on these individual parts, the total irreversible heat flow was calculated. The reversible heat flow was evaluated from measurements of the OCV at different temperatures as a function of the SOC and DOD, respectively, which allows the determination of the entropy change. Based on the measured individual contributions to the heat flow and generated heat, the total amount of heat was calculated. These values were compared with the data from the calorimetric measurements and were found to be in a good agreement. Therefore, it can be concluded that this kind of approach can be used to achieve a deeper insight into the heat generation processes of Li-ion batteries.

Author Contributions

Conceptualization, H.J.S. and M.R.; methodology, W.Z.; software, W.Z.; validation, C.Z., I.U.M. and M.R.; formal analysis, W.Z. and M.R.; investigation, W.Z.; resources, C.Z. and M.R.; data curation, W.Z.; writing—original draft preparation, W.Z.; writing—review and editing, M.R., C.Z., I.U.M., and H.J.S.; visualization, W.Z. and I.U.M.; supervision, C.Z., M.R., and H.J.S.; project administration, H.J.S.; funding acquisition, H.J.S. All authors have read and agreed to the published version of the manuscript.

Funding

This research was funded by the German Research Foundation (DFG) under the Project ID 390874152 (POLiS Cluster of Excellence). W.Z. received additional funding from the Helmholtz Association.

Acknowledgments

The authors gratefully acknowledge the support of C. Gebert and N. Uhlmann in the EIS, GITT, and the calorimetric measurements. This work contributes to the research performed at CELEST (Center of Electrochemical Energy Storage Ulm-Karlsruhe).

Conflicts of Interest

The authors declare no conflict of interest. The funders had no role in the design of the study; in the collection, analyses, or interpretation of data; in the writing of the manuscript; or in the decision to publish the results.

References

  1. Zubi, G.; Dufo-López, R.; Carvalho, M.; Pasaoglu, G. The lithium-ion battery: State of the art and future perspectives. Renew. Sustain. Energy Rev. 2018, 89, 292–308. [Google Scholar] [CrossRef]
  2. Kim, T.; Song, W.; Son, D.-Y.; Ono, L.K.; Qi, Y. Lithium-ion batteries: Outlook on present, future, and hybridized technologies. J. Mater. Chem. A 2019, 7, 2942–2964. [Google Scholar] [CrossRef]
  3. Wang, X.; Ding, Y.; Deng, Y.; Chen, Z. Ni-Rich/Co-Poor Layered Cathode for Automotive Li-Ion Batteries: Promises and Challenges. Adv. Energy Mater. 2020, 10, 1903864. [Google Scholar] [CrossRef]
  4. Thackeray, M.; David, W.; Bruce, P.; Goodenough, J. Lithium insertion into manganese spinels. Mater. Res. Bull. 1983, 18, 461–472. [Google Scholar] [CrossRef]
  5. Luo, W.; Zhou, F.; Zhao, X.; Lu, Z.; Li, X.; Dahn, J.R. Synthesis, characterization, and thermal stability of LiNi1/3Mn1/3Co1/3-zMgzO2, LiNi1/3-zMn1/3Co1/3MgzO2 and LiNi1/3Mn1/3-zCo1/3MgzO2. Chem. Mater. 2010, 22, 1164–1172. [Google Scholar] [CrossRef]
  6. Rozier, P.; Tarascon, J.M. Review—Li-Rich layered oxide cathodes for next-generation Li-Ion batteries: Chances and challenges. J. Electrochem. Soc. 2015, 162, A2490–A2499. [Google Scholar] [CrossRef]
  7. Tang, A.; Huang, K. Electrochemical properties and structural characterization of layered LixNi0.35Co0.3Mn0.35O2+δ cathode materials. Mater. Sci. Eng. B 2005, 122, 115–120. [Google Scholar] [CrossRef]
  8. Eddahech, A.; Briat, O.; Vinassa, J.-M. Thermal characterization of a high-power lithium-ion battery: Potentiometric and calorimetric measurement of entropy changes. Energy 2013, 61, 432–439. [Google Scholar] [CrossRef]
  9. Lu, W.; Belharouak, I.; Vissers, D.; Amine, K. In situ thermal study of Li1+x[Ni1/3 Co1/3Mn1/3]1-xO2 using isothermal micro-clorimetric techniques. J. Electrochem. Soc. 2006, 153, A2147–A2151. [Google Scholar] [CrossRef]
  10. Huggins, R.A. Advanced Batteries: Materials Science Aspects; Springer: New York, NY, USA, 2009. [Google Scholar]
  11. Viswanathan, V.V.; Choi, D.; Wang, D.; Xu, W.; Towne, S.; Williford, R.E.; Zhang, J.-G.; Liu, J.; Yang, Z. Effect of entropy change of lithium intercalation in cathodes and anodes on Li-ion battery thermal management. J. Power Sources 2010, 195, 3720–3729. [Google Scholar] [CrossRef]
  12. Al Hallaj, S.; Venkatachalapathy, R.; Prakash, J.; Selman, J.R. Entropy changes due to structural transformation in the graphite anode and phase change of the LiCoO2 cathode. J. Electrochem. Soc. 2000, 147, 2432–2436. [Google Scholar] [CrossRef]
  13. Manikandan, B.; Yap, C.; Balaya, P. Towards understanding heat generation characteristics of Li-Ion batteries by calorimetry, impedance, and potentiometry studies. J. Electrochem. Soc. 2017, 164, A2794–A2800. [Google Scholar] [CrossRef]
  14. Heubner, C.; Schneider, M.; Michaelis, A. Detailed study of heat generation in porous LiCoO2 electrodes. J. Power Sources 2016, 307, 199–207. [Google Scholar] [CrossRef]
  15. JCGM 100(2008). Evaluation of Measurement Data: Guide to the Expression of Uncertainty in Measurement (GUM 1995 with Minor Corrections, 1st ed.; Bureau International des Poids et Mesures: Sevres, France, 2010. [Google Scholar]
  16. Yazami, R.; Maher, K. Thermodynamics of Lithium-Ion Batteries. In Lithium-Ion Batteries: Advances and Applications; Pistoia, G., Ed.; Elsevier BV: Amsterdam, The Netherlands, 2014; pp. 567–604. [Google Scholar]
  17. Zhang, W.; Jiang, L.; Van Durmen, P.; Saadat, S.; Yazami, R. A combined thermodynamics & computational method to assess lithium composition in anode and cathode of lithium ion batteries. Electrochim. Acta 2016, 214, 56–67. [Google Scholar] [CrossRef]
  18. Sarge, S.M.; Höhne, G.W.; Hemminger, W. Calorimetry; Wiley-VCH: Weinheim, Germany, 2014. [Google Scholar]
  19. Williford, R.E.; Viswanathan, V.V.; Zhang, J. Effects of entropy changes in anodes and cathodes on the thermal behaviour of lithium ion battery. J. Power Sources 2009, 189, 101–107. [Google Scholar] [CrossRef]
  20. Hong, J.; Maleki, H.; Al Hallaj, S.; Redey, L.; Selman, J.R. Electrochemical-calorimetric studies of lithium-ion cells. J. Electrochem. Soc. 2019, 145, 1489–1501. [Google Scholar] [CrossRef]
  21. Ovejas, V.J.; Cuadras, A. State of charge dependency of the overvoltage generated in comercial Li-ion cells. J. Power Sources 2019, 418, 176–185. [Google Scholar] [CrossRef]
  22. Aurbach, D. A short review of failure mechanisms of lithium metal and lithiated graphite anodes in liquid electrolyte solutions. Solid State Ion. 2002, 148, 405–416. [Google Scholar] [CrossRef]
Figure 1. Voltage as a function of the discharge capacity QDischarge for three different discharging rates.
Batteries 06 00055 g001
Figure 2. Room temperature impedance spectra for various state of charges (SOCs) with 0.5 C rate.
Batteries 06 00055 g002
Figure 3. Charging (0.5 C rate) pulse followed by a relaxation time of 3 h.
Batteries 06 00055 g003
Figure 4. Irreversible heat flow rates due to ohmic, charge transfer, and diffusion impedances during charge and discharge versus SOC (left) and depth of discharge (DOD) (right).
Batteries 06 00055 g004
Figure 5. The total irreversible heat flow rates during charge (a) and discharge (b) with various C-rates versus SOC and DOD at 30 °C.
Batteries 06 00055 g005
Figure 6. The entropy change versus SOC: ▲ the results from [15], ○ this work, and ■ the results from [16].
Batteries 06 00055 g006
Figure 7. The heat flow rates for joule effect calibrations.
Batteries 06 00055 g007
Figure 8. Heat flow rates measured by C80 calorimeter versus time at 30 °C for different applied current rates: (a) 0.5 C, (b) 1 C, and (c) 2 C.
Batteries 06 00055 g008aBatteries 06 00055 g008b
Figure 9. Comparison of calculated heat flow rates versus SOC/DOD under different C-rates and heat flow rates measured by C80 calorimeter: (a) charging with 0.5 C; (b) discharging with 0.5 C; (c) charging with 1 C; (d) discharging with 1 C; (e) charging with 2 C; (f) discharging with 2 C.
Batteries 06 00055 g009aBatteries 06 00055 g009b
Figure 10. The comparison of total heat generation during charging (SOC 100%) and discharging (DOD 100%) measured by calorimetry and calculated results at different C rates using the individual overpotential contributions to Qirr and the entropy change data of Qr. (a) 0.5 C; (b) 1 C; (c) 2 C.
Batteries 06 00055 g010aBatteries 06 00055 g010b
Table 1. Maximum heat flow rates due to diffusion and charge transfer impedance for the charge and discharge process at different C rates.
Heat Flow Rate ContributionMaximum Heat Flow Rate during Charge Process (Mw)Maximum Heat Flow Rate during Discharge Process (Mw)
Current at 1 C = 85 mA0.5 C1 C2 C0.5 C1 C2 C
Q D ˙ 1.8 ± 0.35.8 ± 0.422.4 ± 2.75.5 ± 0.215.7 ± 1.225.4 ± 3.5
Q C T ˙ 1.0 ± 0.15.3 ± 0.222.7 ± 3.52.4 ± 0.039.3 ± 1.634.4 ± 6.0
Table 2. Calibration coefficients for different heat flow rates.
Current (A)Power Range (Mw)Heat Effect (J)Measured Heat Effect (J)Calibration Coefficient
0.010.992.072.021.03
0.0524.62129.17125.281.03
0.06541.60366.56355.571.03
Table 3. Calculated and measured total heat generation during cycling with various C-rates.
Current Flow
1 C = 85 Ma
Heat Determined Via C80 Calorimeter (J)Calculated Total Heat Generation (J)Deviation of Calculated from Measured Heat %
ChargeDischargeChargeDischargeChargeDischarge
0.5 C23.59 ± 1.6422.18 ± 2.0022.35 ± 1.6923.22 ± 2.4−5.244.70
1 C41.60 ± 0.4238.98 ± 0.7839.33 ± 2.6740.81 ± 2.47−5.464.70
2 C65.62 ± 1.5466.34 ± 0.3064.40 ± 5.1668.20 ± 6.43−1.872.80
Publisher’s Note: MDPI stays neutral with regard to jurisdictional claims in published maps and institutional affiliations.

