Article

Determining the Limits and Effects of High-Rate Cycling on Lithium Iron Phosphate Cylindrical Cells

1
WMG, The University of Warwick, 6 Lord Bhattacharyya Way, Coventry CV4 7AL, UK
2
School of Metallurgy and Materials, University of Birmingham, Elms Rd, Birmingham B15 2SE, UK
*
Author to whom correspondence should be addressed.
Submission received: 29 September 2020 / Revised: 17 November 2020 / Accepted: 19 November 2020 / Published: 23 November 2020

Abstract

:
The impacts on battery cell ageing from high current operation are investigated using commercial cells. This study utilised two tests–(i) to establish the maximum current limits before cell failure and (ii) applying this maximum current until cell failure. Testing was performed to determine how far cycling parameters could progress beyond the manufacturer’s recommendations. Current fluxes were increased up to 100 C cycling conditions without the cell undergoing catastrophic failure. Charge and discharge current capabilities were possible at magnitudes of 1.38 and 4.4 times, respectively, more than that specified by the manufacturer’s claims. The increased current was used for longer term cycling tests to 500 cycles and the resulting capacity loss and resistance increase was dominated by thermal fatigue of the electrodes. This work shows that there is a discrepancy between manufacturer-stated current limits and actual current limits of the cell, before the cell undergoes catastrophic failure. This presumably is based on manufacturer-defined performance and lifetime criteria, as well as prioritised safety factors. For certain applications, e.g., where high performance is needed, this gap may not be suitable; this paper shows how this gap could be narrowed for these applications using the testing described herein.

1. Introduction

Transport represents the biggest enabler for our transition to an energy sustainable society, and is reliant on device electrification. This includes the phasing out of vehicles powered exclusively by the internal combustion engine (ICE), and the continued development of a variety of electric vehicles (EVs) [1]. There exists several options for Li-based chemistries intended for effective automotive applications [2]. These contain cathode materials such as lithium iron phosphate (LFP), lithium nickel cobalt manganese oxide (NMC) and lithium nickel cobalt aluminium oxide (NCA) as cathode materials [2].
Charging parameters, infrastructure and timeframes are key considerations that will accelerate the speed of this transition. In order to travel a comparable distance to a vehicle powered by an ICE, charging an EV is necessary part way through the journey. There are several options for recharging; the most desirable for a consumer being a ‘fast charge’, which has a duration of 10 min [3]. For cells, this charge translates to a rate of 6 C, which places high stresses on the electrodes [2]. Operating limitations are essentially anchored by a simple, intrinsic electrochemical principle in Li-ion systems: diffusion-limited current density [4]. Charge transport and charge transfer mechanisms are quite complex, and to be effective they require a balanced flux of ions and electrons. This in turn relies on uniform electrode microstructures with minimal tortuosity, which is not always the reality in electrode manufacturing [5]. Moreover, fast charging is known to accelerate aging such that cycle life becomes compromised [2], and so there exists a trade-off between cycle life and performance. LFP has been shown to have the capability to endure fast charging, particularly in an asymmetric charge and discharge protocol [6]. More specifically, fast charging for 4500 cycles has been achieved [2], satisfying both cycle life and aging domains.
The capability to discharge cells at high rates is similarly important, as this provides the power to drive the vehicle. This capability is particularly important for HEVs, where the purpose of the battery is to assist in the acceleration and starting of the vehicle [7].
To operate a cell above the manufacturer’s specification involves verification that the cell will not enter into a thermal runaway sequence, and this is carried out with a significant amount of additional testing, termed abuse testing. This has commonly focused around worst-case scenarios—for instance overcharging —which often results in catastrophic failure and eventual thermal runaway of the cell [8,9]. There have been fewer tests carried out to determine the “roll over” effect, in terms of the maximum amount of current a cell can sustain whilst remaining functional. Rollover failure is a turning point in performance where the rate of capacity fade accelerates rapidly over relatively few cycles [10].
In this work, we develop and establish such an abuse test to ascertain the maximum current limit that the cell can tolerate within manufacturer stated voltage limits, prior to showing signs of deterioration. Subsequently we perform aging tests at this maximum current until the cell is degraded, followed by close examination of the cell. The approach will give insight into the performance characteristics of the cell in test conditions beyond those outlined in the manufacturer’s specification. This allows better understanding of electrochemical and thermal limitations of these commercial cells.

2. Results and Discussion

2.1. Cell Testing and Characterisation

2.1.1. Cell Failure Test

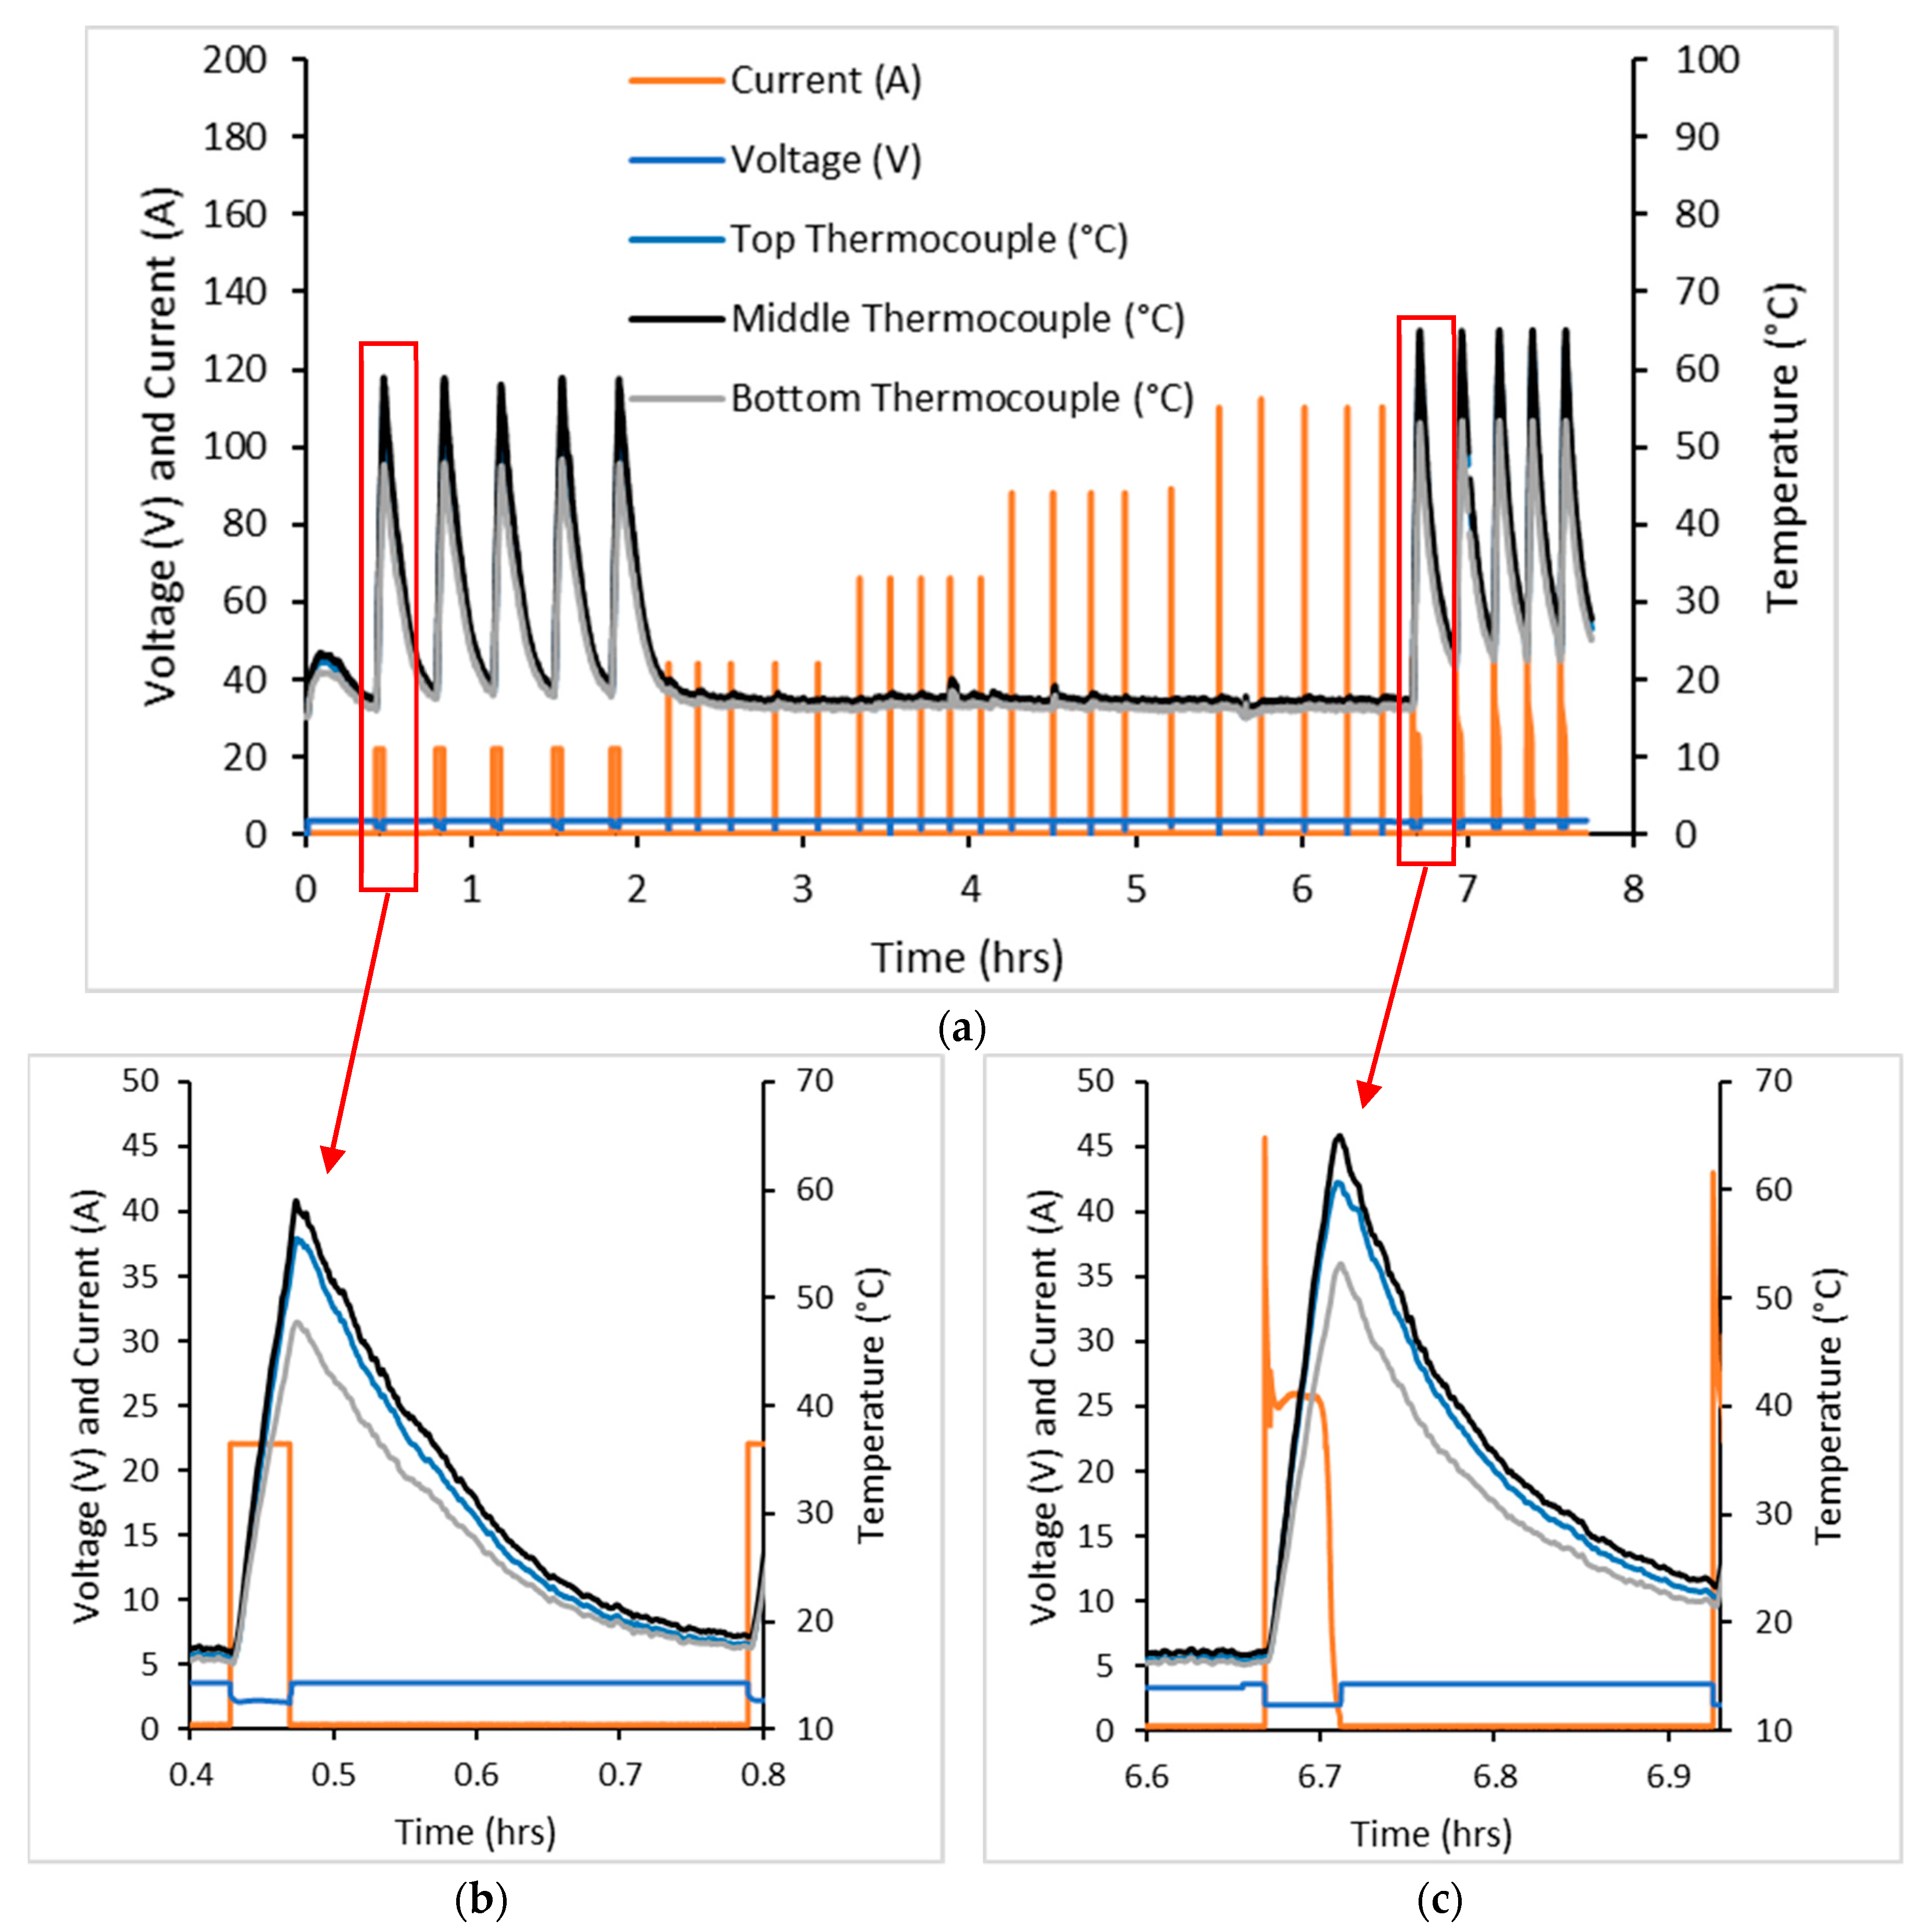
Three cells were tested in the cell failure test with typical data shown by Figure 1. Due to the equipment capabilities, currents were only able to be logged for the discharge process. Cell surface temperatures were logged for the entire process.
For this test, 20 C constant current (CC) and constant voltage (CV) were applied to charge the cell followed by 20 C CC discharge. This charge and discharge cycle was applied five times and increased by 20 C a further five times until 100 C was applied. The final five cycles involved 20 C CC and CV charge followed by CV discharge.
Cell temperatures rose by approximately 35 °C during the first five cycles of the test, but with further current increases they only rose by 2 °C. This was due to the testing equipment registering maximum and minimum voltages rapidly, such that the current was only applied for a short period of time, resulting in minimal change in cell temperature. The final CV discharge steps resulted in a cell temperature change of 40 °C higher than the CC discharge steps. Despite this testing regime, the cell did not undergo thermal runaway nor fail catastrophically.
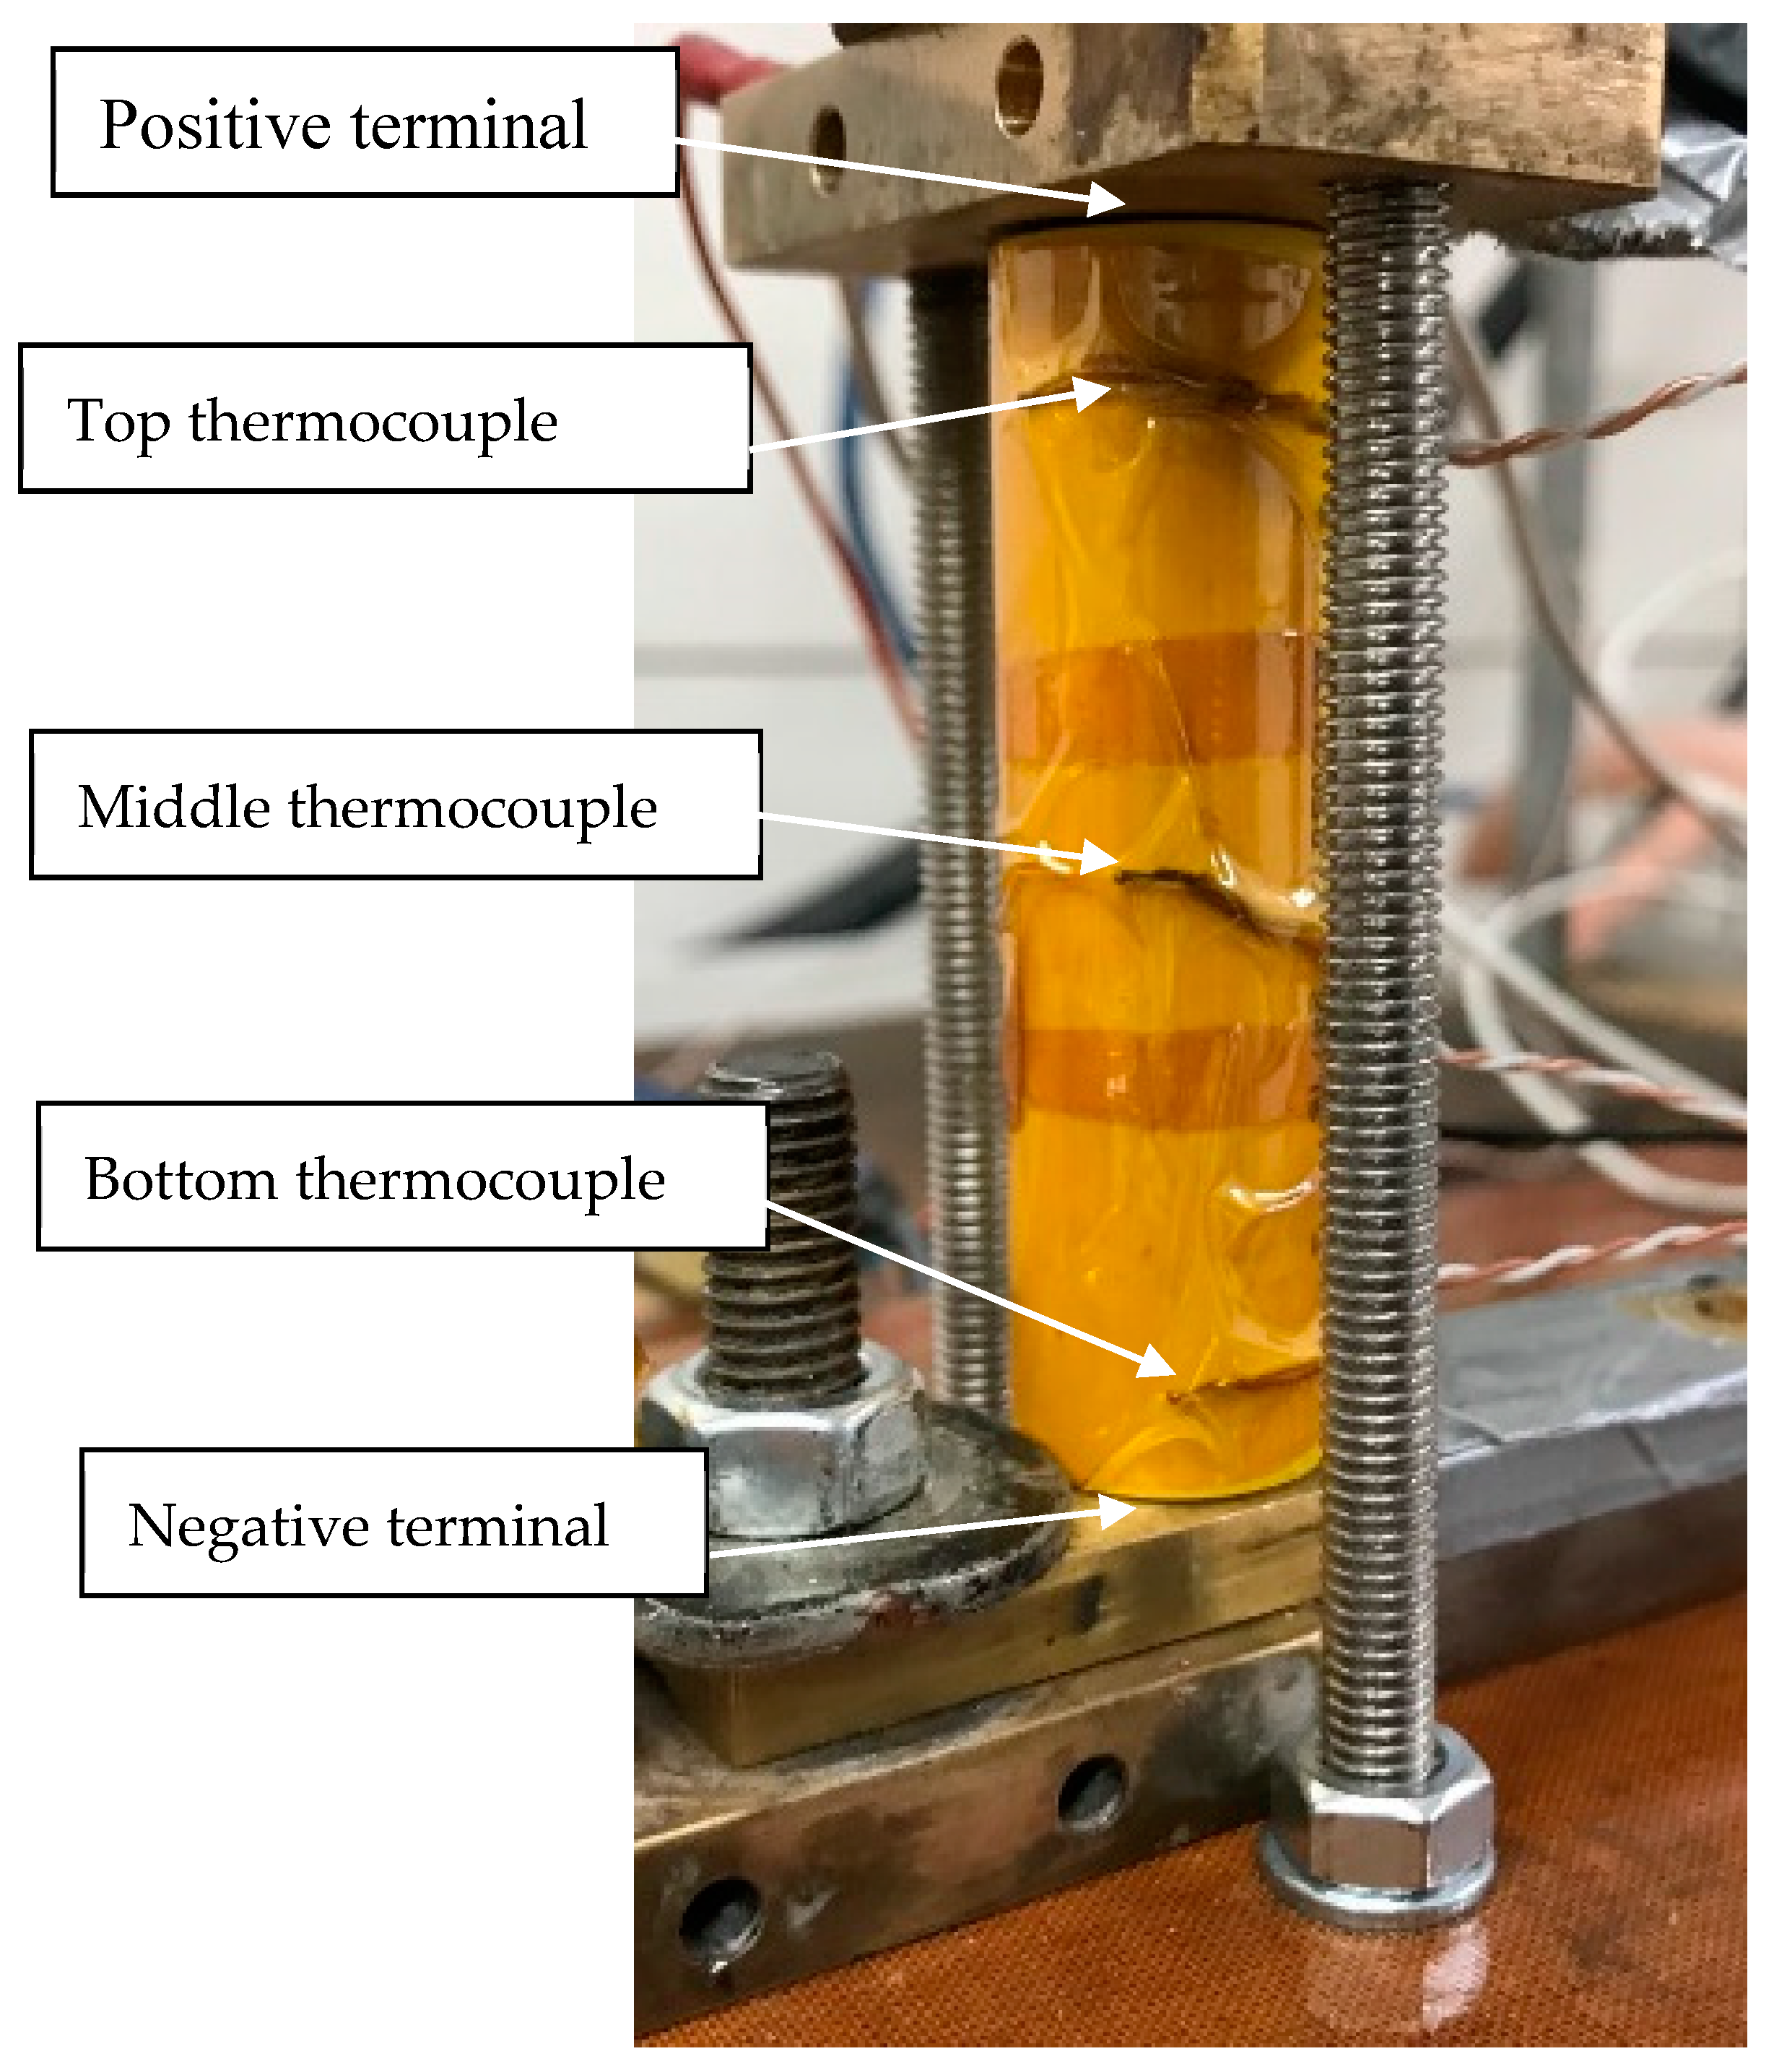
Temperatures were logged at three locations on the outside surface of the cell during cell failure testing. This included the top (positive end), the middle and the bottom of the cell (negative end). The temperature of the cell increased markedly in discharge, with the middle of the cell increasing the most out of the three thermocouples. There was a 10 min pause after charging but no pause after discharge, so that charging of the cell took place as soon as the minimum operating voltage was achieved. As can be seen, temperatures of the cell increased after the discharge was stopped. This is likely to be due to:
  • Further temperature increases were experienced from discharge followed by charge
  • Temperature increases are only from discharge, with the latter being possible as a result of the heat taking some time to dissipate out of the cell.
The cell failure test showed that the maximum current that the cell could still function and safely withstand was 20 C. This current was applied in the high rate cycling test.

2.1.2. High Rate Cycling Test

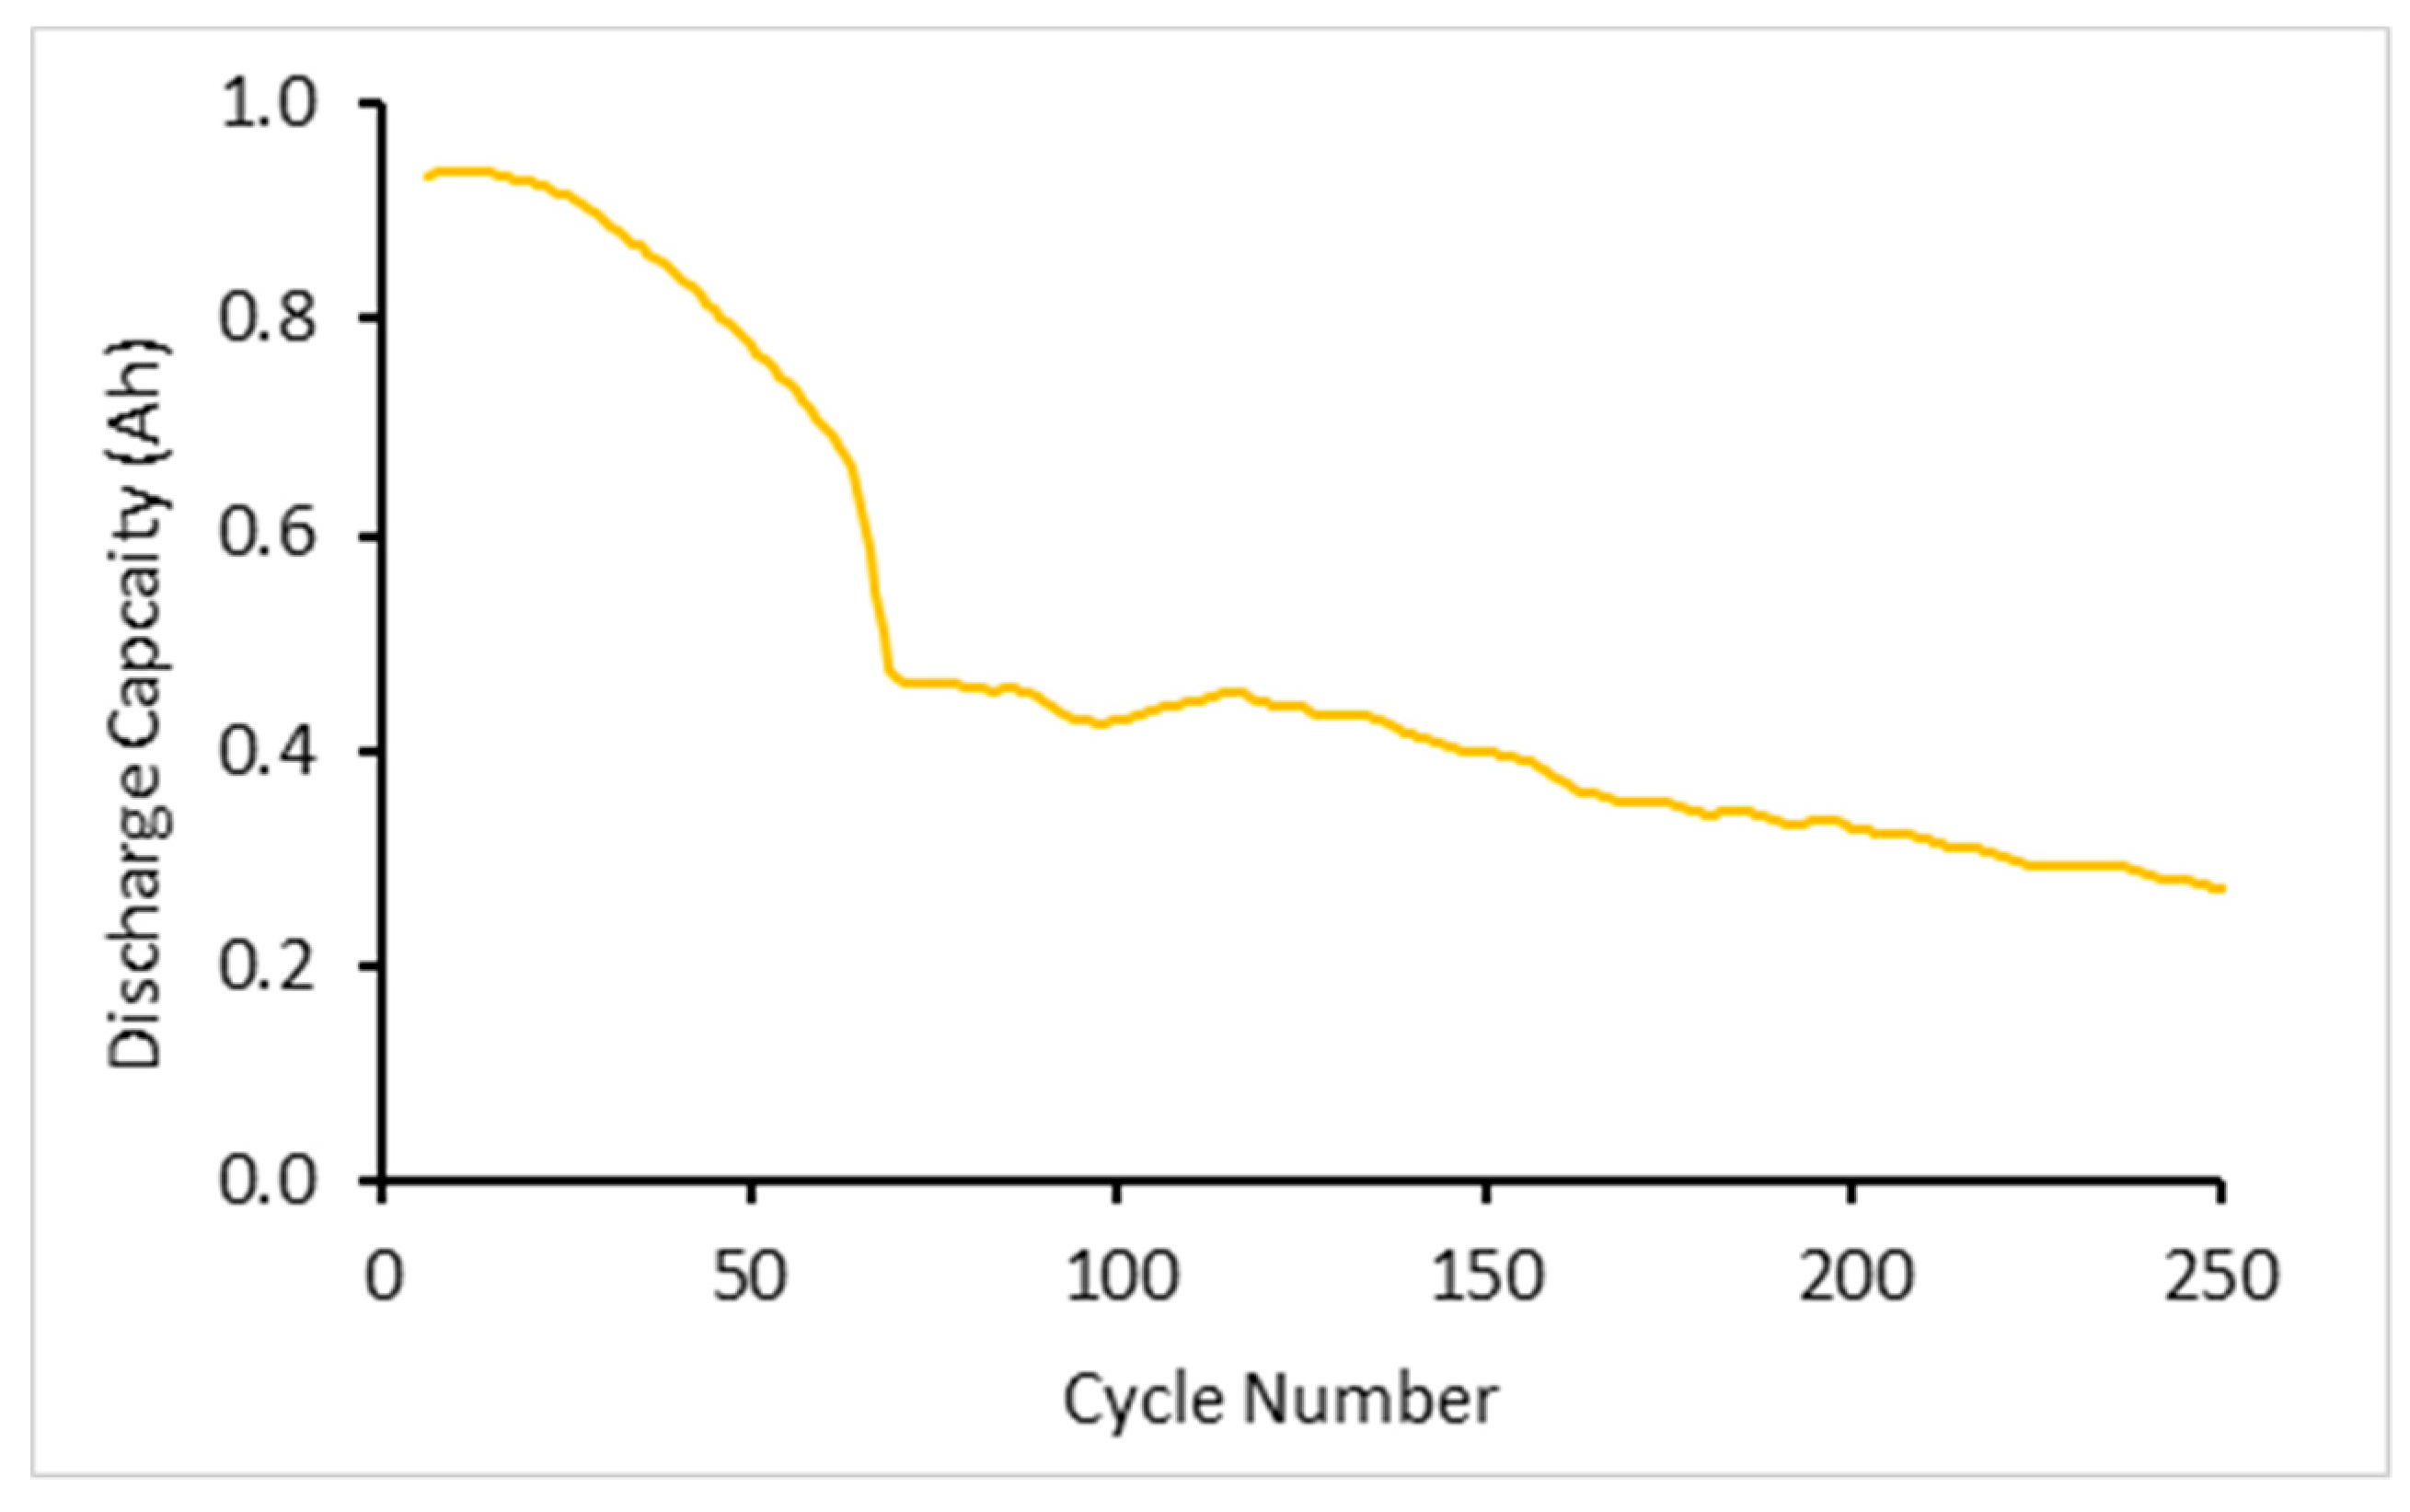
Three cells were subjected to high rate cycling tests involving applying currents of 20 C CC followed by CV in charge and 20 C CC discharge for a total of 500 cycles. Figure 2 shows the average discharge capacity for the first 250 cycles. The discharge capacity rapidly declines in the first 60 cycles. This is likely to be due to the onset of deformation within the jellyroll as well as the formation of plating. Neither of these effects are reversible nor observed in the subsequent analysis. Furthermore, the average capacity of the cells under 20 C cycling conditions for both charge and discharge was shown to decrease by 13.6% due to testing with these currents, explaining the initial and continual drop from manufacturer stated 1.1 Ah.
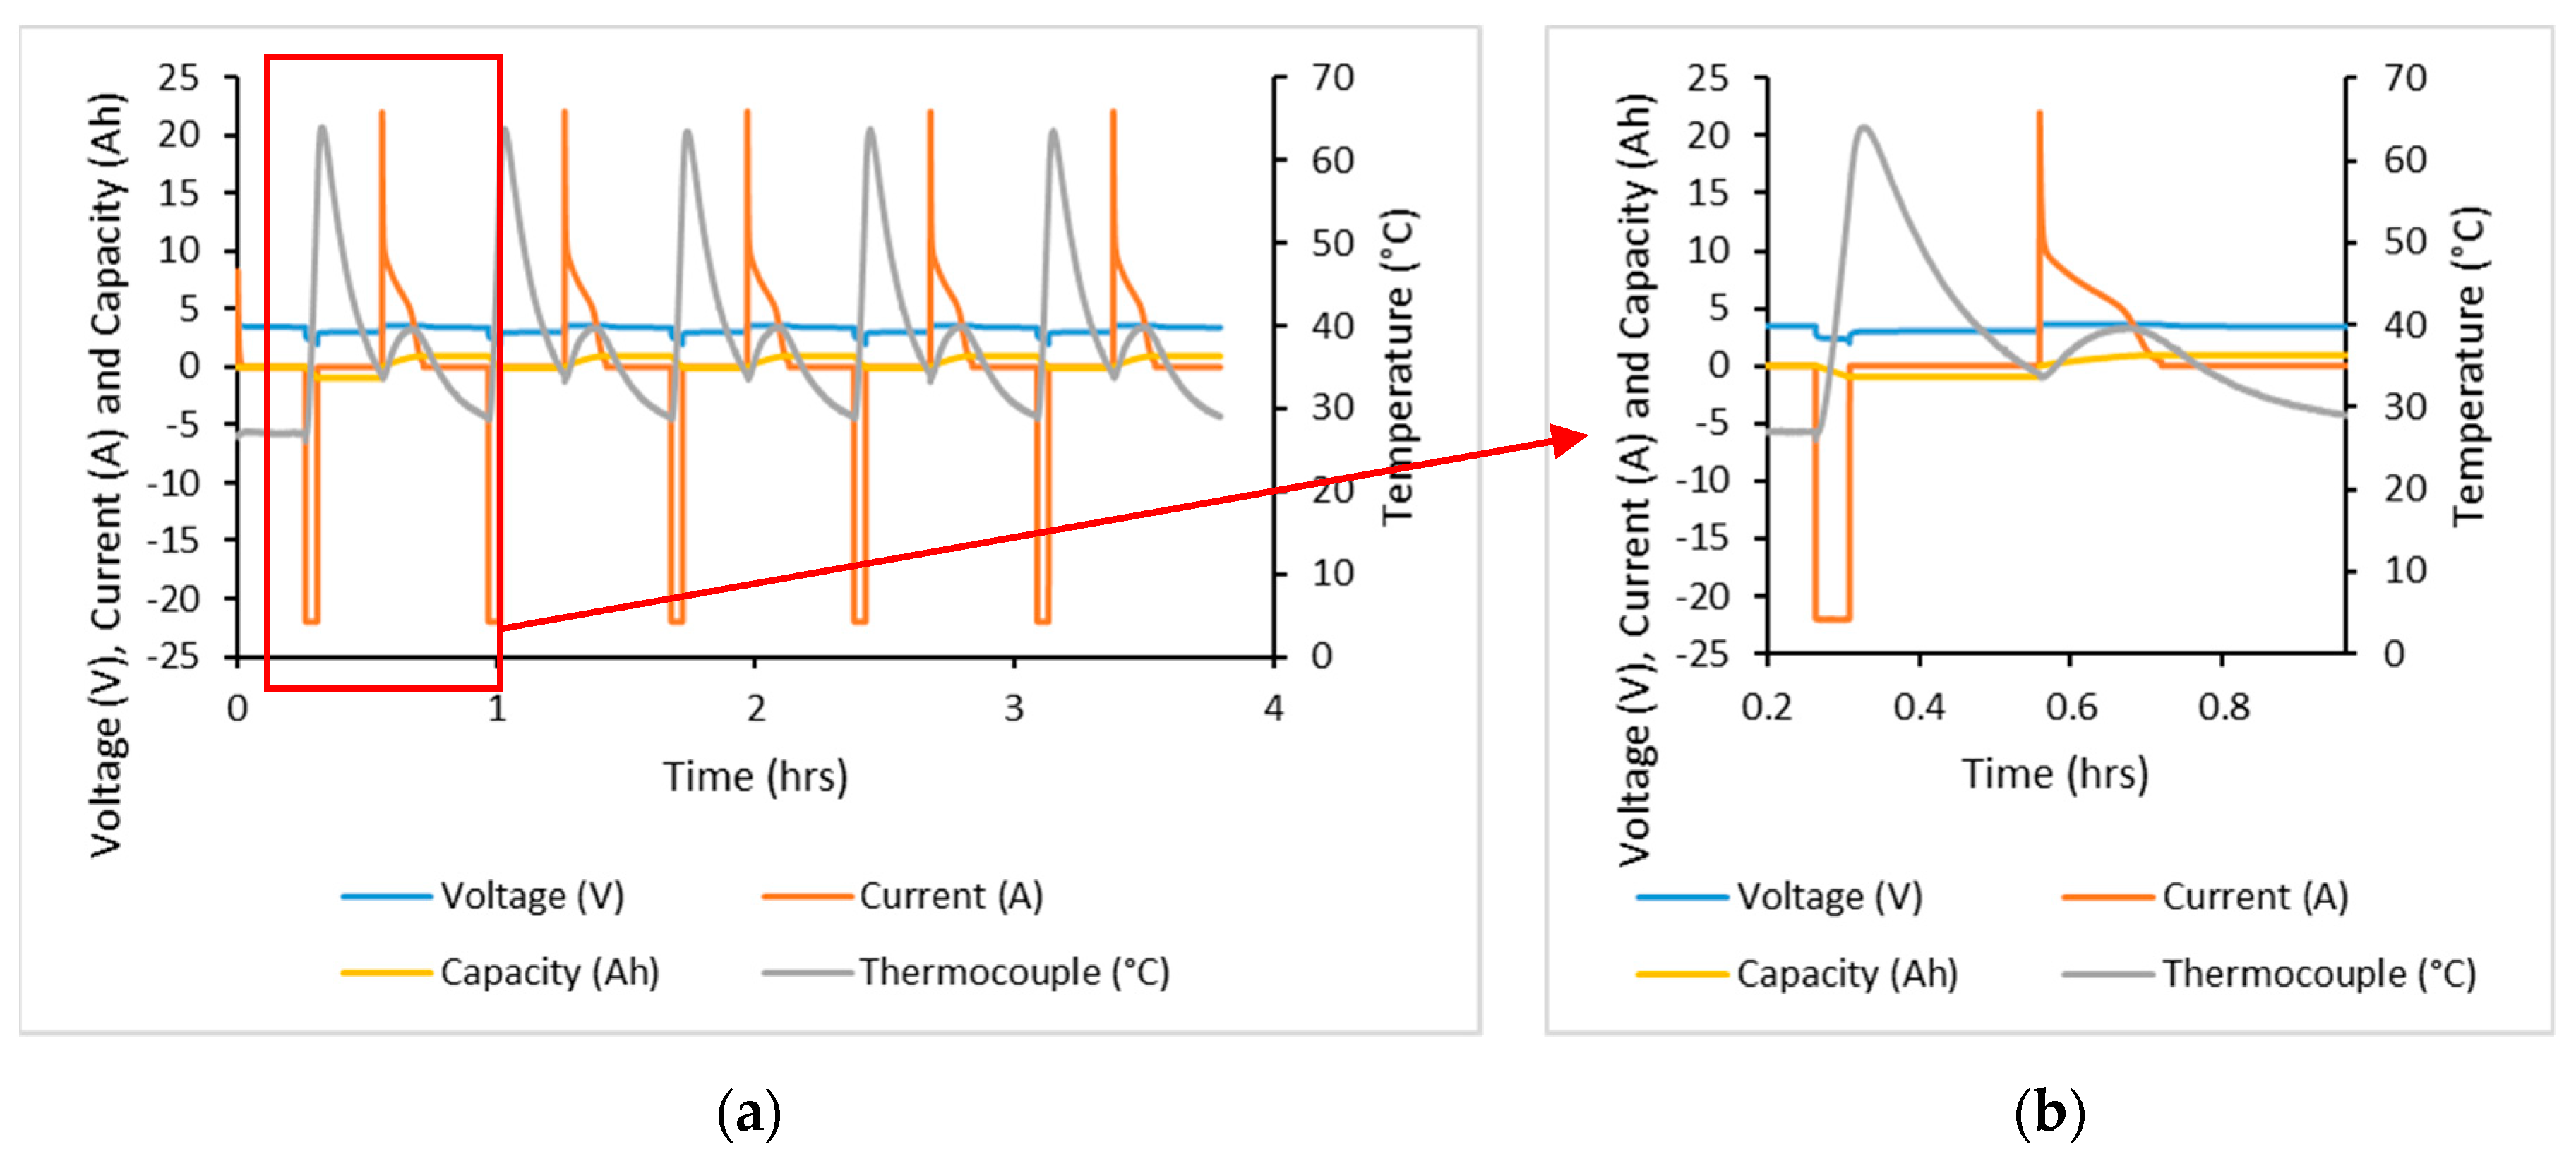
A thermocouple was attached to the cell surface at the middle of the cell, giving temperature profiles as shown by Figure 3. With a 15 min pause after both charging and discharging in this test, the temperature profile of these two events could be viewed separately. Discharging resulted in the largest increase in temperature with a change in temperature of 34.7 °C. Charging resulted in a change in temperature of 5.6 °C, though temperatures were consistent throughout cycling. Furthermore, the manufacturer’s datasheet specified that the maximum cell temperature was 85 °C at the cell surface; testing did not achieve this temperature.
Other studies have shown less temperature difference between charge and discharge [11]. At 5 C the outside cell temperatures from charge and discharge events have been shown to be 25.2 °C and 25.1 °C, respectively. For high rates, such as 20 C, it is believed there is a reconfiguration of the components (such as the heat generated) of total heat produced leading to a larger gap between the charge and discharge temperatures. In order to practically use currents at a rate of 20 C the discharge event would require more cooling than the charge event.
Additionally, internal temperatures of a 18,650 cell have been determined in other studies. A 16 C discharge resulted in the centre of the jelly roll to increase the temperature to 32 °C above the cell surface temperature [12]. Given these values, as well as those determined here, it is expected that the centre of the jelly roll in these samples will be greater than 95.4 °C due to the addition of the cell internal temperature increase and surface temperature increase. It would likely be greater than this since the currents applied here were higher which would have further increased the internal temperatures. This temperature is known to be above the electrolyte flash point as well as being sufficient to initiate solid electrolyte interphase (SEI) decomposition [13].
Temperature increases from cycling resulted in a linear increase in the external cell temperature; this was the case for both tests undertaken here. Other studies have shown that the heat generation for discharge is linear for similar high C rates [11]. Additionally, the heat generation is mostly stored within the cell [14]. This is the case because the cell does not have time to dissipate the heat generated to the outside surroundings, and so to operate cells under these conditions would require forced convection cooling.
On the other hand, a 15 min pause after charge and discharge using 20 C currents allowed the cell to cool to 6.8 °C and 1.9 °C above ambient levels for discharge and charge, respectively. Natural convection cooling requires longer than 15 min to achieve cooling of the cell to ambient temperature.
The currents applied in the high rate cycling test was above the manufacturers specification by a factor of 1.38 times in discharge and 4.4 times in charge. The temperature at the cell surfaces were, however, below specification by 23.5 °C.

2.2. Computed Tomography (CT) Scans

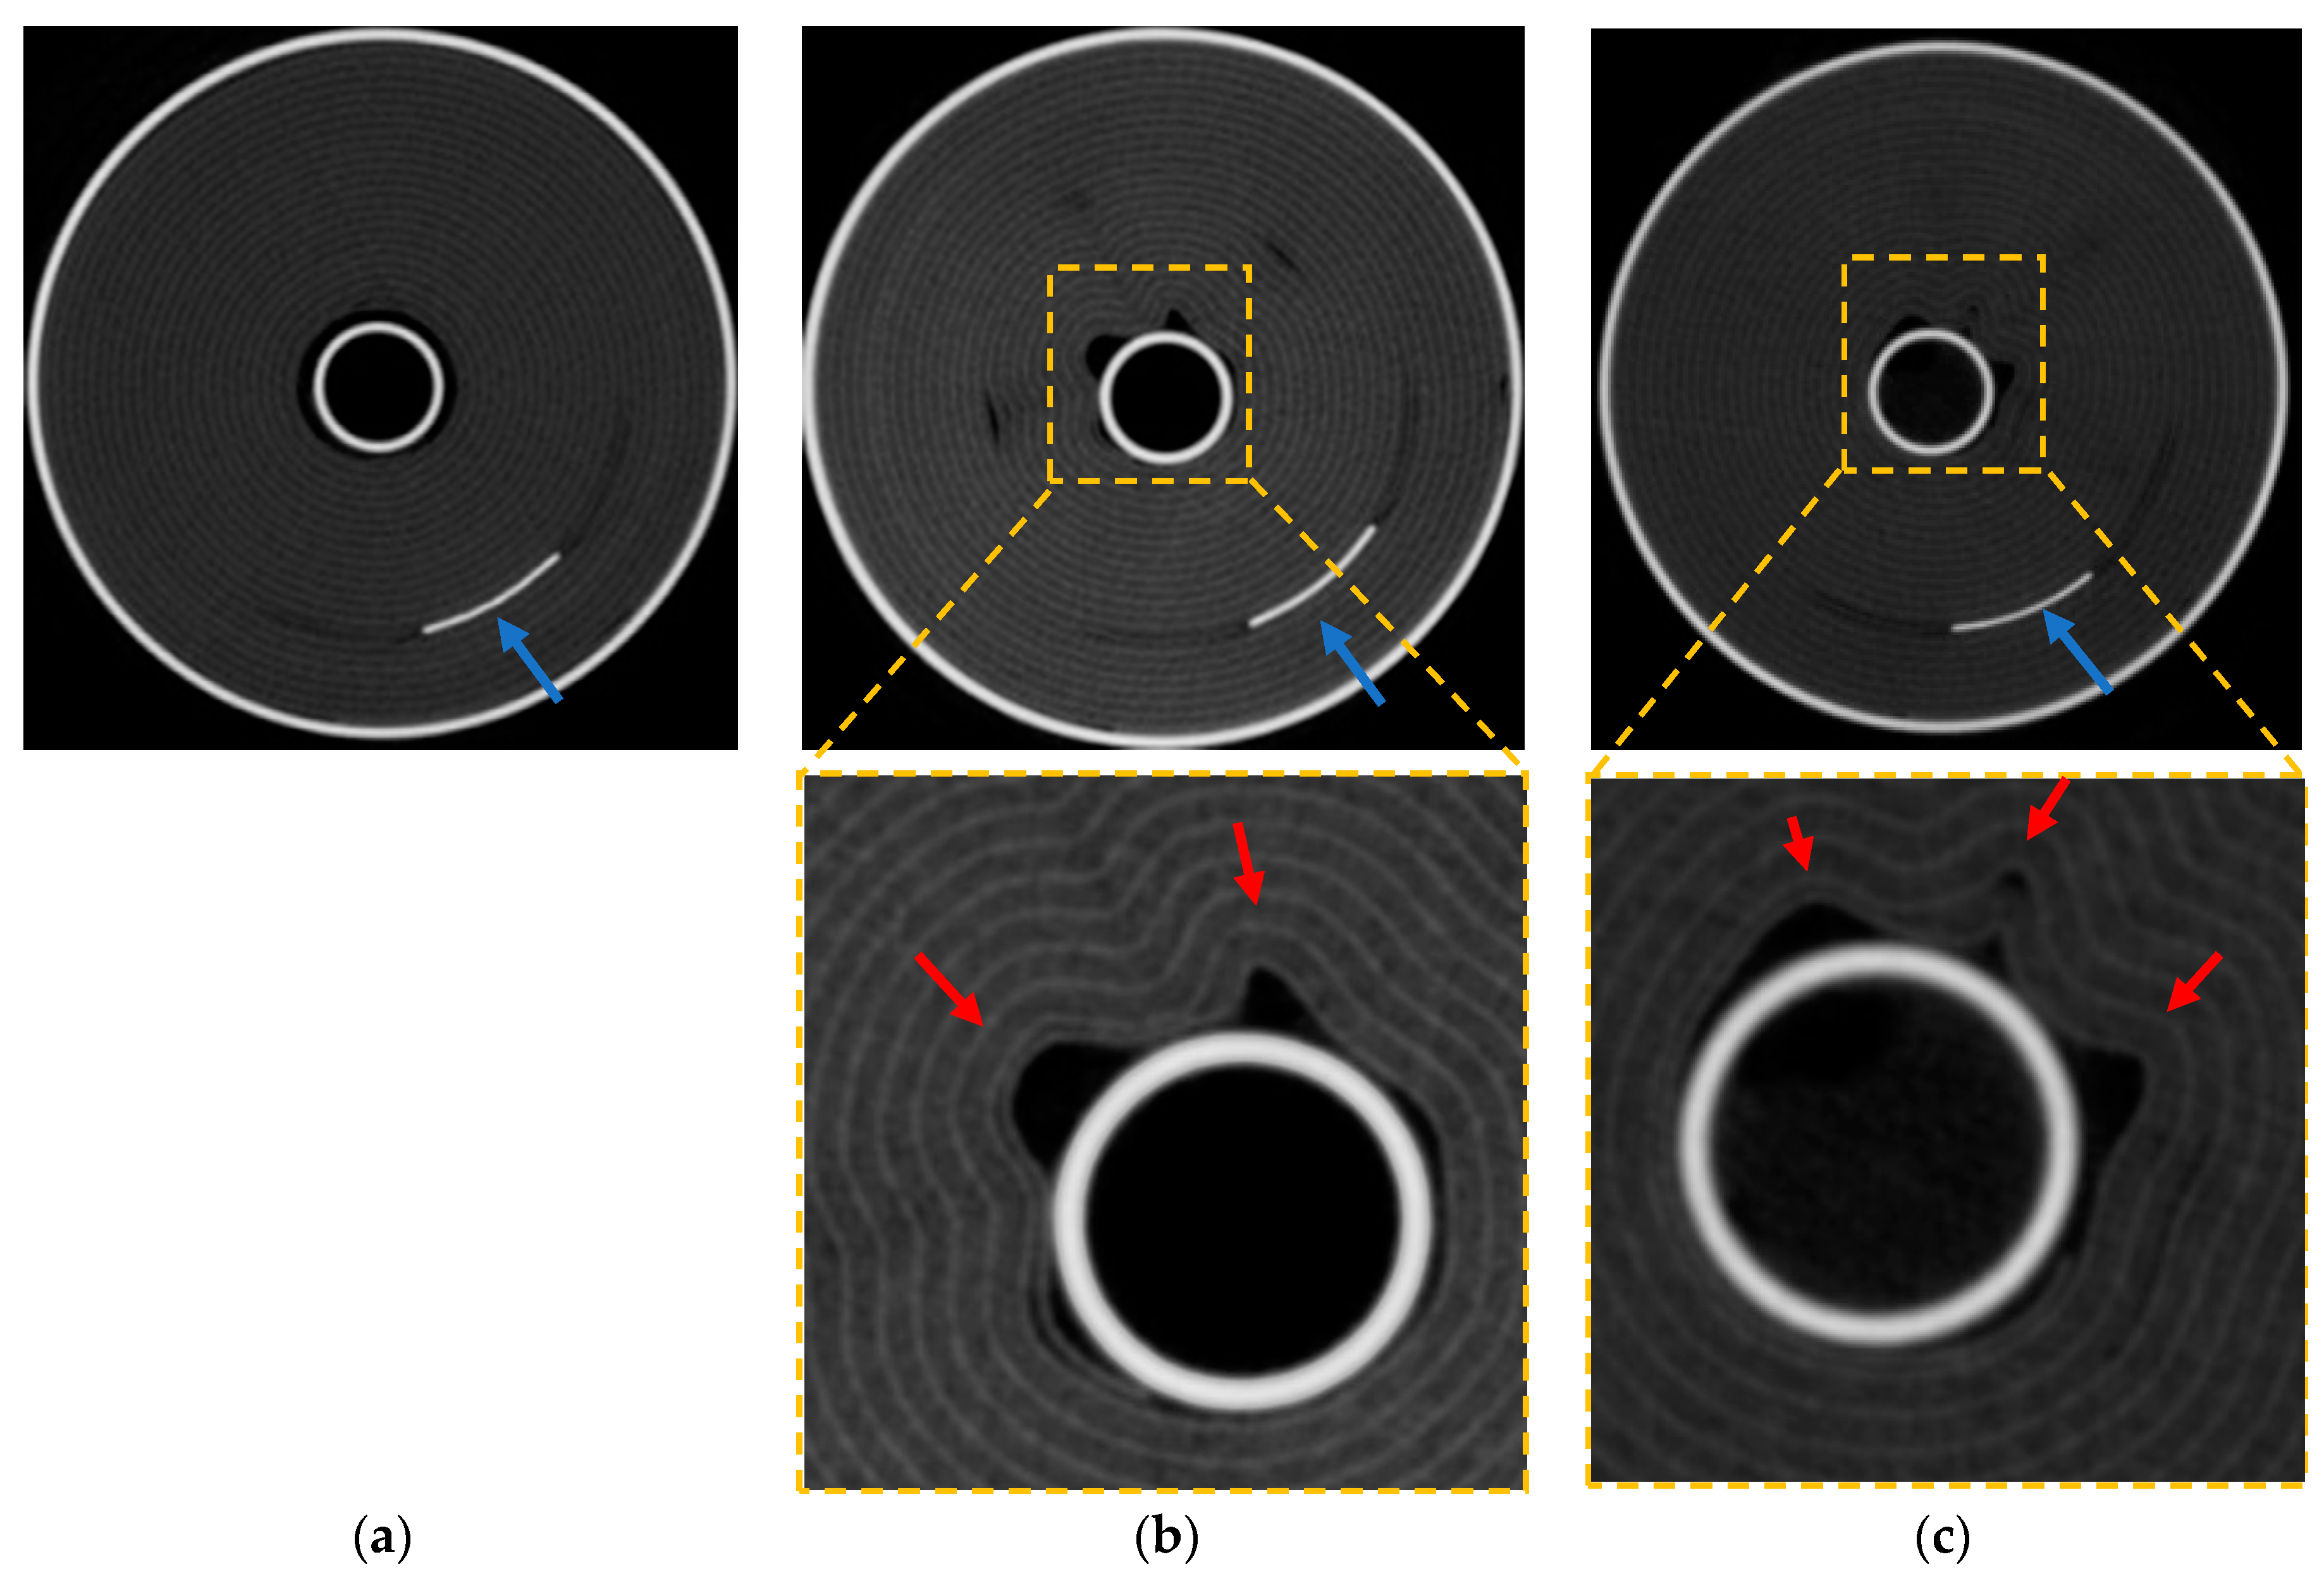
As received, cell failure test and high rate cycled cells were analysed using X-ray computed tomography in a frontal and axial planes. In CT scanning, materials with higher atomic number appear brighter, and therefore the anode (copper) substrate is clearly identified. Moreover, areas of space (voids) appear dark within the battery.
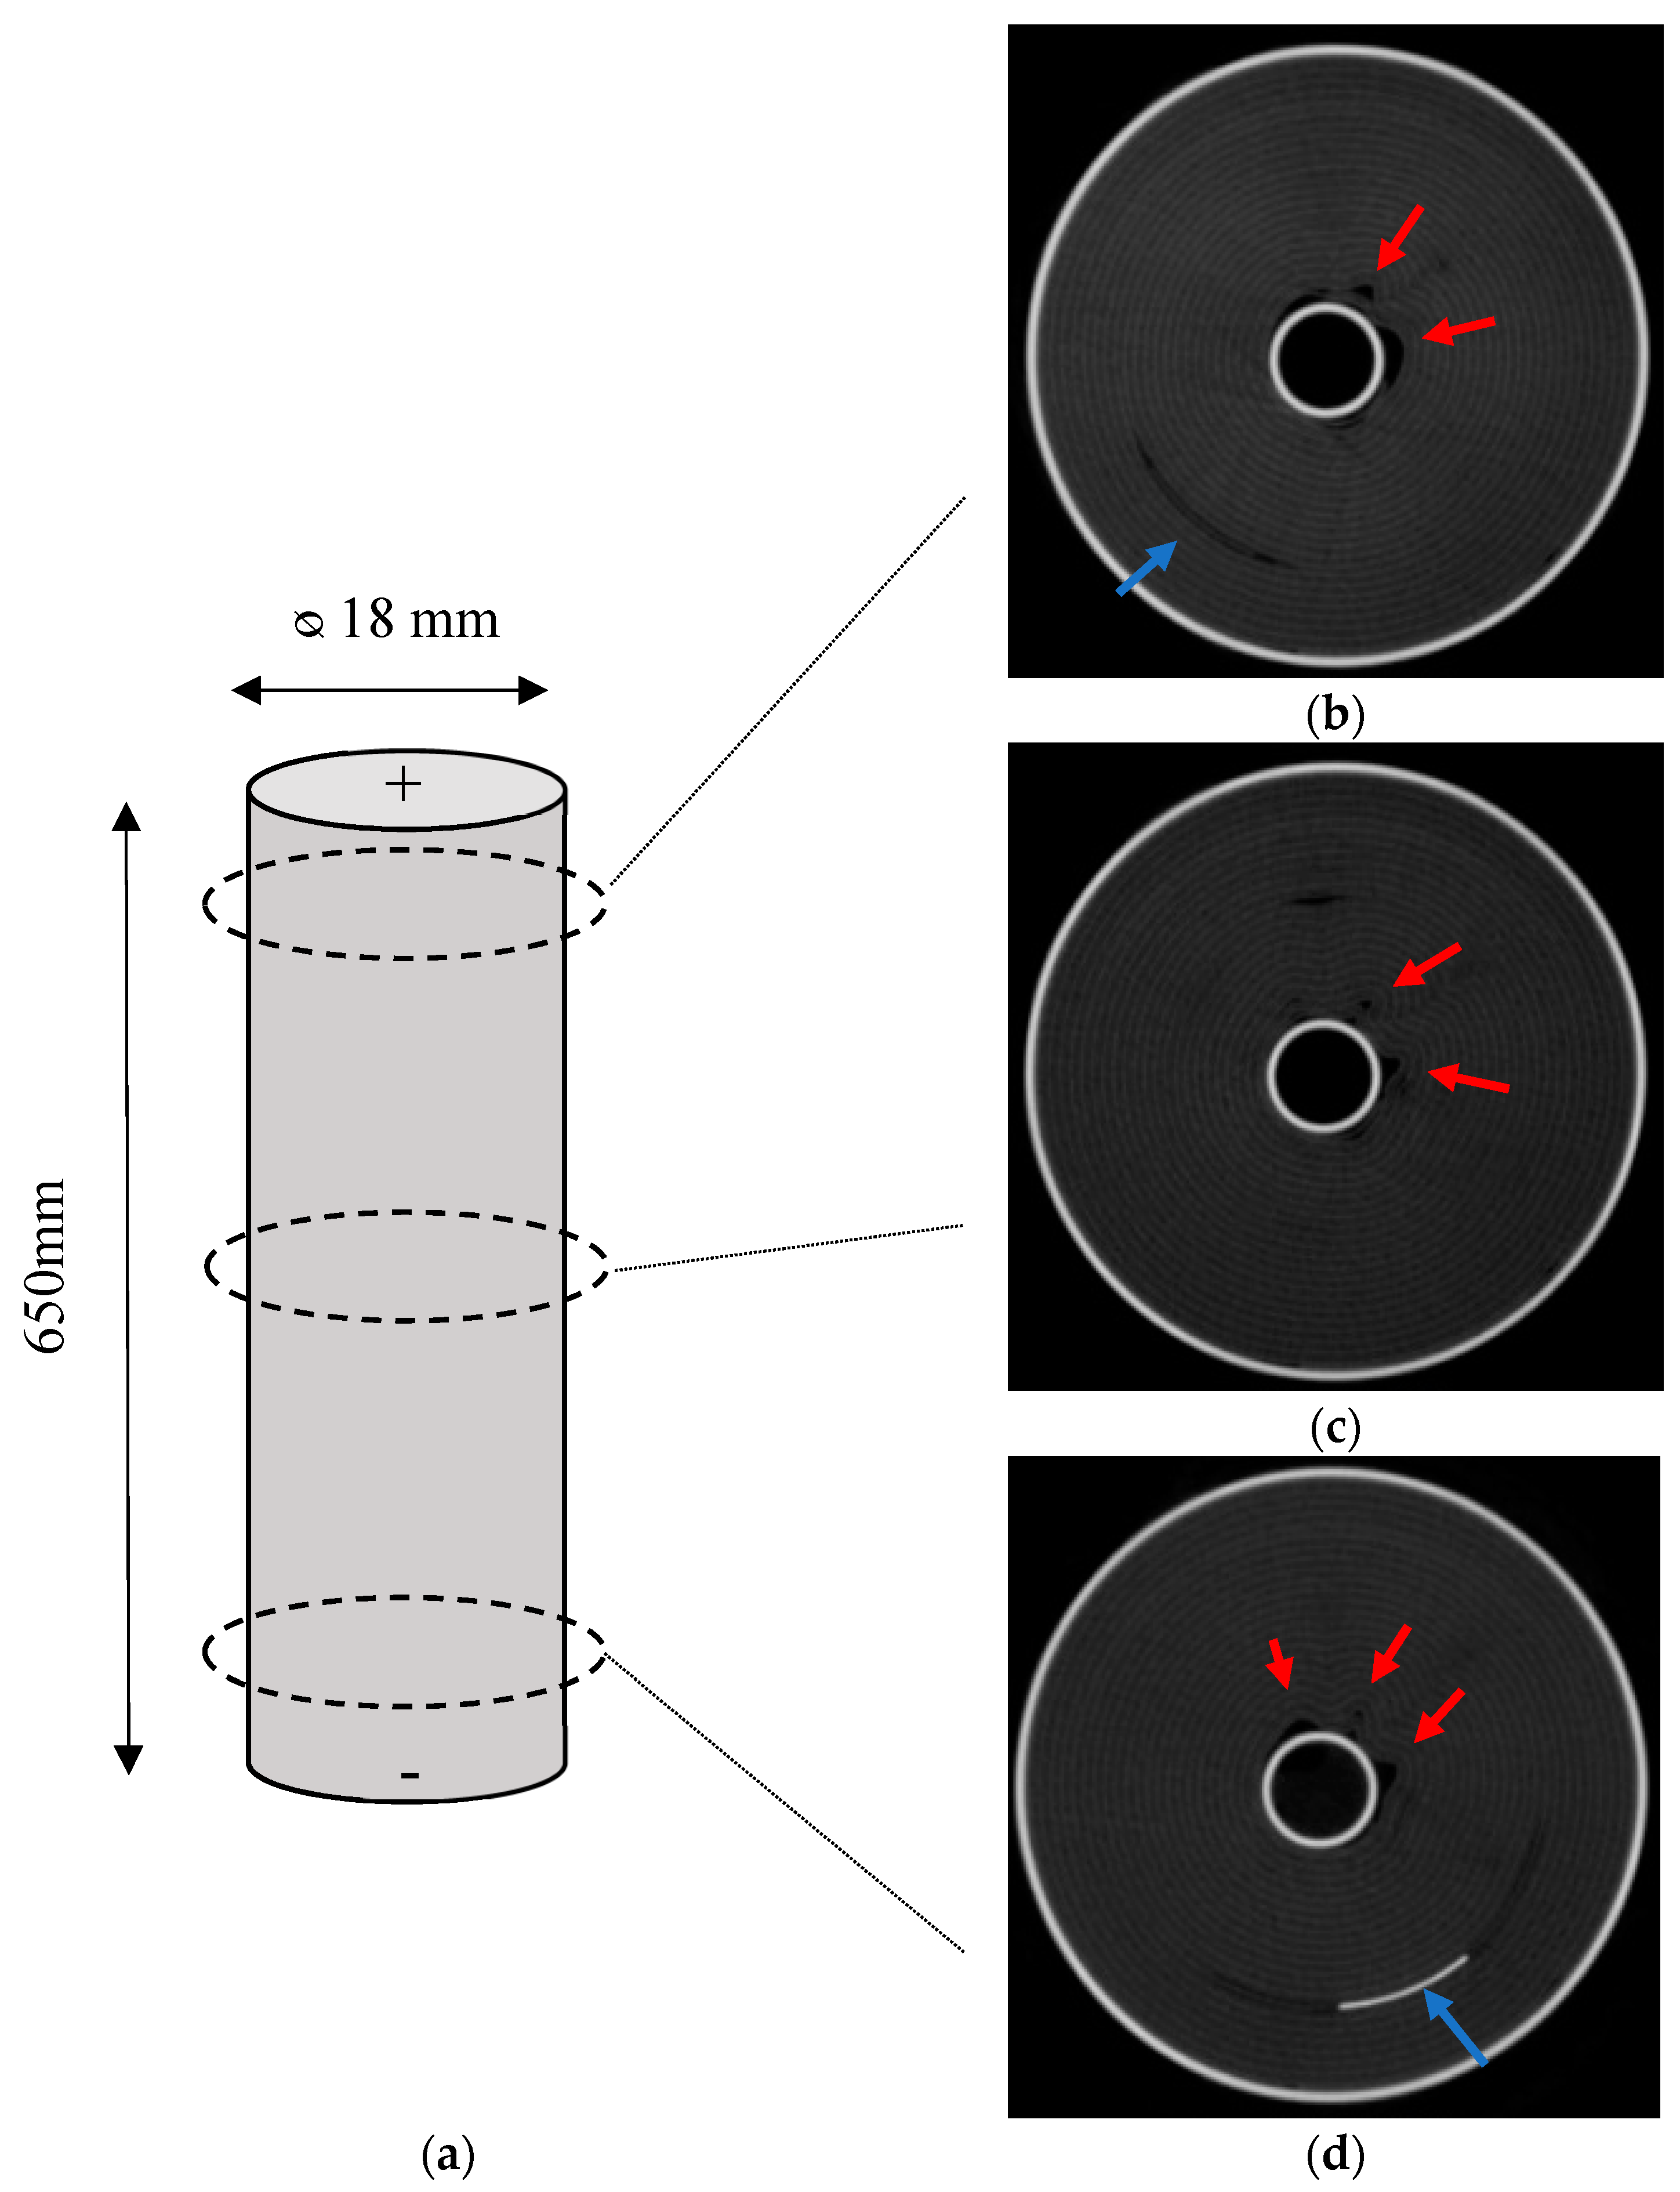
Figure 4 shows the axial X-ray computed tomography scans of the cells. In the as-received cell, it was shown that the jelly roll was wound around a centre pin or mandrel in a uniform manner. Deformation was observed in some of the layers of the jelly roll of the aged samples. This was most pronounced with acute kinks at the centre of the jelly roll near the centre pin, where the bend radius is at its most pronounced. These deformations gradually petered out and became more contoured towards the outside of the cell. By the midpoint of the jelly roll the deformation had subsided. In addition, deformation was noted on the opposite side of the cell to the negative tab, an indication that this area has a different stress state to the area adjacent to the tab.
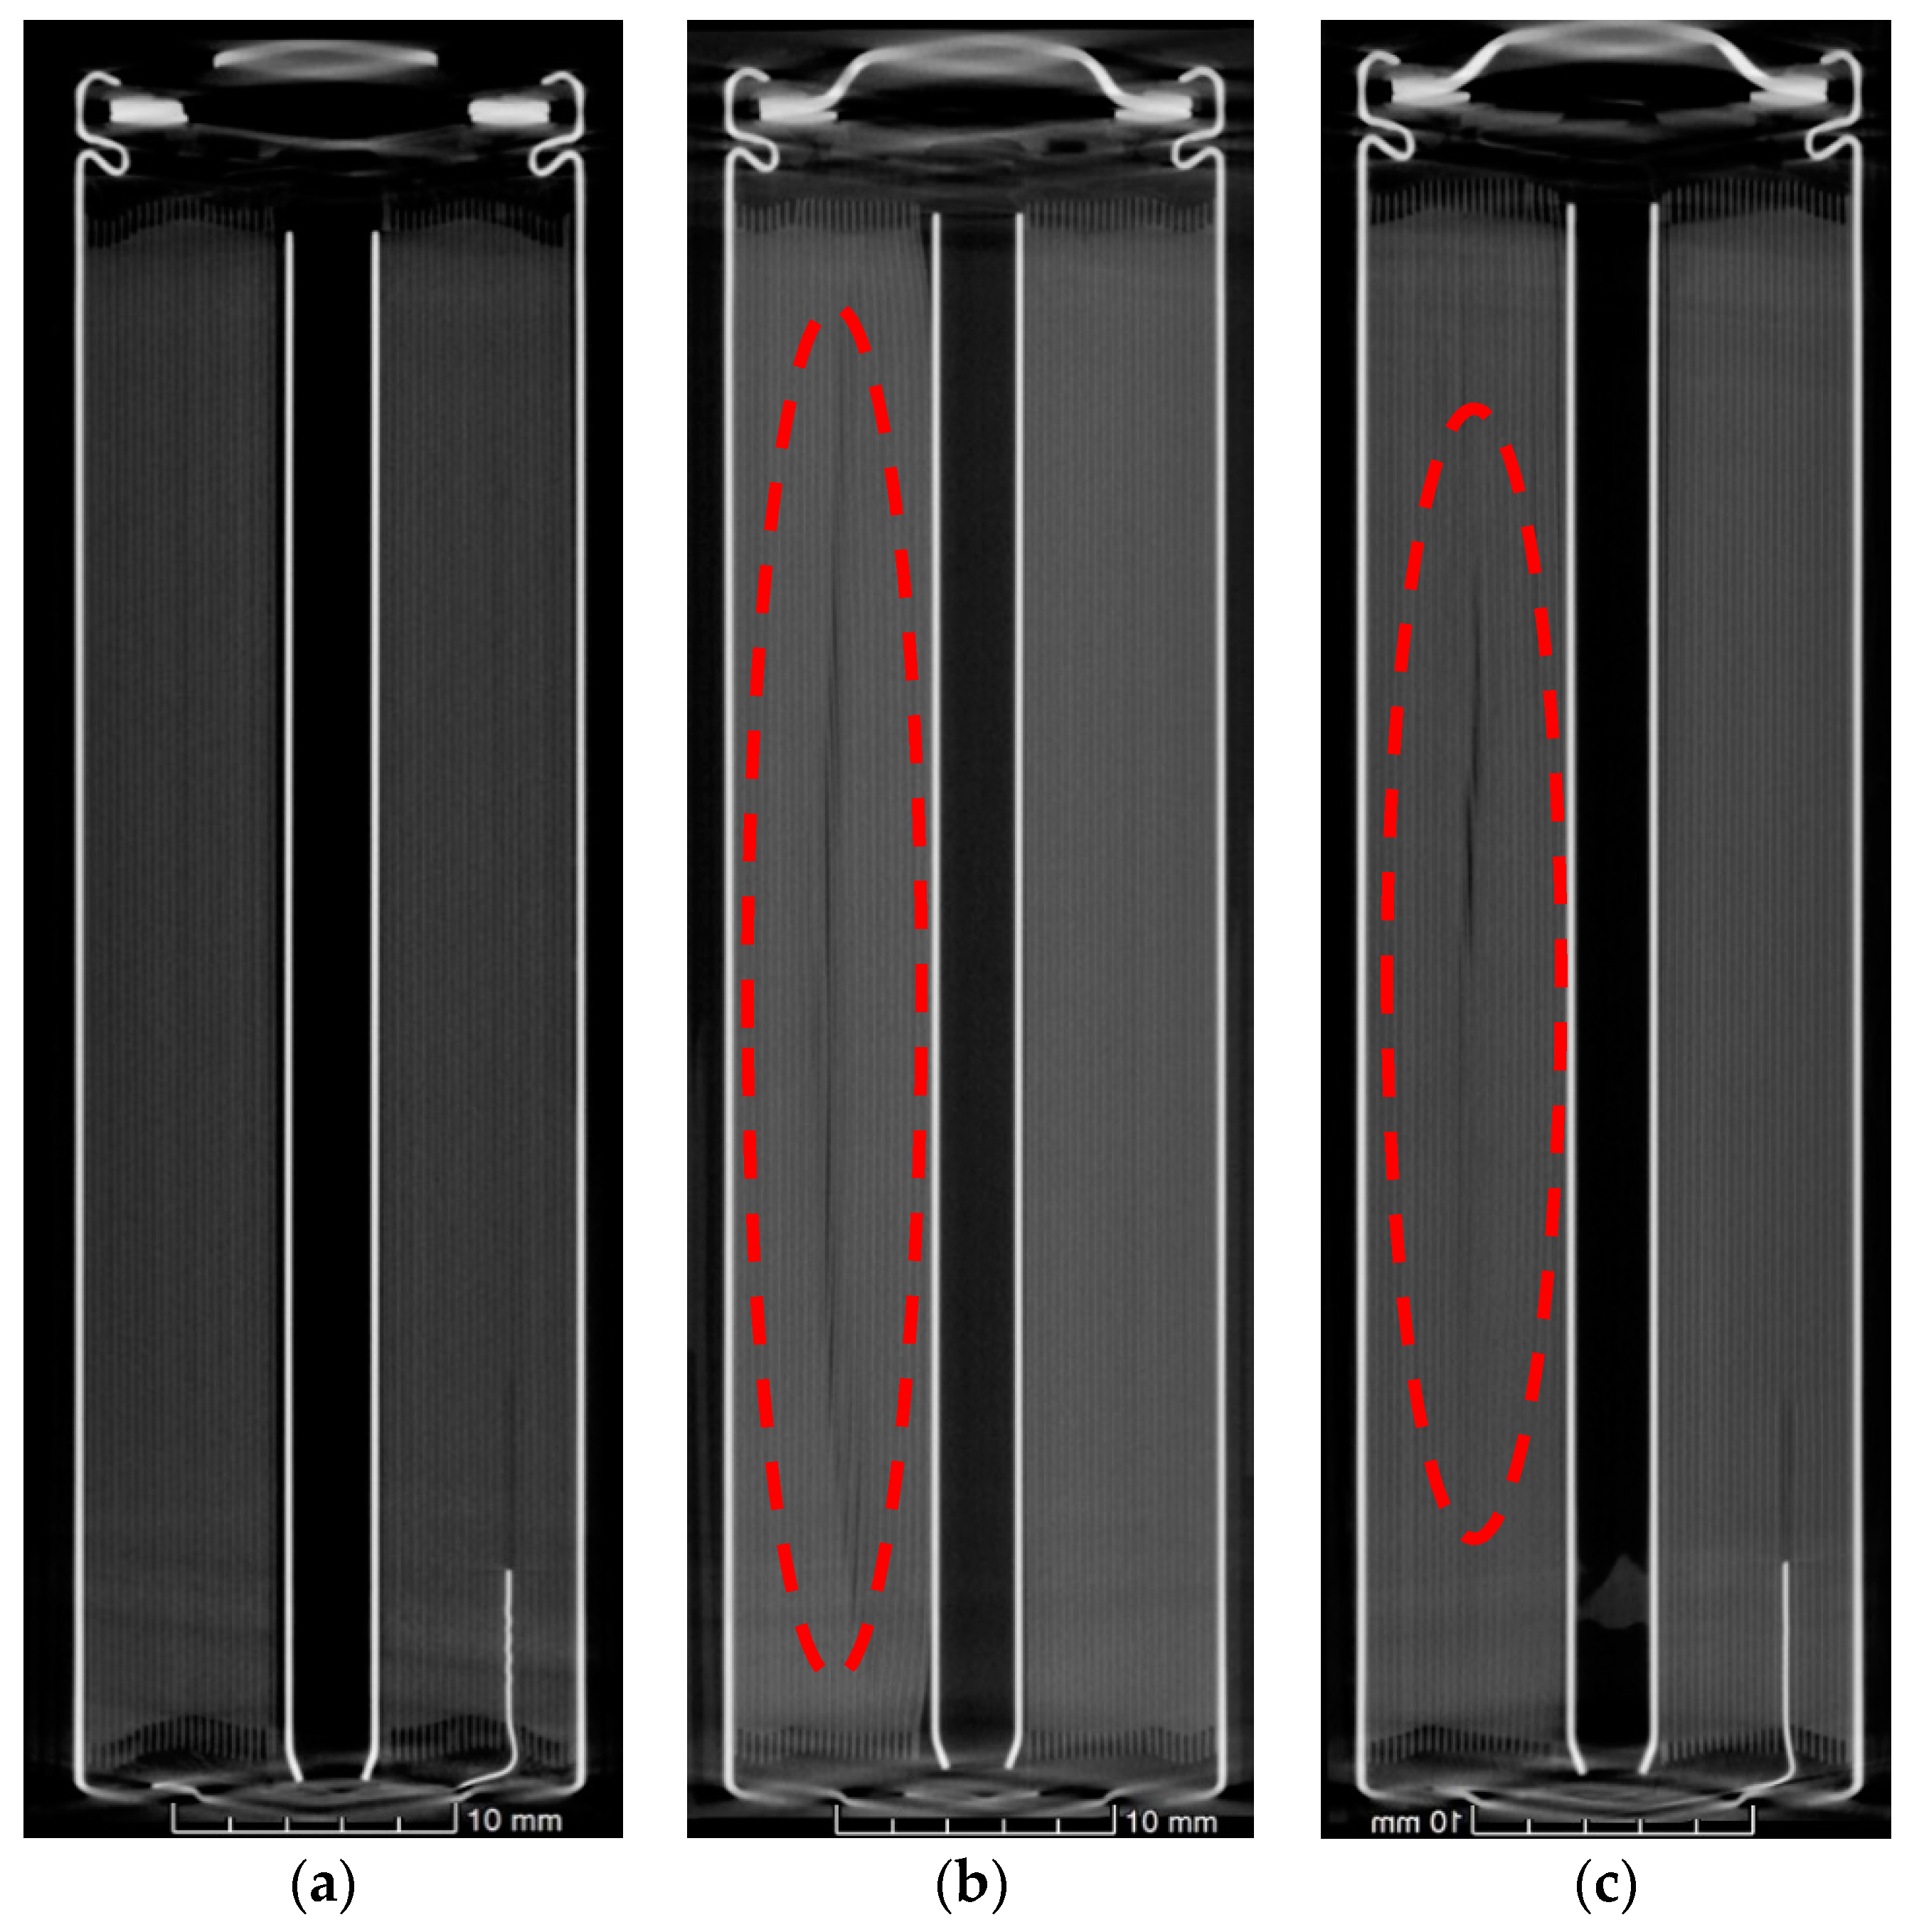
Furthermore, deformation was observed in the frontal scans of the aged samples, which can be seen in Figure 5. This was noted at the halfway point of the cell–causing a void as a result of some form of applied stress. In contrast to the axial scans, where stresses were experienced emanating from the centre of the cell, these voids appeared at the midpoint of the cell and opposite the negative tab. These appeared step wise between the layers indicating a stress transfer between layers. In this study, the thermocouples showed that the temperatures were greatest at this location on the outside of the cell (refer Figure 2).
The axial deformation at the top, middle and bottom of the cell is shown by Figure 6. Deformation around the centre of the cell is noted on all samples. In the case of the top and bottom, deformation is noted as distal to the positive and negative tab.
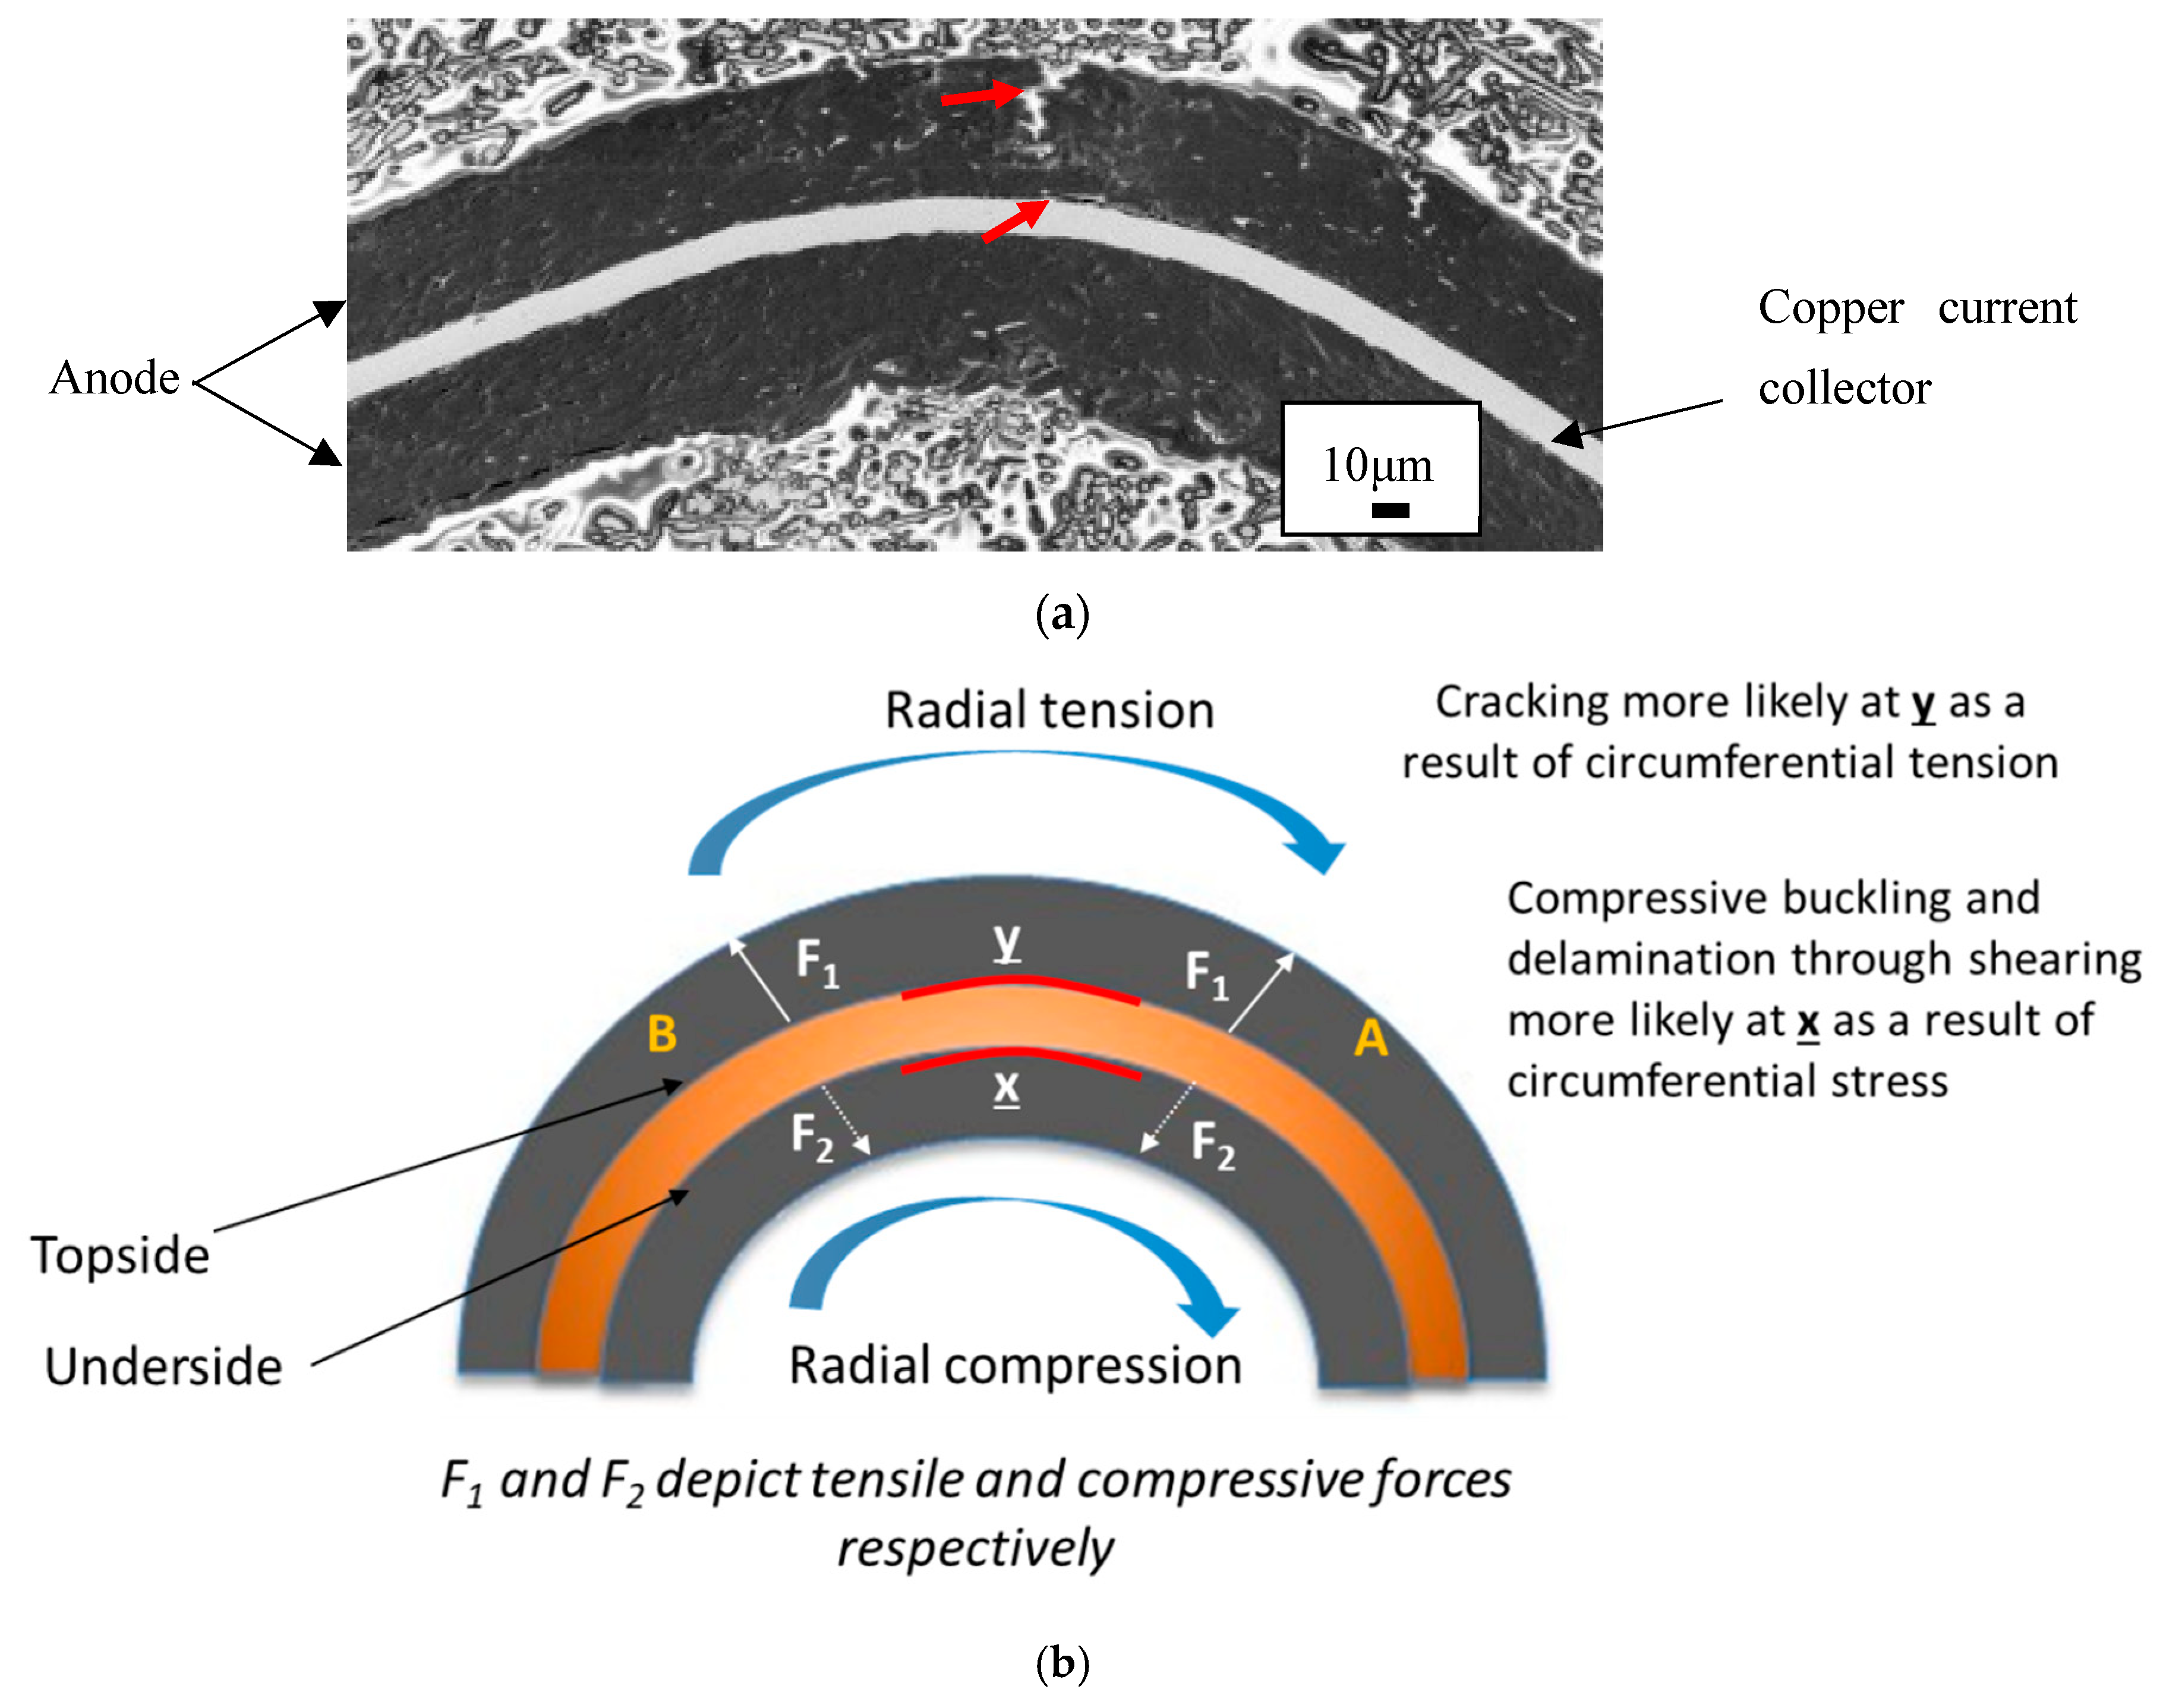
Permanent deformation is an indication that the tensile strength of the material has been exceeded; since both the anode and cathode are deformed, the stresses applied are greater than the tensile strength of these joints. The joints termed here are (refer Figure 7a showing cross sectional view):
  • Anode: copper substrate and double sided carbon coating
  • Cathode: aluminium substrate with double sided LiFePO4 coating
In parallel, volume changes within electrodes during charging and discharging can drive contact losses in active materials by way of mechanical or electrical disconnection effects. It follows that any loss of such access to the active particles will result in lower potentials upon charging–equating to loss of Li. This will start generating imbalances between the anode and cathode, which can cause the negative electrode to experience increasingly negative potentials. Detrimental behaviour can then follow as the remaining active material will need to accommodate more lithium, but also be exposed to higher current densities–this is a perfect condition for plating to occur.
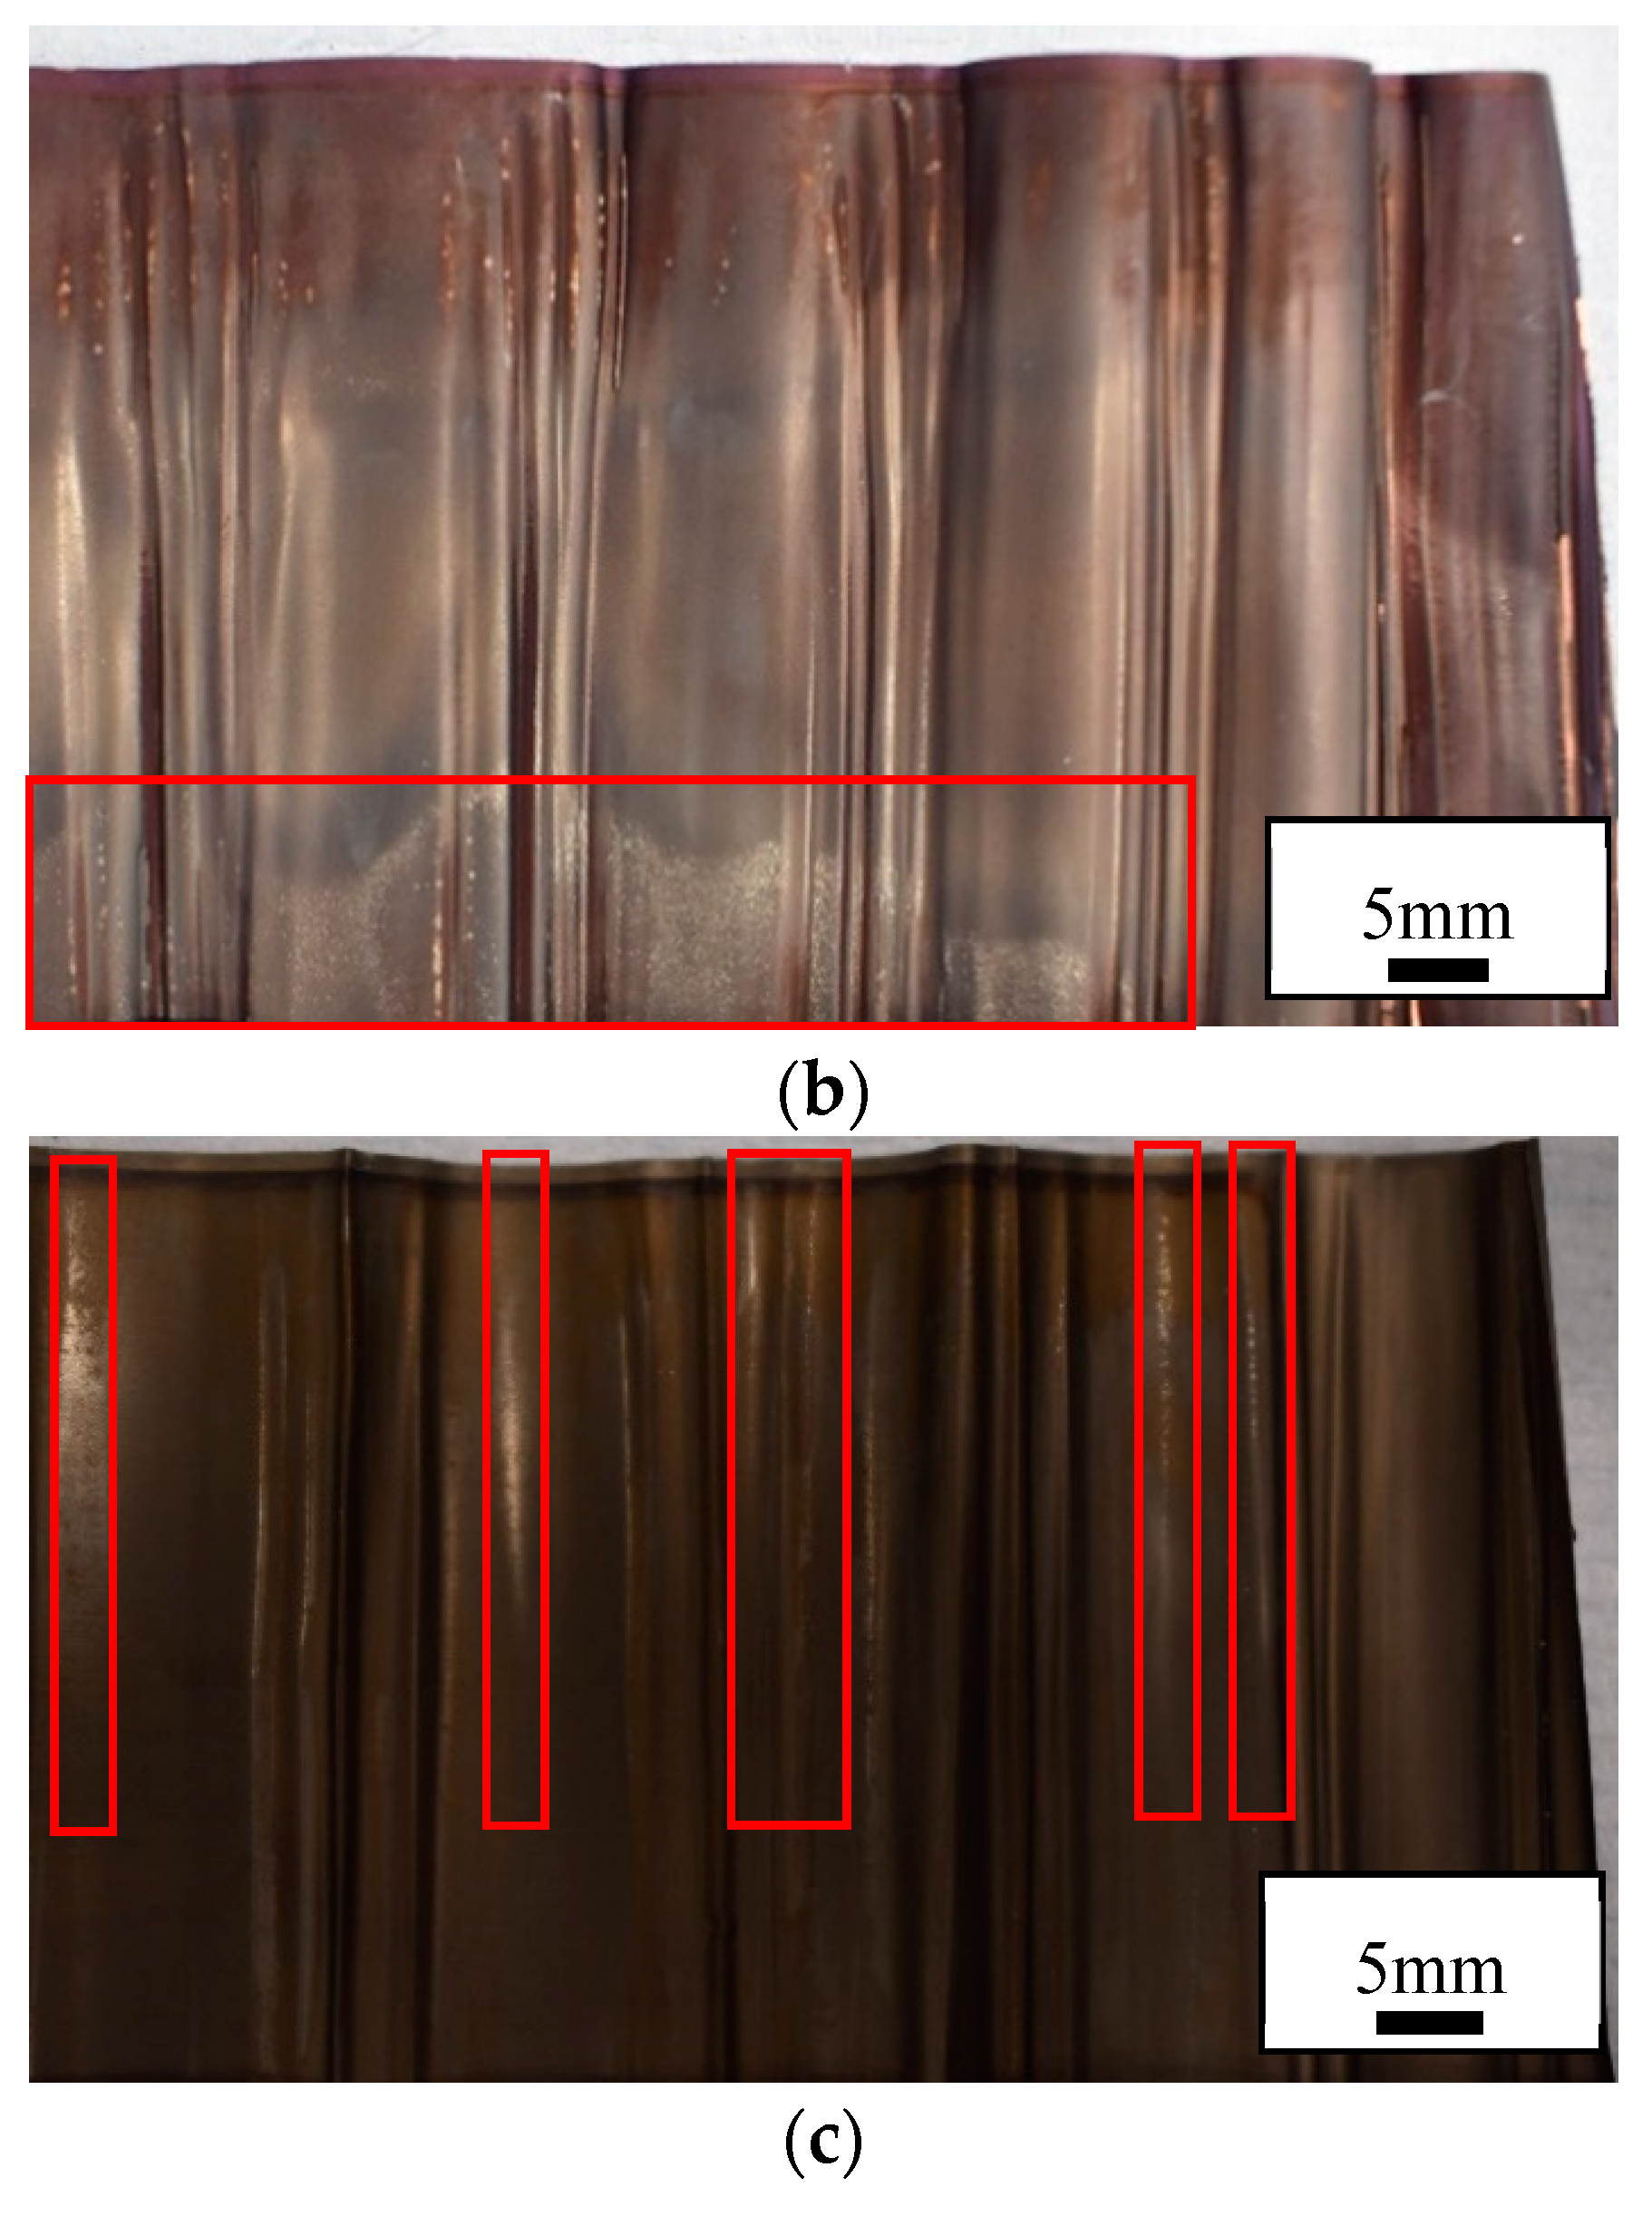
Figure 8 indicates the presence of Li plating in the high rate cycled and failed cells, illustrated by white traces of oxidised lithium. Denser white deposits are observed in the failed cell, corresponding to higher amount of plated lithium. Areas of electrodes that have been subjected to any mechanical damage or contain structural imperfections are prime areas where plating of Li can initiate. Such areas contribute to heterogeneous ageing, a collective of non-uniform degradation events [15].
When we consider the morphology and format of cylindrical cells, there are compression gradients or variations in stresses from the outer layers of the jelly roll to the inner regions, dictated by the bending radii becoming more pronounced closest to the mandrel. Indeed, it can be observed in Figure 4, that the greatest deformation is at the centre. With operation time (and resultant temperatures) these residual stresses, which are more pronounced near the centre mandrel become more likely to relieve themselves. This occurs by deforming in localised regions (i.e., the kinks) of the jelly roll around the mandrel. Additionally, the tabs are shown to cause subtle deformation in the electrode and separator layers immediately surrounding them. This creates pockets of spatial variation, which contributes to more macro-heterogeneity within the structure. As the battery ages, the cathode potentials increase due to Li loss. Deeper discharge then also results in Li loss. Capacity balancing of the two electrodes becomes gradually altered until the negative electrode becomes capacity limiting. Given that the graphite potential during operation becomes close to that of Li’s redox potential, plating can easily occur where there exist imbalances.
At the so-called rollover point, where degradation is accelerated more rapidly and it is this heterogeneous ageing that is the key driving force, essentially dominated by:
  • Loss of localised areas of accessible anode through mechanical or electrical isolation
  • Li plating in non-uniform and compressed areas.
  • Propagation of Li-plating, representing a rapid consumption of Li, resulting in more rapid capacity drop.
  • Self-perpetuating cause-effect chains generated that link plating to compression differences or gradients in microstructures
Homogeneous pressure distribution is challenging to establish in cylindrical cell configurations, which have a gradient of winding pressure. In this respect, circumnavigating non-linear degradation in ageing cells remains a design challenge, especially for applications requiring both extended lifespan and power.
Non-uniform or heterogeneous pressure has been shown to directly affect Li diffusion through the separator and can influence changes in porosity and tortuosity [15].
The areas described as voids appear to have been formed due to a response of the battery componentry to stress. Material is deformed and displaced in one area to another resulting in voids or gaps due to stresses caused by thermal gradients in testing.
With increased high rate cycling the cell was more deformed as shown both axially and in the frontal scans. This is an indication that more stresses have been experienced in the increasing high rate cycling cell. The source of this stress is believed to be thermal mismatch (expansion and contraction) between the inside and the outside of the cell. Temperatures inside the cell are higher than the surface in both charge [16] and discharge [12]. However, given that discharging has shown to heat the cell more than charge, it is thought that this would produce a greater amount of stress and subsequent deformation.
An analogy for this situation has been given towards a hot cylinder cooled rapidly whereby the outside is cooled and inside remains hot such that the outside is in tension and the inside is in compression [12]. These stresses relieved themselves by causing deformation to the componentry. It is therefore a function of heat dissipation within the cell. This is a holistic view of the component as a (single) solid component; in fact the cell is made up of many layers that are wound together but held between the inner coil and tube. As seen, the layers act separately, however there is some relationship and transfer, such that patterns are transferred between the layers within the jelly roll.
Thermal fatigue is well known to occur in metallic components due to the combination of mechanical constraint and temperature gradients [17]. These temperature gradients cause thermal expansion or contraction which result in thermal stresses as the component is mechanically constrained. In this situation, the jelly roll is mechanically constrained on the outside (by the can) and the inside (the centre pin).
Similar effects have been seen in another 18,650 cylindrical cells that were exposed to a range of charge and discharge C-rates (up to 16.6 C) which resulted in similar axial deformation patterns [12]. However, it was shown that with a centre pin, deformation was not observed. These were however lower C-rates than what was undertaken in this study. The presence of a centre pin appears to increase the resistance of the cell to jelly roll deformation.
Modelling [14] has shown the temperature distribution in the axial direction to be uniform. The deformation however has been shown to be located away from the tabs. Furthermore, modelling has shown the hottest locations of the cell to be the top and bottom of the cell can – no observations towards any effects towards these were seen an indication that these areas are designed sufficiently to withstand temperatures.

2.3. Post Mortem of Jelly Rolls

Complementary to the CT scans, post mortem characterisation was undertaken on the cells whereby the jelly roll was unwound and cross sections were prepared.
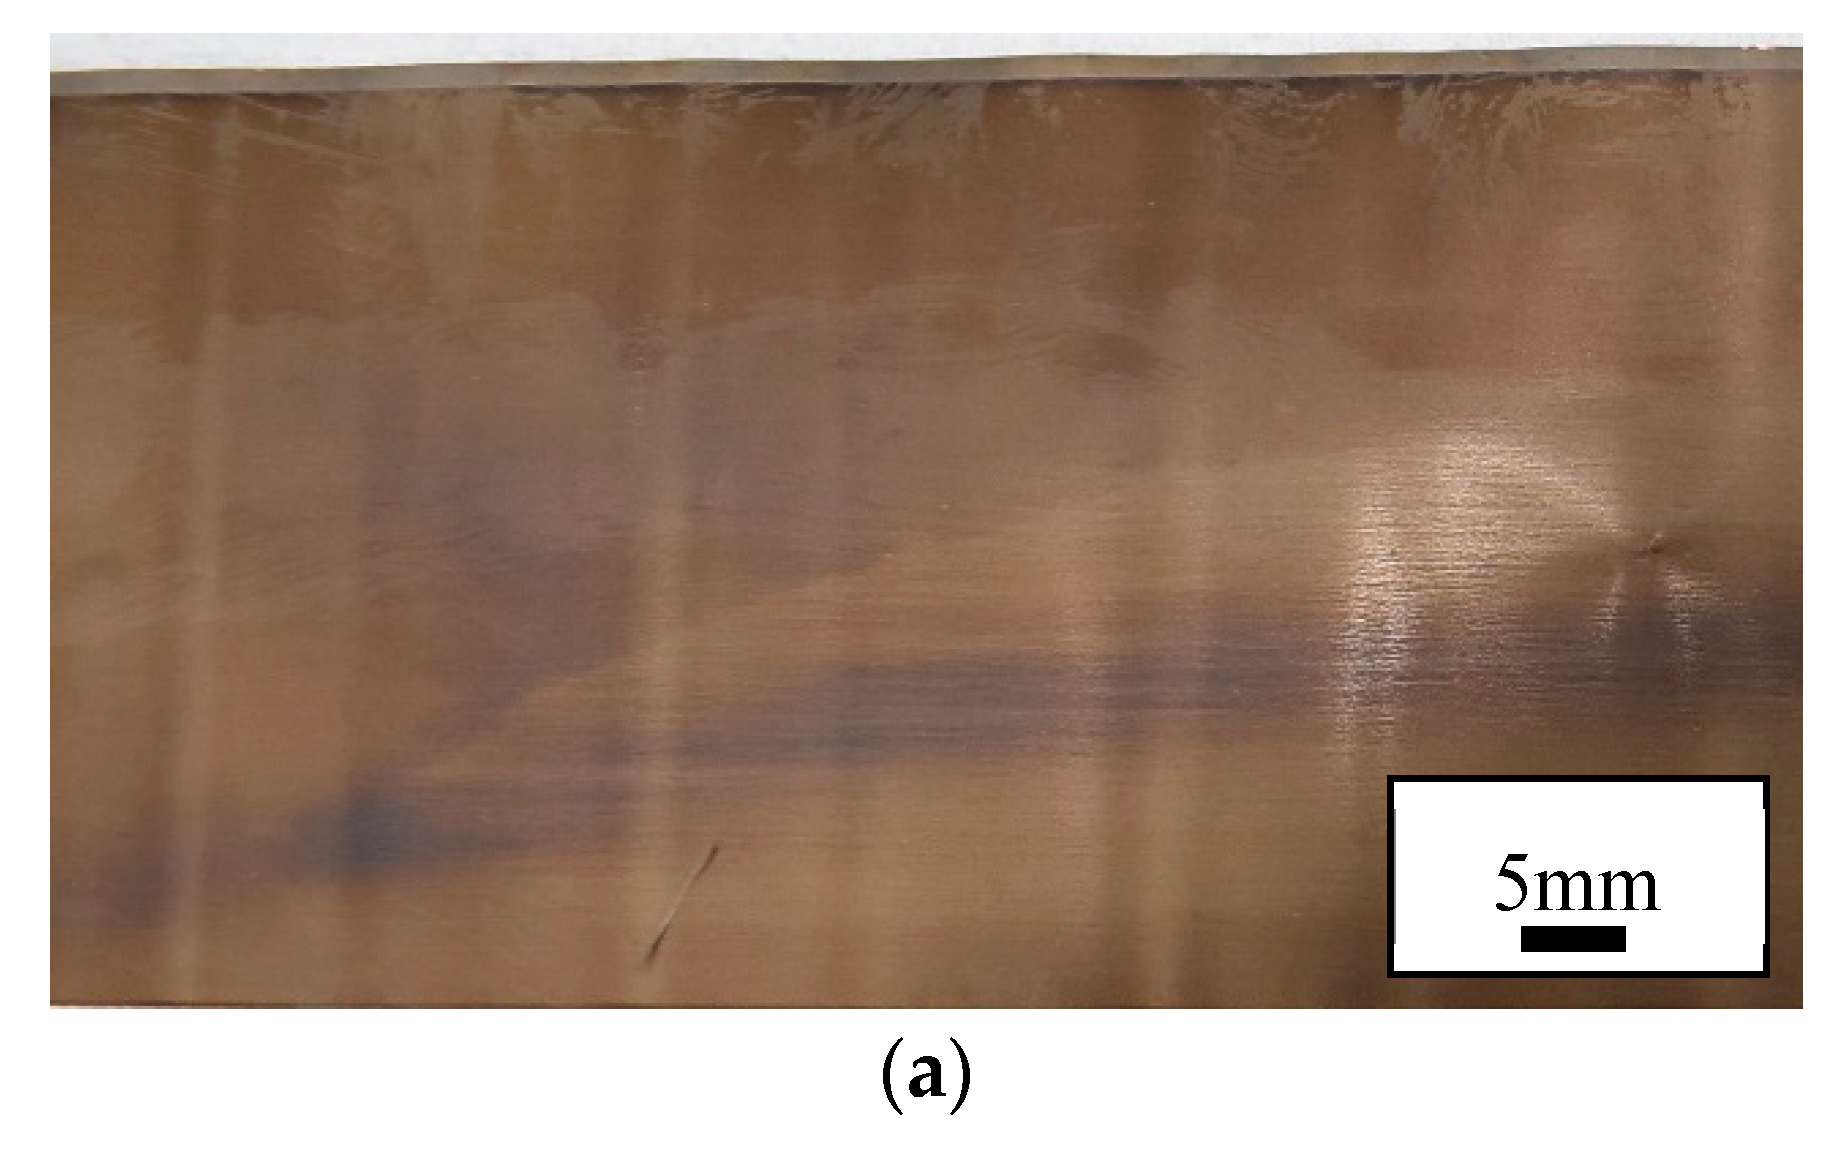
Examination of the cathode and anode confirmed that they had both been permanently deformed by testing given that the deformations remained after carefully opening the cell. These effects appeared as kinks in the cathode and anode with peaks and troughs in the joint as shown by Figure 8. The deformation was consistently observed extending from the top to the bottom of the cell at approximately right angles to the jelly roll. This suggests that similar stresses were experienced along the height of the cell such that the cathode and anode was similarly deformed for the entire length of the cell. In other words, stress is transferred from the centre of the cell to the outside for the entire length of cell.
Deformation was observed with an increasing distance from the centre of the jelly roll; since with every rotation away from the centre, the roll becomes slightly longer, as mentioned elsewhere [11]. This further validates stress transfer between neighbouring layers whereby the contours of the kinks are transferred to the following layers which, upon opening the jelly roll, are observed at increasing distance from the centre pin.
Reports have shown similar deformations on the same side as the tab [12,18]. One has suggested this to be due to geometrical homogeneities in the jelly roll caused by the tab [18]. Here the deformations were observed on the opposite side of the cell to the tab.
Another report showed that the yield strength of the material in this location had been exceeded [12]. In this study it was shown that similarly the yield strengths of the joints have been exceeded (more on the stresses on the individual joints is discussed later).
Similar effects have also been observed in pouch cells away from the edges (i.e., where the cell is mechanically confined [12]). Furthermore, external mechanical loading has shown to cause these deformations from the outside of the cell. This is not similar to the effect shown here, no deformation is visible on the outside of the cell.
Stresses in the joint are described by a beam in pure plastic bending [19]. The upper surface of the joint is being stretched or in tension whilst the lower surface experiences compression due to load applied to the joint. Furthermore, the strain experienced by the joint (and the componentry) transitions from tension to compression from upper to lower surface. This is illustrated by a cross-section schematic in Figure 7.
The deformation of the jellyroll is clearly more pronounced for cells continuously cycled with higher current densities. A buckling of the layers can be observed whereby very evident kinks are caused in anode, cathode and separator. The compressive stresses induce the central buckling of layers, and this would be even more pronounced were it not for the presence of the mandrel pin minimising further deformation.
Stress evolution in cylindrical cells is due to expansion and contraction of the electrodes during lithiation/delithiation. With this, temperature gradients evolve during cycling emanating for heat generated from ohmic, active polarisation and exothermic reaction sources. The radial symmetry distribution with higher temperatures in the centre exaggerates the radial and tangential compressive stresses in the core and tangential tensile stresses near the outer layers (which constrains the thermal expansion of the core region).
The stresses experienced on either side of the electrode coating are asymmetrical and will have respective gradients from the outer to the inner layers. This is due to gradual increases in the bending radii of the layers. The jelly roll format could be mathematically represented as an Archimedian spiral [20] with a general equation shown by Equation (1).
r = a + b θ
where r is the distance from the origin, a and b are constants and θ the angle between the line from the centre to the tangent to the spiral.
Microscopy was carried out on samples from post mortem examination. Figure 7a shows a cross sectional SEM image of a kink in the anode from Figure 8c. A crack is observed as well as delamination of the coating in two locations, all shown by arrows.
The cracking emanates from the upper surface and has travelled toward (but has not reached) the interface between the anode and copper current collector. This is a result of the tensile forces stretching this surface. The anode coating has delaminated from the copper current collector at the upper surface again from tensile forces at this location.
Delamination of the coatings has been observed in other studies using currents up to 16.6 C [12]. These currents have been shown to increase temperatures of the cell significantly, such that thermal stresses (and fatigue) are applied to the joints within the cell. This infers that these stresses are above the adhesive strength of the joint such that the coating becomes disbonded from the substrate. The cracking in the anode surface is also evidence that the tensile stresses have been sufficiently high for the coating to fail (or break) cohesively. This cracking can influence charge transfer resistance by permitting greater electrolyte permeation. Cracking in the bulk electroactive material has been observed previously [12], which has been associated with binder breakdown [21,22]. In the samples examined, there were very few cohesive failures in the electrode active material suggesting that the coating effects are a result of the reaction of the joint to stress rather than binder breakdown.

2.4. EIS Electrochemical Impedance Spectroscopy (EIS)

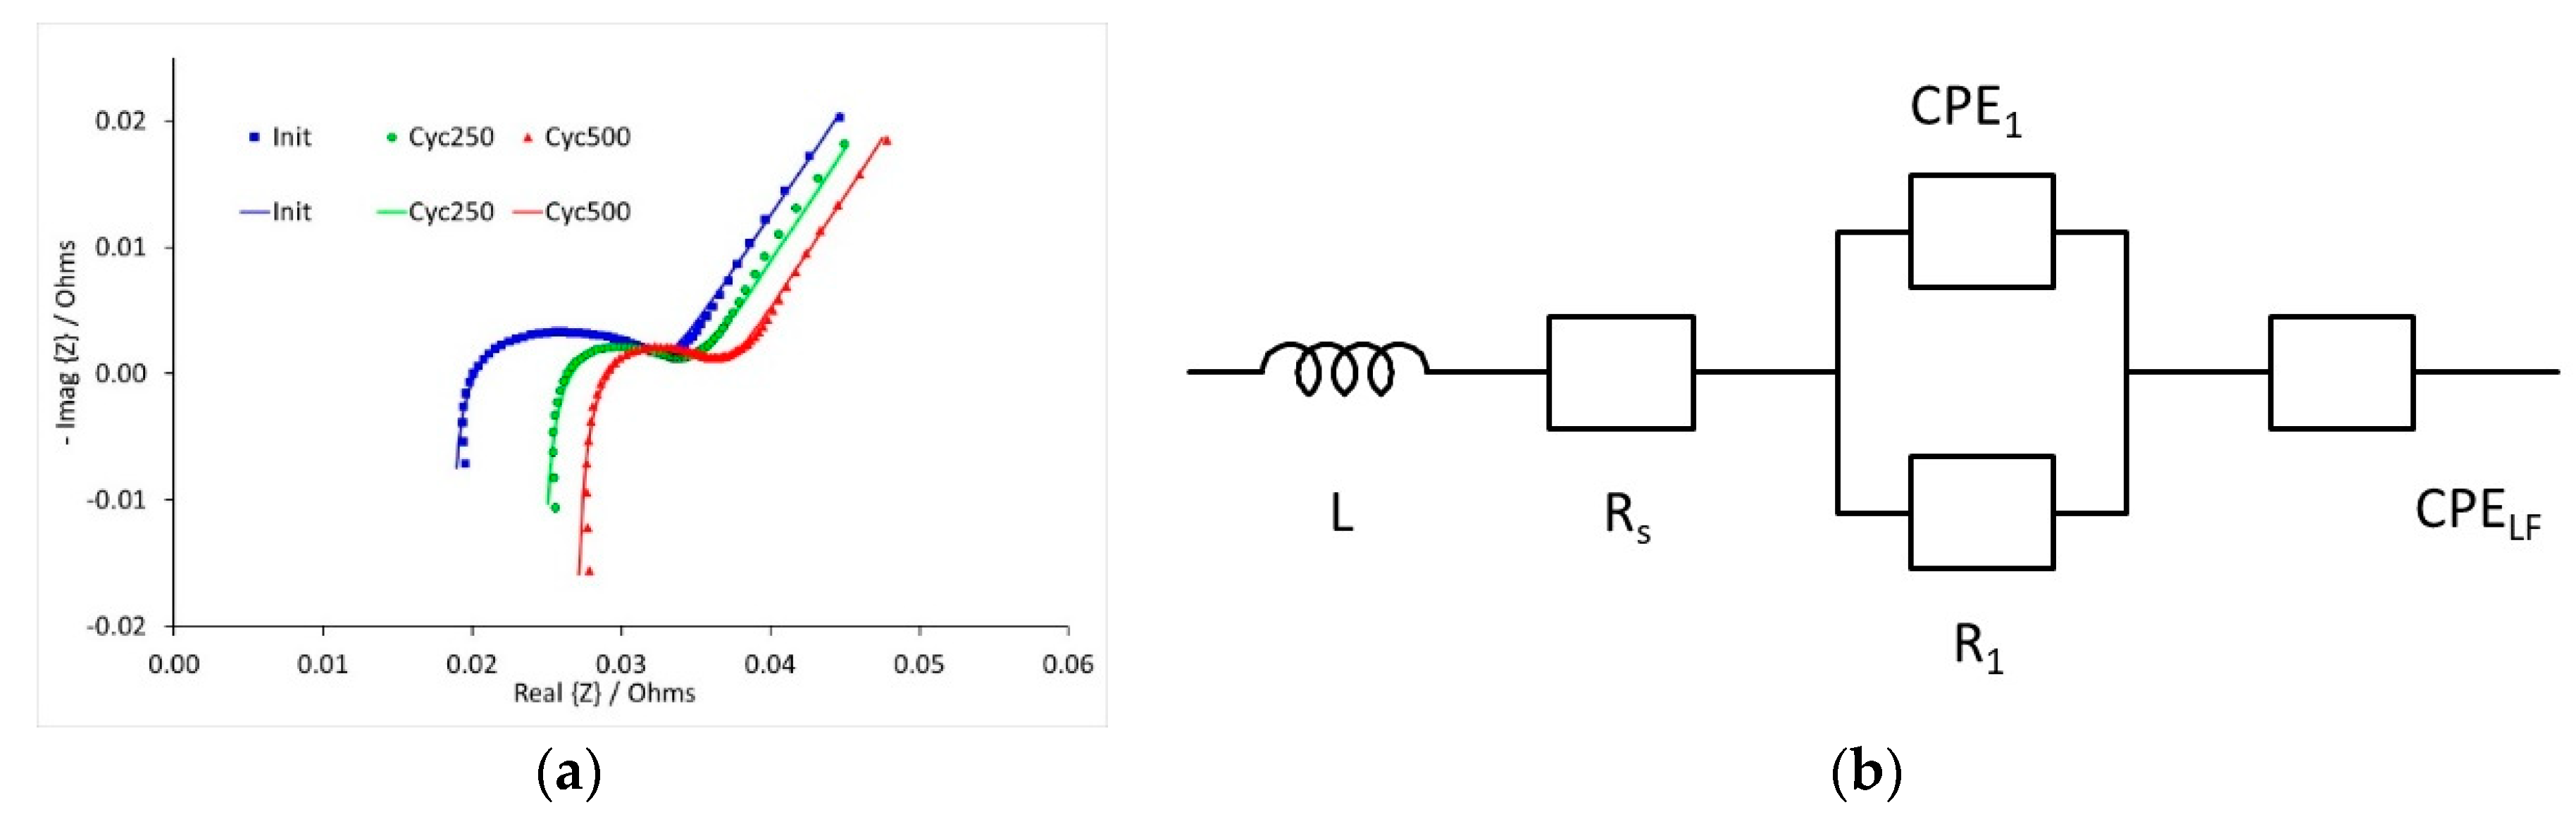
Impedance measurements were performed on three cells during high rate cycle testing. This was carried out at three different states of charge (SOC), and at three stages during the cycle testing; initially and after 250 and 500 cycles. Some illustrative results are shown in Figure 9, for the spectra recorded at 10% SOC. The data was fitted to the equivalent circuit, also shown in Figure 9. The curves shown in the figure were calculated using the fitting parameters.
The resistance values calculated during the fitting process are collected in Table 1. Data to be recorded at 50% SOC and 250 cycles, and resistances could not be obtained. The series resistance Rs increased with cycle number, but the electrochemical resistance R1 decreased between zero and 250 cycles. Both resistances were relatively insensitive to the state of charge.
The electrochemical resistance R1, taken at medium and lower frequencies, is likely to be a combination of three or four resistances; charge transfer resistances at the anode and cathode, a film or SEI resistance at the anode, and possibly a film resistance at the cathode [23]. It can be difficult to resolve the two charge transfer resistances, if they have similar time constants. The film resistance on the anode is often small compared to the charge transfer resistance, particularly at the start of cycling. The cell contains an LFP cathode, and has a relatively complex reaction mechanism. The active particles can convert between LiFePO4 and FePO4 sequentially or concurrently [24]. This depends on the test conditions, and the previous cycling history of the electrode [25,26]. If more particles are active during the impedance measurement, then the charge transfer resistance will be reduced. Examination of the anodes after cycling revealed the onset of lithium plating. Lithium metal is likely to have a different charge transfer resistance from graphite, given the completely different reaction mechanism. For lithium, the charge transfer resistance is unlikely to vary with the state of charge of the cell, unlike graphite anodes, where the exchange current density does vary with state of charge.
The post mortem examinations also showed microscopic changes within the electrode structures. Mechanical deformations led to delamination of the coatings, and cracking of particles. The former will increase the series resistance. The latter will increase the surface area available for electron transfer reactions, and hence reduce the charge transfer resistance.
The low frequency tail was fitted using a constant phase element, rather than a Warburg component with a fixed gradient of 45°. This gives two parameters, ZCPE = 1/(iω)n P, where n is a power term, and P is a mathematical term which varies according to n. These are collected in Table 2. If the process is true infinite diffusion, then n = 0.5. However, the values of n were in the range 0.62 to 0.68. The low frequency response of the full cell is a combination of the low frequency response of the two electrodes. This is likely to be solid state diffusion for the graphitic part of the anode. The limiting mechanism for LFP cathodes is usually phase conversion, rather than diffusion [27]. Lithium ion cells rarely match the idealised Warburg model for infinite diffusion, and typically n > 0.5. There are various possible explanations for this, including non-cylindrical pore geometry [28] and anomalous diffusion [29].

2.5. Nuclear Magnetic Resonance (NMR) Spectroscopy

NMR spectroscopy was performed on three cells to determine if electrolyte breakdown during cycling had a major role in cell failure. Figure 10 shows 1 H NMR spectra of the three cells illustrating the major organic solvent peaks, which include: ethyl methyl carbonate (EMC), dimethyl carbonate (DMC), ethylene carbonate (EC) and propylene carbonate (PC). Additionally, ethylene sulfite (ES) is detected as an additive which has been shown to suppress the intercalation of PC into graphite, provide a high oxidation stability and suppress electrolyte decomposition [30]. Succinonitrile was also detected as a functional additive, used to improve the thermal stability [31]. For quantitative NMR, Figure 10g shows the relative integral peaks as a function of a tetramethylsilane (TMS) reference standard. Following cycling, all peaks showed a drop in integral area, highlighting the consumption of the electrolyte. Interestingly, the shape of the peaks stayed consistent before and after cycling with no additional peaks representative of decomposition products being detected. This suggests that the decomposition of electrolyte did not have a detrimental effect on the cell performance.
The capacity loss in the cells of high currents has been ascribed to electrolyte loss at the observed localised mechanical deformation in the coating joints [12,21,22]. This would be exacerbated by the finding that the electrolyte has been consumed in testing.

3. Materials and Methods

This study utilised commercial A123 18,650 cylindrical cells of nominal capacity 1.1 Ah. These are of LFP/Gr chemistry with operating voltage range 2.0–3.6 V and continuous current limits 16 A (discharge) and 5 A (charge). Details on the cells and their respective aging conditions are outlined in Table 3.
Cell failure testing was carried out in a purpose-built abuse test chamber set at a temperature of 25 °C. Charging was carried out using a TDK Lambda 10 kW programmable DC power supply. Discharging was carried out using a NHR 4700-6 DC Electronic Load, with the data logged using Labview software. Thermocouples were attached to the cell surface at the top, middle and the bottom of the cell. The cell setup with thermocouples is shown by Figure 11.
High rate cycling was carried out using a commercial battery cycler (Bitrode MCV 16-100-5) and a temperature-controlled environmental chamber (ESPEC Model PL-3J) set at 25 °C. Cells were electrochemically characterised at the beginning of cycling and then after aging at increments of 250 cycles. Characterisation here involved determining the capacity and resistance as well as carrying out power testing and impedance measurements. The capacity and resistance were determined by charging the cell using constant current-constant voltage protocol (CC-CV) to 3.6 V with a current rate of 3 C. After the charge cycle completed (when the current reached C/3), this was followed by a 30 min pause. The discharging involved a constant current (CC) protocol until 2.0 V and then pausing for 30 min. Power testing involved charging with a 1 C current for 10 s and discharged with 1 C for 10 s. EIS was then carried out after a 30 min pause. Power testing and EIS were undertaken at SOCs of 10%, 50% and 90%.
EIS tests were performed using a Solatron Modulab system (model 2100A) fitted with 2 A booster card using galvanostatic mode using Modulab XM ECS software. The EIS spectra were measured in a frequency range of 10 to 10 kHz, with five frequency points per decade and a current amplitude of 800 mA. All the measurements were made at 25 °C. After changing the state of charge, the cell was allowed to stabilise for 30 min, before the impedance measurements were performed.
CT scans were carried out using a Metris X-TEK XTH 225 LC set to a resolution of 43.4µm. CT reconstruction software used was X-ray Controller Inspect-X 4.3.1 and CT reconstruction software used was CT Pro Version XT 4.3.1.
For post-mortem examination, cells were placed inside an Ar-filled glove box (<5 ppm H2O/O2). The top of the cells were removed to expose the jelly roll. Cells were left overnight to allow the electrolyte to evaporate. The remaining cell can was removed so that the jelly roll could be unwound and inspected, with the specimen extracted (using standard materialographic techniques) to represent typical features seen. SEM images were obtained using a Carl Zeiss Sigma Field Emission Scanning Electron Microscope (FEG-SEM).
NMR samples were prepared by extracting the electrolyte also in an argon atmosphere glove box (<5 ppm H2O/O2). Cells were opened followed by an immediate liquid-liquid extraction of the electrolyte. A solvent mixture containing DMSO and chloroform (50:50 ratio) was used to extract the electrolyte from cells. The extracted electrolyte was filtered and transferred into an NMR tube. The NMR measurements were preformed using Bruker Avance III HD 300 MHz spectrometer.

4. Conclusions

To conclude, there exists a window above manufacturers’ stated limits that a cell can be operated safely. This study focused on applying higher than specified currents whilst maintaining manufacturer stated voltage limits.
It was found that a current of 1.38 times the discharge current and 4.4 times greater charge current could be applied for 500 cycles without catastrophic failure. However, the application of these currents resulted in a rapid decrease in capacity in the first 60 cycles. This is due to irreversible effects such as jelly roll deformation and lithium plating, which in practice would result in the end of cell life.
Application of 20 C currents resulted in increases in cell temperature, during both charge and discharge. The discharge half cycle increased the temperature more, but natural convection during the rest step cooled the cell temperature to near ambient.
With each cycle of charge and discharge, the cell experienced thermal gradients. These gradients in turn caused expansion and contraction of the componentry and subsequent stresses, resulting in deformation of the jelly roll. These deformations emanate from the centre of the cell in an axial direction towards the outside of the cell, suggesting the core of the cell was the hottest. These jelly roll deformations are thought to have occurred in a progressive manner with each cycle causing thermal stresses and subsequent deformation within the cell. As such, the mechanism of jelly roll deformation is thought to be akin to thermal fatigue involving thermal gradients and mechanical constraint caused by the rigid outer can and centre pin.
Deforming of the joints caused cracking of the coating as well as delamination of the coating, which are thought to have contributed to the increase in series resistance with cycling. However, the charge transfer resistance reduced during the first 250 cycles. This was probably due to the onset of lithium plating at the anode, with lithium having a lower charge transfer resistance than graphite. However, lithium plating will consume electrolyte, and lead to loss of cell capacity.
The centre pin increases the resistance of the cell to these deformations. Convection cooling, particularly if applied to the centre of the cell would further reduce these stresses caused by temperatures which would subsequently reduce the deformations and allow the cell to maintain capacity and resistance criteria for longer.

Author Contributions

Conceptualization, J.H., M.L. (Michael Lain) and E.K.; methodology, J.H.; software, J.H.; validation, J.H., M.L. (Michael Lain) and F.M.; formal analysis, J.H., M.L. (Michael Lain) and F.M.; investigation, J.H., M.L. (Michael Lain) and F.M.; resources, J.H.; data curation, J.H., M.L. (Michael Lain) and F.M.; writing—original draft preparation, J.H. and M.L. (Melanie Loveridge); writing—review and editing, J.H., E.K., M.C., M.L. (Michael Lain), and M.L. (Melanie Loveridge); visualization, J.H. and F.M.; supervision, J.H.; project administration, J.H.; funding acquisition, D.G. All authors have read and agreed to the published version of the manuscript.

Funding

This research was funded by Advanced Propulsion Centre UK, BMW Motorsport Ltd. (lead partner), McLaren Automotive Ltd., Delta Motorsports Ltd. and the University of Warwick.

Conflicts of Interest

The authors declare no conflict of interest.

References

  1. Goodenough, J.B.; Kim, Y. Challenges for Rechargeable Li Batteries. Chem. Mater. 2010, 22, 587–603. [Google Scholar]
  2. Ansean, D.; González, D.A.; Viera, J.; Garcia, V.; Blanco, C.R.; Valledor, M. Fast charging technique for high power lithium iron phosphate batteries: A cycle life analysis. J. Power Sources 2013, 239, 9–15. [Google Scholar]
  3. Schroeder, A.; Traber, T. The economics of fast charging infrastructure for electric vehicles. Energy Policy 2012, 43, 136–144. [Google Scholar]
  4. Heubner, C.; Schneider, M.; Michaelis, A. Diffusion-Limited C-Rate: A Fundamental Principle Quantifying the Intrinsic Limits of Li-Ion Batteries. Adv. Energy Mater. 2020, 10, 1902523. [Google Scholar]
  5. Peterson, S.W. The Effect of Microstructure on Transport Properties of Porous Electrodes. Ph.D. Thesis, Brigham Young University, Provo, UT, USA, 2015. [Google Scholar]
  6. Severson, K.A.; Attia, P.M.; Jin, N.; Perkins, N.; Jiang, B.; Yang, Z.; Chen, M.H.; Aykol, M.; Herring, P.K.; Fraggedakis, D.; et al. Data-driven prediction of battery cycle life before capacity degradation. Nat. Energy 2019, 4, 383–391. [Google Scholar]
  7. Pistoia, G. Electric and Hybrid Vehicles: Power Sources, Models, Sustainability, Infrastructure and the Market; Elsevier: Amsterdam, The Netherlands; Saint Louis, MO, USA, 2010. [Google Scholar]
  8. Aiken, C.P.; Self, J.; Petibon, R.; Xia, X.; Paulsen, J.M.; Dahn, J.R. A Survey of In Situ Gas Evolution during High Voltage Formation in Li-Ion Pouch Cells. J. Electrochem. Soc. 2015, 162, A760–A767. [Google Scholar]
  9. Kong, W.; Li, H.; Huang, X.; Chen, L. Gas evolution behaviors for several cathode materials in lithium-ion batteries. J. Power Sources 2005, 142, 285–291. [Google Scholar]
  10. Ma, X.; Harlow, J.E.; Li, J.; Ma, L.; Hall, D.S.; Buteau, S.; Genovese, M.; Cormier, M.; Dahn, J.R. Hindering Rollover Failure of Li[Ni0.5Mn0.3Co0.2]O2/Graphite Pouch Cells during Long-Term Cycling. J. Electrochem. Soc. 2019, 166, A711–A724. [Google Scholar]
  11. Drake, S.J.; Martin, M.; Wetz, D.A.; Ostanek, J.K.; Miller, S.P.; Heinzel, J.M.; Jain, A. Heat generation rate measurement in a Li-ion cell at large C-rates through temperature and heat flux measurements. J. Power Sources 2015, 285, 266–273. [Google Scholar] [CrossRef]
  12. Waldmann, T.; Gorse, S.; Samtleben, T.; Schneider, G.; Knoblauch, V.; Wohlfahrt-Mehrens, M. A Mechanical Aging Mechanism in Lithium-Ion Batteries. J. Electrochem. Soc. 2014, 161, A1742–A1747. [Google Scholar] [CrossRef]
  13. Loveridge, M.; Remy, G.; Kourra, N.; Genieser, R.; Barai, A.; Lain, M.; Guo, Y.; Amor-Segan, M.; Williams, M.; Amietszajew, T.; et al. Looking Deeper into the Galaxy (Note 7). Batteries 2018, 4, 3. [Google Scholar] [CrossRef] [Green Version]
  14. Saw, L.H.; Ye, Y.; Tay, A.A.O. Electrochemical–thermal analysis of 18650 Lithium Iron Phosphate cell. Energy Convers. Manag. 2013, 75, 162–174. [Google Scholar] [CrossRef]
  15. Bach, T.C.; Schuster, S.F.; Fleder, E.; Müller, J.; Brand, M.J.; Lorrmann, H.; Jossen, A.; Sextl, G. Nonlinear aging of cylindrical lithium-ion cells linked to heterogeneous compression. J. Energy Storage 2016, 5, 212–223. [Google Scholar] [CrossRef]
  16. Amietszajew, T.; McTurk, E.; Fleming, J.; Bhagat, R. Understanding the limits of rapid charging using instrumented commercial 18650 high-energy Li-ion cells. Electrochim. Acta 2018, 263, 346–352. [Google Scholar] [CrossRef]
  17. Wulpi, D.J. Understanding How Components Fail; ASM International: Cleveland, OH, USA, 2013. [Google Scholar]
  18. Pfrang, A.; Kersys, A.; Kriston, A.; Sauer, D.U.; Rahe, C.; Käbitz, S.; Figgemeier, E. Geometrical Inhomogeneities as Cause of Mechanical Failure in Commercial 18650 Lithium Ion Cells. J. Electrochem. Soc. 2019, 166, A3745–A3752. [Google Scholar] [CrossRef]
  19. ASM Handbook Volume 8: Mechanical Testing and Evaluation; ASM International: Cleveland, OH, USA, 2000. [CrossRef]
  20. Kok, M.D.R.; Robinson, J.B.; Weaving, J.S.; Jnawali, A.; Pham, M.; Iacoviello, F.; Brett, D.J.L.; Shearing, P.R. Virtual unrolling of spirally-wound lithium-ion cells for correlative degradation studies and predictive fault detection. Sustain. Energy Fuels 2019, 3, 2972–2976. [Google Scholar] [CrossRef] [Green Version]
  21. Vetter, J.; Novák, P.; Wagner, M.R.; Veit, C.; Möller, K.C.; Besenhard, J.O.; Winter, M.; Wohlfahrt-Mehrens, M.; Vogler, C.; Hammouche, A. Ageing mechanisms in lithium-ion batteries. J. Power Sources 2005, 147, 269–281. [Google Scholar] [CrossRef]
  22. Wohlfahrt-Mehrens, M.; Vogler, C.; Garche, J. Aging mechanisms of lithium cathode materials. J. Power Sources 2004, 127, 58–64. [Google Scholar] [CrossRef]
  23. Barsoukov, E.; Macdonald, J.R. Impedance Spectroscopy: Theory, Experiment, and Applications; John Wiley & Sons, Incorporated: Hoboken, NJ, USA, 2005. [Google Scholar]
  24. Li, Y.; El Gabaly, F.; Ferguson, T.R.; Smith, R.B.; Bartelt, N.C.; Sugar, J.D.; Fenton, K.R.; Cogswell, D.A.; Kilcoyne, A.L.; Tyliszczak, T.; et al. Current-induced transition from particle-by-particle to concurrent intercalation in phase-separating battery electrodes. Nat. Mater. 2014, 13, 1149–1156. [Google Scholar] [CrossRef]
  25. Srinivasan, V.; Newman, J. Existence of path-dependence in the LiFePO4 electrode. Electrochem. Solid-State Lett. 2006, 9, A110–A114. [Google Scholar]
  26. Sasaki, T.; Ukyo, Y.; Novak, P. Memory effect in a lithium-ion battery. Nat. Mater. 2013, 12, 569–575. [Google Scholar] [CrossRef] [PubMed]
  27. Bai, P.; Cogswell, D.A.; Bazant, M.Z. Suppression of phase separation in LiFePO4 nanoparticles during battery discharge. Nano Lett. 2011, 11, 4890–4896. [Google Scholar] [PubMed] [Green Version]
  28. Eloot, K.; Debuyck, F.; Moors, M.; Peteghem, A. Calculation of the impedance of noncylindrical pores Part I: Introduction of a matrix calculation method. J. Appl. Electrochem. 1995, 25, 326–333. [Google Scholar] [CrossRef]
  29. Bisquert, J.; Compte, A. Theory of the electrochemical impedance of anomalous diffusion. J. Electroanal. Chem. 2001, 499, 112–120. [Google Scholar] [CrossRef]
  30. Balbuena, P.B.; Wang, Y.X.; Yixuan, W. Lithium-Ion Batteries: Solid-Electrolyte Interphase; World Scientific Publishing Company: Singapore, 2003. [Google Scholar]
  31. Chen, R.; Liu, F.; Chen, Y.; Ye, Y.; Huang, Y.; Wu, F.; Li, L. An investigation of functionalized electrolyte using succinonitrile additive for high voltage lithium-ion batteries. J. Power Sources 2016, 306, 70–77. [Google Scholar] [CrossRef]
Figure 1. Typical cell failure test profile. (a) shows the entire plot, (b) a closer view of 20 C constant current (CC) discharge, (c) a closer view of constant voltage (CV) discharge.
Batteries 06 00057 g001
Figure 2. Average discharge capacity in high rate cycling test.
Batteries 06 00057 g002
Figure 3. Typical cell test data for high rate cycling test. (a) shows typical cell test data, (b) a closer view of cell test data.
Batteries 06 00057 g003
Figure 4. Axial X-ray computed tomography scans. (a) shows as received cell (b) shows failure test cell and (c) shows high rate cycled cell. Red arrows show kinks and tabs are shown by blue arrows.
Batteries 06 00057 g004
Figure 5. Frontal scans of (a) as-received cell (b) failure test cell and (c) high rate cycled cell. Deformation is indicated by red circles.
Batteries 06 00057 g005
Figure 6. Axial scans of high rate cycled cell. (a) shows schematic of cell, (b) shows top, (c) shows middle and (d) shows bottom of cell. Red arrows show kinks and tabs are shown by blue arrows.
Batteries 06 00057 g006
Figure 7. Micrograph (a) and schematic (b) of kinking observed.
Batteries 06 00057 g007
Figure 8. Surface examination of anode electrodes. (a) shows as received anode, (b) shows failure test cell anode and (c) shows high rate cycled cell anode. Plating is shown by red squares.
Batteries 06 00057 g008aBatteries 06 00057 g008b
Figure 9. Typical Electrochemical Impedance Spectroscopy (EIS) Results. (a) impedance spectra at 10% SOC and (b) equivalent circuit.
Batteries 06 00057 g009
Figure 10. NMR spectra for as-received, cell failure test cell and high rate cycled cell. (a) solvent peaks of ethyl methyl carbonate and propylene carbonate (b) solvent peaks of succinonitrile (c) solvent peaks of dimethyl carbonate and ethylene sulfite (d) solvent peaks of propylene carbonate (e) solvent peaks of ethylene carbonate (f) solvent peaks of ethyl methyl carbonate and (g) the relative integral peaks of as-received, cell failure test cell and high rate cycled cell.
Batteries 06 00057 g010aBatteries 06 00057 g010b
Figure 11. Cell failure testing setup showing thermocouple location.
Batteries 06 00057 g011
Table 1. Resistance Values Calculated While Fitting Equivalent Circuit.
CyclesRsR1
10%50%90%10%50%90%
Initial0.01790.01750.01800.01510.01200.0140
2500.0238N/A0.02070.0115N/A0.0100
5000.02590.02400.02430.01150.01150.0117
Table 2. Fitting Parameters for The Low Frequency Tail.
CyclesnP/Ω−1 sn
10%50%90%10%50%90%
Initial0.670.620.66270280260
2500.680.640.68320265250
5000.680.660.68310270325
Table 3. Overview of cell aging situations.
CellAging Conditions
IAs–received
IICell failure test. 20 C constant current (CC) then constant voltage (CV) to 1 C charge. Rest for 10 min. 20 C CC discharge. After 5 cycles increase by another 20 C in both charge and discharge until 100 C. 20 CC then CV to 1 C charge. Rest for 10 min. Discharge at CV to minimum voltage. Stop if cell fails.
IIIHigh rate cycling. 20 C CC then CV to C/3 charge. Rest for 15 min. 20 C CC discharge. Rest for 15 min. Repeat for 250 cycles.
Publisher’s Note: MDPI stays neutral with regard to jurisdictional claims in published maps and institutional affiliations.

