
Infiltrated and Isostatic Laminated NCM and LTO Electrodes with Plastic Crystal Electrolyte Based on Succinonitrile for Lithium-Ion Solid State Batteries

 , , , and
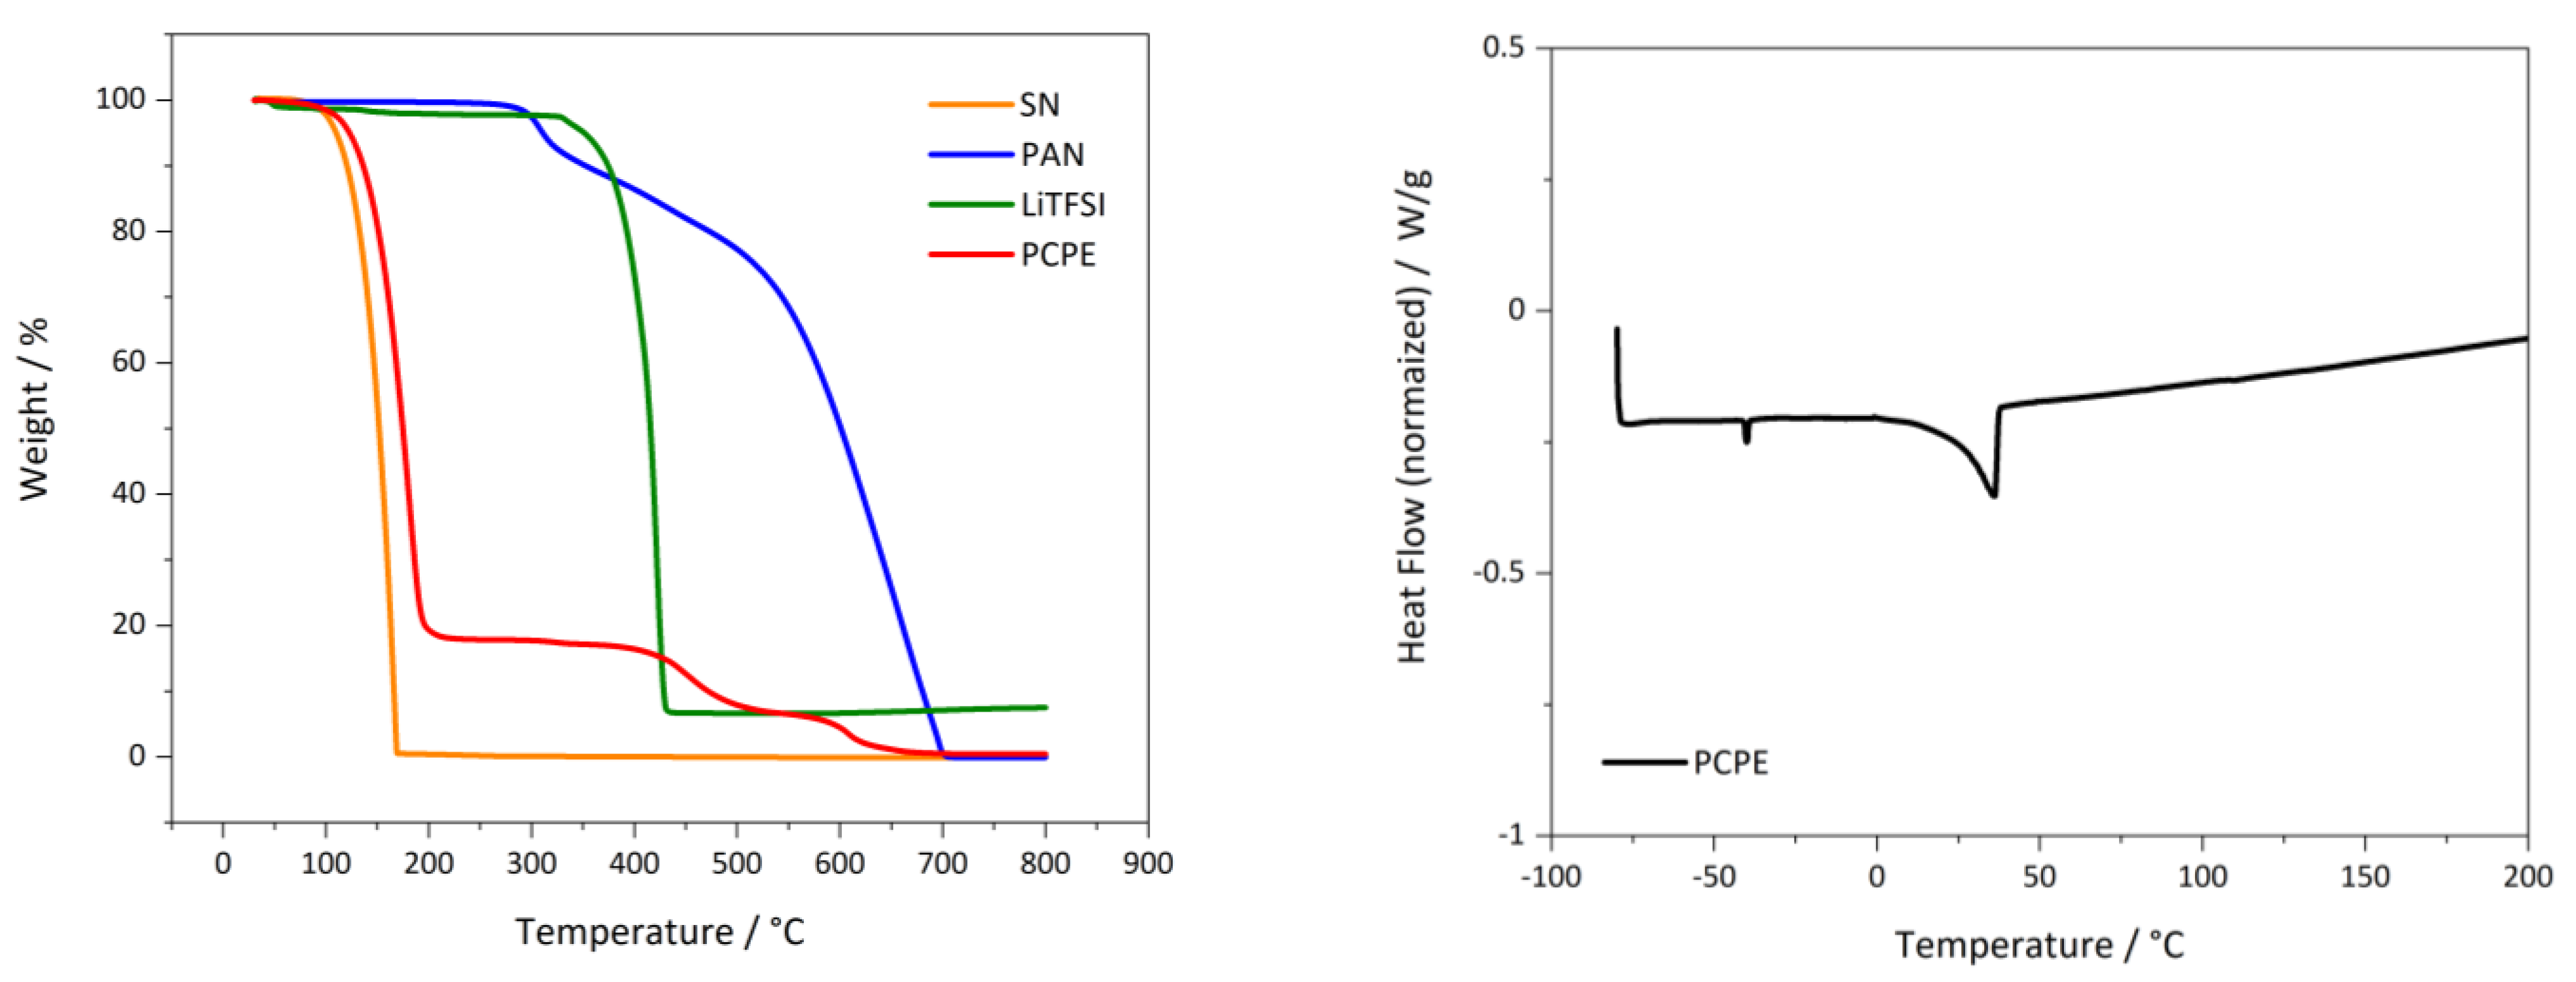
Abstract
:1. Introduction
2. Materials and Methods
2.1. Preparation of the PCPE and PCPIS (Plastic-Crystal Polymer Infiltrated Separator)
2.2. Cathode and Anode Preparation
2.3. Infiltration and Isostatic Lamination of Cathode and Anode with PCPE
2.4. Material Analysis
2.5. Cell Preparation and Electrochemical Characterization
3. Results and Discussion
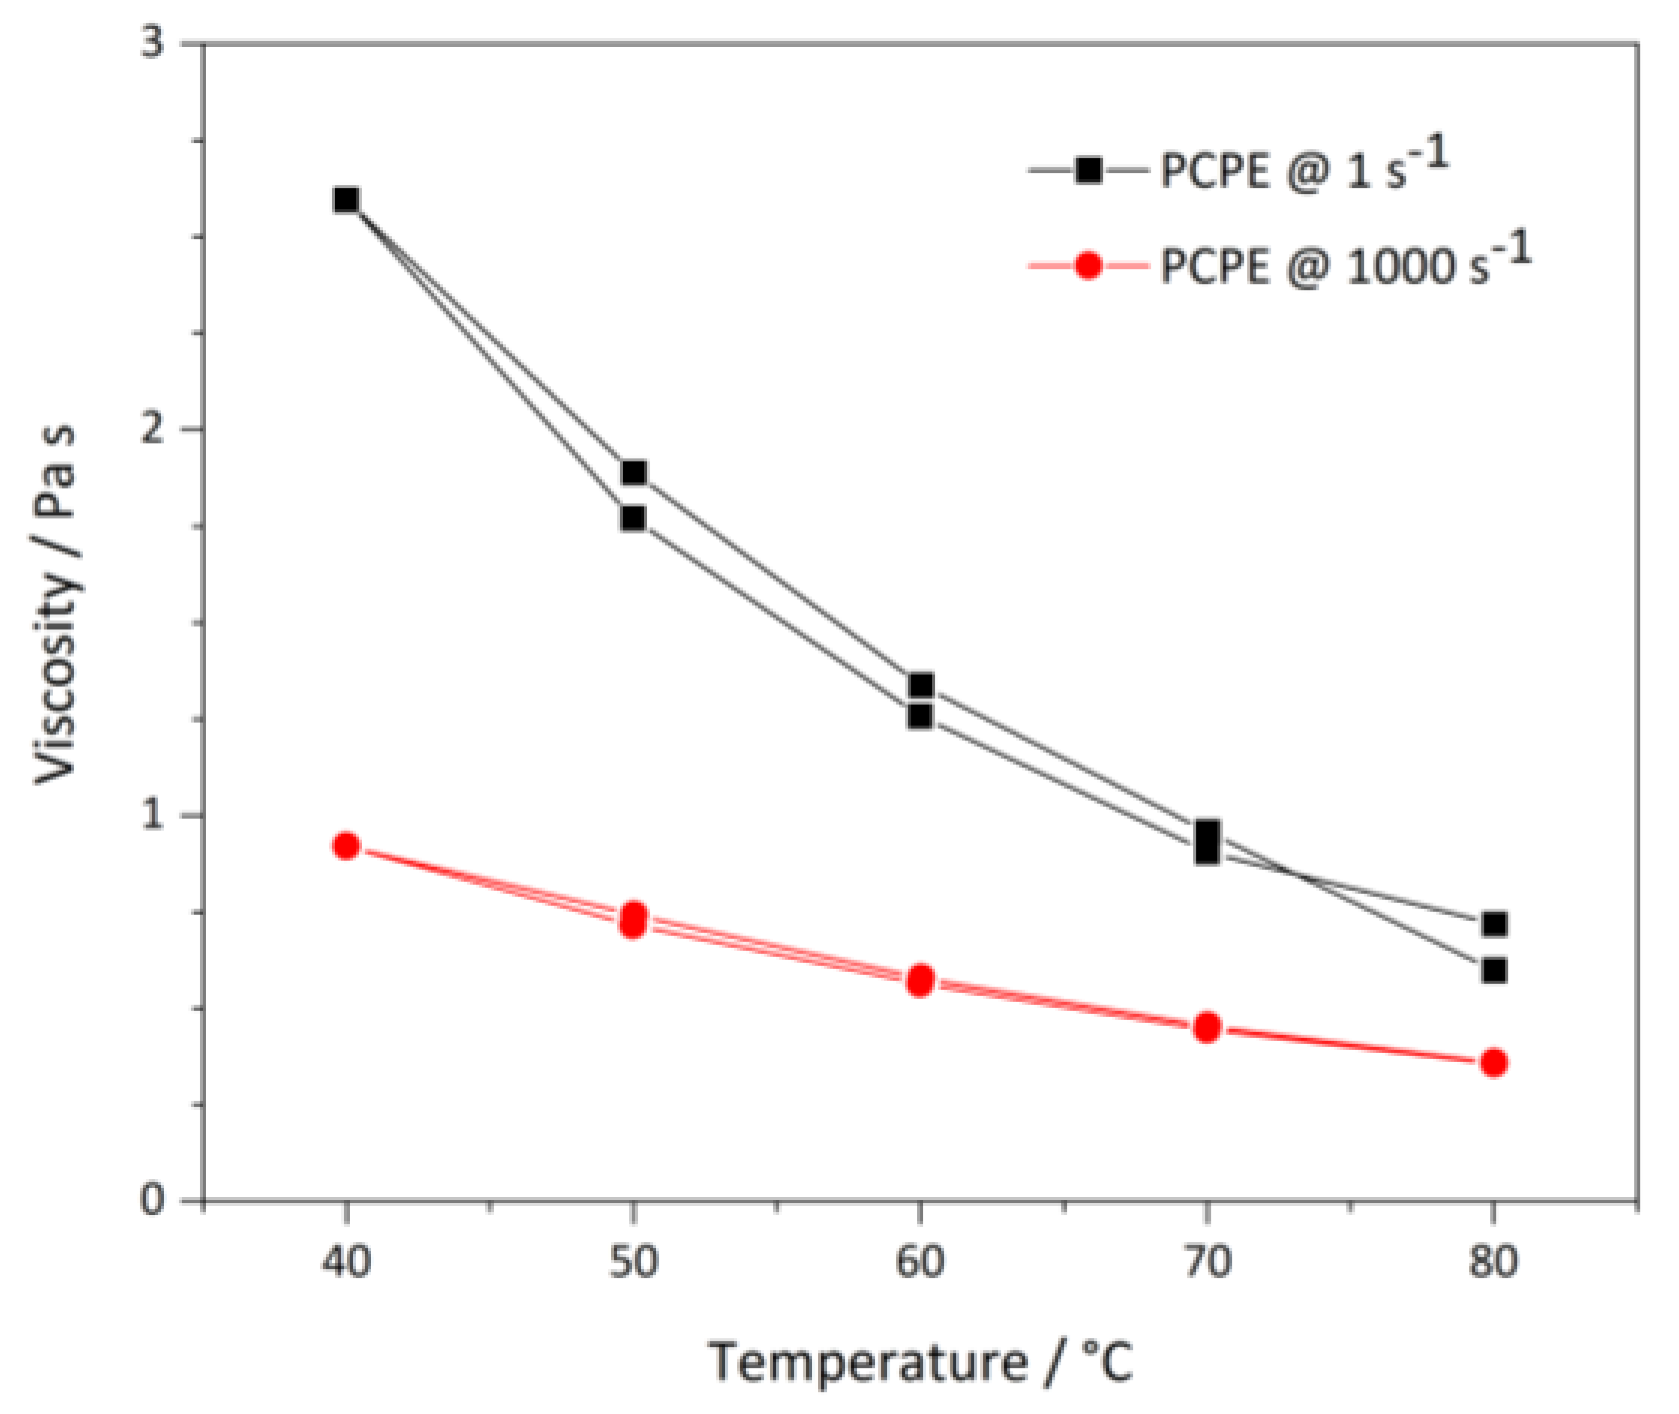
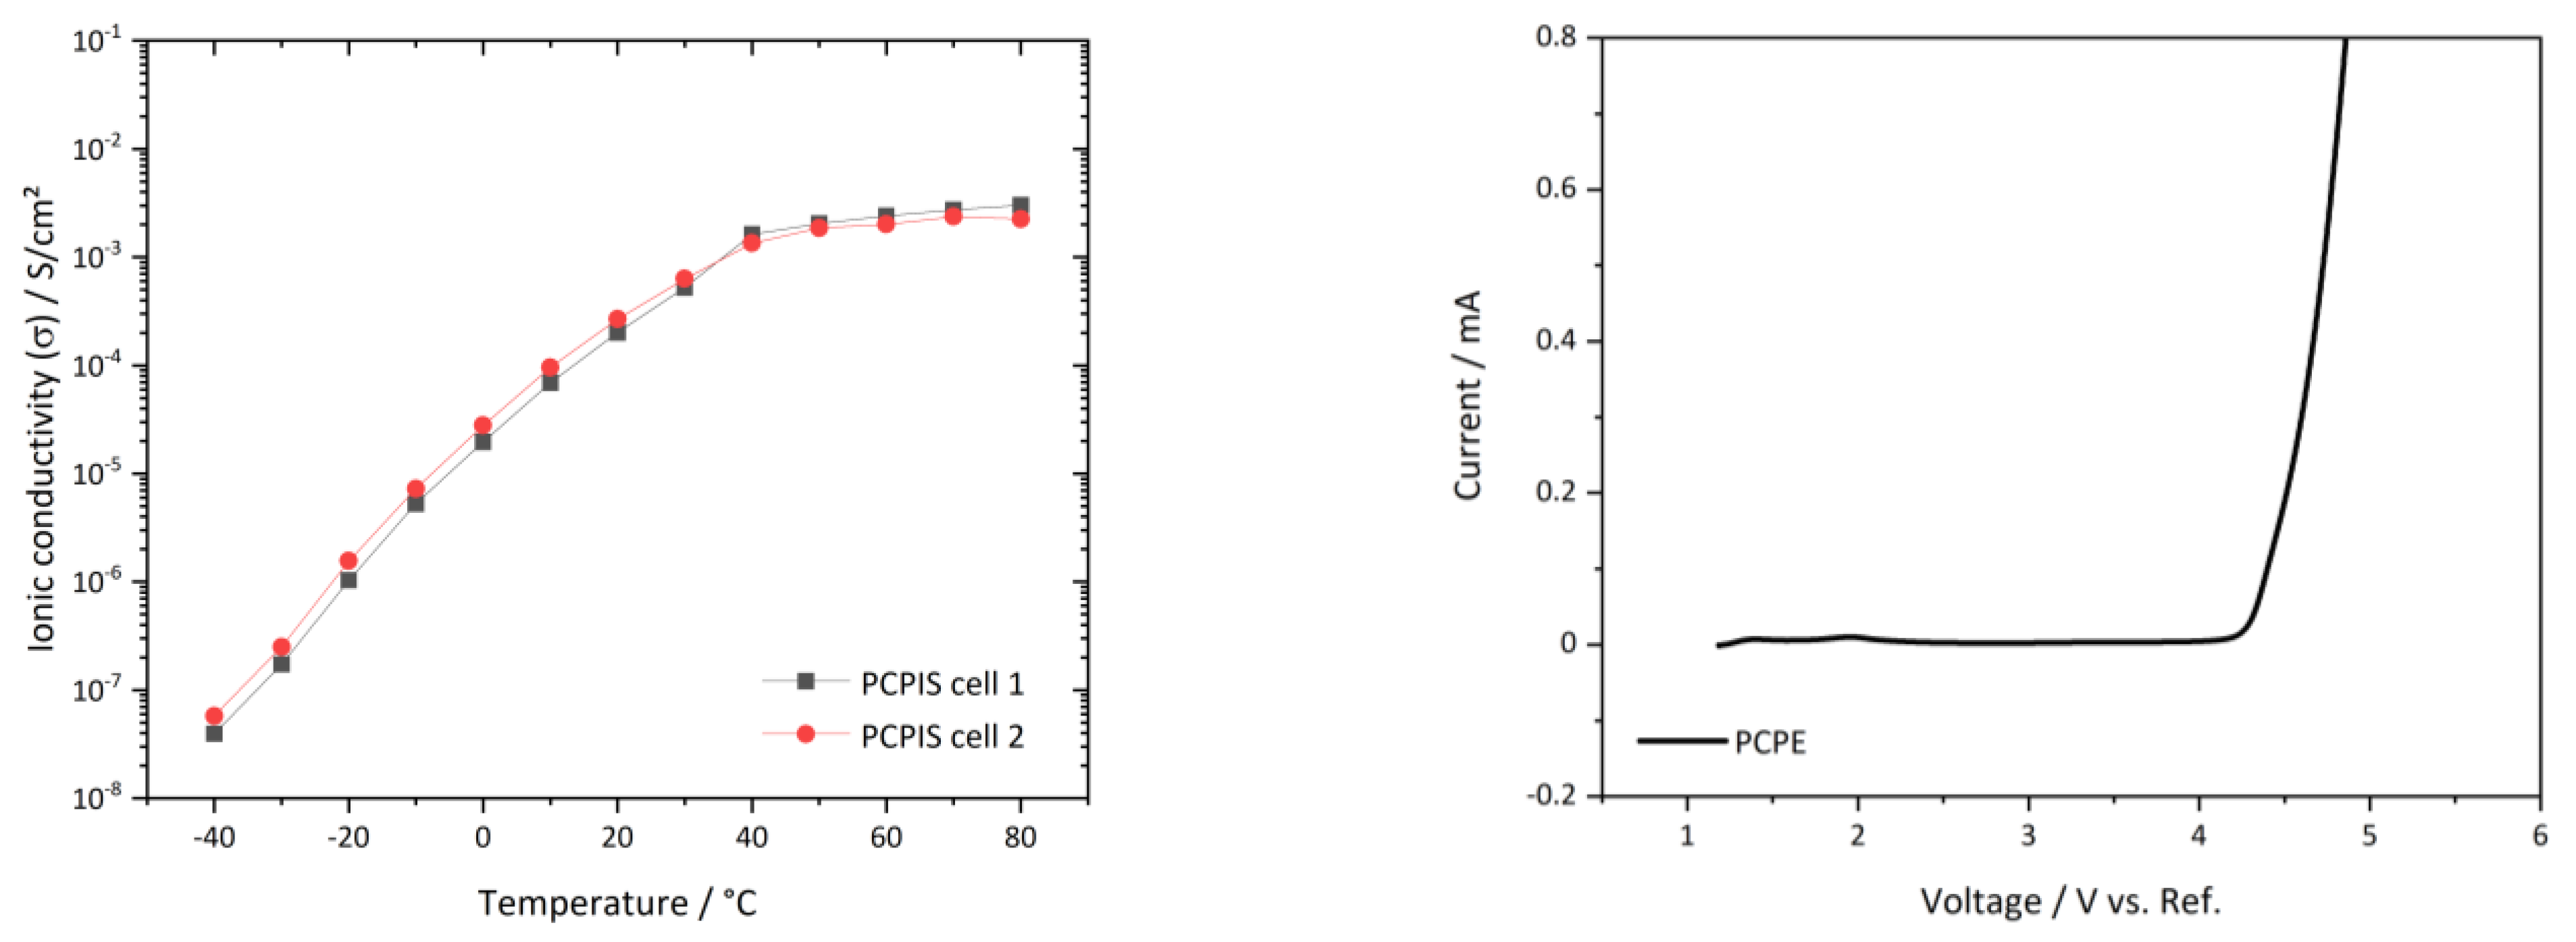
3.1. Characterization of PCPE
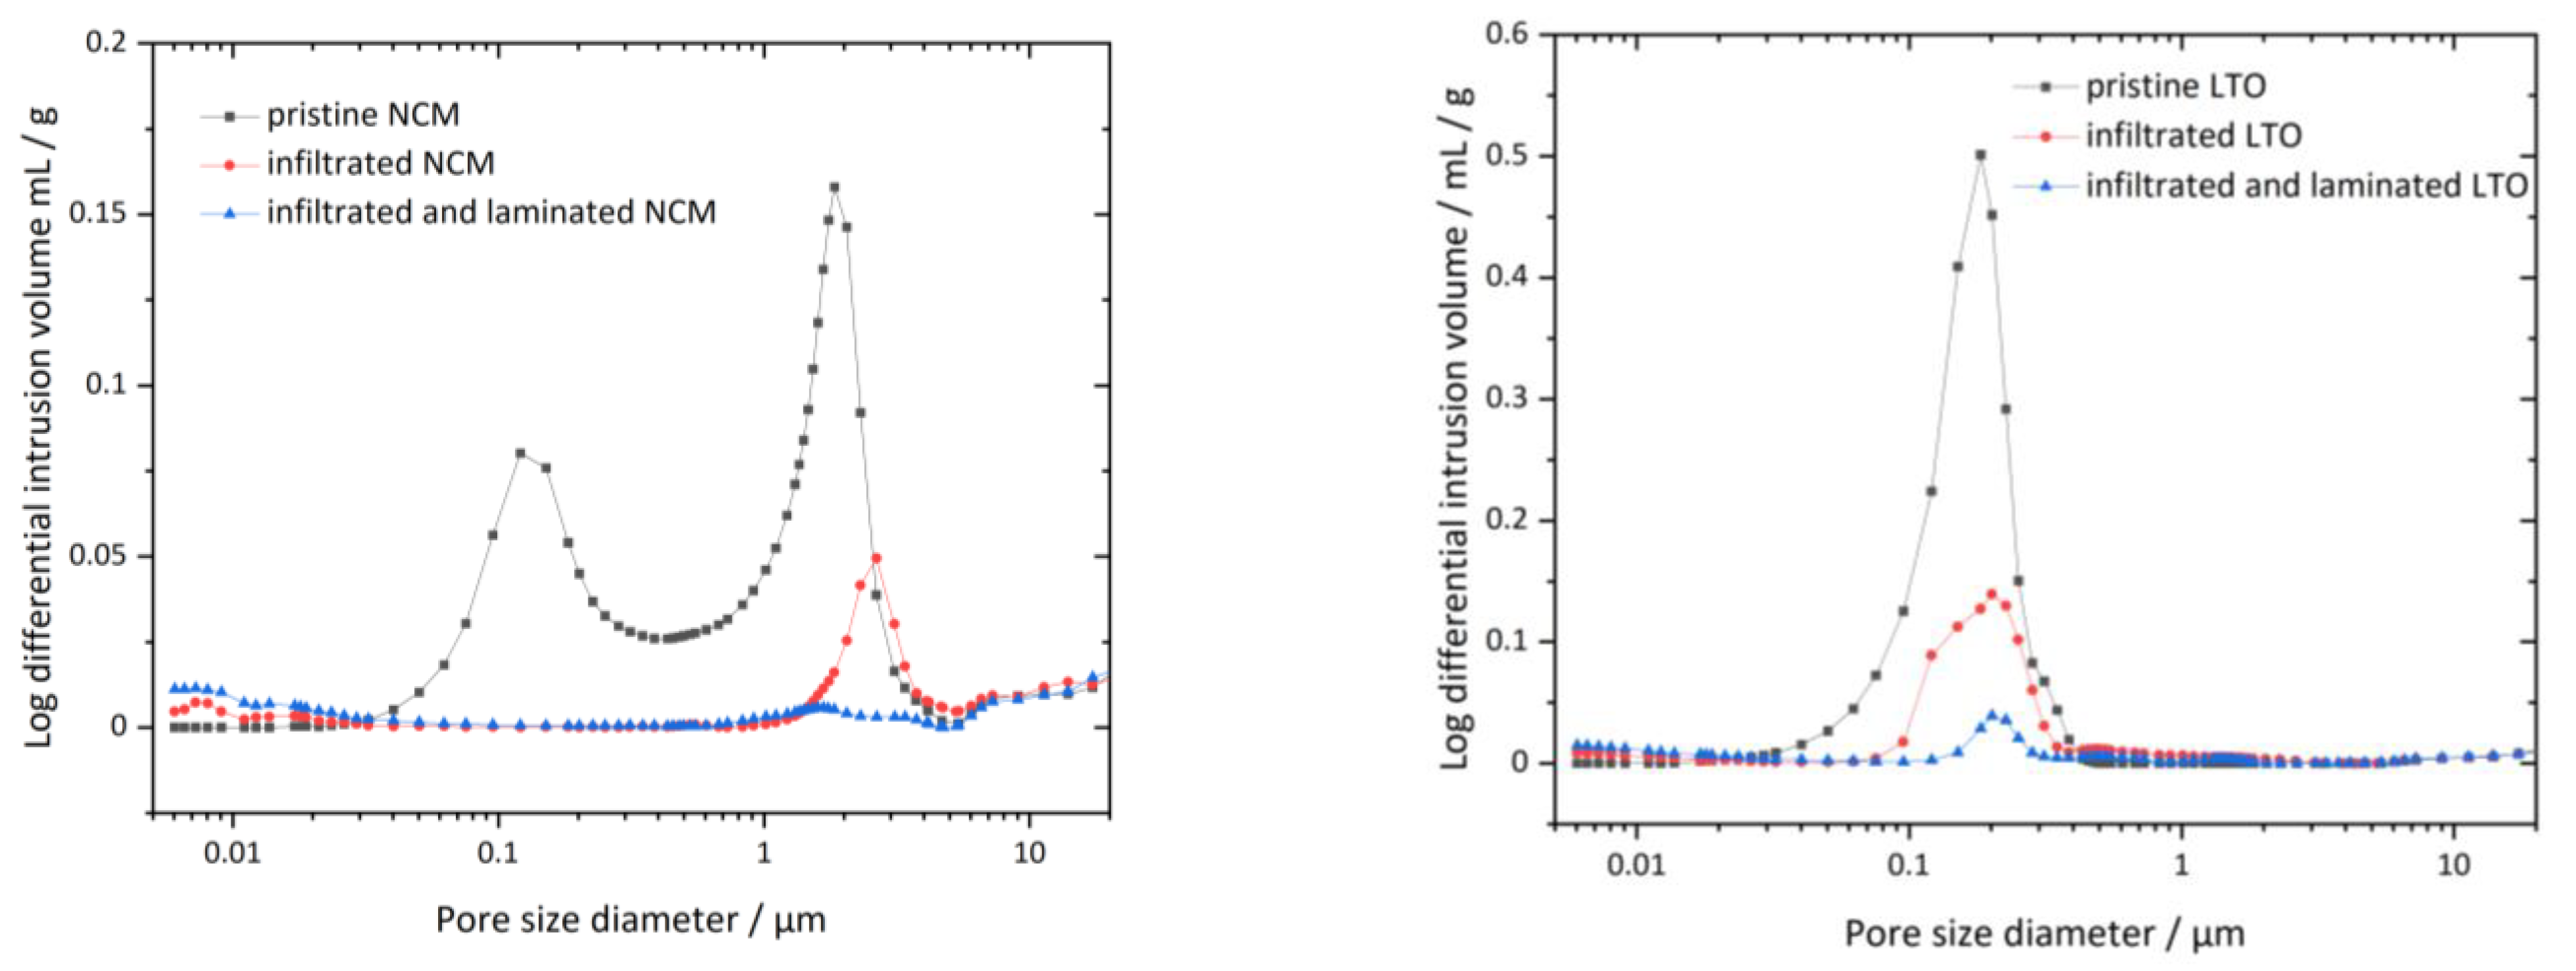
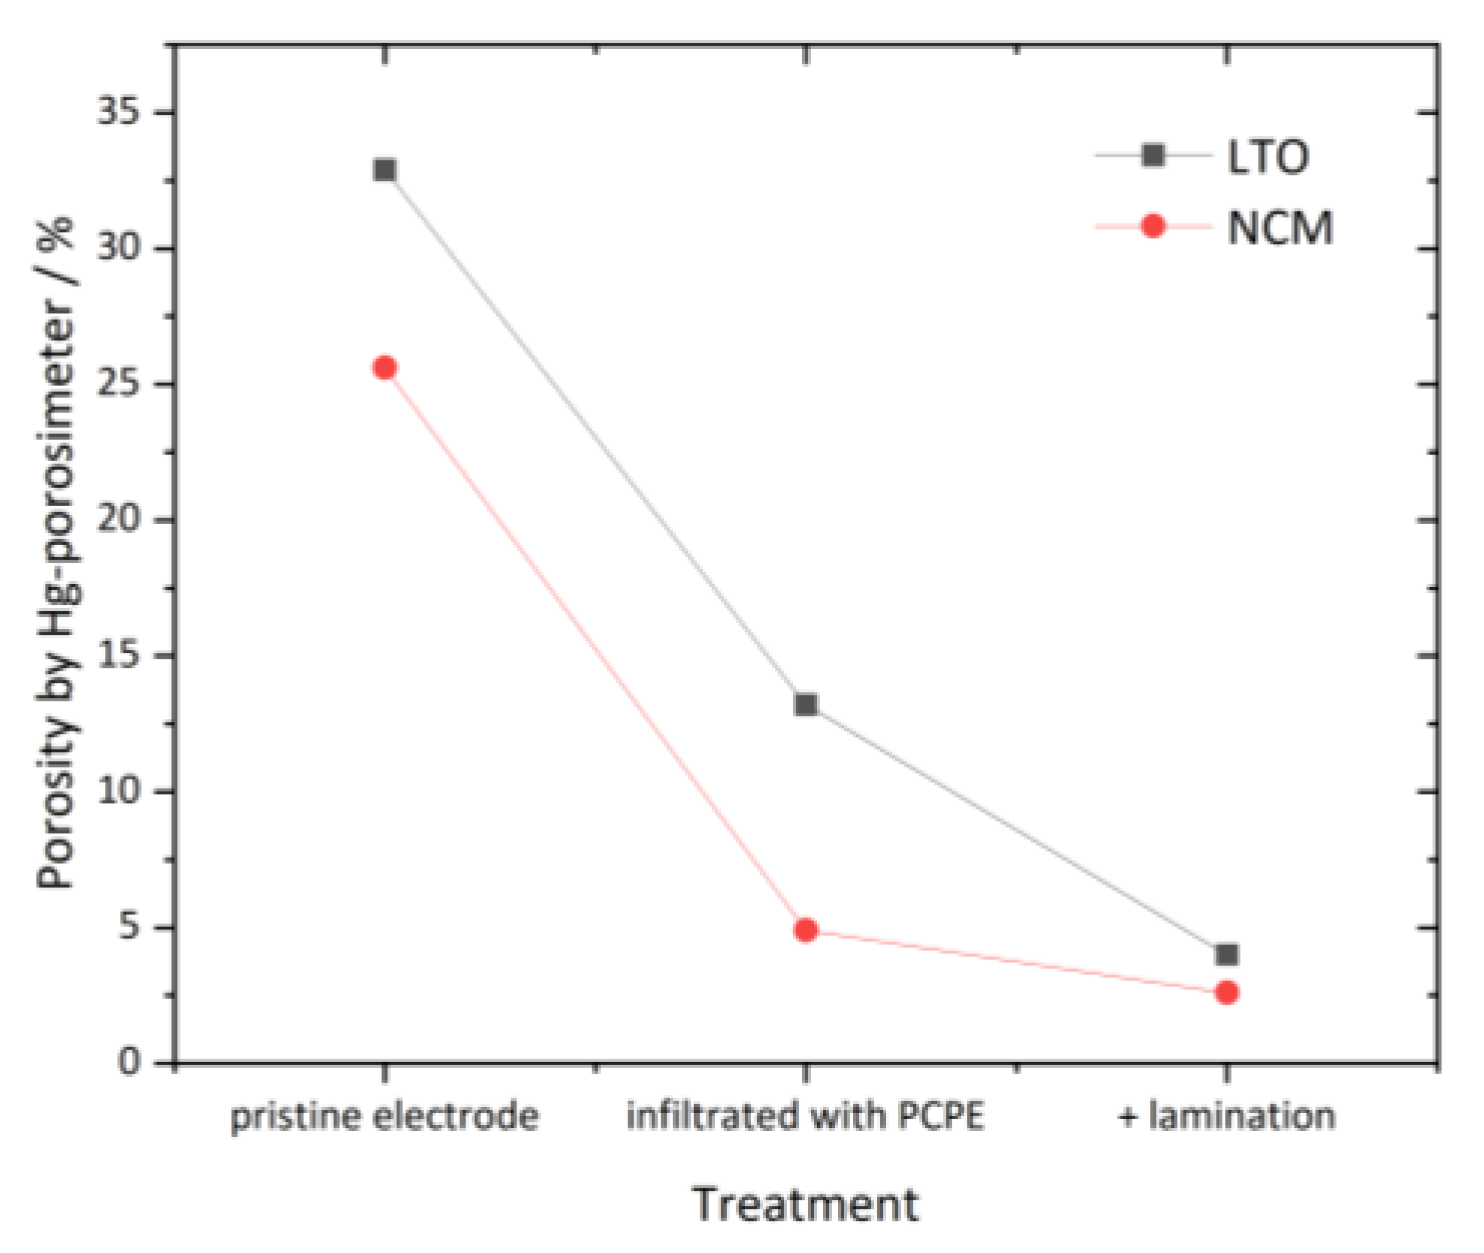
3.2. Porosity Measurement with PCPE Infiltrated Electrodes
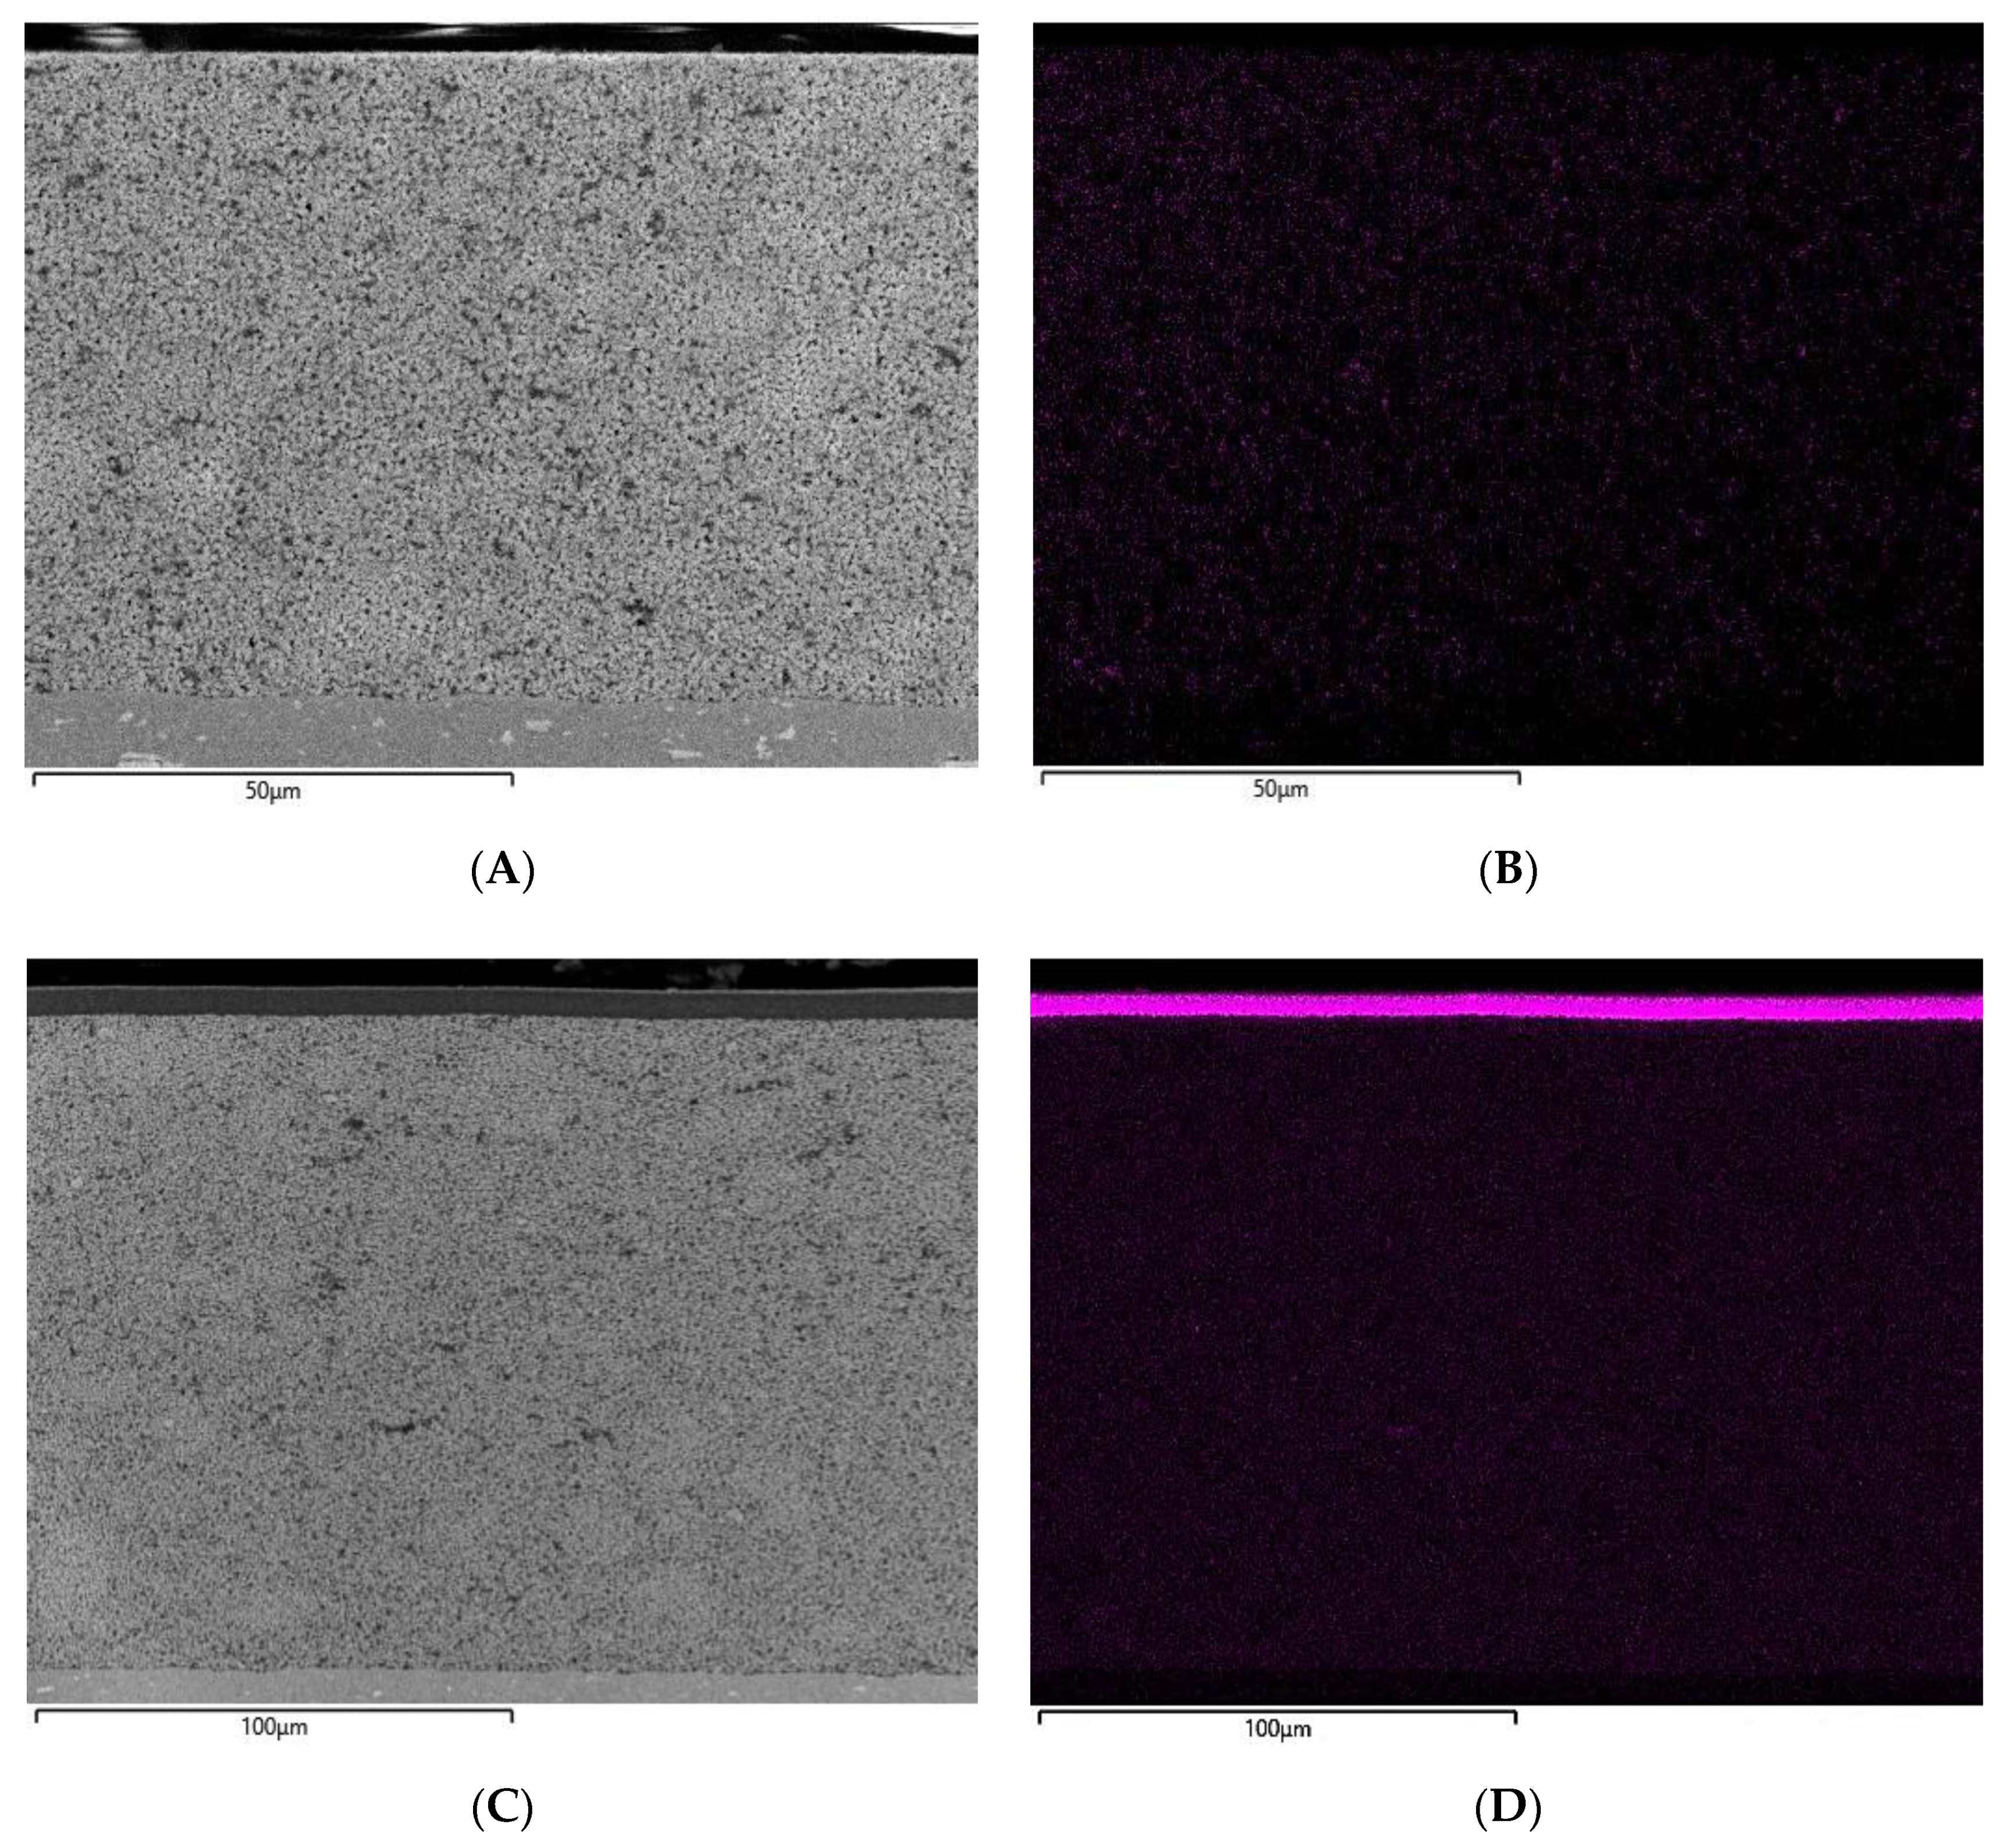
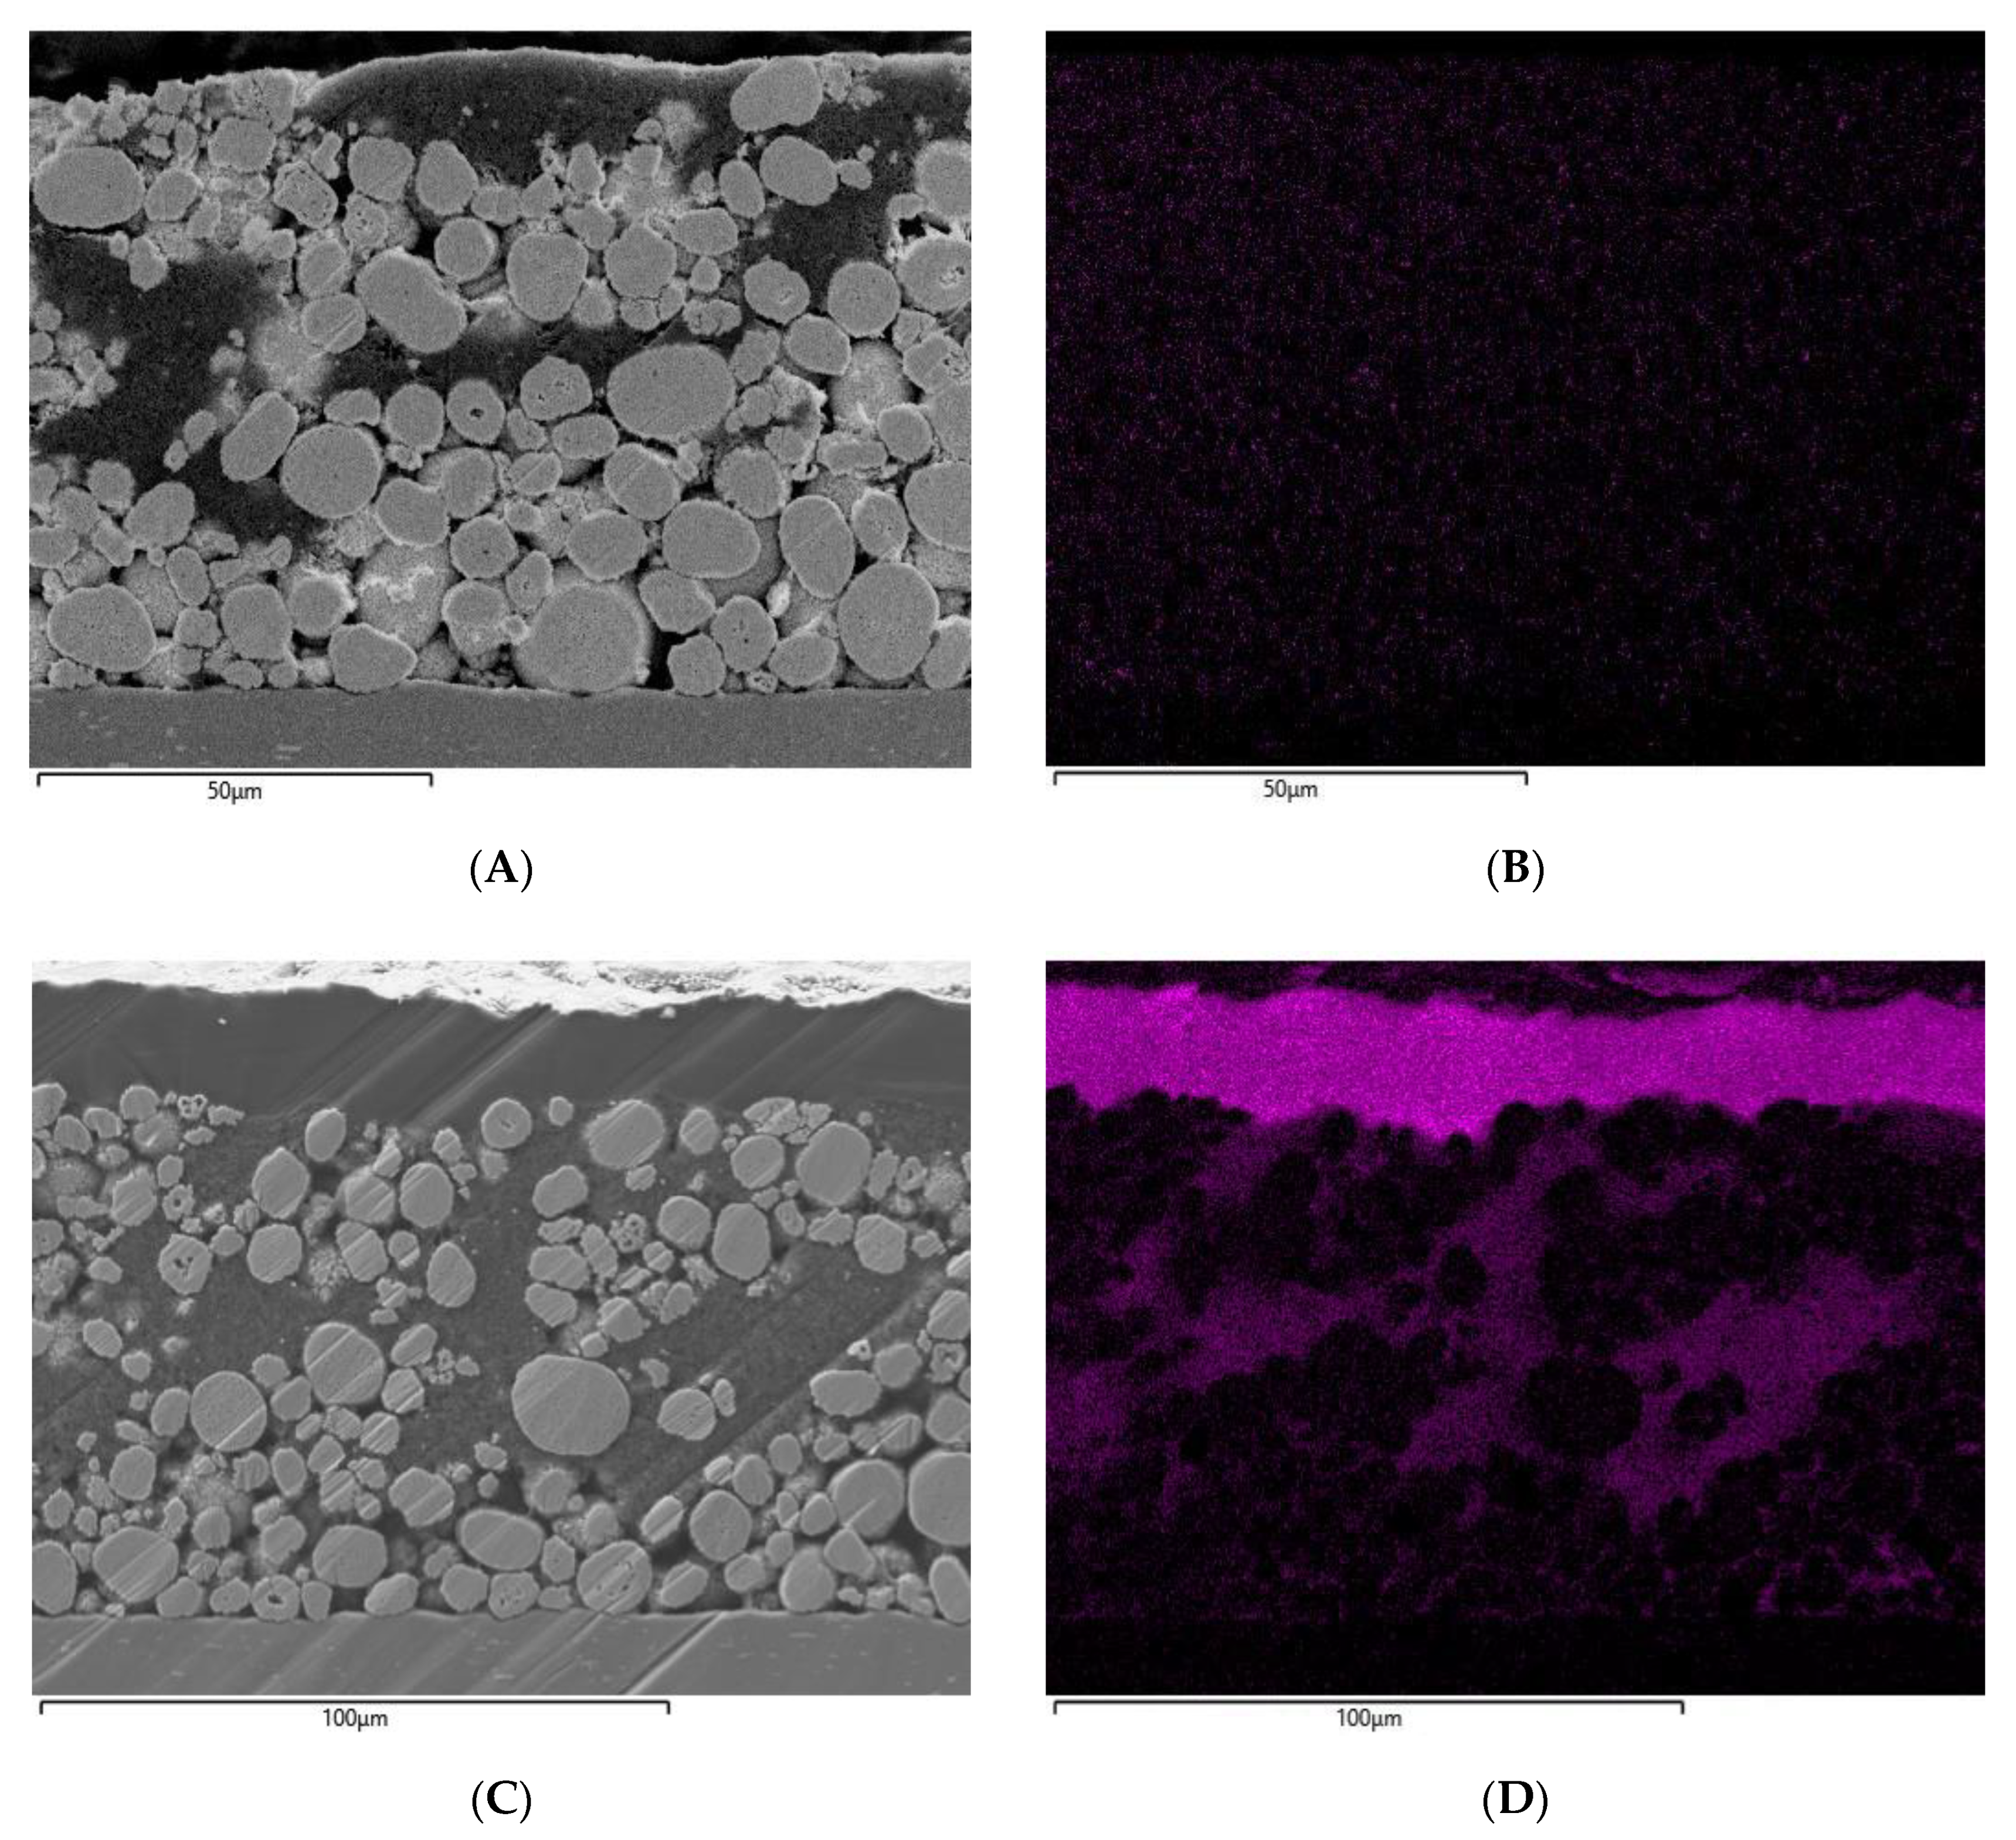
3.3. Cross-Section Analysis by FESEM-EDS of PCPE Infiltrated Electrodes
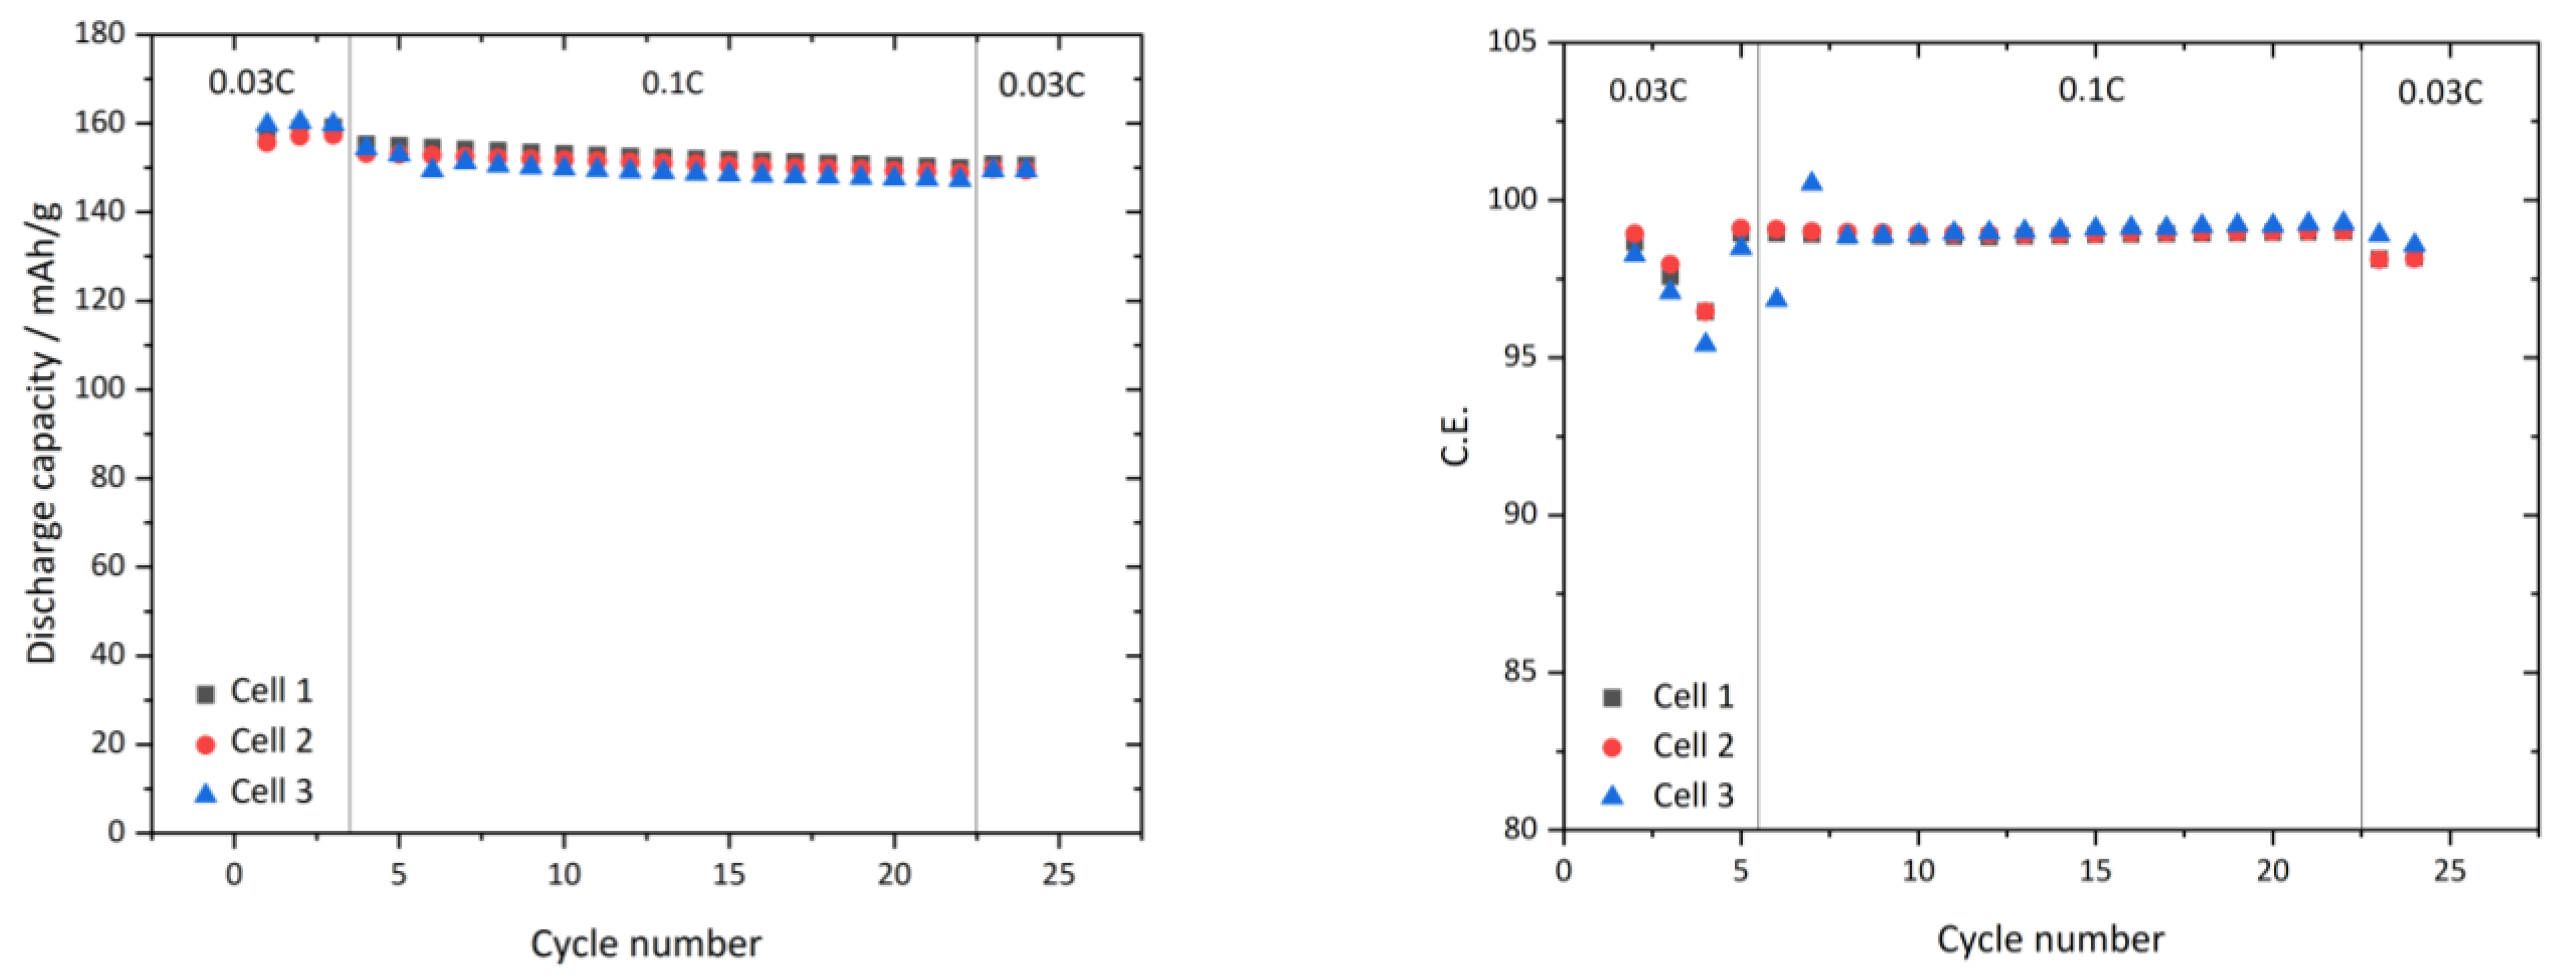
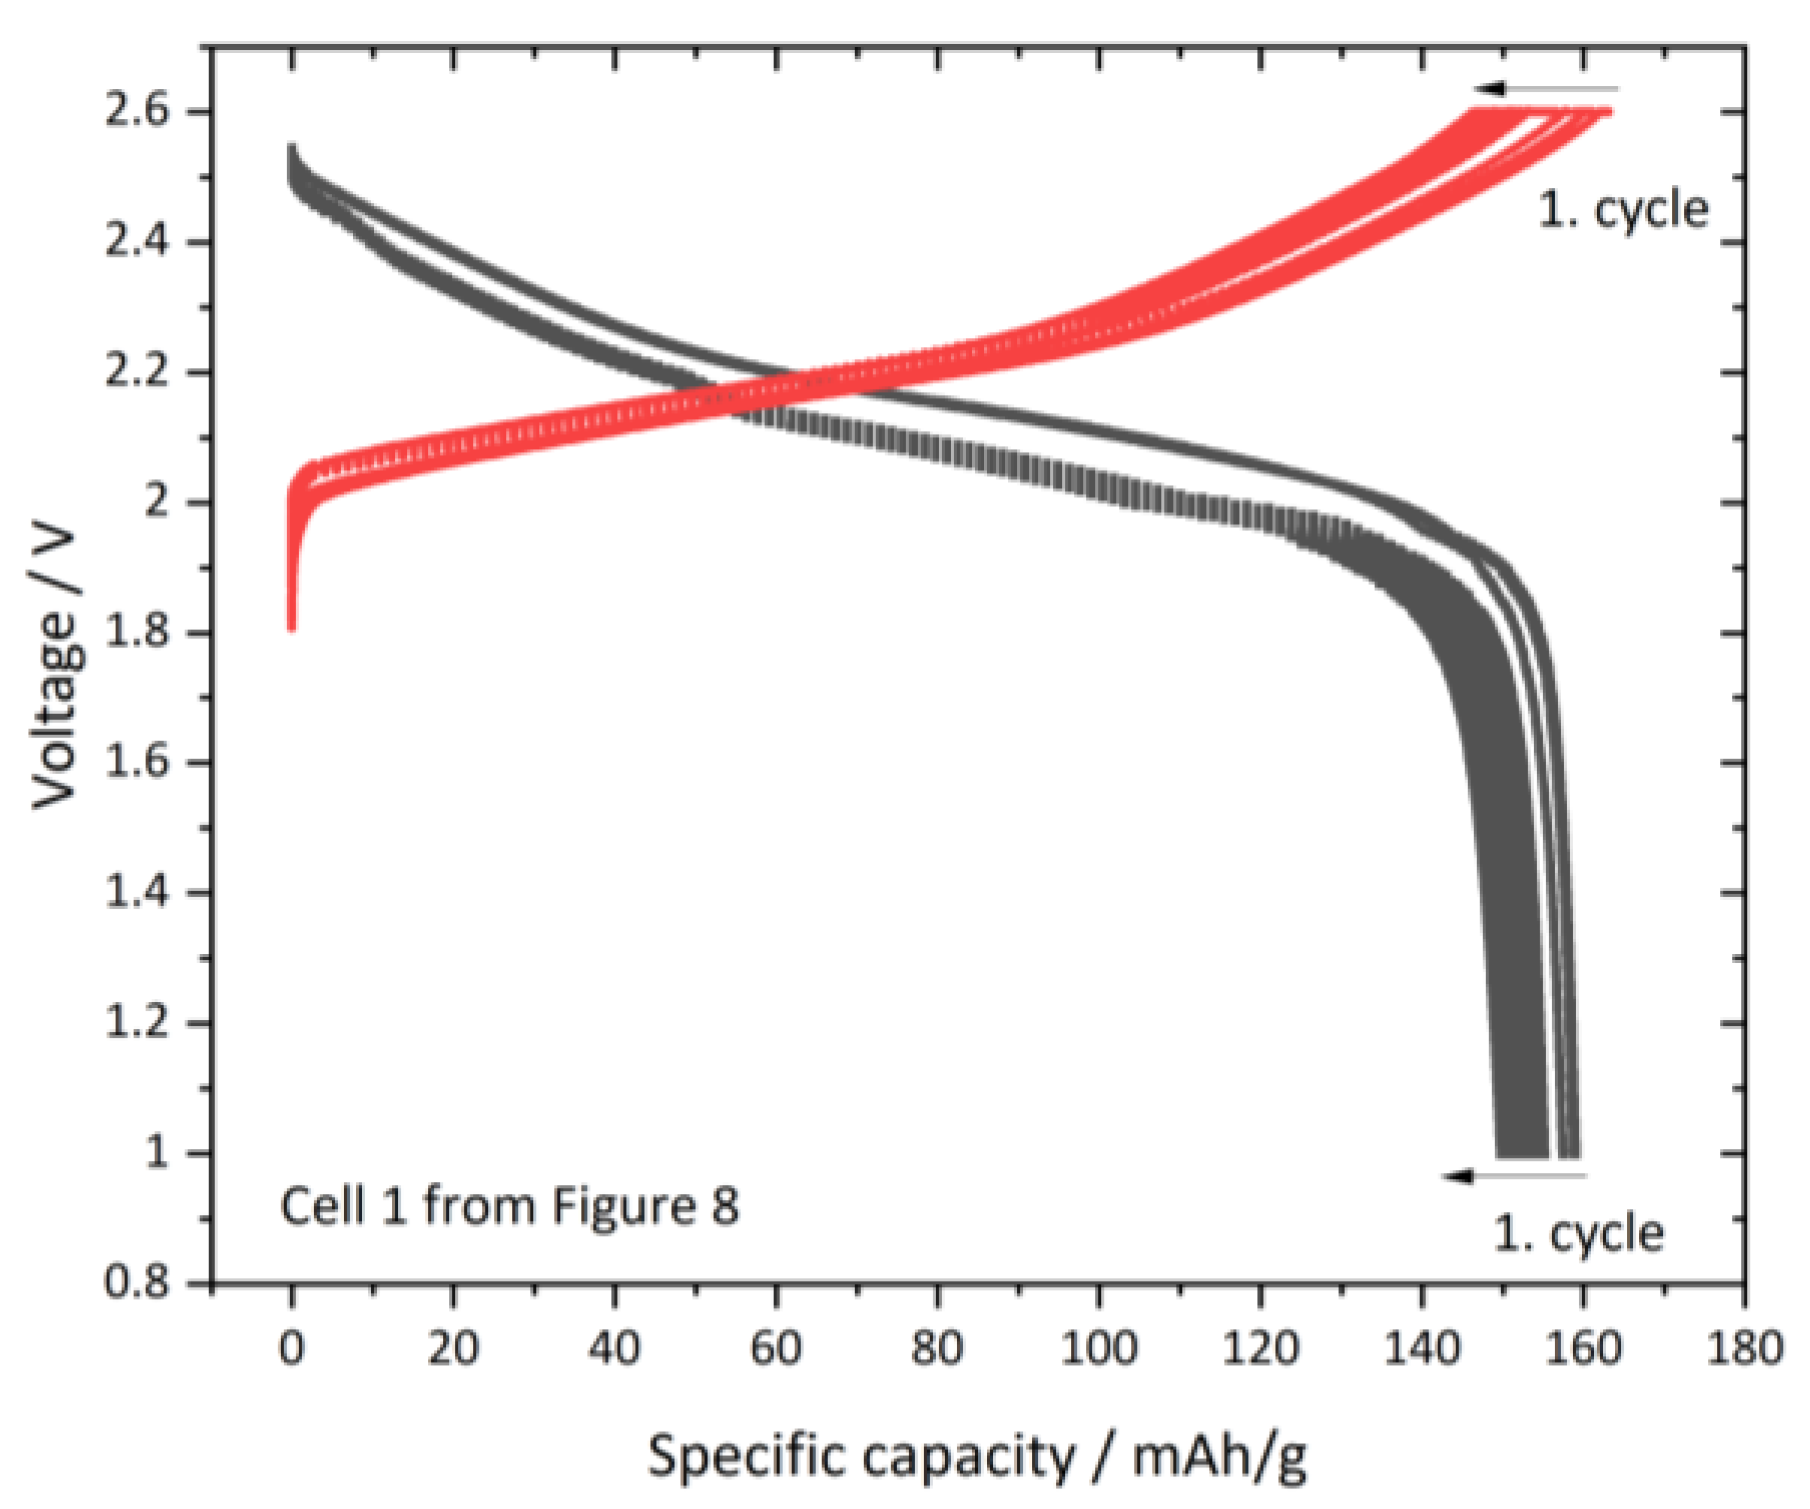
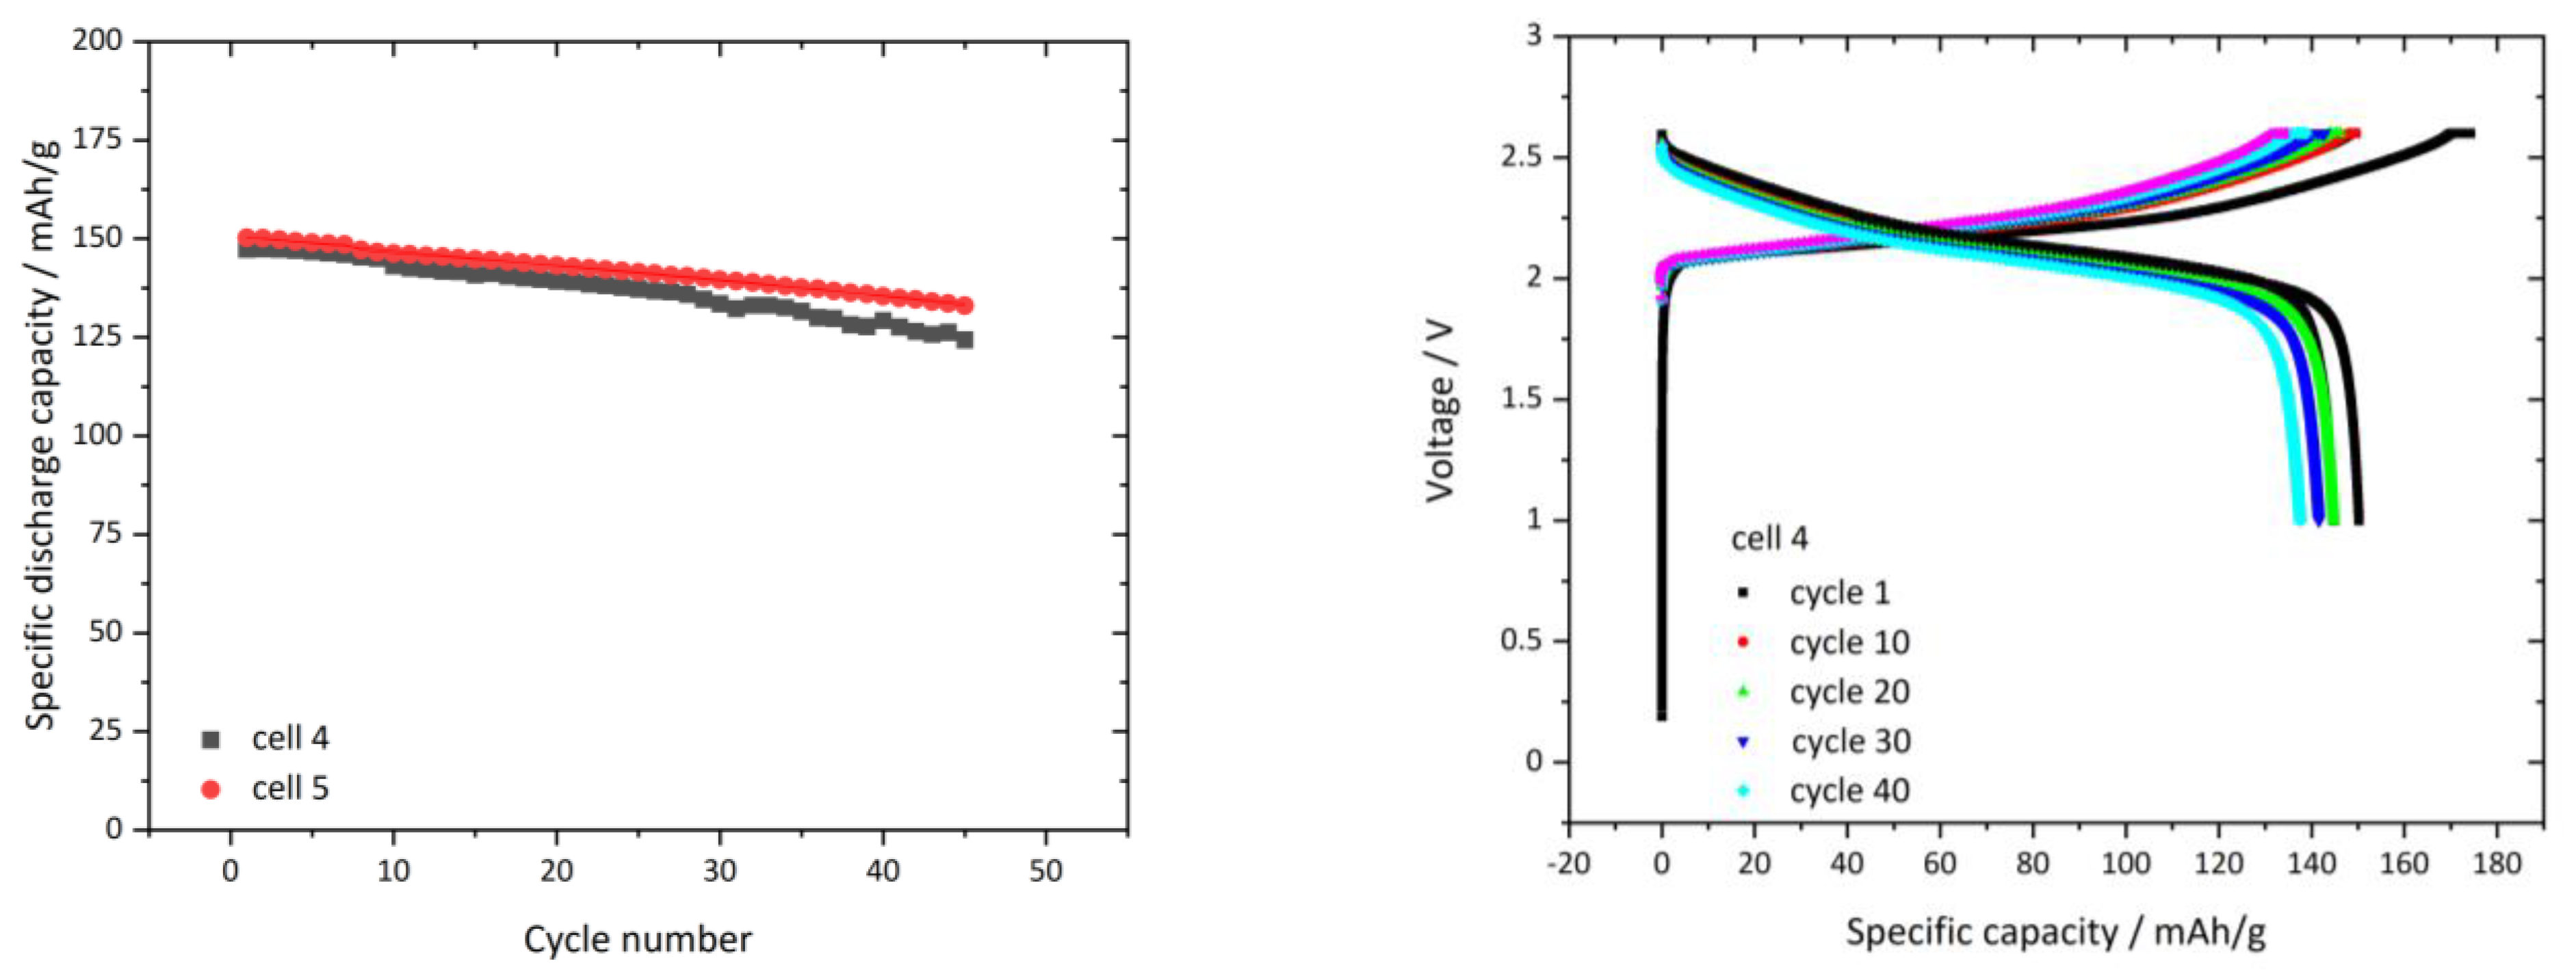
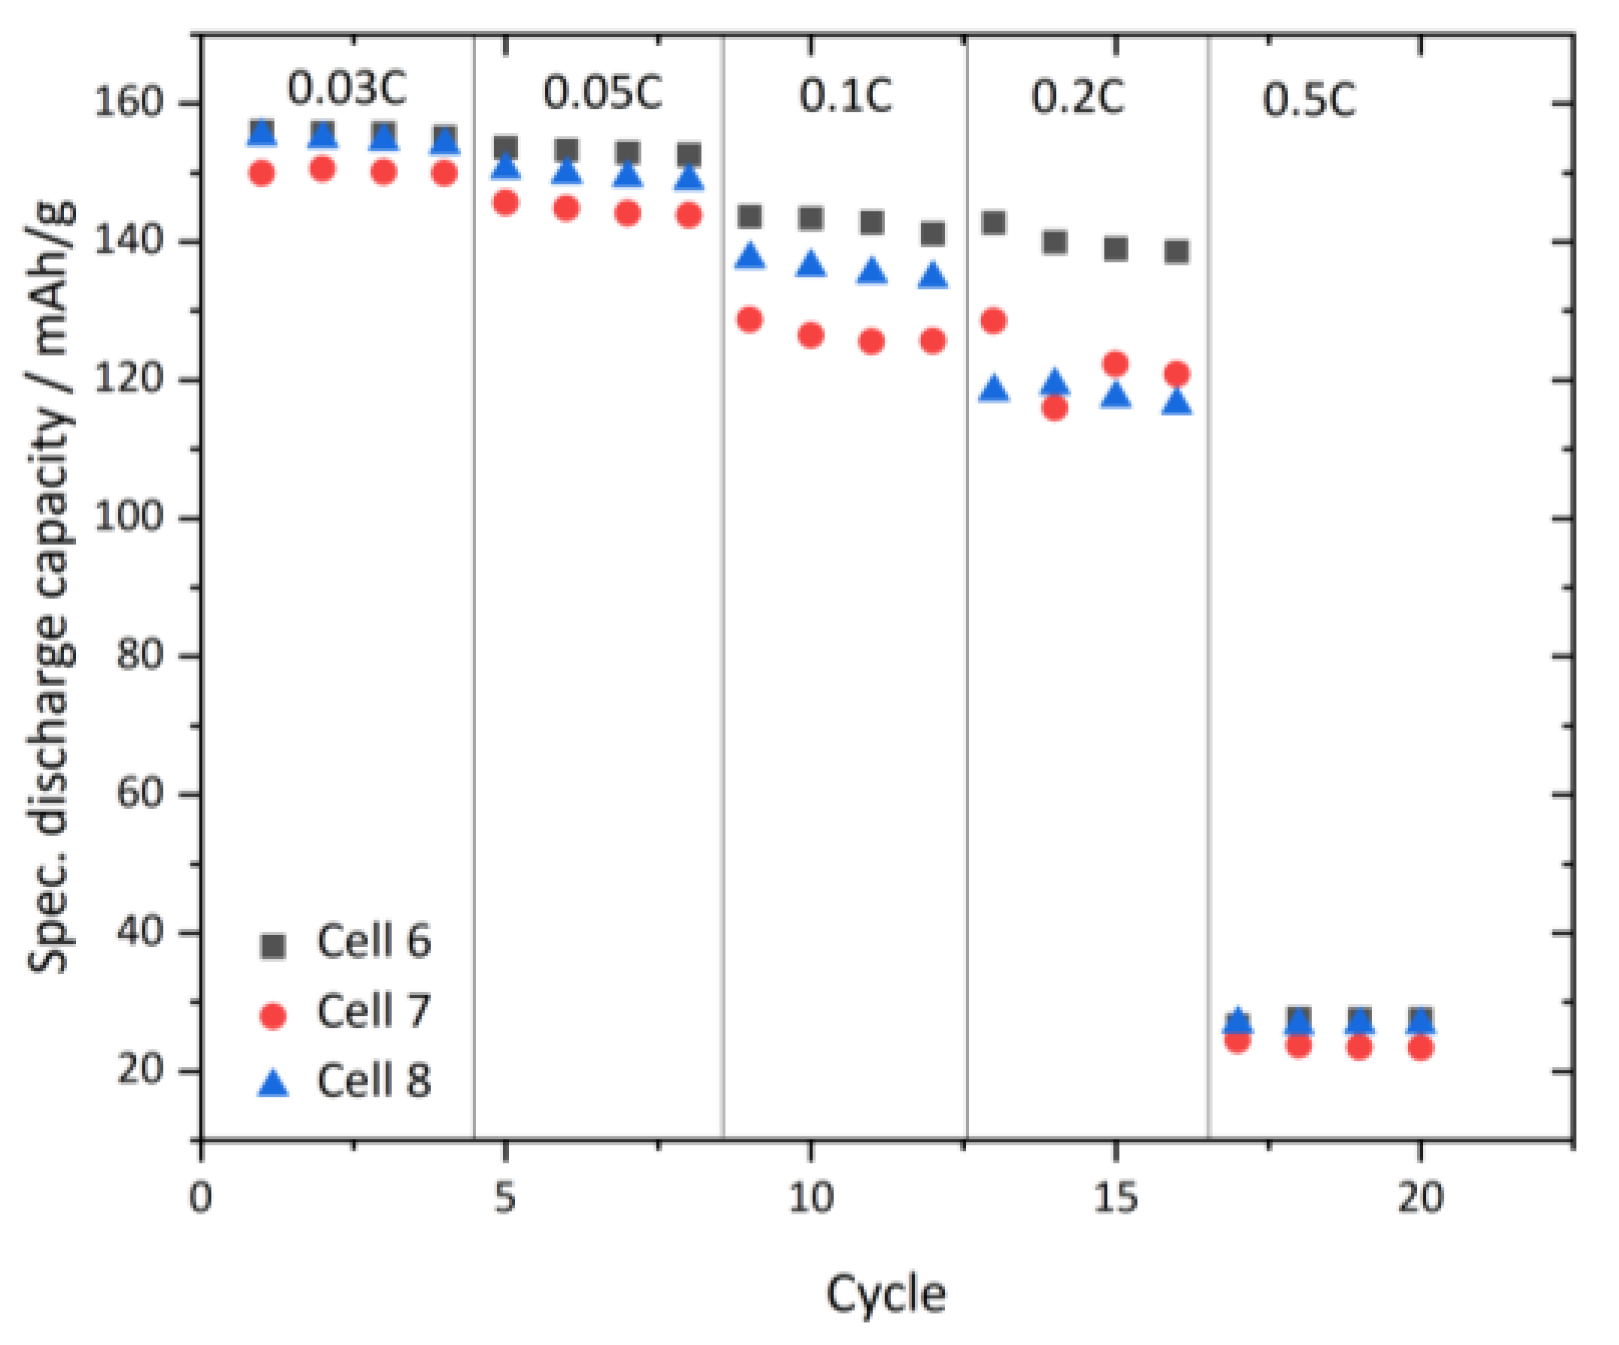
3.4. Cycling Performance of PCPE Based Electrodes in Full Cell Setup
4. Conclusions
Supplementary Materials
Author Contributions
Funding
Institutional Review Board Statement
Informed Consent Statement
Data Availability Statement
Acknowledgments
Conflicts of Interest
References
- Zeng, X.; Li, M.; El-Hady, D.A. Commercialisation of lithium battery technologies for electroc vehicles. Adv. Energy Mater. 2019, 9, 1900161. [Google Scholar] [CrossRef]
- Li, J.; Du, Z.; Ruther, R.E. Toward low-cost, high, energy, and high-power density lithium-ion batteries. Miner. Met. Mater. Soc. 2017, 69, 1484–1496. [Google Scholar] [CrossRef] [Green Version]
- Henriksen, M.; Vaagsaether, K.; Lundberg, J. Explosion characteristics for Li-ion battery electrolytes at elevated temperatures. Hazard. Mater. 2019, 371, 1–7. [Google Scholar] [CrossRef]
- Mevawalla, A.; Panchal, S.; Tran, M.-K. Design of a Hybrid Electric Vehicle Powertrain for Performance Optimization Considering Various Powertrain Components and Configurations. Mdpi Batter. 2020, 6, 1–26. [Google Scholar]
- Jilte, R.; Afzal, A.; Panchal, S. A novel battery thermal management system using nano-enhanced phase change materials. Energy 2021, 219, 119564. [Google Scholar] [CrossRef]
- Wu, Z.; Xie, Z.; Yoshida, A. Utmost limits of various solid electrolytes in all-solid-state lithium batteries: A critical review. Renew. Sustain. Energy Rev. 2019, 109, 367–385. [Google Scholar] [CrossRef]
- Randau, S.; Weber, D.A.; Kötz, O. Benchmarking the performance of all-solid-state lithium batteries. Nat. Energy 2020, 5, 259–270. [Google Scholar] [CrossRef]
- Xue, Z.; He, D.; Xie, X.J. Poly (ethylene oxide)-based electrolytes for lithium-ion batteries. Mater. Chem. A 2015, 3, 19218. [Google Scholar] [CrossRef]
- Hu, P.; Chai, J.; Duan, Y.J. Progress in nitrile-based polymer electrolytes for high performance lithium batteries. Mater. Chem. A 2016, 4, 10070–10083. [Google Scholar] [CrossRef]
- Arya, A.; Sharma, A.L. Polymer electrolytes for lithium ion batteries: A critical study. Ionics 2017, 23, 497–540. [Google Scholar] [CrossRef]
- Mindemark, L.; Lacey, M.J.; Brandell, T. Beyond PEO—Alternative host materials for Li+-conducting solid polymer electrolytes. Prog. Polym. Sci. 2017, 81, 114–143. [Google Scholar] [CrossRef]
- Tang, S.; Guo, W.; Fu, Y. Advances in composite polymer electrolytes for lithium batteries and beyond. Adv. Energy Mater. 2020, 11, 2000802. [Google Scholar] [CrossRef]
- Fan, L.-Z.; Hu, Y.-S.; Bhattacharyya, J. Succinonitrile as a versatile additive for polymer electrolytes. Adv. Funct. Mater. 2007, 17, 2800–2807. [Google Scholar] [CrossRef]
- Abouimrane, A.; Davidson, I.J. Solid electrolyte based on succinonitrile and LiBOB: Interface stability and application in lithium ion batteries. J. Electrochem. Soc. 2007, 154, A1031–A1034. [Google Scholar] [CrossRef] [Green Version]
- Kim, G.Y.; Petibon, R.; Dahn, J.R. Effects of succinonitrile (SN) as an electrolyte additive on the impedance of LiCoO2/graphite pouch cells during cycling. J. Electrochem. Soc. 2014, 161, A506–A512. [Google Scholar] [CrossRef]
- Alarco, P.J.; Lebdeh, Y.B.; Aboumirane, A. The plastic-crystalline phase of succinonitrile as a universal matrix for solid-state ionic conductors. Nat. Mater. 2004, 3, 476–481. [Google Scholar] [CrossRef]
- Fan, L.-Z.; Meier, J. Composite effects in poly (ethylene oxide)-succinonitrile based all-solid electrolytes. Electrochem. Commun. 2006, 8, 1753–1756. [Google Scholar] [CrossRef]
- Bi, J.; Mu, D.; Wu, B.; Fu, J.; Yang, H.; Mu, G.; Wu, F. A hybrid solid electrolyte Li0.33La0.557TiO3/poly (acylonitrile) membrane infiltrated with a succinonitrile-based electrolylte for solid state lithium-ion batteries. Mater. Chem. A 2020, 8, 706–713. [Google Scholar] [CrossRef]
- Raut, P.; Li, S.; Chen, Y.-M. Strong and flexible composite solid polymer electrolyte membranes for Li-Ion batteris. Acs Omega 2019, 4, 18203–18209. [Google Scholar] [CrossRef]
- Patel, M.; Bhattacharyyam, A.J. Plastic-polymer composite electrolytes: Novel soft matter electrolytes for rechargeable lithium batteries. Electrochem. Commun. 2008, 10, 1912–1915. [Google Scholar] [CrossRef]
- Zhou, Y.; Zhang, F.; He, P.; Zhang, Y.; Sun, Y.; Xu, J.; Wu, X. Quasi-solid-state polymer plastic crystal electrolyte for subzero lithium-ion bateries. Energy Chem. 2020, 46, 87–93. [Google Scholar] [CrossRef]
- Zhang, Q.; Liu, K.; Ding, F. Enhancing the high voltage interface compatibility of LiNi0.5Co0.2Mn0.3O2 in the succinonitrile-based electroylte. Electrochim. Acta 2019, 298, 818–826. [Google Scholar] [CrossRef]
- Kim, D.H.; Oh, D.Y.; Park, K.H. Infiltration of solution-processable solid electrolytes into conventional Li-ion-battery electrodes for all-solid-state Li-ion batteries. Nano Lett. 2017, 17, 3013–3020. [Google Scholar] [CrossRef] [PubMed]
- Wu, F.; Zhao, E.; Gordon, D. Infiltrated porous polymer sheets as free-standing flexible lithium-sulfur battery electrodes. Adv. Mater. 2016, 28, 6365–6371. [Google Scholar]
- Pandey, G.P.; Klankowski, S.A.; Li, Y. Effective infiltration of gel polymer electrolyte into silicon-coated vertically aligned carbon nanofibers as anodes for solid-state lithium-ion batteries. Acs Appl. Mater. Interfaces 2015, 7, 20909–20918. [Google Scholar] [CrossRef]
- Oh, D.Y.; Kim, D.H.; Jung, S.H.; Han, J.G.; Choi, N.S.; Jung, Y.S. Single-step wet-chemical fabrication of sheet-type electrodes from solid-electroylte precoursors for all-solid-state lithium-ion batteries. Soc. Chem. 2017, 5, 20771–20779. [Google Scholar]
- Oh, D.Y.; Kim, Y.J.; Park, K.H. Slurry-Fabricable Li+-Conductive Polymeric Binders for Practical All-Solid-State Lithium-Ion Batteries Enabled by Solvate Ionic Liquids. Adv. Energy Mater. 2019, 16, 1802927. [Google Scholar] [CrossRef]
- Nam, Y.J.; Oh, D.Y.; Jung, S.H.; Jung, Y.S. Toward practical all-solid-state lithium-ion batteries with high enery density and safety: Comparative study for electrodes fabricated by dry-and slurry-mixing process. Power Sources 2018, 31, 93–101. [Google Scholar] [CrossRef]
- Hauffe, W.; Obenaus, P.; Herrmann, M. Einsatz des Ionenstrahl-Böschungsschnitt-Verfahrens zur Untersuchung des Gefüges von Komposit-Keramiken mit extrem unterschiedlichen Komponenten (BN/TiB2) im Rasterelektronenmikroskop. Prak. Metallogr. 2004, 41, 343–353. [Google Scholar]
- Grünewald, W. Ion Beam Prep. of Samples for SEM. Application Booklet, Leica Microsystems. Available online: https://0-analyticalscience-wiley-com.brum.beds.ac.uk/do/10.1002/imaging.6545 (accessed on 26 January 2021).
- Gupta, R.K.; Rhee, H.W. A Detailed Investigation into the Electrical Conductivity and Structural Properties of [Poly(ethylene oxide)-succinonitrile}-Li(CF3SO2)2]N Solid Polymer Electrolytes. Bull. Korean Chem. Soc. 2017, 38, 356–363. [Google Scholar] [CrossRef]


Publisher’s Note: MDPI stays neutral with regard to jurisdictional claims in published maps and institutional affiliations. |
© 2021 by the authors. Licensee MDPI, Basel, Switzerland. This article is an open access article distributed under the terms and conditions of the Creative Commons Attribution (CC BY) license (http://creativecommons.org/licenses/by/4.0/).
Share and Cite
Coeler, M.; van Laack, V.; Langer, F.; Potthoff, A.; Höhn, S.; Reuber, S.; Koscheck, K.; Wolter, M. Infiltrated and Isostatic Laminated NCM and LTO Electrodes with Plastic Crystal Electrolyte Based on Succinonitrile for Lithium-Ion Solid State Batteries. Batteries 2021, 7, 11. https://0-doi-org.brum.beds.ac.uk/10.3390/batteries7010011
Coeler M, van Laack V, Langer F, Potthoff A, Höhn S, Reuber S, Koscheck K, Wolter M. Infiltrated and Isostatic Laminated NCM and LTO Electrodes with Plastic Crystal Electrolyte Based on Succinonitrile for Lithium-Ion Solid State Batteries. Batteries. 2021; 7(1):11. https://0-doi-org.brum.beds.ac.uk/10.3390/batteries7010011
Chicago/Turabian StyleCoeler, Matthias, Vanessa van Laack, Frederieke Langer, Annegret Potthoff, Sören Höhn, Sebastian Reuber, Katharina Koscheck, and Mareike Wolter. 2021. "Infiltrated and Isostatic Laminated NCM and LTO Electrodes with Plastic Crystal Electrolyte Based on Succinonitrile for Lithium-Ion Solid State Batteries" Batteries 7, no. 1: 11. https://0-doi-org.brum.beds.ac.uk/10.3390/batteries7010011