
A Flexible Model for Benchmarking the Energy Usage of Automotive Lithium-Ion Battery Cell Manufacturing


Department of Energy and Process Engineering, Norwegian University of Science and Technology, 7491 Trondheim, Norway
*
Authors to whom correspondence should be addressed.
Batteries 2021, 7(1), 14; https://0-doi-org.brum.beds.ac.uk/10.3390/batteries7010014
Submission received: 19 January 2021
/
Revised: 4 February 2021
/
Accepted: 5 February 2021
/
Published: 22 February 2021
Abstract
:The increasing use of electric vehicle batteries in the world has a significant impact on both society and the environment. Thus, there is a need for the availability of transparent information on resource allocation. Battery manufacturing process details in this regard are not available in academia or the public. The available energy data on manufacturing has a high variation. Furthermore, different process steps have different energy and material demands. A process model can benchmark the energy usage, provide detailed process data, and compare various cell productions which in turn can be used in life-cycle assessment studies to reduce the variation and provide directions for improvements. Therefore, a cell manufacturing model is developed for the calculation of energy and material demands for different battery types, plant capacities, and process steps. The model consists of the main process steps, machines, intermediate products and building service units. Furthermore, the results are validated using literature values. For a case study of a 2 GWh plant that produces prismatic NMC333 cells, the total energy requirement on a theoretical and optimal basis is suggested to be . This energy consumption in producing batteries is dominated by electrode drying, and dry room. Energy usage for a variety of cell types for a similar plant capacity shows that the standard deviation in the results is low ().
1. Introduction
Electrification of the global transport sector is expected to be rapidly increasing in the coming decade. The global electric vehicle (EV) stock is predicted to reach 140–245 million by 2030, which is about more than 30 times of today’s amount. The increase of EV demands concurrent increase of production of automotive batteries, where global EV battery capacity is predicted to be increased from today’s value of around 170 GWh per year to 1.5–3 TWh per year in 2030. This drives a remarkable cost reduction in batteries together with increased use of improved technologies. Although there exists novel advanced battery technologies, lithium-ion batteries are the most likely to dominate the EV battery market in the recent future [1]. With the existing and upcoming lithium-ion battery technologies, the cost reduction in battery production is to be achieved with high quality standards, automation, improved manufacturing technologies, and maximum energy and resource efficiency [2].
On the other hand, the increasing use of EV batteries in the world creates a significant impact on both the society and the environment as it demands policy changes related with electrification, resource and money allocation, and the production of green energy. Therefore, there is a need for the availability of transparent information especially on cost and energy requirements in battery production. Battery manufacturing process details in this regard is available in the industry, but quite rare in the scientific community or the public. Furthermore, different battery manufacturing process steps have different energy and material demands and will thus result in different global warming potential (GWP) emission values, when expressed using life-cycle assessment (LCA) studies. The existing GWP emission data for automotive lithium-ion battery production is in the range of 1.1–424 CO2-eq. per 1 kWh of battery pack capacity [3,4,5,6], while the existing energy usage (energy for production per energy storage capacity) data is in the range of 28–740 Wh for producing 1 Wh of stored cell energy [7,8,9]. The source of the high variance in the data is from the use of generalized data for inherently different battery production systems. Most of these data are based on estimations or old plant data which cannot be applicable to today’s plants of much higher capacity, and with technologies and materials that are different to each other. The production systems and their energy demands vary with the factory capacity, location of the factory, type, energy and chemistry of the battery cell that is being produced, and the specific technologies that are used [10], as illustrated in Figure 1. A general trend in here is that the energy demand for production is reduced when the size of the factory (capacity) is increased significantly.
A process model of a general battery cell manufacturing plant which is flexible to the key factors such as plant capacity, cell chemistry, cell type and process technologies, can cater these variations due to its physics-based design nature. Furthermore, it could provide a benchmark for the battery production energy values. An added advantage would be the ability to incorporate in to LCA models to provide specific material and energy values for their respective LCA studies. Once established for known cell chemistries, such a model can compare different cell material and chemistry options as well as different technologies and energy minimization options. A cell manufacturing model that can compare different options can be well used in LCA studies as well as in plant design and technology developments.
Therefore, the main aim of this study is to develop a generalized, industrial scale, lithium-ion battery cell manufacturing model for calculation of energy and material demands for different production volumes, process steps, cell types, and chemistries.
For the modeling of this process, a thorough understanding of each process step is needed. Most of the knowledge in this regard is available on the experimental level and pilot scale plant level. Out of these, many experimental studies have done on different cell manufacturing process steps [15,16,17]; however, only a limited number of modeling studies have been undertaken.
These models are developed for individual process steps of the cell manufacturing process, which are mostly focused on the quality and performance of the product. For the calendering process, a Heckel-based model is developed for the lowest achievable coating porosity by Meyer et al. [18], which also can find the influence of different active materials on the compaction behavior during calendering. The model by Schreiner et al. [19] determines the output porosity after calendering based on the input parameters such as roll temperature, velocity, coating thickness, adhesion strength, and machine behavior parameters. Similarly, for mixing, Mayer et al. [20] have used a model to investigate the dispersion process and breakage of carbon aggregates. Furthermore, Cunha et al. [21] have used several machine-learning techniques to model the interdependecies between the parameters of slurry mixing and the electrode properties. Similarly, Thiede et al. [22] have used multivariate regression-based models to relate the intermediate product parameters and cell performance parameters, while Komas et al. [23] have used data and expert driven models to find the cause-effect relationships in cell manufacturing process chain.
Moreover, Chouchane et al. [24] have developed a model to find out the electrochemical performance of a battery for different material compositions. Similarly, Schneider et al. [25] have developed a pseudo-2D electrochemical model which can calculate the electrochemical performance for various geometries of lithium-ion batteries. There are also a few studies on process operation-oriented modeling done by Ahmed et al. [26], Oppegård et al. [27] on electrode drying process, where the parts of these models are used in this study and discussed in detail in Section 2.1 where the model is described.
On the structuring of the process model, a good candidate structure can be adapted from various model structures of material and energy flow modeling of general manufacturing process systems. Some of these structures are holistic hierarchical bottom-up structured models which starts from machine level, and goes up to unit level, process chain level to pilot scale factory level [28,29,30]. These are usually data-based models which depend on real-time data acquisitions systems. These models are good for individual plants where it is specialized in energy optimization for the specific plant; however, these are difficult to use for general cases as it is based on specific stochastic systems, and often not open to integrate with other models such as ecological/LCA models.
However, there is a study on cell manufacturing process model, where Thomitzek et al. [31] introduced a conceptual multilevel modeling approach which links a process chain model that consists of a set of deterministic process models and an electrochemical cell model together. This model approach is expected to predict the performance of the cell based on the initial raw material characteristics and various process parameters. Using this concept, they have analyzed different model uncertainties and how these uncertainties propagate through the process. The results of a case study have shown that out of the uncertainties of coating, drying and calendering, the coating uncertainties (which propagate to thickness and mass loading) have the most impact on the cell performance in four different scenarios [32].
The same model structure with slight changes is adapted in this study to develop the industrial scale process model (Section 2). A case study is presented, and the model results are tuned to a similar industrial case, analyzed and compared with the available literature values (Section 3). Furthermore, a sensitivity analysis is performed for analyzing the effect of different cell chemistries and process parameters on the model results. Finally, it is concluded that the flexible model can provide a theoretical benchmark energy value with low variance for various cell types, chemistries, process technologies and plant capacities (Section 4).
2. Methodology
2.1. Model Structure and System Description
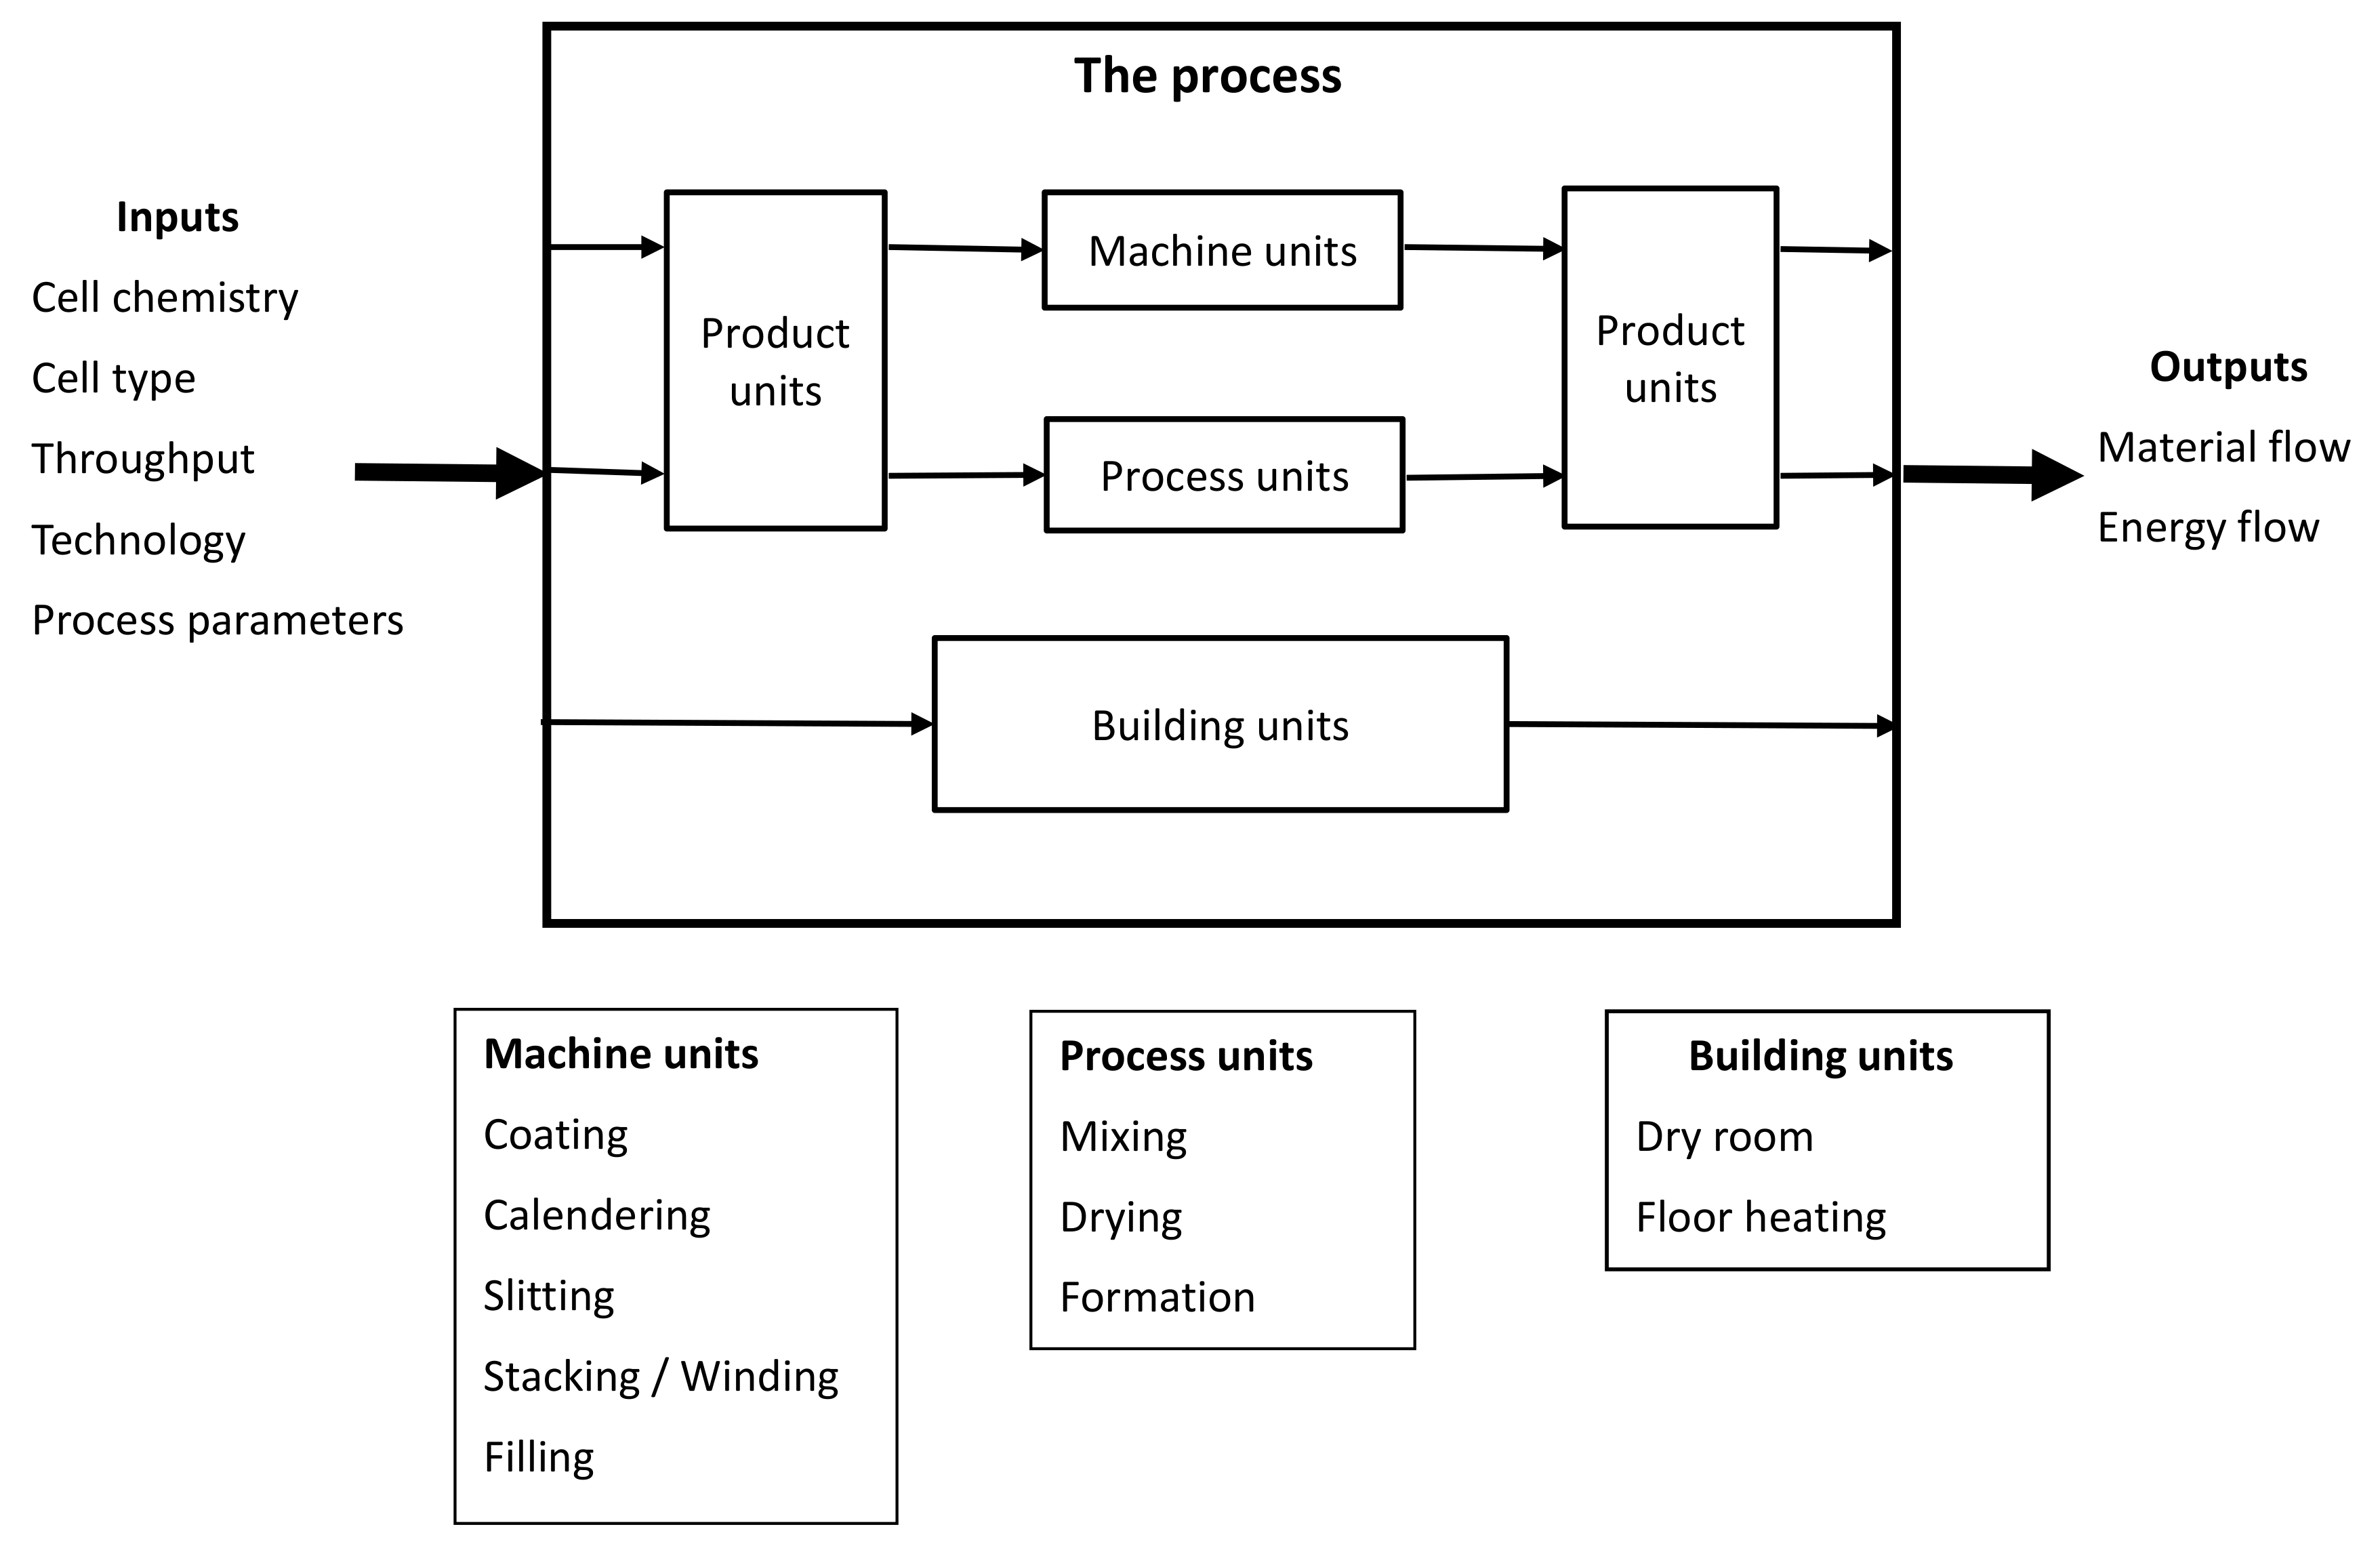
Based on the manufacturer and the cell type that is being produced, the production process can differ. Therefore, a generalized process is chosen for a selected set of battery types by either simplifying process steps or aggregating several steps together, based on the energy and material requirements. The selected process steps and the model structure is shown in Figure 2. The main inputs, outputs and the main units in the model are illustrated.
2.1.1. Inputs and Outputs
Cell type, anode and cathode chemistries and their material composition, the annual capacity of the plant, process parameters and technology for some of the process steps can be changed as inputs to the model. The expected outputs are the material inputs and outputs at each process step, and the energy usage at each process step.
Ten types of typical batteries are selected for the three cell types (pouch, prismatic and cylindrical). These batteries consist of the following commonly used cathode and anode chemistries [33,34].
Cathode chemistry:
- LiMn2O4 (LMO)
- LiFePO4 (LFP)
- LiNi0.5Mn0.3Co0.2O2 (NMC532)
- LiNi0.6Mn0.2Co0.2O2 (NMC622)
- LiNi0.8Mn0.1Co0.1O2 (NMC811)
- LiNi0.3Mn0.3Co0.3O2 (NMC333 or NMC111)
- LiNi0.8Co0.15Al0.05O2 (NCA)
Anode chemistry:
- Graphite or hard carbon (G)
- Li4Ti5O12 (LTO)
- Silicon (Si)
The battery types are a combination of each cathode chemistry with a graphite anode (denoted by LMO-G, LFP-G, NCA-G, NMC333-G, NMC532-G, NMC622-G, NMC811-G), LMO cathode with a LTO anode (denoted by LMO-LTO), NMC333 cathode with a Si nanowire anode (denoted by NMC333-Si), and a mixture of 50% NMC532 and 50% LMO with a graphite anode (denoted by NMC532LMO-G). The material composition for each battery is predefined using available commercial data, research data [35] and/or models such as BatPac [36]. Although the selection is limited to ten battery types, the model can be used for any other battery types including new materials, given that the required input details such as the material composition, physical and geometrical properties of the cells are known. However, if any different technologies are to be used in the production process, then the model needs to be updated with respective process or machine units and parameters, accordingly.
The capacity of the plant is set to around 2 GWhstorage per year, assuming 100% capacity use with 24 h per day working shifts. The equipment sizing is designed to match this capacity. Process technologies and parameters are described in their respective sections. No internal heat recovery is done for any of the systems.
2.1.2. Product Units
Product units are the initial, intermediate and final products. A product unit consists of active material, carbon black, binder, solvent, current collector, separator and electrolyte as components. This unit keeps track of all the material changes at each process step and gives the final material composition at the final step together with waste material and scrap material amounts.
2.1.3. Machine Units
Machine units are the lowest units in the model hierarchy. These consists of all the machinery that is considered for each process step i.e., coating, calendaring, slitting, stacking, winding, electrolyte filling machines. The sizing of these machines and equipment are selected using engineering calculations for a single production line and the number of lines are varied based on the expected total capacity. Commercially available sizes and specifications are selected to match the designed sizing, and the material in and out are calculated for product units based on predefined scrap material amounts at each machinery. The energy usage (E) is directly calculated from the power consumption rates (P) of the specification and estimated time (t) for each process i as follows,
The conveyor belts, pumps, fans and other transport mechanisms in between the process steps are not considered in the current model.
2.1.4. Process Units
The process steps such as dry and wet mixing, drying, and formation are considered to be process units as these are the most energy intensive processes or most influential on product quality and performance. The process units are modeled using simplified physical principals.
Mixing
For the mixing, a planetary (low intensity) mixer and an intensive mixer are selected as different technologies. The mixers are modeled using the power consumption for the motors (for impeller) for both dry and wet mixing. Using the dimensional analysis, the power requirement of the motor for mixing in a baffled vessel () can be derived as follows,
where is the power factor, is the density of the mixture, v is the impeller rotational speed in rps, and D is the impeller diameter [37]. is common for both dry powder mixing () and wet slurry mixing (). The drying time for dry powder mixing () is found as follows,
where b is the degree of mixing and c is a constant based on particle size [38]. The wet slurry mixing time () is found using the specifications given by the manufacturer. Then the total energy for mixing () is calculated by adding the dry () and wet mixing () energies,
The intensive mixer takes comparatively less mixing time, and therefore requires less energy than the planetary mixer.
Drying
For the drying, both convective air drying and infra-red radiation drying is considered. The drying times for anode and cathode () are found by solving a dimensionless model based on the following set of equations until all the solvent is evaporated (described in detail by Oppegård et al. [27]),
with the following boundary conditions,
and
Here, h is the thickness of the coating, t is the time, is the mass transfer coefficient, is the molecular weight of the solvent, is the density of the coating, R is the ideal gas constant, T is the temperature of the coating, is the air temperature above the coating, is the vapor pressure of solvent in the bulk air and is the equilibrium partial pressure of solvent at the coating-air interface. Furthermore, is the latent heat of solvent evaporation, is the heat capacity of the coating, is the heat transferred to the coating by convection or infra-red radiation, D is the diffusion coefficient, z is the vertical direction from the bottom of the coating and C is the mass fraction of solvent in the coating.
The energy for removing the solvent, and the energy for heating the dry air (or for the infra-red heat source) is then calculated based on the drying times and air flow rates [38]. The energy for solvent evaporation () is calculated by using the following equation,
where the is the total mass of solvent. Similarly, the energy for convection air heating () is calculated as follows,
where is the hot air flow rate, is the heat capacity of hot air and is the temperature of the inlet air to the air heater. The inlet air to the heater is assumed to be 100% fresh ambient air, with no re-circulation. Then the total drying is calculated by adding the solvent evaporation energy and the air heating energy as follows,
This is conducted for both anode and cathode to find the energy for each electrode drying.
Infra-red radiation can achieve higher drying rates, which gives less energy usage than the conventional air drying [27]. For the simplicity, the vacuum drying is integrated into the normal drying process, assuming that the total solvent amount is evaporated at the dryer. A significant amount of energy is needed for recovering of NMP. Ahmed et al. [26] modeled a dryer and NMP recovery unit for a 1 GWh plant of a 10 kWh battery pack, where 42.1 Wh per Wh of pack energy was required for the total process unit for a base case of process parameters. Out of this amount, 0.9 Wh was for solvent evaporation, 27.0 Wh was for air heating, and the rest (14.2) was for the solvent recovery unit which is about of the total energy. As shown by Ahmed et al. [26], these values can vary due to the process parameters, the NMP composition in the cathode slurry, ambient air conditions and the amount of make-up air used. However, the solvent recovery unit for the dryer is not modeled in this study, and is compensated by using a tuning factor as described in Section 2.1.6.
Formation
The formation energy () is calculated using the power consumption for charging and discharging a fixed number of cycles during the storage time as follows,
Here, is the power requirement for one complete charging and discharging cycle, is the number of average cycles for one batch, and is the average time taken for formation. The power requirement for one cycle and the number of cycles are taken to match the machine specifications.
2.1.5. Building Units
Dry room and the floor heating are considered to be building units, and these are the topmost hierarchy of the model.
Dry Room
Dehumidification unit for the dry room is modeled either using a desiccant wheel or using a liquid desiccant absorber as technologies. The energy needed for removing the water from air, and for reheating it back to the required temperature are calculated based on the required dehumidified air flow rate [37]. The required dry air flow rate () is selected according to the ISO standards for clean rooms of class 8 [39].
A counter-current, packed bed, liquid desiccant absorbing tower is selected to find the liquid desiccant flow rate (), the interfacial area per unit volume (a) and the transfer areas of gas side () and liquid side (), respectively using the number of transfer units method [40]. The heat transfer coefficient () can be found using the following empirical correlation [37],
where is either the gas side () or the liquid side () heat transfer coefficient. The empirical constants d, e, and f are 3, 0.27, and 0.73 for the gas side and 10,400, 0.51, and 1 for the liquid side, respectively. Here, the gas and liquid flow rates are given per area (). The total resistance () is calculated using the heat transfer coefficients as follows,
The total cooling load () is then calculated using this resistance,
where is the ambient air temperature, and the is the required inlet liquid desiccant temperature. The required inlet desiccant temperature is found from the absorber design, which depends on the humidity of ambient air and the humidity of the final dry air [37,40]. Similarly, the total heating load () is found using a heat exchanger to heat the dry air as follows,
where is the required air temperature for the dry room according to the clean room standards, and the is the temperature of air at the absorber gas outlet which can be calculated by using the gas side resistance,
The energy requirement for dry room () is then calculated using the cooling and heating loads as follows,
where is the total time taken for the process steps that happens inside the dry room.
No make-up air is considered for the calculation and the desiccant regeneration and associated cooling and heating units are not modeled due to their complexity; however, the energy values are tuned to compensate for this exclusion (described in Section 2.1.6).
Floor Heating
The floor heating area (A) is taken according to the plant capacity and the energy for floor heating () is calculated as follows,
where is the electric power needed for heating 1 and is the time required for floor heating. The power is taken from the specifications of the selected industrial underfloor electric heating system for ceramic tiled floors and time is the total time a batch is kept inside the heated area of the building.
2.1.6. Tuning Parameters
To compensate for the machine idling time, non-productive time, machine efficiencies, and the additional utility units for drying and dry room that are not included, a set of tuning parameters were introduced to the model as follows,
where E is the total energy, is the energy for drying, is the energy for dry room, and is for each process i except the drying and dry room. As the model results can vary with the factors such as cell chemistry, throughput, and cell type, a case study is presented for selected factors and the tuning parameters are validated using available data from a similar case.
2.2. Detailed Process Description and Operating Parameters
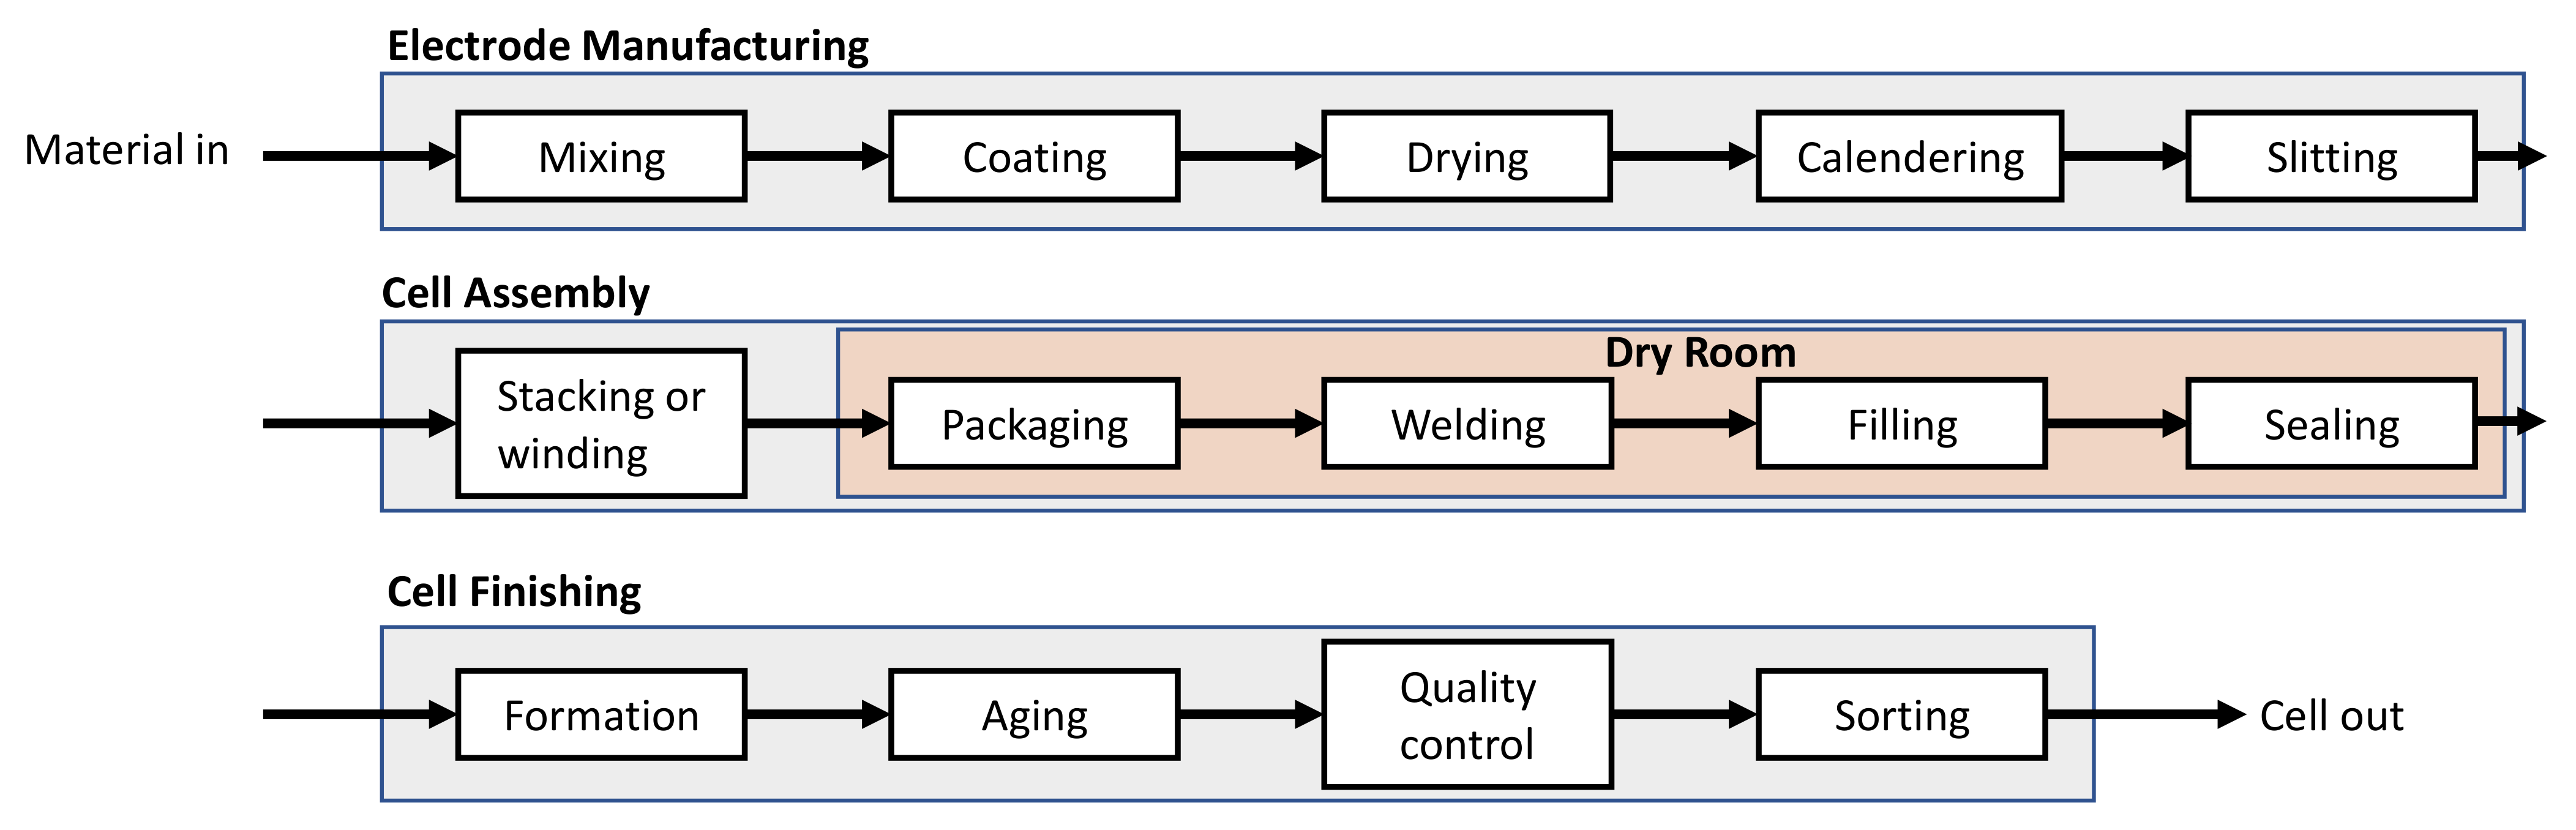
A block diagram of the generalized process steps of a lithium-ion battery cell manufacturing process is shown in Figure 3.
2.2.1. Mixing
The dry material powders of both anode and cathode which are commonly called active material, carbon, binder and additives are usually mixed as the first step. Although there is ongoing research on dry material coating techniques such as electrostatic spray deposition, laser techniques, and semi-solid casting; state-of-the-art industry production facilities are still using the wet coating techniques. Therefore, a wet mixing step occurs after dry mixing, in order to disperse and homogenize the battery materials in a solvent, usually N-Methyl-2-Pyrrolidone (NMP) or deionized water. Different manufacturers use different mixing systems based on the produced cell and quality requirements. Batch mixers such as intensive mixers, planetary mixers, and dispersers or continuous mixers such as extrusion mixers are commonly used in the industry. Usually, different mixers are used for anode and cathode to avoid cross contamination and reduce non-productive time associated with cleaning [2,16,41,42].
2.2.2. Coating
The homogenized slurry is then continuously or intermittently coated on to thin metal (copper or aluminum) foils called the current collector. The coating mechanism is usually a slot die, doctor blade, an anilox roller or a spray coater. The coating speed of the coating mechanism (25–80 ) defines the size of the dryer, and the coated electrodes are continuously transferred to the drying chamber to get the desired thickness by evaporating the solvent [34,41,42].
2.2.3. Drying
The drying chamber is operated by either convective air heating or infra-red or laser heating. The dryer length can be up to 100 m, and may consists of several temperature zones typically of 50–180 °C to improve the efficiency and quality of the drying. A minimal drying time, high throughput and good surface finish can be achieved by properly controlling the drying rate.
However, too high drying rates can initiate and drive binder migration and/or accumulation to the surface of the electrode. This usually happens by the increase of diffusion gradient of binder particles when the drying rates are high enough to give a Peclet number (Peclet number is the ratio of advection transport to diffusion transport. For electrode drying, this number depends on the drying rate, thickness of the electrode and the diffusion coefficient.) greater than unity and can happen even after the film shrinkage [43,44]. The binder migration and accumulation towards the surface leads to an in-homogeneous binder distribution inside the electrode. This could lead to poor adhesion properties and crack formation in the electrode [42] as well as reduced cell capacity [43]. Therefore, the drying rate should be carefully controlled.
2.2.4. Calendering
The dried electrodes are compressed using a set of rollers in the calendering process. The electrode films are statically discharged and cleaned before calendering using brushes or air flow, and a predetermined amount of pressure (around 2500 ) is exerted on to the rollers to compress the film, afterward the films are cleaned again [34,41,42,45].
2.2.5. Slitting
The calendared rolls are then cut into separate rolls along the width of the film, using rolling knives or laser cutters of more than to 100 . The separate individual rolls are then cleaned and rewound. These rolls are vacuum dried to remove any remaining solvent amount. These could either be batch dryers or continuous dryers as in the previous drying step [2,46].
2.2.6. Stacking or Winding
For a pouch cell there is an additional step before stacking, where the individual rolls are cut into separate electrodes. For this separation step, shear cutting, laser ablation or laser cutting is used. These separated anodes and cathodes are then alternatively stacked on top of each other (called a cell stack), with a separator sheet (a polymer porous film) in between, which is called stacking.
2.2.7. Packing
2.2.8. Electrolyte Filling and Final Sealing
The electrolyte is filled into the cell by a high precision dosing needle. The electrolyte is first filled into the cell under vacuum (filling), and then a pressure profile is applied to the cell to activate the capillary effects of the cell (wetting). Optimum electrolyte wetting is ensured for pouch cells by roll pressing, and for prismatic and cylindrical cells by using a vibrating table [45,46]. The cell is then sealed using vacuum sealing for pouch cells and using crimping, beading or welding method for prismatic and cylindrical cells.
2.2.9. Formation and Aging
The cells are stored in formation racks where the cells are contacted by the contact pins to charge and discharge according to predefined current and voltage profiles. During this process, a protective interface layer known as solid electrolyte interface (SEI) is formed between the electrolyte and the graphite particles of the anode. Specific formation procedures are used for different cell designs and chemistries.
The cells are stored in aging shelves or towers and monitored for the cell characteristics and performance by measuring the open circuit voltage, capacity and impedance for a considerably long time period. Aging can happen at high temperatures (30–50 °C) as well as at normal room temperatures. Aging time can vary up to 1.5–3 weeks or even longer, and when the cell properties are consistent over time, the aging is considered done and the cell is sent for quality controlling [42,45].
2.2.10. Quality Control and Sorting
After aging, the cells are discharged back to their shipping state of charge. Various tests depending on the manufacturer are carried out in this process, such as end of line tests, pulse tests, open circuit voltage tests, leakage tests, internal resistance measurements, and optical inspections. Based on performance data, the cells are sorted into different grades and packed for distribution as the final process step [45,46].
2.2.11. Additional Systems and Utilities
During various drying and calendering processes, separate units are needed for the treatment of solvent exhaust stream, which includes solvent recovery, and humidity control units. Furthermore, different process steps require specific environmental conditions. Therefore, different air conditioning requirements exist which demands high energy usages such as the dry room where it needs dry air (<1% humidity) of to −70 °C dew point. The dry air for dry room requires a separate dehumidification system. Similarly, for drying and vacuum drying processes, dry air (<15% humidity) of to 5 °C and 0 to °C dew point is required, respectively. Furthermore, clean room environments of ISO class 7–8 are needed for most of the process steps to avoid contamination, with 30–60% humidity and around 22 °C of room temperature, except where the hot processes happen [2,45]. Although these additional units increase the energy usage, these also provide the opportunity to reduce the energy requirements up to a certain extent by using waste heat recovery methods.
3. Results and Discussion
The results from the selected case study are presented here. A prismatic cell of a cathode chemistry of NMC333 and an anode chemistry of graphite (NMC333-G) is selected with a 2 production capacity per year. The intensive mixing and convection air drying is selected from the available technologies of the model.
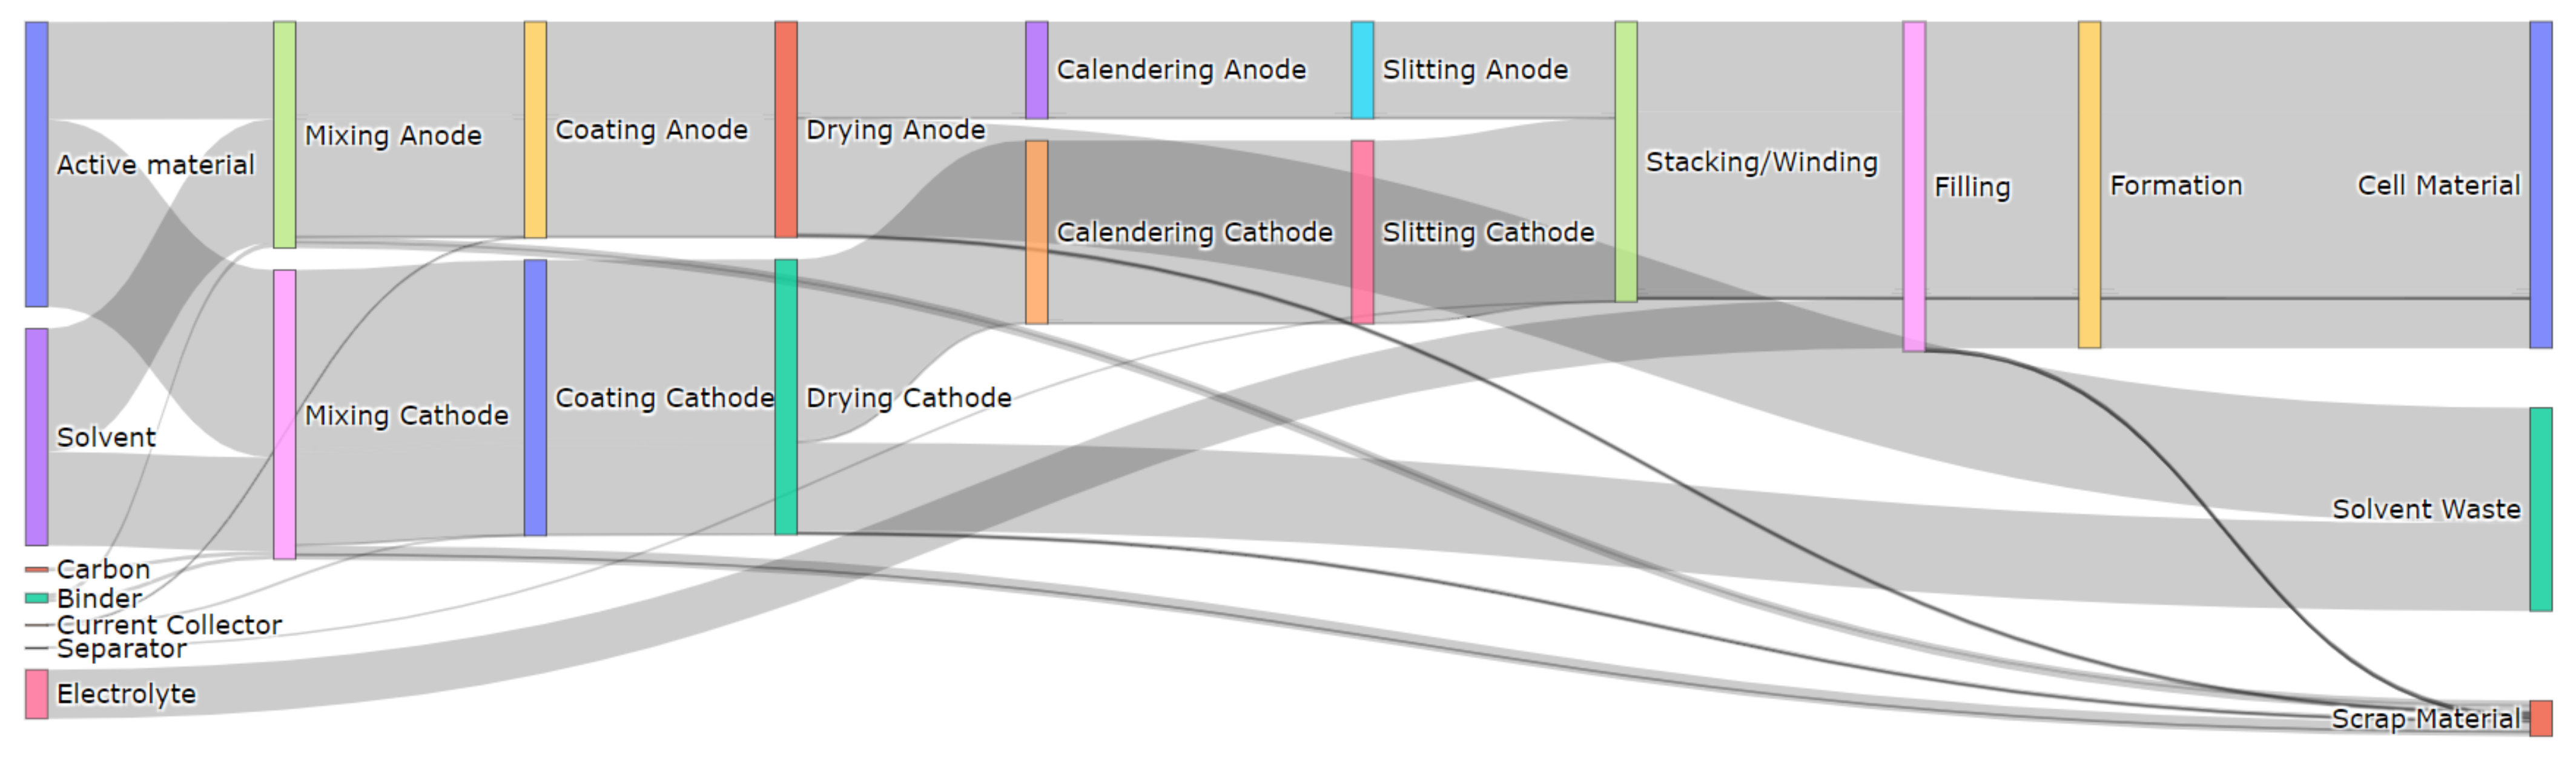
3.1. A Typical Material Flow for the Cell Production
The material flow for the selected throughput is calculated for each battery material component, which are active material, carbon, binder, solvent, current collector, separator, and electrolyte. The amount of scrap material is predefined as a percentage of 5–8% of the cell material [13]. The total material flow through each process step is illustrated in Figure 4. As the solvent recovery unit is not included in the model, the evaporated solvent is categorized as solvent waste. The composition of one cell of of material weight is listed in Table 1. The active material, carbon and binder mass ratio were referred from the BatPac model by Nelson et al. [36], which for the anode is 95:0:5 and for cathode is 96:2:2, respectively. The difference between the anode and cathode total mass and the amount of solvent can be seen both from Figure 4 and Table 1.
3.2. A Typical Energy Flow for the Cell Production
The tuning parameters of the model described in Equation (21) are tuned to industrial data of a similar capacity, and same prismatic NMC333-G cell production facility published by Dai et al. [11]. The energy breakdown for the case study is shown in the pie chart in Figure 5. Both the drying energy and dry room energy dominate than the other process steps. All the energy values are presented as electricity values, although it includes air heating and cooling energy. This is because the energy sources for the air heating and cooling are not decided in the model, hence lack the conversion factors. The energy values for each process step in detail is listed in Table 2 in terms of for of the produced cell. The total energy requirement is .
It is clearly seen that for mixing and drying, the cathode needs more energy than the anode. Cathode active material mass is higher than the anode active material mass, for this specific battery composition. Accordingly, the slurry mass is higher for cathode; thus, the mixing energy is also higher than the anode. For drying, the drying rate is slower for the cathode due to the NMP being the solvent that is evaporated as opposed to water evaporation rate of anode. The combined effect of the lower drying rate and the higher solvent mass that is being evaporated, resulted in the higher energy usage for cathode than anode drying. The high dry room energy requirement is mainly due to the environmental conditions of the ambient air, and the air flow rate that is needed to be circulated, which is based on the capacity of the plant. The formation step represents the energy for formation, which usually takes a long time compared to the other processes.
3.3. Comparison of the Case Study Results with the Available Literature Values
The availability of energy and material data on lithium-ion cell production is limited. Most of the data are from different LCA studies. Some of the most recent LCA and other studies on lithium-ion battery production is listed in Table 3 together with the type of the battery that is studied and the source of production data that is used for the calculation. The values indicate a high variance throughout the studies (1–846 , although the LCA inventory values are based on the same set of base studies. Most of these studies do not include the plant capacity, type of the cell, and also these do not include different techniques or the individual process steps, which could have contributed to the high variance indirectly.
However, there exist a few studies where the calculations are based on actual plant data of various annual production capacities. The energy breakdown of these data into each process step and their plant capacities, cell energy, cell chemistry and cell type are listed in Table 4. The general trend of these data is that the energy usage reduces when the annual capacity increases, probably due to the fact that mass production plants are designed for optimum profit and energy with various energy recovery methods in place. In contrast, most pilot scale plant facilities are designed for research purposes, where the main focus is for optimum product quality than the energy usage.
The cell type, chemistry and the plant capacity of the case study is selected to match the study by Dai et al. [11]. The parameters are tuned to match the average value of the data range. The existing literature data against the plant capacity is plotted in Figure 6, along with the model results that were tuned to data by Dai et al. [11]. Whenever the studies have not specified the plant capacities for their data, it is assumed to be zero and plotted along the y-axis. Furthermore, the entire distribution of energy values from the case study without changing the tuning parameters or the process parameters are plotted here.
Considering the giga-scale industrial plant data, the model results for the same battery chemistry as the 30 GWh plant data by Sun et al. [7] are slightly higher than the literature value, which is expected due to the capacity difference of the model and the plant. Furthermore, the model results are in the same range of 8 and 35 GWh plants estimated by Kurland [9]. The estimated data are only for the electricity consumption thus can assume to have underestimated. However, the 8 GWh factory is still under construction and the 35 GWh factory is recently built in 2017, thus the potential use of heat could be marginal.
The model results are comparable with most of the giga-scale factories, and it also shows that with the increase of capacity more than 2 GWh, the change of energy usage is very small. However, the data by Sun et al. [7] suggest that the energy usage can be further reduced, thus energy optimization methods need to be included in the model in the future for better results.
3.4. Sensitivity Analysis
A sensitivity analysis is done to find out the influence of various process parameters and the battery chemistry on the energy consumption of the production process.
3.4.1. Influence of Cell Chemistry on the Energy Usage
The total energy usage and their breakdown into each process step for various types of cell chemistries are shown in Figure 7. The process parameters were kept the same as what is used in the case study. The energy values show a high variance in the figure as the cell energy changes with the cell chemistry (). However, the mean and standard deviation of energy usage per mass is . LMO-LTO cell has LTO as the anode, and therefore having NMP as the anode solvent. Furthermore, it also has the highest mass for 1 cell, which in combination have resulted a considerably higher energy usage than the other cells. NCA-G cell has the lowest energy usage, while most of the NMC-G cells have a similar energy usage except NMC811-G, which is slightly higher than the rest of NMC cells. The NMC333-Si has a slightly lower energy usage than the NMC333-G cell, although the Si anode cell has the highest energy density among the selected cells. Although the total energy usage varies, the percentage energy breakdowns for each process step do not have a significant variation.
3.4.2. Influence of the Process Parameters on the Energy Usage
The process parameters of each process step are crucial for the final quality and performance of the cell. For example at the wet mixing step, the homogeneity of the slurry, particle size, viscosity and purity are the most important parameters and thus affect the quality of the electrodes [2,16,41,42]. Different drying and coating product parameters such as the homogeneity, thickness of the coat, mass loading, porosity, conductivity, adhesion and cohesion during the drying, residual humidity of electrode and surface finish influence the final cell performance. Similarly, the process parameters such as the drying temperature, evaporation rate, and speed of air flow affect the physical qualities of the electrode and the electrochemical performance [34,41,42,55]. The parameters in the formation process such as the internal resistance of the cell, formation and stability of the SEI are the most important quality parameters as these influence the cell performance [45].
Furthermore, these process steps are interdependent, and their process parameters influences the optimum performance characteristics of the produced cell. Moreover, the process technologies, process parameters, and the quality of the produced cell highly depends on the manufacturer, the type of battery being produced, and the battery materials. This makes optimization of the process as well as generalized modeling difficult. Furthermore, the machinery for each process step is usually provided by different machinery and plant manufacturers who specialize in each step, which becomes a challenge to integrate, automate and optimize into a technologically balanced process [2].
In the simplified model, the process quality inter-dependencies are not modeled. The process parameters are selected to be optimum values from the available literature; therefore, each process unit is isolated in terms of quality of the final cell. This is mainly because the model does not include a cell model for determining the electrochemical performance based on the components. Hence, it is important to see how a certain deviation of these process parameters will affect the final energy consumption through a sensitivity analysis.
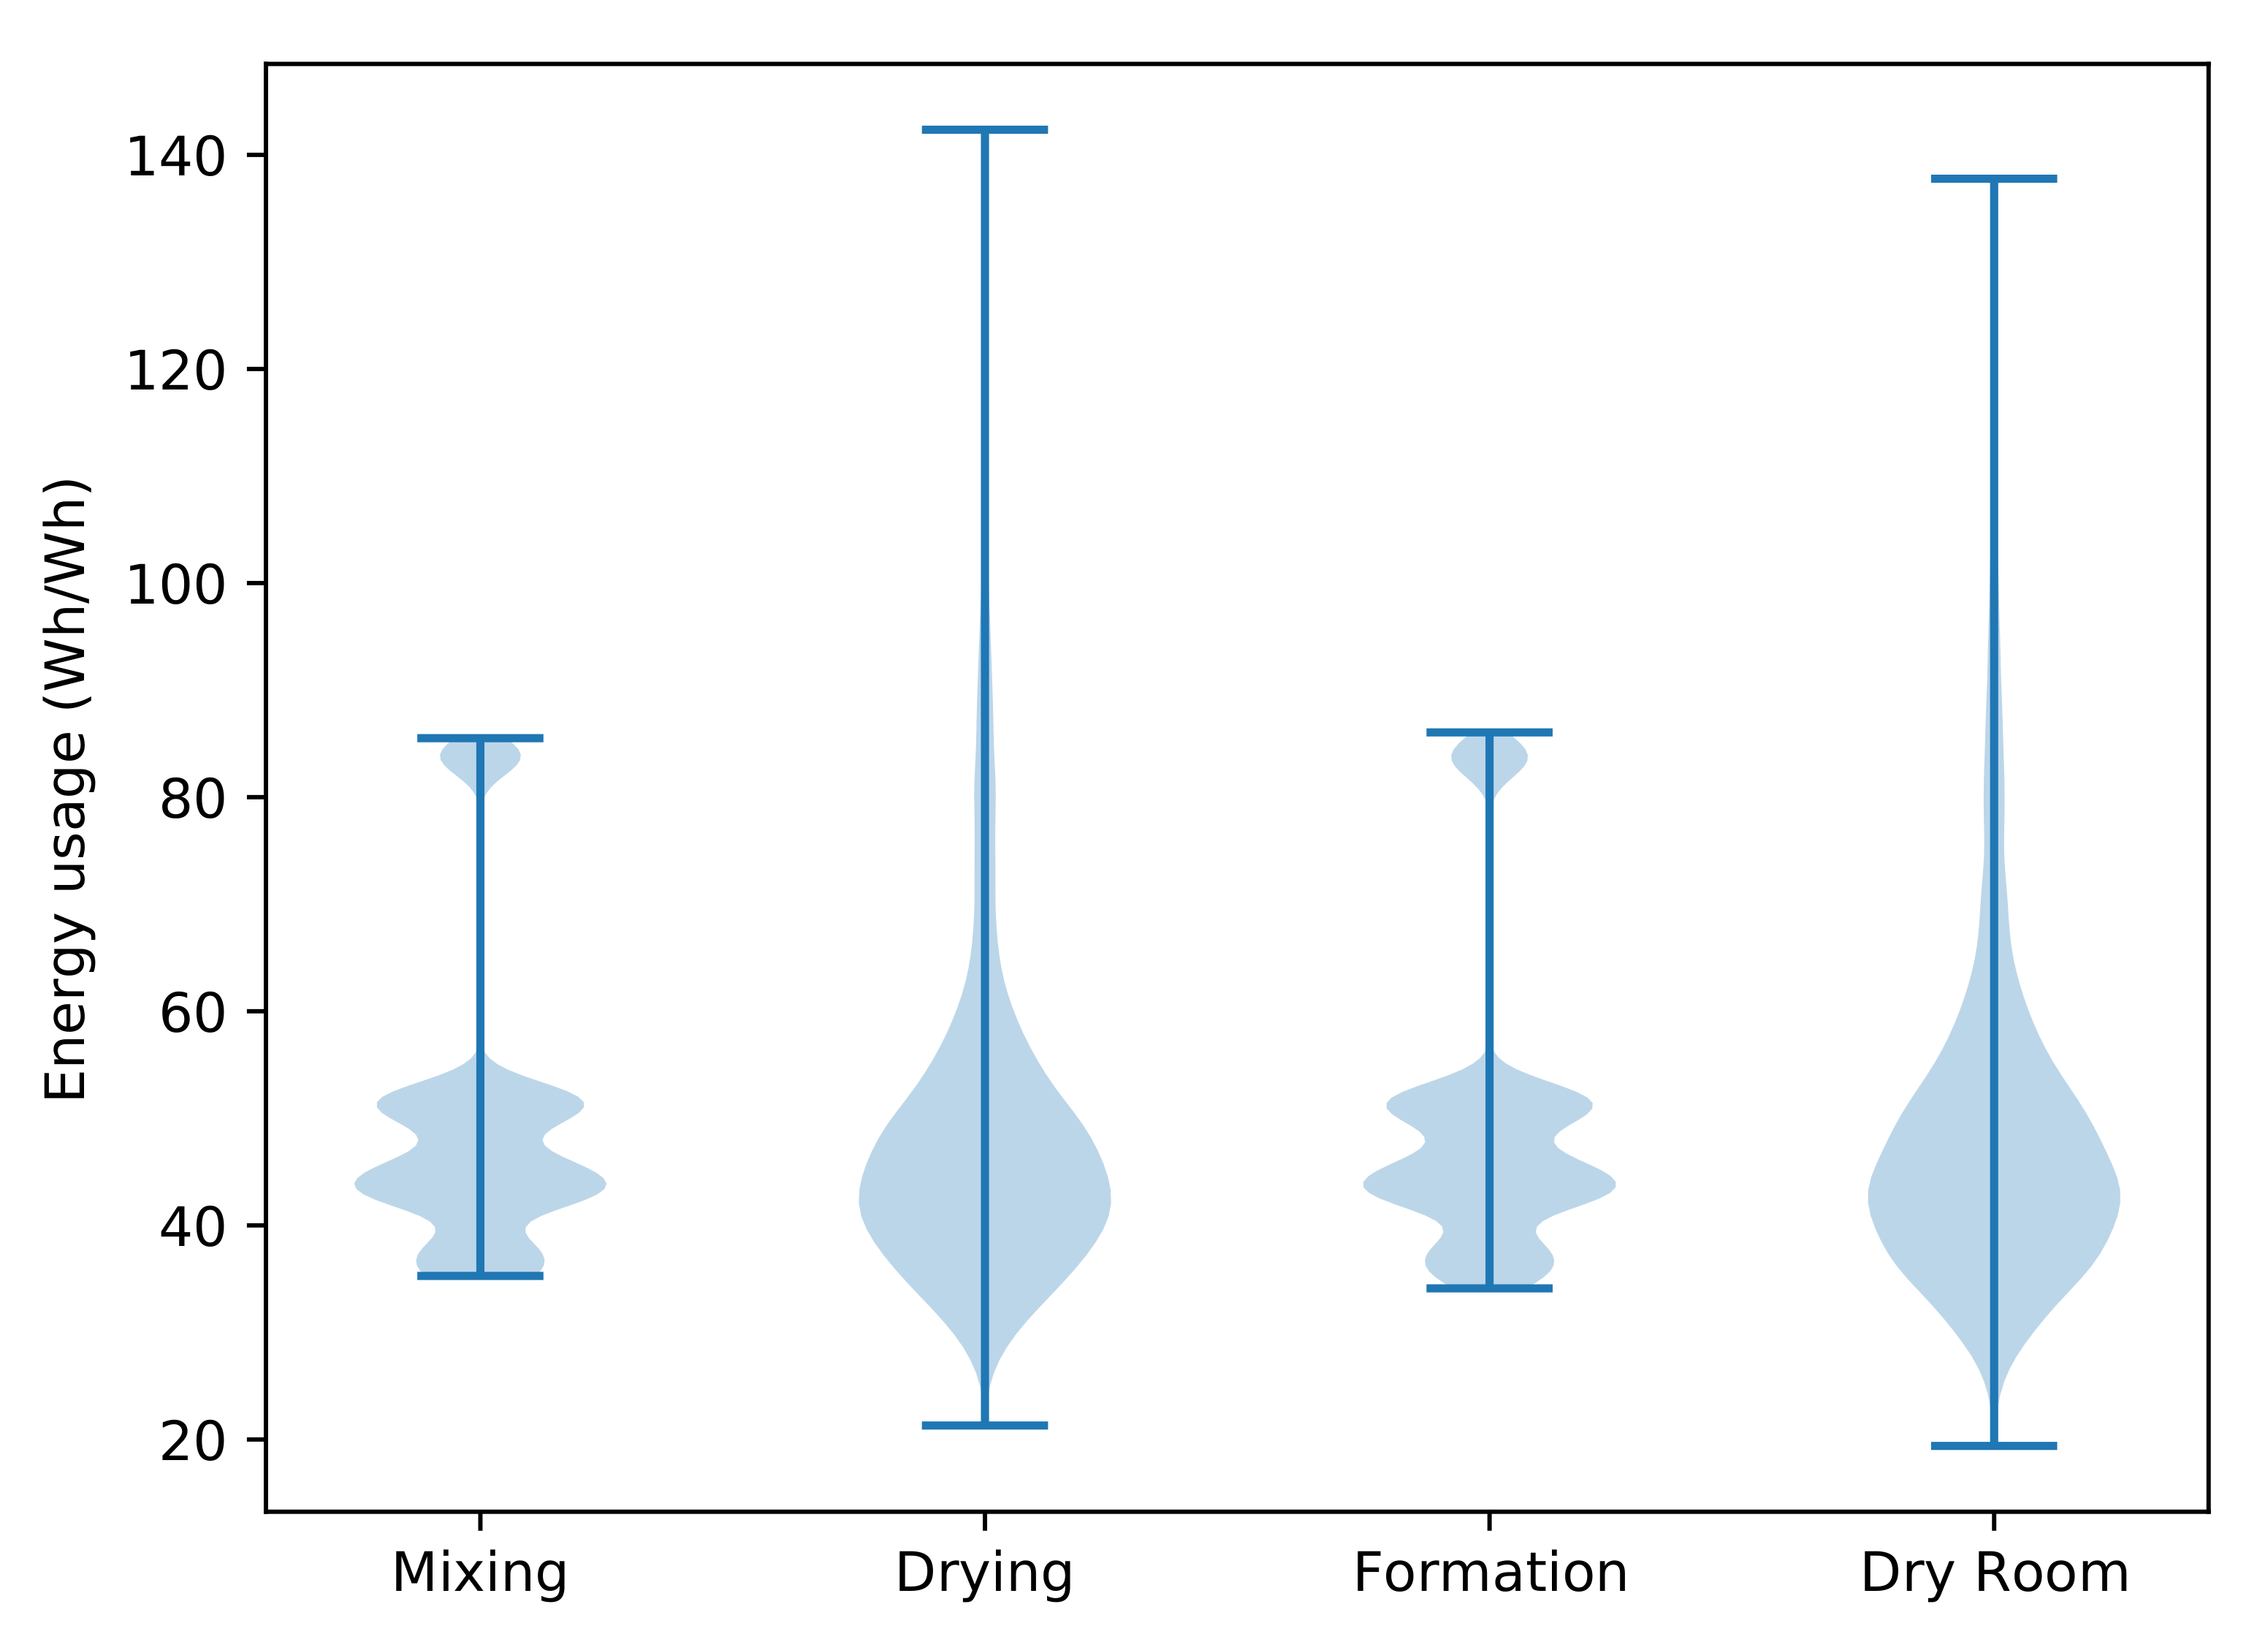
Each process parameter is considered to be a distribution of 2000 samples that are taken from a pool of a normal distribution with a mean of the optimized value and a standard deviation where at least 99% of the normal distribution is included in the sample distribution. Then a random combination of each process parameter for the selected process is simulated and the resulting total energy usage distribution is taken for analysis. Only the mixing, drying, formation and dry room are selected for the analysis as these are the model units that contain process parameters. The process parameters that are used in the sensitivity analysis is listed in Table 5 with their mean values and the standard deviations. The means and standard deviations of the resultant energy usage distributions (in ) are also shown in Table 5 while the entire distributions are shown in Figure 8.
The mixing and formation parameters have less influence on the total energy as the contribution to the total is low. In contrast, the drying and dry room have the biggest contributions to the total energy, and the parameters have a larger influence on the total energy. However, the parameters of dry room, such as the air flow rate, air temperature, humidity, and dew point of the dry air affect to the total energy more than the drying parameters such as drying temperature and rate. The clear separation of all the distributions at the high energy values are the corresponding values from the LMO-LTO cells, where the total energy demand is considerably higher than other cell chemistries. The means and standard deviations of the energy distributions are , , , (), for mixing, drying, formation and dry room, respectively. This shows that the drying and dry room parameters have a high impact on the energy consumption of the model.
3.5. Limitations
The model consists only the most energy intensive process units in detail, and the models are simplified. Cell performance and process parameters are not interconnected as it should be, therefore needs inclusion of these for a better model result. Most of the additional units, such as solvent recovery unit and desiccant regeneration unit, and some of the utilities such as water distribution systems, lighting systems, and ventilation systems are not included due to the complexity. Therefore, the resolution of the existing model is quite low, thus these units should be included in the model for a better resolution and accuracy. To overcome some of these limitations the model is tuned using tuning parameters; however, it is not always possible when the necessary data is not available. Furthermore, the model is validated with existing literature values and further validation using industrial data would enhance the accuracy of the model.
Apart from benchmarking, the model can also be beneficial in identifying different strategies for minimizing energy usage, either by optimizing the process parameters or by recognizing energy intensive process steps. Although this is limited in the current model, this can also be improved by the inclusion of additional utility units to identify different energy reduction strategies within the process, and/or by inclusion of cell performance relationships to process parameters as discussed above.
4. Conclusions
A process model is developed to determine the material and energy flows of a general lithium-ion battery cell manufacturing process. The model is flexible for different battery chemistries, types, throughputs and process technologies. The system consists of machine units, process units and building units with intermediate product units. The theoretical process units are modeled with detailed process parameters with maximum efficiency and then tuned to match the values from industrial scale process plants. The model results show that the modeling approach is capable of benchmarking the energy usage which otherwise would be difficult with the existing models. The main advantage of the model is that it is based on process modeling, where the main key parameters that will affect the energy usage, such as the cell chemistry, cell type, factory capacity, and production technologies can be changed in the model to achieve different benchmark values.
Author Contributions
Conceptualization, A.J., A.H.S. and O.S.B.; methodology, A.J.; modeling, programming, and validation, A.J.; formal analysis, A.J. and A.H.S.; investigation and visualization, A.J.; writing—original draft preparation, A.J.; writing—review and editing, A.H.S. and O.S.B.; supervision, A.H.S.; project administration, A.H.S. and O.S.B.; funding acquisition, O.S.B. All authors have read and agreed to the published version of the manuscript.
Funding
The authors acknowledge Freyr Battery AS, Norwegian University of Science and Technology (grant 90492503) and EIT Innoenergy SE (grant 02-2019-IP172-FREYR) for funding this research.
Institutional Review Board Statement
Not applicable.
Informed Consent Statement
Not applicable.
Data Availability Statement
The data presented in this study are available on request from the corresponding author.
Acknowledgments
A.J. acknowledges the technical support given by Radek Lonka (Research Software Engineer, Industrial Ecology Programme, Department of Energy and Process Engineering, Norwegian University of Science and Technology, Norway) in structuring the model.
Conflicts of Interest
The authors declare no conflict of interest. The funders had no role in the design of the study; in the collection, analyses, or interpretation of data; in the writing of the manuscript, or in the decision to publish the results.
Abbreviations
The following abbreviations are used in this manuscript:
| BEV | Battery Electric Vehicle |
| EV | Electric Vehicle |
| G | Graphite |
| GWP | Global Warming Potential |
| LCA | Life-Cycle Assessment |
| LFP | Lithium iron phosphate (LiFePO4) |
| LMO | LiMn2O4 |
| LTO | Li4Ti5O12 |
| NCA | LiNi0.8Co0.15Al0.05O2 |
| NCO | Lithium nickel cobalt oxides |
| NMC | Lithium nickel manganese cobalt oxides |
| NMC532 | LiNi0.5Mn0.3Co0.2O2 |
| NMC622 | LiNi0.6Mn0.2Co0.2O2 |
| NMC811 | LiNi0.8Mn0.1Co0.1O2 |
| NMC333 or NMC111 | LiNi0.3Mn0.3Co0.3O2 |
| NMP | N-Methyl-2-Pyrrolidone |
| PHEV | Plug-In Hybrid Electric Vehicle |
| SEI | Solid Electrolyte Interface |
| Si | Silicon |
References
- International Energy Agency. Global EV Outlook 2020: Entering the Decade of Electric Drive; Technical Report; International Energy Agency: Paris, France, 2020. [Google Scholar] [CrossRef]
- Korthauer, R. Lithium-Ion Batteries: Basics and Applications; Springer: Berlin, Germany, 2018; pp. 1–413. [Google Scholar] [CrossRef]
- Kallitsis, E.; Korre, A.; Kelsall, G.; Kupfersberger, M.; Nie, Z. Environmental life cycle assessment of the production in China of lithium-ion batteries with nickel-cobalt-manganese cathodes utilising novel electrode chemistries. J. Clean. Prod. 2020, 254, 120067. [Google Scholar] [CrossRef]
- Notter, D.A.; Gauch, M.; Widmer, R.; Wäger, P.; Stamp, A.; Zah, R.; Althaus, H.J. Contribution of Li-ion batteries to the environmental impact of electric vehicles. Environ. Sci. Technol. 2010, 44, 6550–6556. [Google Scholar] [CrossRef] [PubMed]
- Ellingsen, L.A.W.; Majeau-Bettez, G.; Singh, B.; Srivastava, A.K.; Valøen, L.O.; Strømman, A.H. Life Cycle Assessment of a Lithium-Ion Battery Vehicle Pack. J. Ind. Ecol. 2014, 18, 113–124. [Google Scholar] [CrossRef] [Green Version]
- Weeber, M.; Wanner, J.; Schlegel, P.; Birke, K.P.; Sauer, A. Methodology for the Simulation based Energy Efficiency Assessment of Battery Cell Manufacturing Systems. Procedia Manuf. 2020, 43, 32–39. [Google Scholar] [CrossRef]
- Sun, X.; Luo, X.; Zhang, Z.; Meng, F.; Yang, J. Life cycle assessment of lithium nickel cobalt manganese oxide (NCM) batteries for electric passenger vehicles. J. Clean. Prod. 2020, 273, 123006. [Google Scholar] [CrossRef]
- Thomitzek, M.; Von Drachenfels, N.; Cerdas, F.; Herrmann, C.; Thiede, S. Simulation-based assessment of the energy demand in battery cell manufacturing. Procedia CIRP 2019, 80, 126–131. [Google Scholar] [CrossRef]
- Kurland, S.D. Energy use for GWh-scale lithium-ion battery production. Environ. Res. Commun. 2020, 2, 012001. [Google Scholar] [CrossRef]
- Philippot, M.; Alvarez, G.; Ayerbe, E.; Mierlo, J.V.; Messagie, M. Eco-efficiency of a lithium-ion battery for electric vehicles: Influence of manufacturing country and commodity prices on ghg emissions and costs. Batteries 2019, 5, 23. [Google Scholar] [CrossRef] [Green Version]
- Dai, Q.; Kelly, J.C.; Gaines, L.; Wang, M. Life cycle analysis of lithium-ion batteries for automotive applications. Batteries 2019, 5, 48. [Google Scholar] [CrossRef] [Green Version]
- Schünemann, J.H. Modell zur Bewertung der Herstellkosten von Lithiumionenbatteriezellen, 1st ed.; Sierke: Braunschweig, Germany, 2015; p. 208. [Google Scholar]
- Pettinger, K.H.; Dong, W. When does the operation of a battery become environmentally positive? J. Electrochem. Soc. 2017, 164, A6274–A6277. [Google Scholar] [CrossRef]
- Yuan, C.; Deng, Y.; Li, T.; Yang, F. Manufacturing energy analysis of lithium ion battery pack for electric vehicles. CIRP Ann. Manuf. Technol. 2017, 66, 53–56. [Google Scholar] [CrossRef]
- Kremer, L.S.; Hoffmann, A.; Danner, T.; Hein, S.; Prifling, B.; Westhoff, D.; Dreer, C.; Latz, A.; Schmidt, V.; Wohlfahrt-Mehrens, M. Manufacturing Process for Improved Ultra-Thick Cathodes in High-Energy Lithium-Ion Batteries. Energy Technol. 2019, 8, 1900167. [Google Scholar] [CrossRef]
- Bockholt, H.; Haselrieder, W.; Kwade, A. Intensive Dry and Wet Mixing Influencing the Structural and Electrochemical Properties of Secondary Lithium-Ion Battery Cathodes. ECS Trans. 2013, 50, 25–35. [Google Scholar] [CrossRef]
- Lenze, G.; Bockholt, H.; Schilcher, C.; Froböse, L.; Jansen, D.; Krewer, U.; Kwade, A. Impacts of Variations in Manufacturing Parameters on Performance of Lithium-Ion-Batteries. J. Electrochem. Soc. 2018, 165, A314–A322. [Google Scholar] [CrossRef]
- Meyer, C.; Kosfeld, M.; Haselrieder, W.; Kwade, A. Process modeling of the electrode calendering of lithium-ion batteries regarding variation of cathode active materials and mass loadings. J. Energy Storage 2018, 18, 371–379. [Google Scholar] [CrossRef]
- Schreiner, D.; Oguntke, M.; Günther, T.; Reinhart, G. Modelling of the Calendering Process of NMC-622 Cathodes in Battery Production Analyzing Machine/Material–Process–Structure Correlations. Energy Technol. 2019, 7, 1900840. [Google Scholar] [CrossRef]
- Mayer, J.K.; Almar, L.; Asylbekov, E.; Haselrieder, W.; Kwade, A.; Weber, A.; Nirschl, H. Influence of the Carbon Black Dispersing Process on the Microstructure and Performance of Li-Ion Battery Cathodes. Energy Technol. 2020, 8, 1900161. [Google Scholar] [CrossRef]
- Cunha, R.P.; Lombardo, T.; Primo, E.N.; Franco, A.A. Artificial Intelligence Investigation of NMC Cathode Manufacturing Parameters Interdependencies. Batteries Supercaps 2020, 3, 60–67. [Google Scholar] [CrossRef] [Green Version]
- Thiede, S.; Turetskyy, A.; Kwade, A.; Kara, S.; Herrmann, C. Data mining in battery production chains towards multi-criterial quality prediction. CIRP Ann. 2019, 68, 463–466. [Google Scholar] [CrossRef]
- Komas, T.; Daub, R.; Karamat, M.Z.; Thiede, S.; Herrmann, C. Data-and expert-driven analysis of cause-effect relationships in the production of lithium-ion batteries. In Proceedings of the IEEE International Conference on Automation Science and Engineering, Vancouver, BC, Canada, 22–26 August 2019; pp. 380–385. [Google Scholar] [CrossRef]
- Chouchane, M.; Rucci, A.; Lombardo, T.; Ngandjong, A.C.; Franco, A.A. Lithium ion battery electrodes predicted from manufacturing simulations: Assessing the impact of the carbon-binder spatial location on the electrochemical performance. J. Power Sources 2019, 444, 227285. [Google Scholar] [CrossRef]
- Schneider, S.F.; Bauer, C.; Novák, P.; Berg, E.J. A modeling framework to assess specific energy, costs and environmental impacts of Li-ion and Na-ion batteries. Sustain. Energy Fuels 2019, 3, 3061–3070. [Google Scholar] [CrossRef] [Green Version]
- Ahmed, S.; Nelson, P.A.; Gallagher, K.G.; Dees, D.W. Energy impact of cathode drying and solvent recovery during lithium-ion battery manufacturing. J. Power Sources 2016, 322, 169–178. [Google Scholar] [CrossRef] [Green Version]
- Oppegård, E.; Jinasena, A.; Strømman, A.H.; Suul, J.A.; Burheim, O.S. Study of an Industrial Electrode Dryer of a Lithium-Ion Battery Manufacturing Plant: Dynamic Modeling. In Proceedings of the 61st Conference on Modelling and Simulation (SIMS 61); Linköping University Electronic Press: Oulu, Finland, 2020; in press. [Google Scholar]
- Herrmann, C.; Thiede, S. Process chain simulation to foster energy efficiency in manufacturing. CIRP J. Manuf. Sci. Technol. 2009, 1, 221–229. [Google Scholar] [CrossRef]
- Alvandi, S.; Bienert, G.; Li, W.; Kara, S. Hierarchical modelling of complex material and energy flow in manufacturing systems. Procedia CIRP 2015, 29, 92–97. [Google Scholar] [CrossRef]
- Schönemann, M.; Bockholt, H.; Thiede, S.; Kwade, A.; Herrmann, C. Multiscale simulation approach for production systems. Int. J. Adv. Manuf. Technol. 2019, 102, 1373–1390. [Google Scholar] [CrossRef]
- Thomitzek, M.; Schmidt, O.; Röder, F.; Krewer, U.; Herrmann, C.; Thiede, S. Simulating Process-Product Interdependencies in Battery Production Systems. Procedia CIRP 2018, 72, 346–351. [Google Scholar] [CrossRef]
- Schmidt, O.; Thomitzek, M.; Röder, F.; Thiede, S. Modeling the impact of manufacturing uncertainties on lithium-ion batteries. J. Electrochem. Soc. 2020, 167, 1–15. [Google Scholar] [CrossRef]
- Miao, Y.; Hynan, P.; Von Jouanne, A.; Yokochi, A. Current li-ion battery technologies in electric vehicles and opportunities for advancements. Energies 2019, 12, 1074. [Google Scholar] [CrossRef] [Green Version]
- Hawley, W.B.; Li, J. Electrode manufacturing for lithium-ion batteries—Analysis of current and next generation processing. J. Energy Storage 2019, 25, 100862. [Google Scholar] [CrossRef]
- Li, B.; Gao, X.; Li, J.; Yuan, C. Life cycle environmental impact of high-capacity lithium ion battery with silicon nanowires anode for electric vehicles. Environ. Sci. Technol. 2014, 48, 3047–3055. [Google Scholar] [CrossRef]
- Nelson, P.A.; Ahmed, S.; Gallagher, K.G.; Dees, D.W. Cost savings for manufacturing lithium batteries in a flexible plant. J. Power Sources 2015, 283, 506–516. [Google Scholar] [CrossRef] [Green Version]
- Coulson, J.M.; Richardson, J.F.; Backhurst, J.R.; Harker, J.H. Chemical Engineering Volume 1: Fluid Flow, Heat Transfer and Mass Transfer, 6th ed.; Butterworth-Heinemann: Oxford, UK, 1999; p. 895. [Google Scholar]
- Richardson, J.F.; Harker, J.H.; Backhurst, J.R. Chemical Engineering Volume 2: Particle Technology and Separation Processes, 5th ed.; Butterworth-Heinemann: Oxford, UK, 2002; p. 1183. [Google Scholar]
- ISO 14644-1:2015. Cleanrooms and Associated Controlled Environments—Part 1: Classification of Air Cleanliness by Particle Concentration; Standard ISO 14644-1:2015(E); International Organization for Standardization: Geneva, Switzerland, 2015. [Google Scholar]
- Sinnott, R. Chemical Engineering Design, 4th ed.; Elsevier: Oxford, UK, 2005; Volume 6, p. 1038. [Google Scholar]
- Kwade, A.; Haselrieder, W.; Leithoff, R.; Modlinger, A.; Dietrich, F.; Droeder, K. Current status and challenges for automotive battery production technologies. Nat. Energy 2018, 3, 290–300. [Google Scholar] [CrossRef]
- Kendrick, E. Advancements in Manufacturing. In Future Lithium-ion Batteries; Eftekhari, A., Ed.; The Royal Society of Chemistry: Croydon, UK, 2019; Chapter 11; pp. 262–289. [Google Scholar] [CrossRef]
- Jaiser, S.; Müller, M.; Baunach, M.; Bauer, W.; Scharfer, P.; Schabel, W. Investigation of film solidification and binder migration during drying of Li-Ion battery anodes. J. Power Sources 2016, 318, 210–219. [Google Scholar] [CrossRef]
- Font, F.; Protas, B.; Richardson, G.; Foster, J.M. Binder migration during drying of lithium-ion battery electrodes: Modelling and comparison to experiment. J. Power Sources 2018, 393, 177–185. [Google Scholar] [CrossRef] [Green Version]
- Heimes, H.; Kampker, A.; Lienemann, C.; Locke, M.; Offermanns, C. Lithium-Ion Battery Cell Production Process; VDMA Battery Production: Frankfurt, Germany, 2019; p. 23. [Google Scholar]
- Tagawa, K.; Brodd, R.J. Production Processes for Fabrication of Lithium-Ion Batteries. In Lithium-ion Batteries: Science and Technologies; Yoshio, M., Brodd, R.J., Kozawa, A., Eds.; Springer: New York, NY, USA, 2009; Chapter 8; p. 452. [Google Scholar] [CrossRef]
- Das, A.; Li, D.; Williams, D.; Greenwood, D. Joining technologies for automotive battery systems manufacturing. World Electr. Veh. J. 2018, 9, 22. [Google Scholar] [CrossRef] [Green Version]
- Xiong, S.; Ji, J.; Ma, X. Comparative life cycle energy and GHG emission analysis for BEVs and PHEVs: A case study in China. Energies 2019, 12, 834. [Google Scholar] [CrossRef] [Green Version]
- Kim, H.C.; Wallington, T.J.; Arsenault, R.; Bae, C.; Ahn, S.; Lee, J. Cradle-to-Gate Emissions from a Commercial Electric Vehicle Li-Ion Battery: A Comparative Analysis. Environ. Sci. Technol. 2016, 50, 7715–7722. [Google Scholar] [CrossRef]
- Le Varlet, T.; Schmidt, O.; Gambhir, A.; Few, S.; Staffell, I. Comparative life cycle assessment of lithium-ion battery chemistries for residential application. J. Energy Storage 2020, 28, 101230. [Google Scholar] [CrossRef]
- Qiao, Q.; Zhao, F.; Liu, Z.; Jiang, S.; Hao, H. Cradle-to-gate greenhouse gas emissions of battery electric and internal combustion engine vehicles in China. Appl. Energy 2017, 204, 1399–1411. [Google Scholar] [CrossRef]
- Marques, P.; Garcia, R.; Kulay, L.; Freire, F. Comparative life cycle assessment of lithium-ion batteries for electric vehicles addressing capacity fade. J. Clean. Prod. 2019, 229, 787–794. [Google Scholar] [CrossRef]
- Dunn, J.B.; Gaines, L.; Sullivan, J.; Wang, M.Q. Impact of recycling on cradle-to-gate energy consumption and greenhouse gas emissions of automotive lithium-ion batteries. Environ. Sci. Technol. 2012, 46, 12704–12710. [Google Scholar] [CrossRef]
- Majeau-Bettez, G.; Hawkins, T.R.; Strømman, A.H. Life cycle environmental assessment of lithium-ion and nickel metal hydride batteries for plug-in hybrid and battery electric vehicles. Environ. Sci. Technol. 2011, 45, 4548–4554. [Google Scholar] [CrossRef]
- Westphal, B.G.; Bockholt, H.; Günther, T.; Haselrieder, W.; Kwade, A. Influence of convective drying parameters on electrode performance and physical electrode properties. ECS Trans. 2015, 64, 57–68. [Google Scholar] [CrossRef]
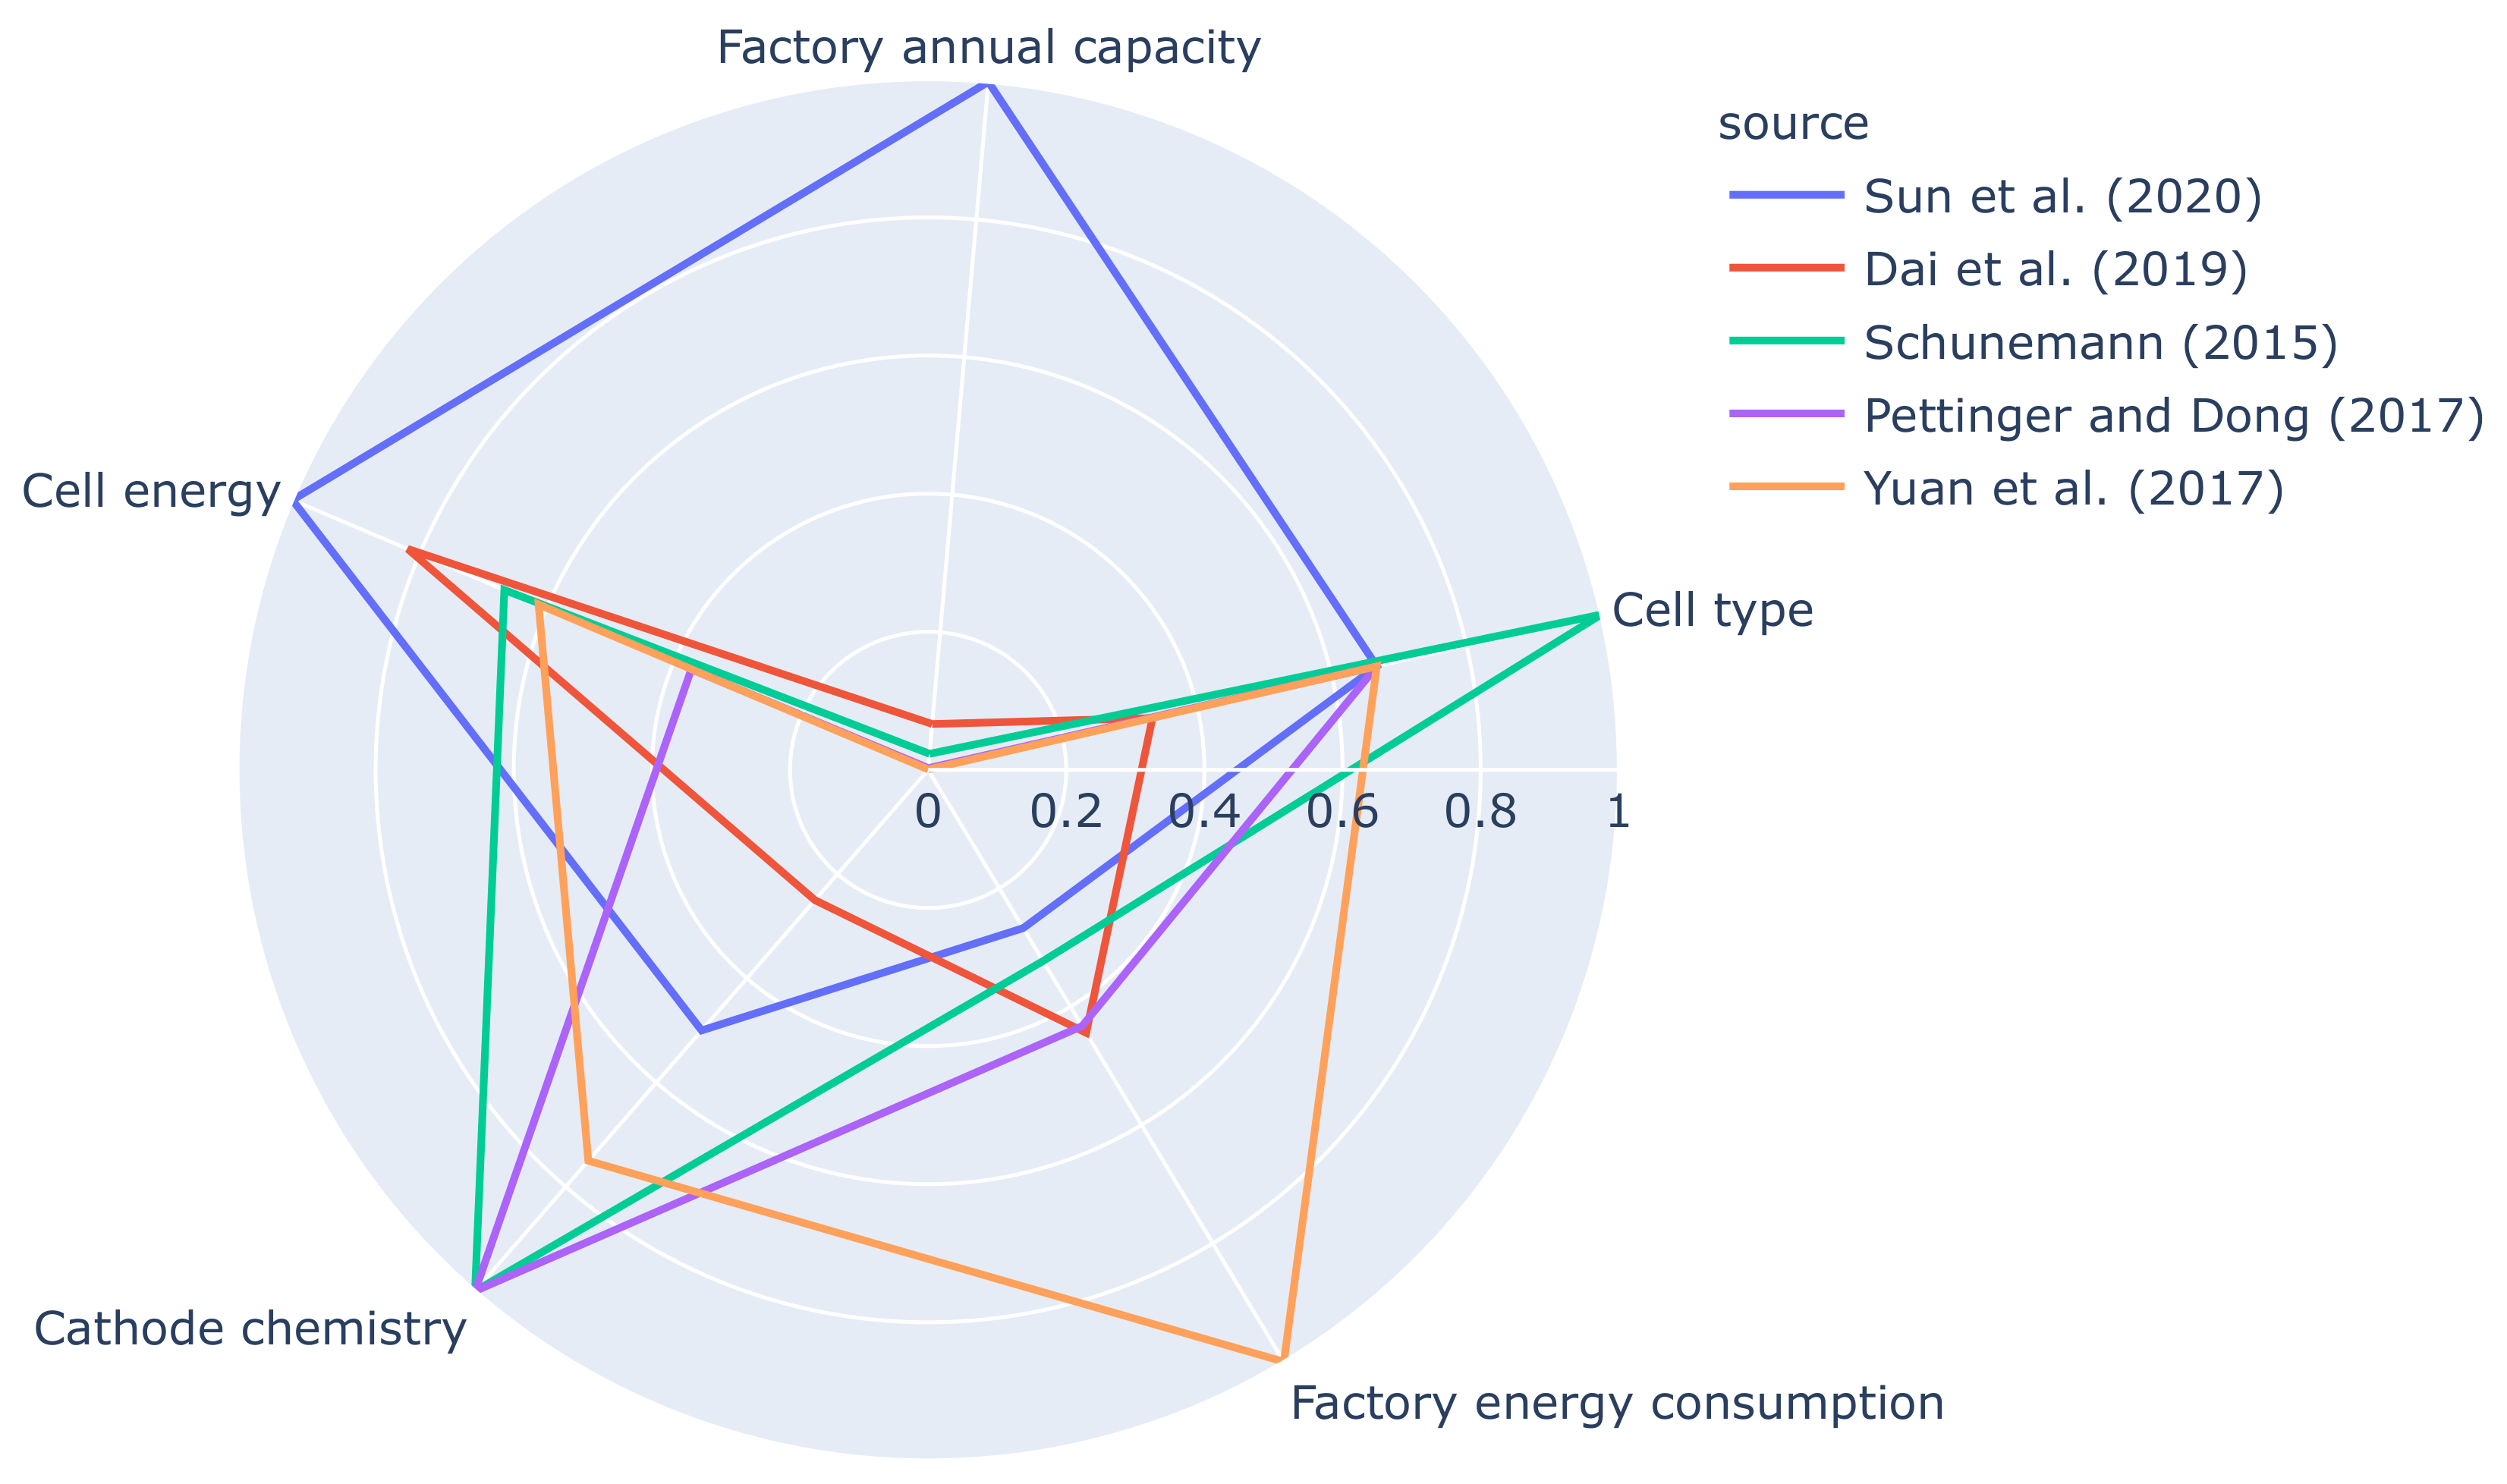
Figure 1.
The characteristics of the normalized available data of medium-to-large-scale industrial plants and large-scale pilot plants [7,11,12,13,14]. The cell types are prismatic (1), pouch (0.6) and non-specified (0.3), where the cathode chemistries are NMC333 (0.25), NMC622 (0.5), LMO (0.75) and non-specified (1).

Figure 2.
The flexible model system structure as applied here.

Figure 3.
A block diagram of a general process flow.

Figure 4.
The material flow for manufacturing of NMC333-G battery cells.

Figure 5.
The percentage energy usage for different manufacturing steps of NMC333-G battery cells.
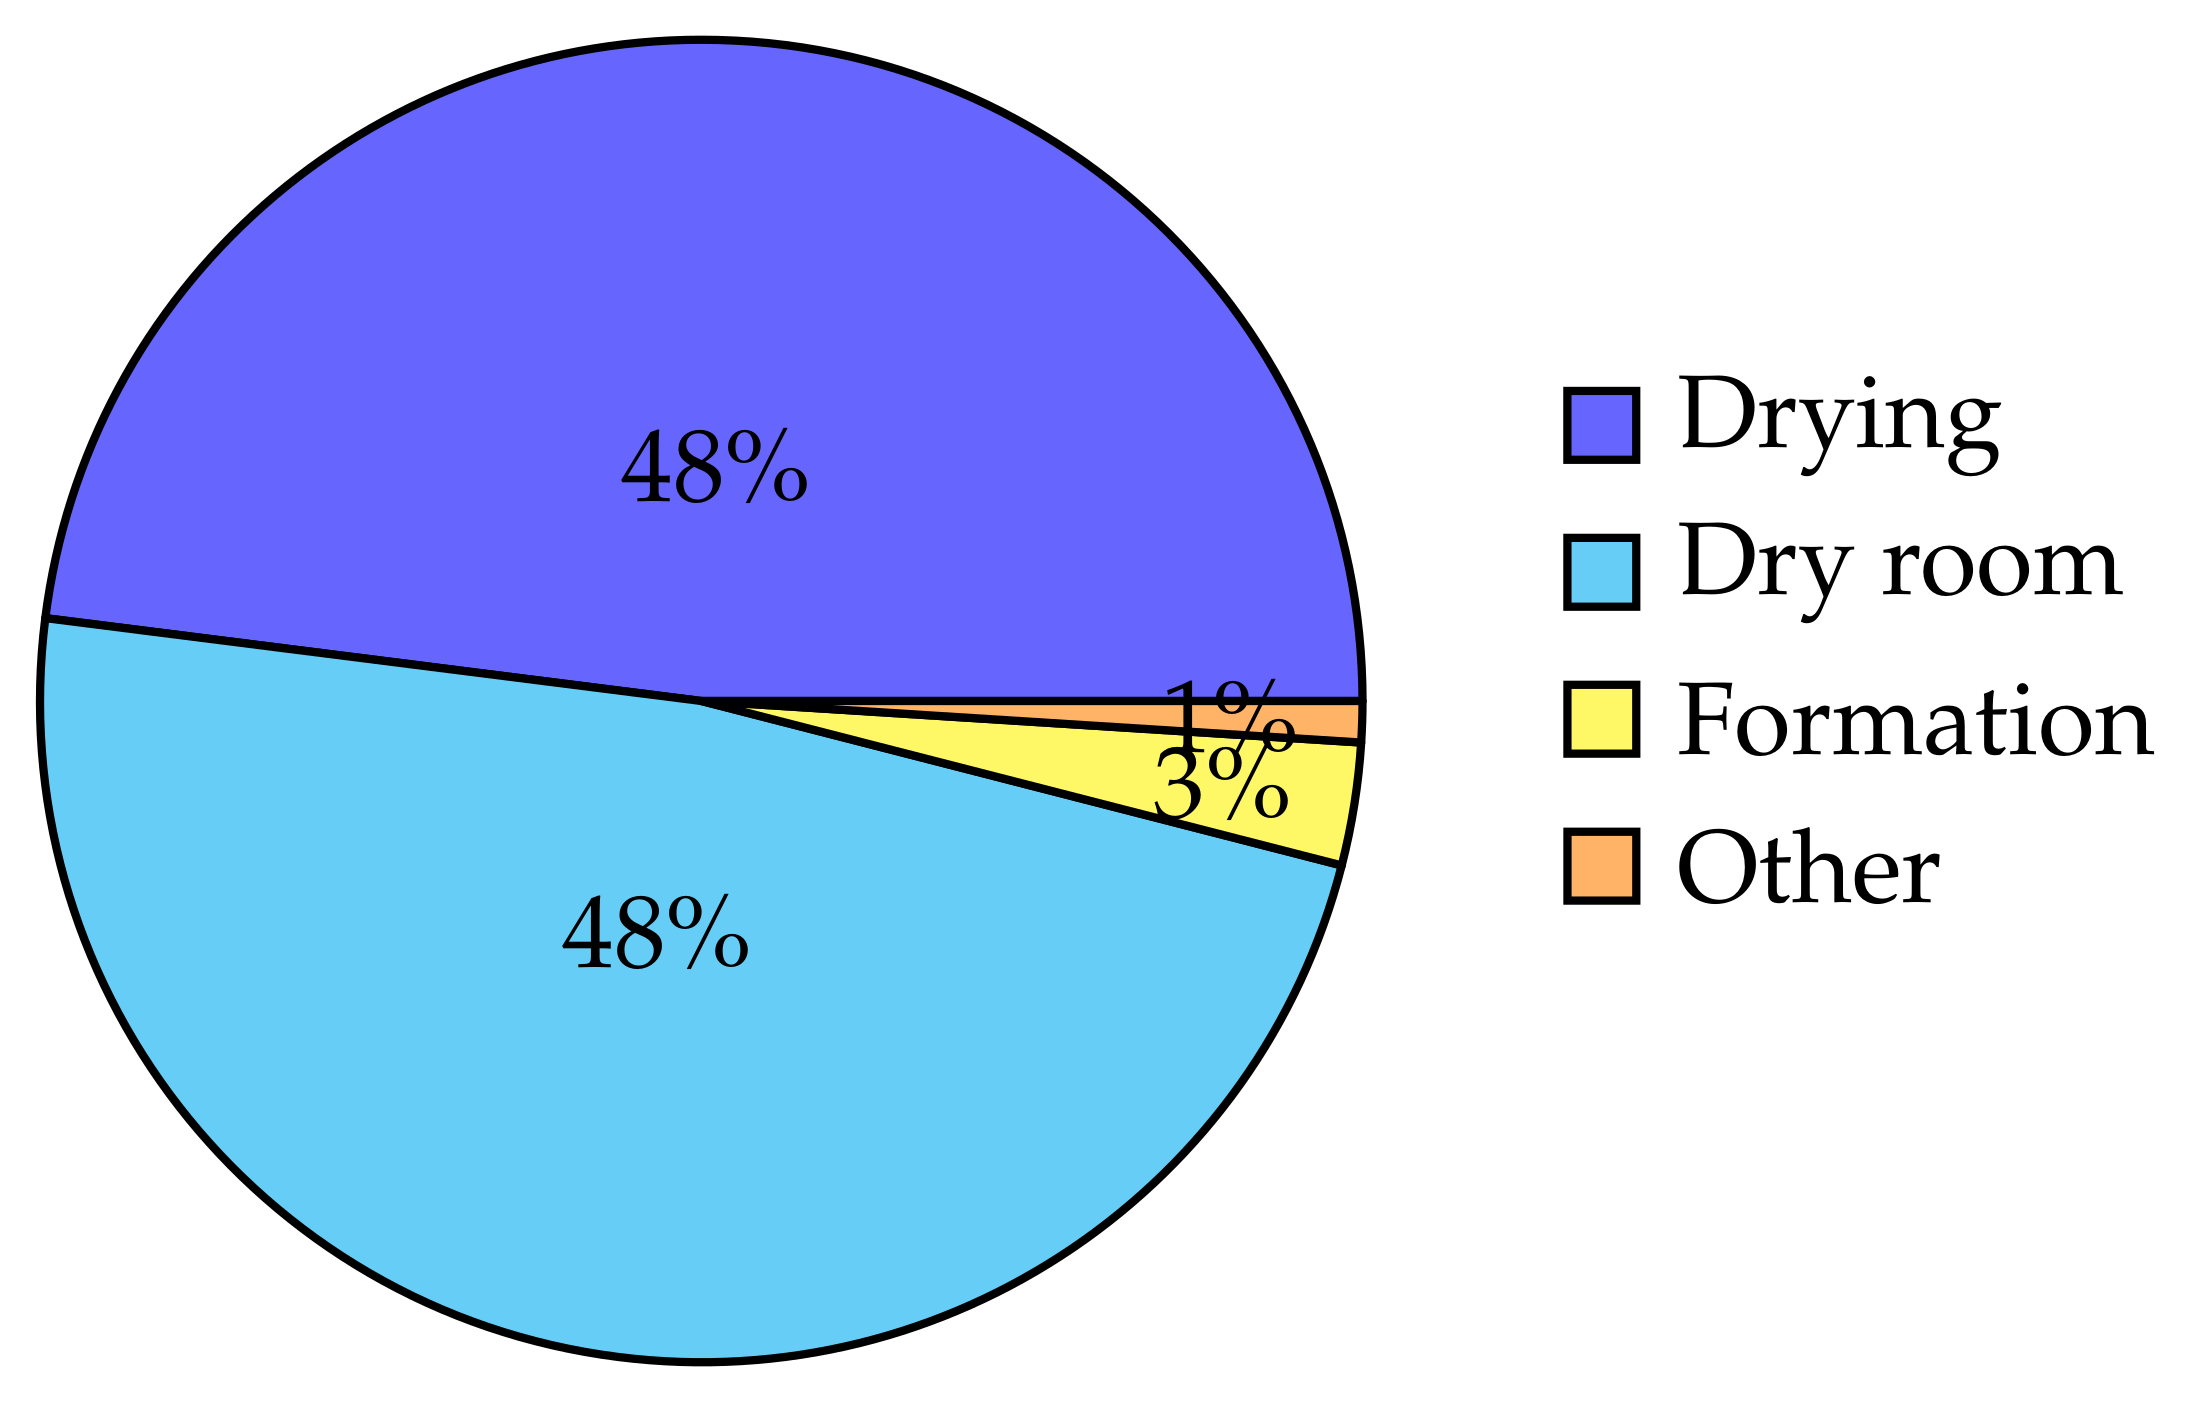
Figure 6.
The recorded values for energy consumption for different annual plant capacities. The ‘*’ values are only for electricity consumption and the box plot represents the distribution of the model results where the ‘+’ is considered to be an outlier. The red dashed line represents the mean value of the model results.
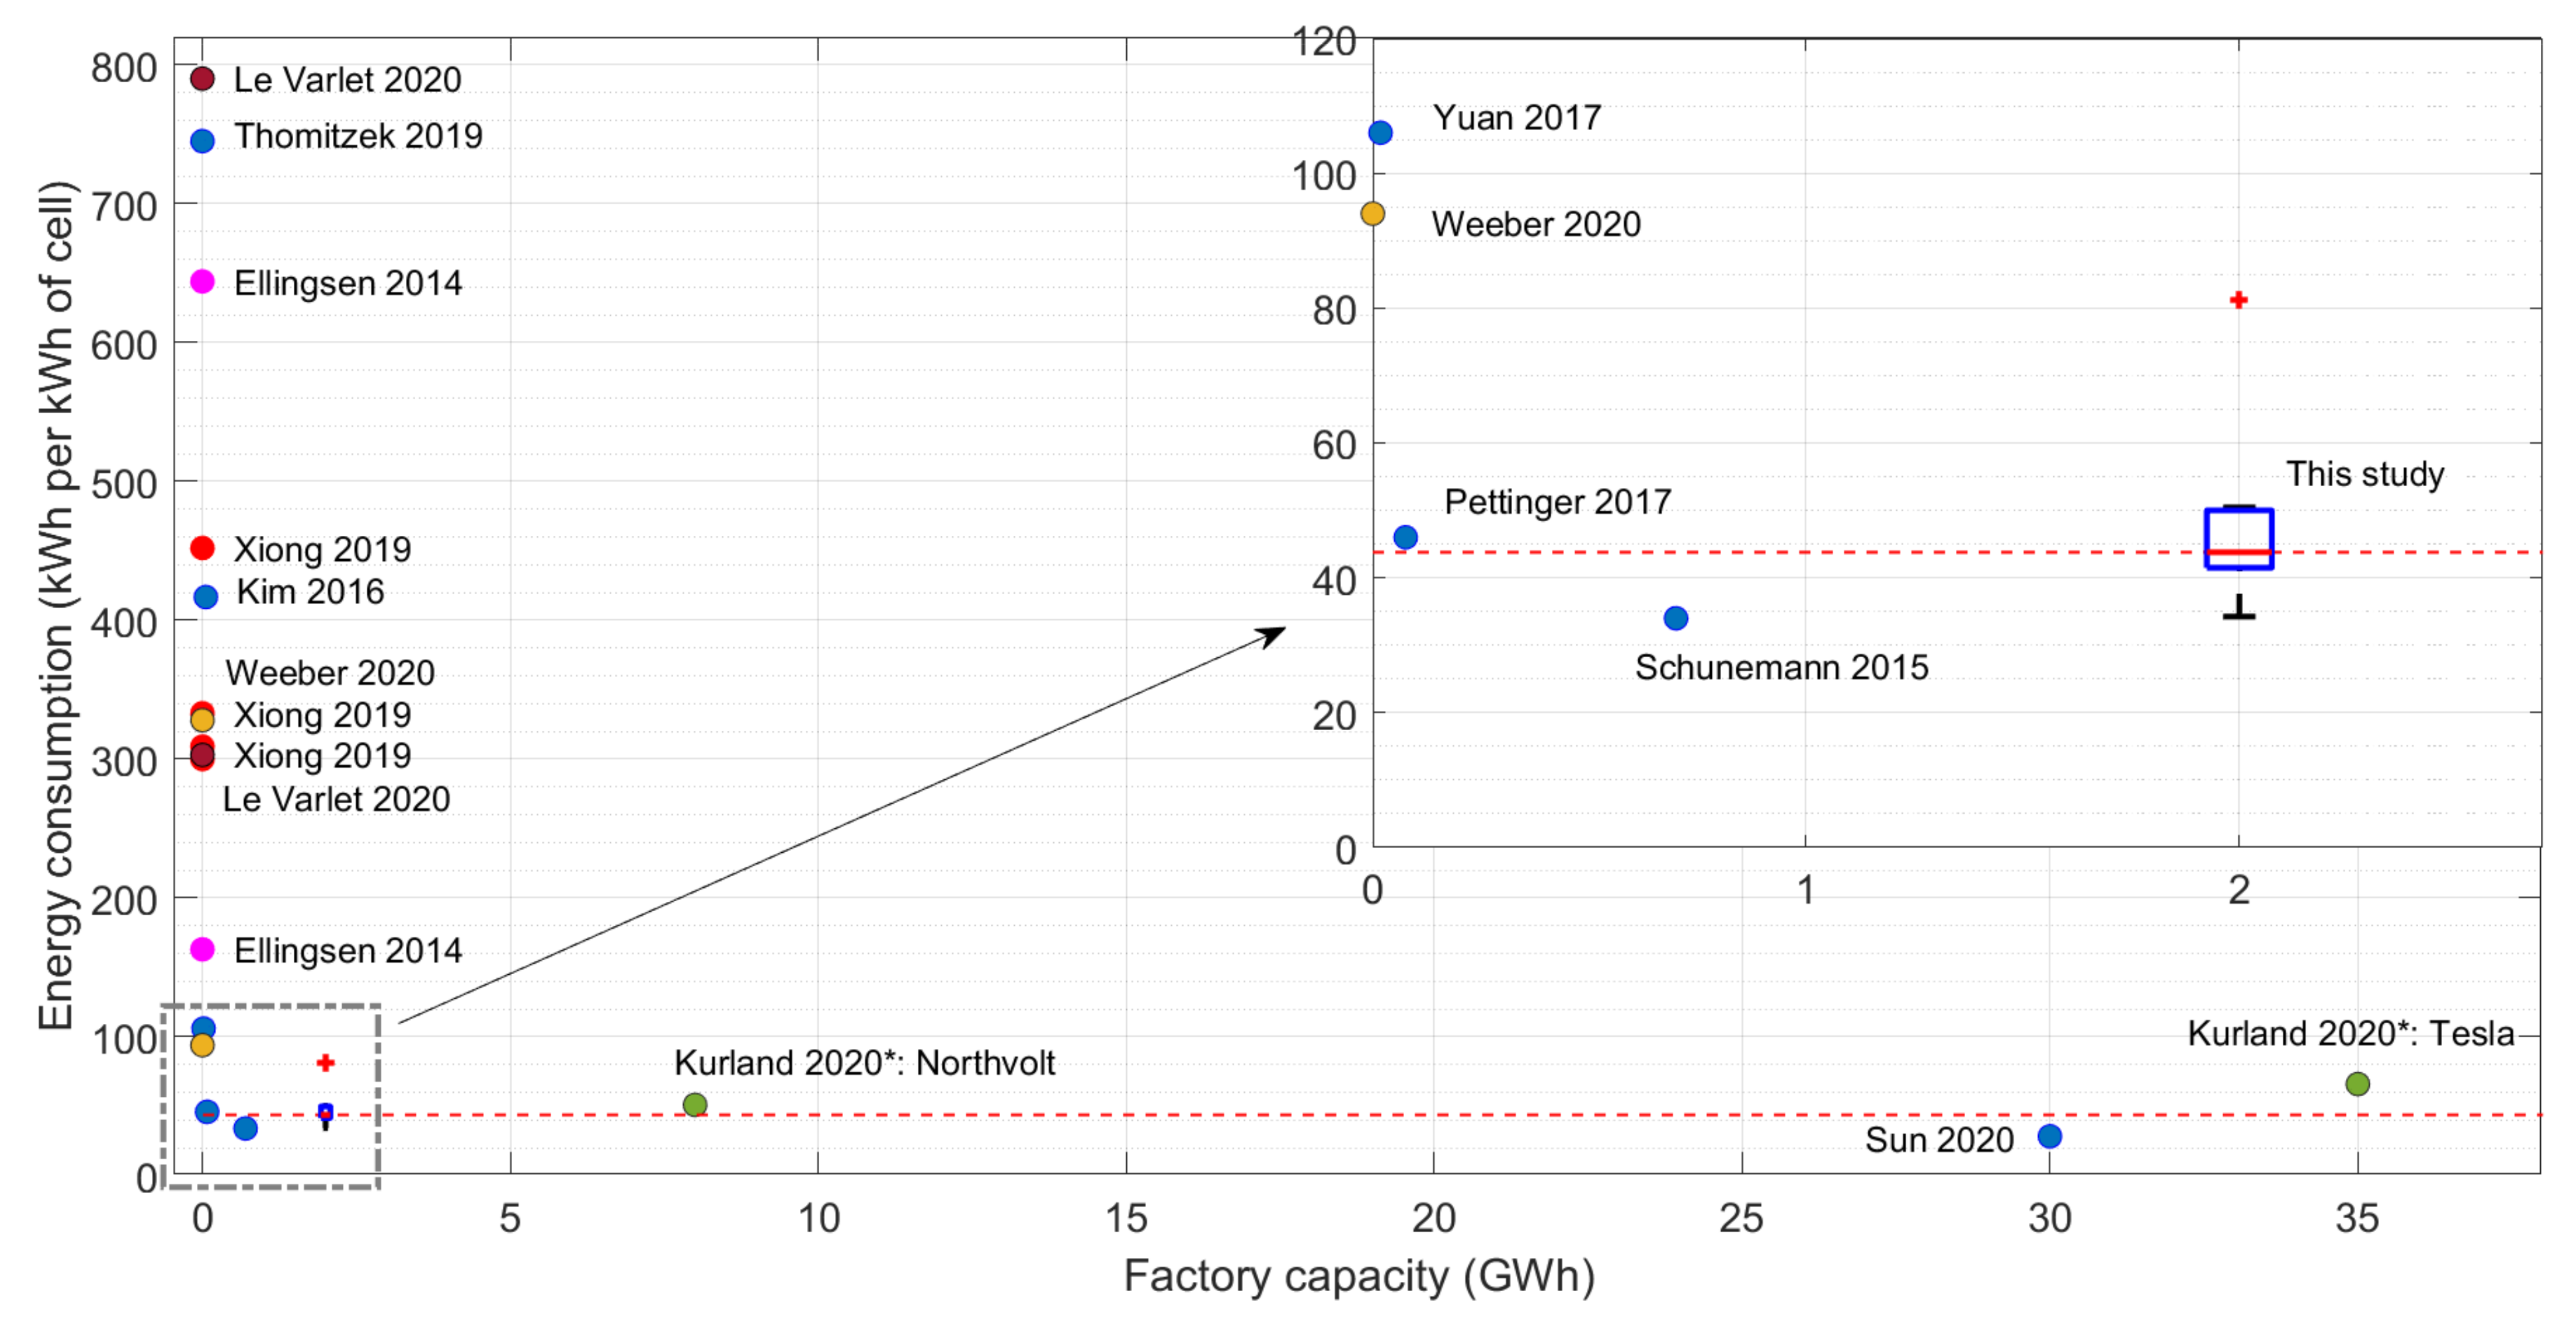
Figure 7.
The energy breakdown for different chemistries.
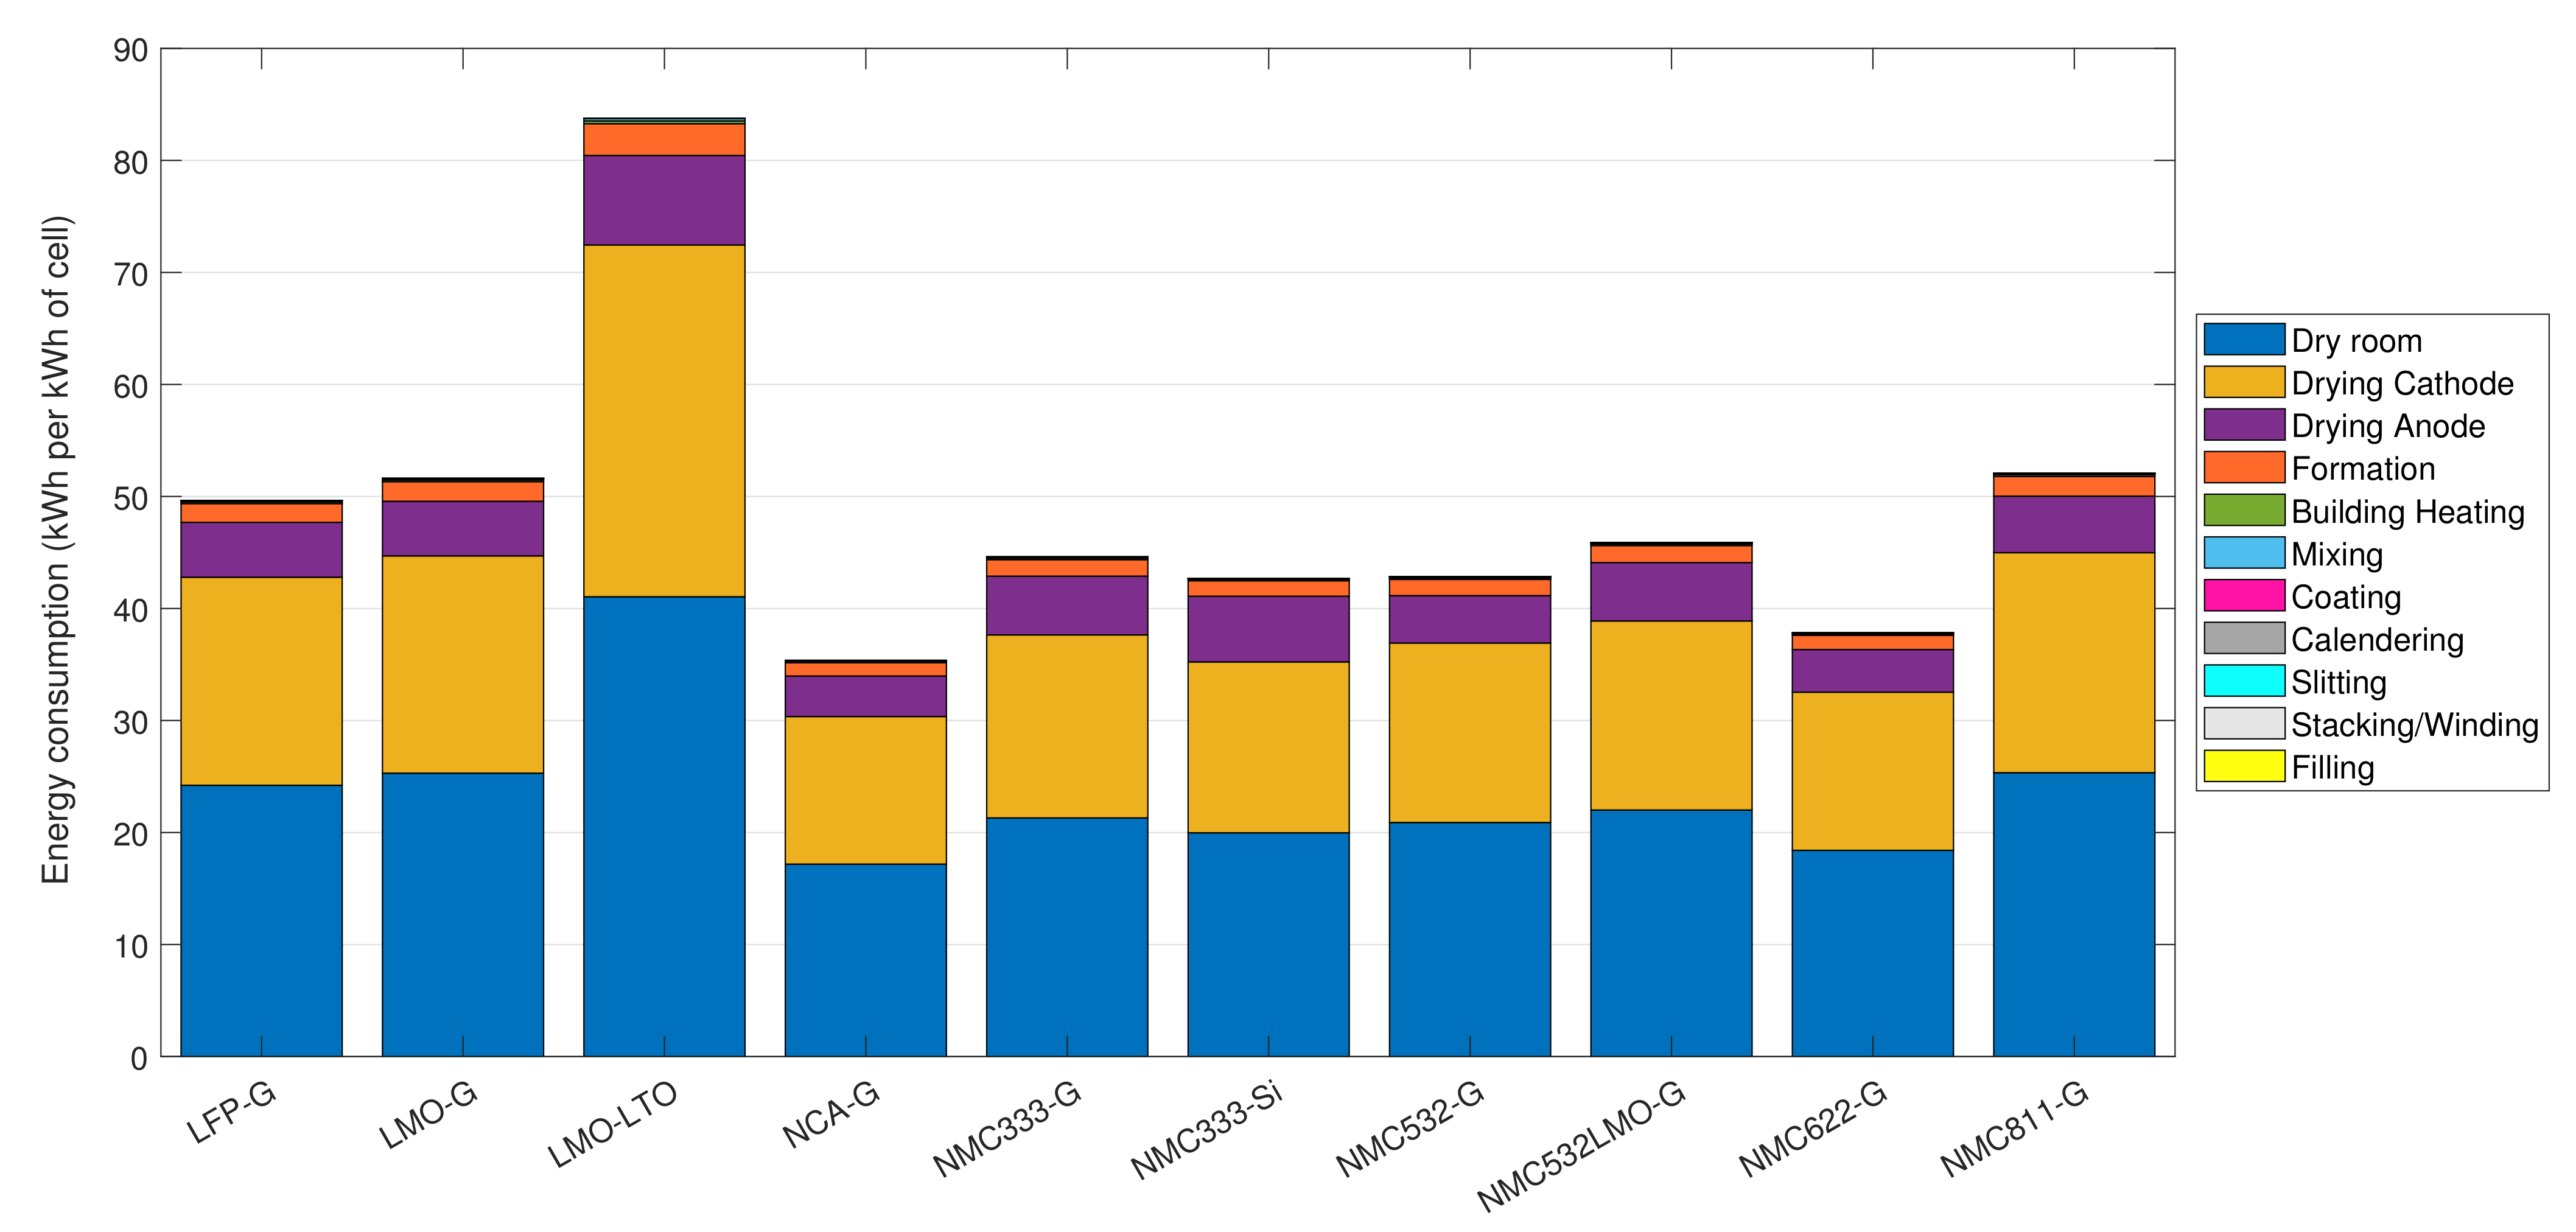
Figure 8.
The distributions of total energy usage for different process parameter changes in mixing, drying and formation processes and in dry room.
Figure 8.
The distributions of total energy usage for different process parameter changes in mixing, drying and formation processes and in dry room.


Table 1.
Material composition of a NMC333-G cell of 366.5 g.
| Cell Component | Electrode Component | Mass (g) | % of Produced Cell |
|---|---|---|---|
| Anode | Active material | 101.29 | 27.64 |
| Carbon | 0.00 | 0 | |
| Binder | 5.33 | 1.45 | |
| Solvent | 2.10 | - | |
| Current collector | 0.92 | 0.25 | |
| Cathode | Active material | 194.63 | 53.11 |
| Carbon | 4.05 | 1.11 | |
| Binder | 4.05 | 1.11 | |
| Solvent | 1.60 | - | |
| Current collector | 0.92 | 0.25 | |
| Separator | 0.07 | 0.02 | |
| Electrolyte | 55.20 | 15.06 |
Table 2.
Energy usage for each process step of production of a NMC333-G cell of .
| Component | Process Step | Energy | % of Total |
|---|---|---|---|
| Anode | Mixing | 0.036 | 0.081 |
| Coating | 0.008 | 0.018 | |
| Drying | 5.246 | 11.760 | |
| Calendering | 0.001 | 0.002 | |
| Slitting * | 0.0 | 0.0 | |
| Cathode | Mixing | 0.066 | 0.148 |
| Coating | 0.008 | 0.018 | |
| Drying | 16.337 | 36.620 | |
| Calendering | 0.001 | 0.002 | |
| Slitting * | 0.0 | 0.0 | |
| Cell | Winding † | 0.0 | 0.001 |
| Filling | 0.001 | 0.002 | |
| Formation | 1.473 | 3.301 | |
| Dry room | 21.305 | 47.757 | |
| Floor heating | 0.128 | 0.288 | |
| Cell | Total | 44.611 | 100.0 |
* energy 0.0003 (0.0006%); † energy 0.0005 (0.001%).
Table 3.
Battery manufacturing energy reported in different LCA and modeling studies.
| Study | Energy W h/Wh | % of Total GWP Emissions | Battery GWP (kg CO2-eq./k Wh) | Battery Type | Description |
|---|---|---|---|---|---|
| Xiong et al. [48] | 308.98 | 28.76 | 73.65 | LFP BEV | Database on base studies. Qin 300, 80, 450, and 100 vehicle batteries |
| 333.07 | 38.26 | 79.39 | LFP PHEV | ||
| 300.09 | 13.43 | 81.88 | NMC BEV | ||
| 452.06 | 21.58 | 123.34 | NMC PHEV | ||
| Kim et al. [49] | 416.67 | 45 | 64 | NMC/LMO BEV | Manufacturing data from a plant of 55 MWh. Ford Focus BEV |
| Weeber et al. [6] | 93–328 | - | 8.9–170.3 | - | Process model result. 21700-G1 cell |
| Kurland [9] | 50 | - | - | - | Predicted electricity usage for Northvolt 8 GWh plant, Sweden |
| 65 | - | - | - | Assumed electricity usage for Tesla 35 GWh plant, USA | |
| Le Varlet et al. [50] | 303.1–789.9 | 4.7–6 | 10–25 | LFP, NMC, LMO, NCA, NCO | Database on base studies. 5 residential battery chemistries |
| Qiao et al. [51] | 117.1 | 19.3 | 120.67 | NMC BEV | Database on base studies. Values for entire battery production |
| 139.6 | 20.2 | 127.75 | LFP BEV | ||
| Kallitsis et al. [3] | 173.18 | 57 | 102.43 | NMC333-SiG | Database on base studies. Values for electricity only. |
| 154.15 | 56 | 89.71 | NMC622-SiG | ||
| 134.24 | 56 | 78.57 | NMC811-SiG | ||
| Marques et al. [52] | 281.3 | 4.8 | 69.16 | LMO | Database on base studies. Values for manufacturing in the European Union. |
| 846.1 | 13.3 | 313.5 | LFP | ||
| Main base studies | |||||
| Ellingsen et al. [5] | 162.8–643.9 | 62 | 107–424 | NMC BEV | Monthly electricity usage of a plant, lower value and average value is given. dry room energy is dominated. |
| Notter et al. [4] | 1.07 | 1.7 | 1.14 | LMO BEV | Author’s own estimates |
| Dunn et al. [53] | 3.38 | 5.4 | 2.62 | LMO BEV | Extrapolated for industrial scale using measurements from a research facility |
| Majeau-Bettez et al. [54] | 101.2–164.2 | 27.6 | 54.5–87.5 | NMC BEV, PHEV | Top-down approach |
Table 4.
Reported plant data on energy consumption for different process steps .
| Source | Sun et al. [7] | Dai et al. [11] | Schuneman [12] (cited in [8]) | Pettinger and Dong [13] | Yuan et al. [14] | Thomitzek et al. [8] | |
|---|---|---|---|---|---|---|---|
| Process Step | |||||||
| Mixing | 1 | - | 0.15 | 2.64 | 0.88 | 10.5 | |
| Coating/drying | - | 15.6–19.7 | 11.44 | 15.42 | 51.20 | 133.6 | |
| Calendering | - | - | 0.15 | 5.97 | 3.04 | 20.7 | |
| Stacking | - | - | 1.17 | 5.97 | 6.16 | 1.4 | |
| Final/vacuum drying | 12.7 | - | 16.57 | 5.97 | - | 6.0 | |
| Electrolyte fillin | - | - | 0.88 | 1.53 | 4.72 | 8.7 | |
| Formation | 3 | 1.11 | 0.88 | 2.92 | 0.56 | 26.1 | |
| Dry room | * 11.7 | 17.5–26.9 | 2.56 | - | 31.20 | 448.7 | |
| Other | - | - | 0.51 | 5.56 | 8.48 | 88.9 | |
| Total | 28.4 | 34.2–47.2 | 34.31 | 45.98 | 106.24 | 744.6 | |
| Annual capacity | 30 GWh | 2 GWh | 0.7 GWh | 76 MWh | 18.2 MWh | 48 kWh | |
| Cell energy | 204 | 167 | 136 | 76 | 125 | 33 | |
| Cell type | pouch | prismatic | no data | pouch | pouch | pouch | |
| Cathode chemistry | NMC622 | NMC333 | no data | no data | LMO | no data | |
* for calendering and drying inside the dry room.
Table 5.
The range of process parameters that are used in the sensitivity analysis and the respective means and standard deviations of the output energy distributions.
Table 5.
The range of process parameters that are used in the sensitivity analysis and the respective means and standard deviations of the output energy distributions.
| Process | Parameter | Mean | Standard Deviation | Output Energy Distribution (Wh/Wh) |
|---|---|---|---|---|
| Mixing | Impeller diameter () | 0.5 | 0.125 | (multimodal distribution) |
| Mixing | Power factor | 7.0 | 1.75 | |
| Dry mixing | Impeller speed () | 17.7 | 4.425 | |
| Wet mixing | Impeller speed () | 8.8 | 2.2 | |
| Anode drying | Hot air temperature (°C) | 100.0 | 25.0 | |
| Anode drying | Drying time () | 15.0 | 3.75 | |
| Cathode drying | Hot air temperature (°C) | 100.0 | 25.0 | |
| Cathode drying | Drying time () | 65.0 | 16.25 | |
| Formation | Formation time () | 20.0 | 5.0 | (multimodal distribution) |
| Dry room | Air flow rate () | 0.4 | 0.1 | |
| Dry room | Ambient air temperature (°C) | 8.0 | 2.0 | |
| Dry room | Ambient air relative humidity (%) | 75.0 | 18.75 | |
| Dry room | Dry air dew point (°C) | −60.0 | 15.0 | |
| Dry room | Time () | 35.0 | 8.75 |
Publisher’s Note: MDPI stays neutral with regard to jurisdictional claims in published maps and institutional affiliations. |
© 2021 by the authors. Licensee MDPI, Basel, Switzerland. This article is an open access article distributed under the terms and conditions of the Creative Commons Attribution (CC BY) license (http://creativecommons.org/licenses/by/4.0/).
Share and Cite
MDPI and ACS Style
Jinasena, A.; Burheim, O.S.; Strømman, A.H. A Flexible Model for Benchmarking the Energy Usage of Automotive Lithium-Ion Battery Cell Manufacturing. Batteries 2021, 7, 14. https://0-doi-org.brum.beds.ac.uk/10.3390/batteries7010014
AMA Style
Jinasena A, Burheim OS, Strømman AH. A Flexible Model for Benchmarking the Energy Usage of Automotive Lithium-Ion Battery Cell Manufacturing. Batteries. 2021; 7(1):14. https://0-doi-org.brum.beds.ac.uk/10.3390/batteries7010014
Chicago/Turabian StyleJinasena, Asanthi, Odne Stokke Burheim, and Anders Hammer Strømman. 2021. "A Flexible Model for Benchmarking the Energy Usage of Automotive Lithium-Ion Battery Cell Manufacturing" Batteries 7, no. 1: 14. https://0-doi-org.brum.beds.ac.uk/10.3390/batteries7010014
Note that from the first issue of 2016, this journal uses article numbers instead of page numbers. See further details here.